Article

High Resolution Shoreline and Shelly Ridge Monitoring over Stormy Winter Events: A Case Study in the Megatidal Bay of Mont-Saint-Michel (France)

1
EPHE, PSL Université Paris, CNRS LETG, 35800 Dinard, France
2
UMR 228 ESPACE-DEV, CUFR de Mayotte, Dembéni 97660, Mayotte
*
Author to whom correspondence should be addressed.
J. Mar. Sci. Eng. 2019, 7(4), 97; https://doi.org/10.3390/jmse7040097
Submission received: 18 March 2019 / Revised: 29 March 2019 / Accepted: 2 April 2019 / Published: 4 April 2019
(This article belongs to the Special Issue Storm Erosion)

Abstract

:
In the current context of decadal global changes and predicted sea level rise, annual erosion is one of the most obvious indicators of threats to coastal systems. Shoreline monitoring during high energy events is therefore a crucial action to prevent and alleviate future coastal risks. However, most studies look at this on a regional issue basis with limited resolution, and with limited support from field observations. This study addresses this lack by focusing on high resolution (HR) shoreline surveys, combined with wave measurements, in the megatidal Bay of Mont-Saint-Michel. The salt marsh vegetation line and the inner margin of shelly ridges were selected as markers of the stabilized shoreline, to follow its evolution during two high energy winter events, from February 18 to 24, 2015 and from March 19 to 24, 2015, in two different study sites. A transdisciplinary methodology was adopted which included: (1) in situ wave measurements with pressure sensors, (2) topographical data acquisition using a differential GPS, and (3) in silico observations of the shoreline movements through HR aerial and satellite imageries. Our findings highlighted the positive linkage between significant wave height and erosion rate (ranging from 0 to 60.9 m), as well as the variability of coastline responses depending on the geomorphic features.

Graphical Abstract

1. Introduction

Coastal areas, worldwide, constitute a sedimentary exchange zone, provided with erosion and accretion processes, yet shaped by sedimentary cells naturally tending to balance over the long term. However, this natural balance is threatened by several factors, from anthropogenic transformations such as offshore sand extraction or artificialized shoreline [1], to the impacts of global change such as sea level rise [2], through increased storm intensities and frequencies, or river water reduction work associated with dams, resulting in sediment delivery decline [3].
Erosion processes can be considered over several scales, from hydrodynamic (short-term process) to engineering (midterm process), and geological (long-term process), depending on the origin of the erosion process, from wave erosive action to sea level rise and land subsidence.
Statistically, about 20% of the European Union’s (EU) coastlines are affected by this erosive phenomenon, which affects both rocky and loose (sandy or muddy) coasts [3].
Moreover, coastal erosion can result in the loss of several associated services ensured by coastal ecosystems; for example, the loss of protective sedimentary barriers (sand dunes, sediment deposits) and natural buffer zones reduction, leading to an increase in the risk exposure for coastal populations [4,5,6,7,8].

1.1. Previous Studies in the Bay of Mont-Saint-Michel (France)

The natural ecogeosystems of the Bay of Mont-Saint-Michel (BMSM), including dynamic shelly ridges, sandy-muddy foreshores, and extended salt marshes, have been the subject of a series of scientific studies over several years which have monitored their evolution in time and space.
The natural shelly ridges (shelly deposits/cheniers/banks), observed in the western part of the BMSM (Figure 1), have been monitored since the 1980’s, to understand their origins, formation processes [9,10], constitution [11,12], movements, and roles [13,14,15].
The research dealing with their movements across the intertidal flats [9,10,16,17] have highlighted the long-term interactions between the shelly ridges and tidal currents acting in the bay, since their formation to their present position, where they form the shoreline with the salt marsh vegetation line (Figure 1).
The rates of progression of the shelly ridges vary according to their location on the foreshore. The rate of movement of the lower intertidal area benches is estimated at several tens of meters (between 100 and 20 m/year), the ridges of the mid-tidal flat move around a few meters a year, while the progress of upper tidal flat ridges, located along the salt marsh vegetation front, amounts to tens of cm per year [9,10].
Similarly, the salt marshes of the BMSM were the focus of several studies (Figure 1), the floristic composition of the salt marshes, their surface evolution and roles (ecosystem services of regulation, provisioning, leisure, carbon sequestration) have been well studied over the last two decades [14,15,18,19,20].
A number of studies have quantified the evolution rate and dynamics of the salt marsh surface worldwide [21] and since the 1980s in the BMSM due to the patrimonial interest of the bay and the abbey of Mont-Saint-Michel (UNESCO world heritage site), which was threatened by the progradation of the vegetation toward the island (Figure 1). Even if the main part of those studies is focused on the estuarine area between La Chapelle Sainte-Anne (Western side of the Couesnon channel) and The Point of Roche Torin (Eastern side) (Figure 1) [10,22,23,24], which is the most developed salt marsh area of the bay, we can identify some trends in the dynamics of the salt marsh development in the bay.
Thus, remembering that the surface of the shore doubled between 1947 and 1996 in the sector of La Chapelle Sainte-Anne [10], the annual mean evolution rates observed by [9,22,23], respectively, of 20 m/year, 10 m/year, and 9 m/year, give us a good overview of the general dynamics of the salt marshes in the bay, which has not stopped his seaward extension since the end of the XIXth century [23].
However, despite this general dynamic of salt marsh extension, [9] noted some periodic erosion movement of the vegetation front in the neighborhood of the Dol Marsh draining channels (Guyoult/Couesnon channel); erosion which can potentially reach 20 m per year (Figure 1).

1.2. Aim of the Study
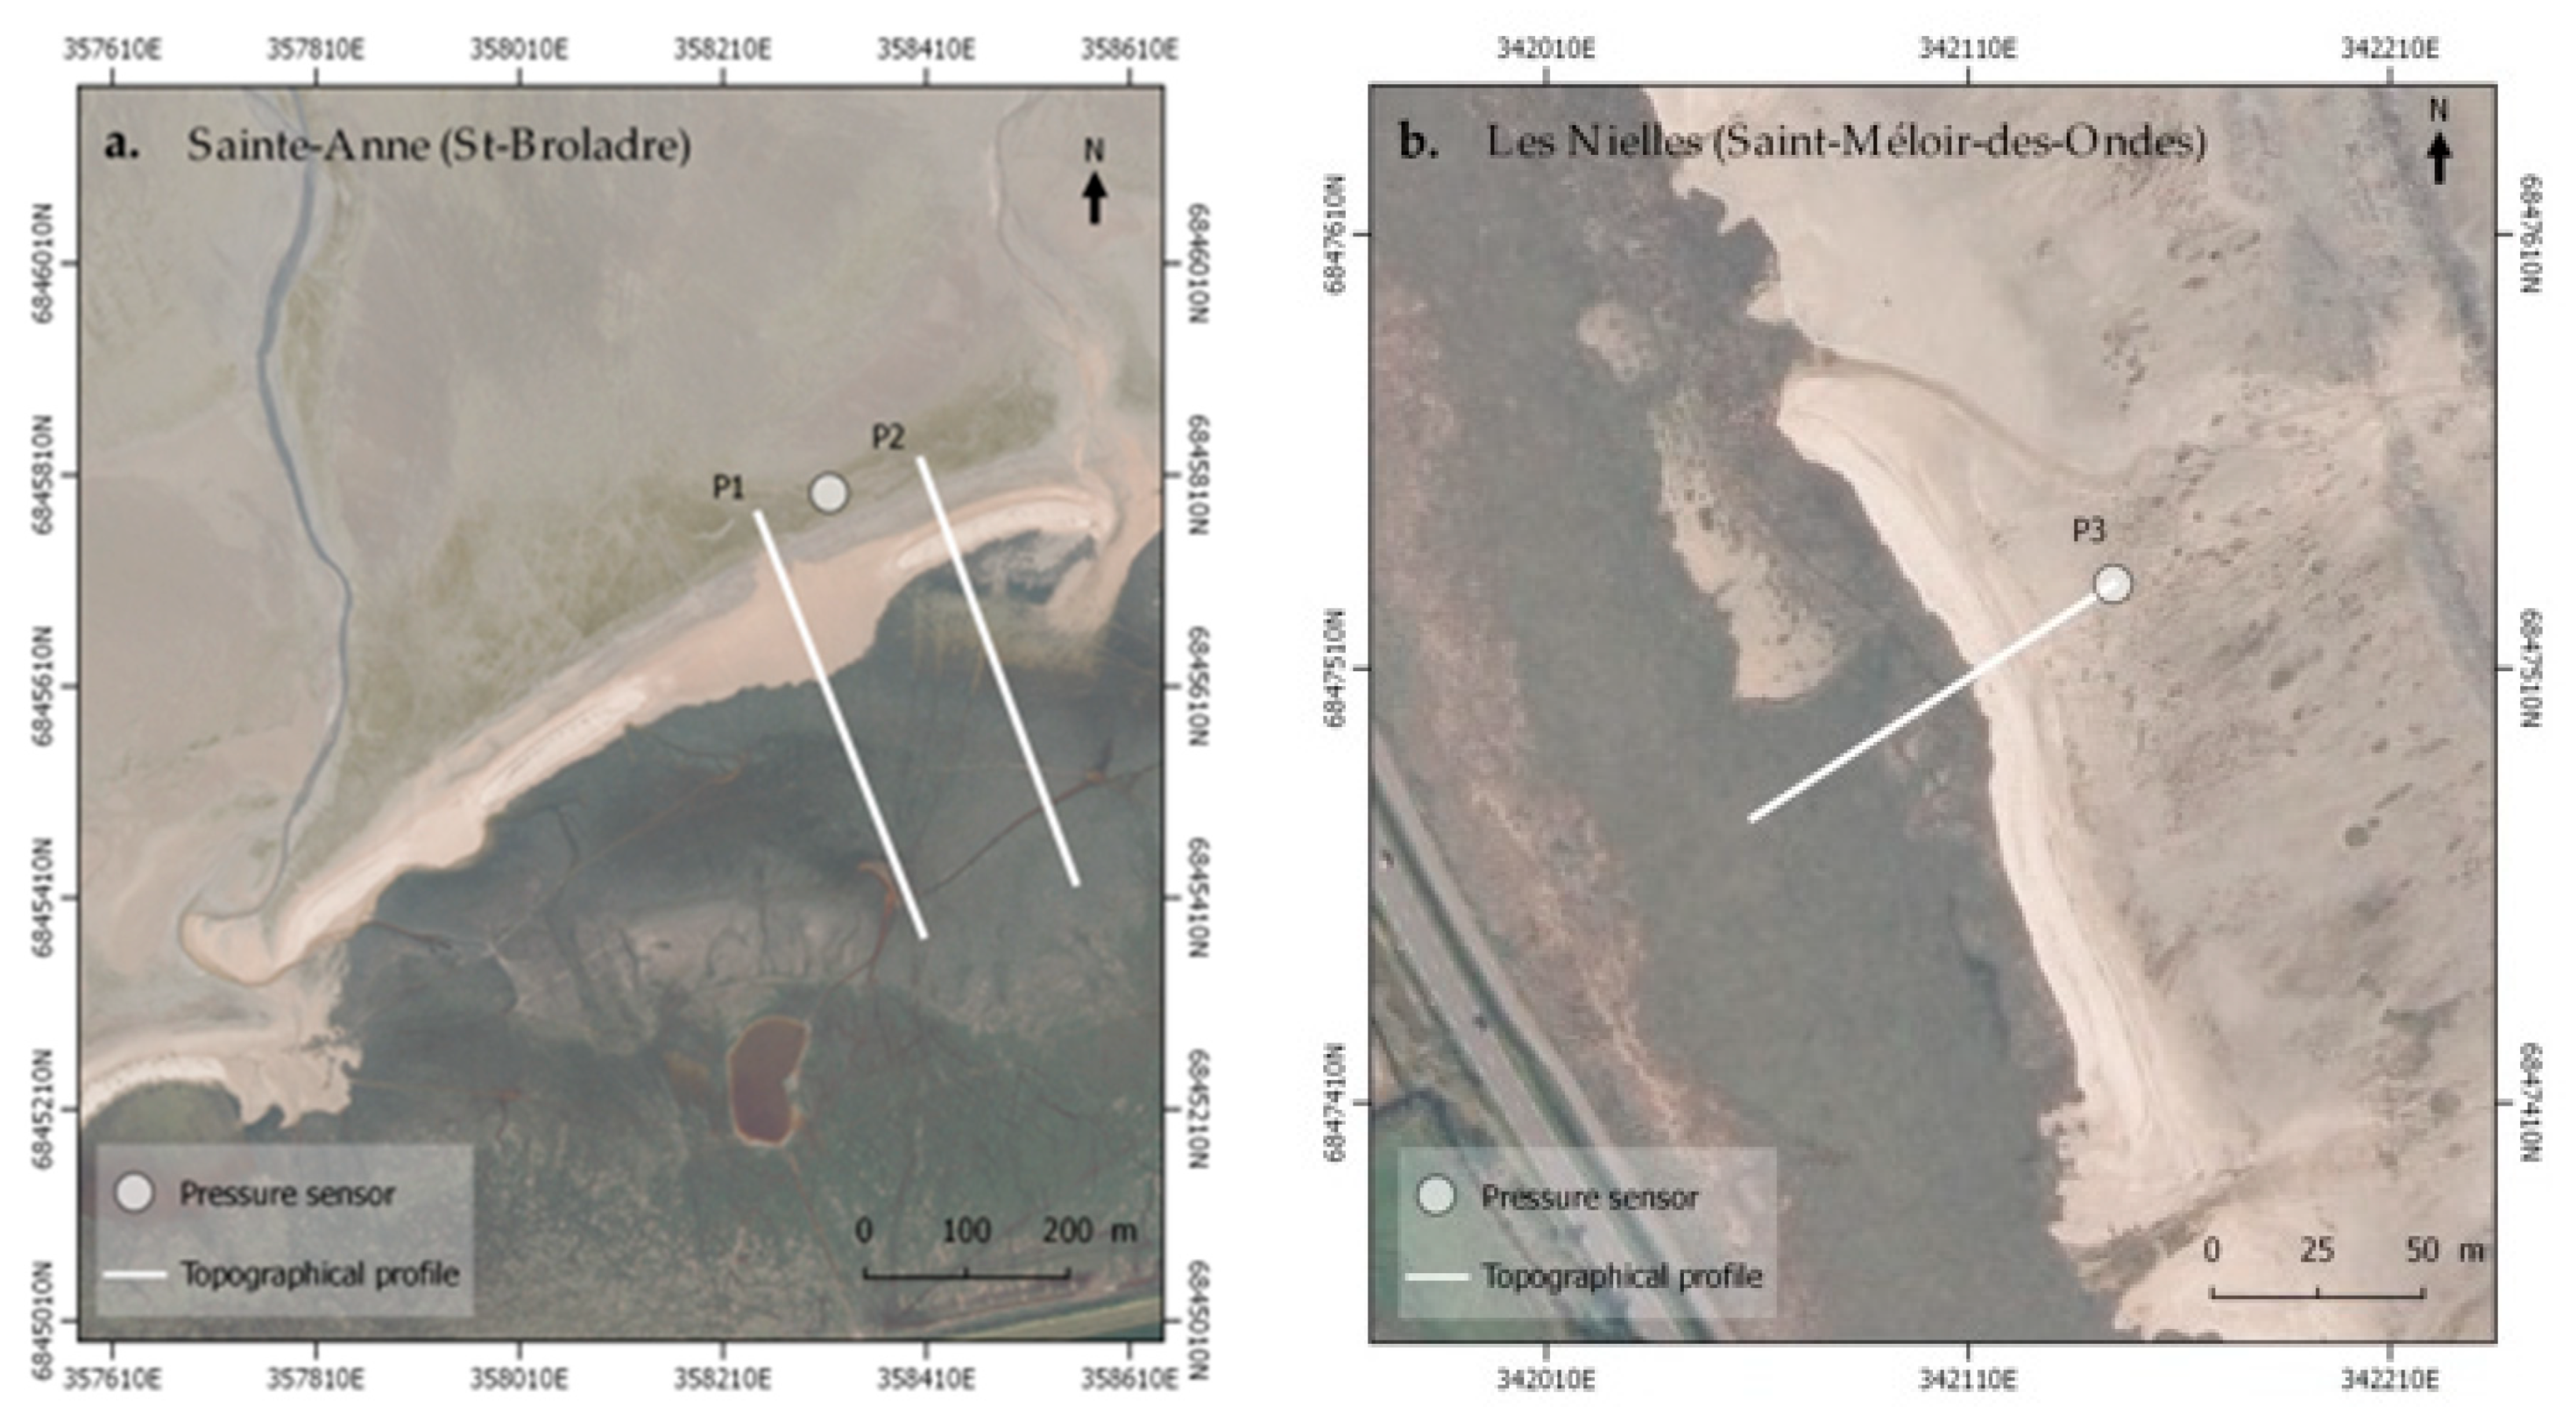
The research, carried out previously, has highlighted the medium- and long-term dynamics experienced by shelly ridges as well as salt marshes, on a large scale. Nevertheless, we actually have little information on the periodic responses of these natural ecogeosystems under storm surge conditions and high-energy events.
The study of these shoreline responses at high spatial resolution (HR) is necessary to monitor the coastal risks, exacerbated by the sea-level rise combined with spring tides, which can lead to hazardous sea-levels. To ensure a reduction of coastal risks, the status of the various elements (natural and man-made) located in front of the coastline have to be assessed in terms of the level of protection they provide. Specifically, the health of ecosystems and the delivery of their natural services, have to be included in the sustainable decision-making process.
This work provides the first HR monitoring of local shoreline responses to winter high-energy events (18–24 February 2015 and 19–25 March 2015) using a combination of HR satellite and aerial optical imageries, in situ topographic data, and wave measurements. This experiment has been carried out on two sites: Sainte-Anne and Les Nielles (Figure 1).

2. Study Area

2.1. Overview of the Bay of Mont-Saint-Michel

The BMSM study area is located deep in the Normandy-Brittany Gulf between the Cotentin peninsula and the northern coast of Brittany called the “Emerald Coast”. This bay is subjected to a strong tidal regime, and hosts one of the world’s highest tides [25], with a tidal range of approximately 14 m, which explains why the intertidal zone extends over an area of 250 km2.
The bay is currently divided into two distinct areas:
(1)
The eastern part, which is an estuarine domain, with the junction of three rivers, La Sée, La Sélune and Couesnon channel, defining the natural border between Normandy and Brittany. The sedimentary circulation in this sector of the bay is governed by two features, the tide and river flows, correlating with the development of an important salt marsh area.
(2)
The western part corresponds to a wide embayment, characterized by large tidal flats with many shelly deposits.
The bay is bounded to the south by the dyke of the Duchess Anne, which closes the polder of the Dol marsh, at the foot of which are coastal marshes.

2.2. The Megatidal Bay Landscape

The magnitude of the BMSM tides has significantly influenced the current bay landscape. Indeed, the sedimentary domain and the distribution of the natural sedimentary structures is governed by important currents occurring in the bay.
The sediments are distributed from the coarser to the finer, from the marine domain, where the influence of the tides is the most important because of the dominant flood currents, to the estuarine domain and the western sector, where refraction and diffraction phenomena, combined with the decrease of the tide energy, explain the deposition of the fine sedimentary material.
However, some coarse deposits, such as shelly ridges or bioclastic sand banks, occur in the western part of the bay. They are easily remobilized by the currents of the bay due to the nature and shape of the sediments [12].
The weak estuarine currents, and the presence of these bioclastic banks, have allowed the development of an important coastal marsh (shore), which, to date, is a major element of the bay landscape, coincident with the tidal flat (slikke).
Accordingly, the BMSM landscape can be represented along a schematic cross-shore topographic profile (Figure 2).

3. Data Acquisition and Field Methods

3.1. Wave Measurement

3.1.1. Material

Two self-recording miniature pressure sensors, one on each study site (Figure 1 and Figure 3a,b) (NKE SP2T10; length: 12 cm; diameter: 2 cm), were used in the tidal zone in order to measure water level fluctuations and non-directional wave characteristics on both sites. They were deployed during two study periods, February 18 to 24, 2015 and March 19 to 24, 2015. They were fixed to an iron rod driven into the intertidal substrate in front of the shelly ridges/salt marshes systems (Figure 3a,b).

3.1.2. Data Processing

The instruments recorded tide- and wave-induced pressure with burst duration of 9 min every 15 min, at a frequency of acquisition of 2 Hz. The 9-min sampling frequency was chosen as a compromise between a spectrum large enough to be representative, but sufficiently short, to assure a good degree of stationarity in the macrotidal environment. Wave characteristics were obtained from the measured time series by spectral analysis using Fast Fourier Transforms. The Fourier coefficients of the free surface elevation fluctuations were obtained from corresponding coefficients computed from the pressure time series using the frequency-dependent transfer function inferred from linear theory.
Wind (speed and direction) and atmospheric pressure data were obtained from an automatic weather station (Oregon WMR 300), installed on the shoreline close to Guyoult River, located in the center of the study area. The straight distance between the weather station and each site was 7 km (Les Nielles) and 9 km (Sainte-Anne) respectively.

3.2. Shoreline Data

3.2.1. Optical Imagery Data Sources

Two different sources of imagery data were used in this spatio-temporal study: 1) the Ortholittorale V2 (Figure 4a), a 0.5 m × 0.5 m orthorectified aerial imagery provided with blue-green-red and near-infrared (BGR-IR) bands, collected at low tide by the French Environment Ministry; and 2) the orthorectified pansharpened (Gram-Schmidt) 1.5 m × 1.5 m SPOT-7 satellite imagery (Figure 4b), also provided with BGR-IR, obtained from GEOSUD (http://ids.equipex-geosud.fr/accueil).

3.2.2. Shoreline Interpretation and Digitalization

In order to quantify the shoreline and shelly ridge evolution due to the winter high-energy events in February and March 2015, the boundary between the edge of the salt marsh vegetation and the inner limit of the shelly ridges was used as an indicator of the shoreline.
This shoreline indicator can evolve in time and space depending on several factors: (1) progradation of the salt marsh area (increase) on top of the shelly ridges to seaward, which can happen in the absence of storm events; (2) erosion (decrease), due to landward movement of the shell deposit in response to the wave action during high-energy events; and (3) erosion, due to anthropogenic activity (e.g.,: arrangement of a leisure surface). This indicator remains more reliable and more easily identifiable than the boundary between the outer limit of the shelly ridges and the sandflats areas through aerial and satellite imagery.
The digitalization of the several shorelines (2014 and 2015) was conducted by a single operator and at a fixed scale (1/200) through the open-source QGIS (Free and Open source Geographic Information System) tools.
Concerning the shoreline interpretation used in this comparison work, several sources of uncertainty have to be considered: (1) image resolution (pixel size) 0.5 m × 0.5 m for the OrtholittoraleV2_2014 and 1.5 m × 1.5 m for the SPOT-7 data; and (2) SPOT-7 georeferencing (error ranging from 0.18 m to 0.85 m with an average of 0.63 m, georeferencing root mean square error, RMSE: 0.42 m).

3.3. Topographic Data

Topographic data acquisitions were conducted over 3 transects (Figure 3a,b), three times during the studied period, one before the first event (17 February 2015), the second between the two events (4 March 2015), and the third after the second event (1 April 2015), on both sites. Topographic data were collected using a differential GPS Magellan Promark 500 with errors within ±1.5 cm for distance and elevation. An uncertainty margin of 5 cm, covering both field measurement and interpolation errors/uncertainties, was applied in the treatment of the raw profile data. All surveys were referenced to a benchmark of the French National Geodetic Service (IGN 69). This topographic work allowed the shape evolution of fine-scale geomorphic structures, such as shelly ridges from an initial state to a post-event state, to be assessed.

4. Data Analysis and Results

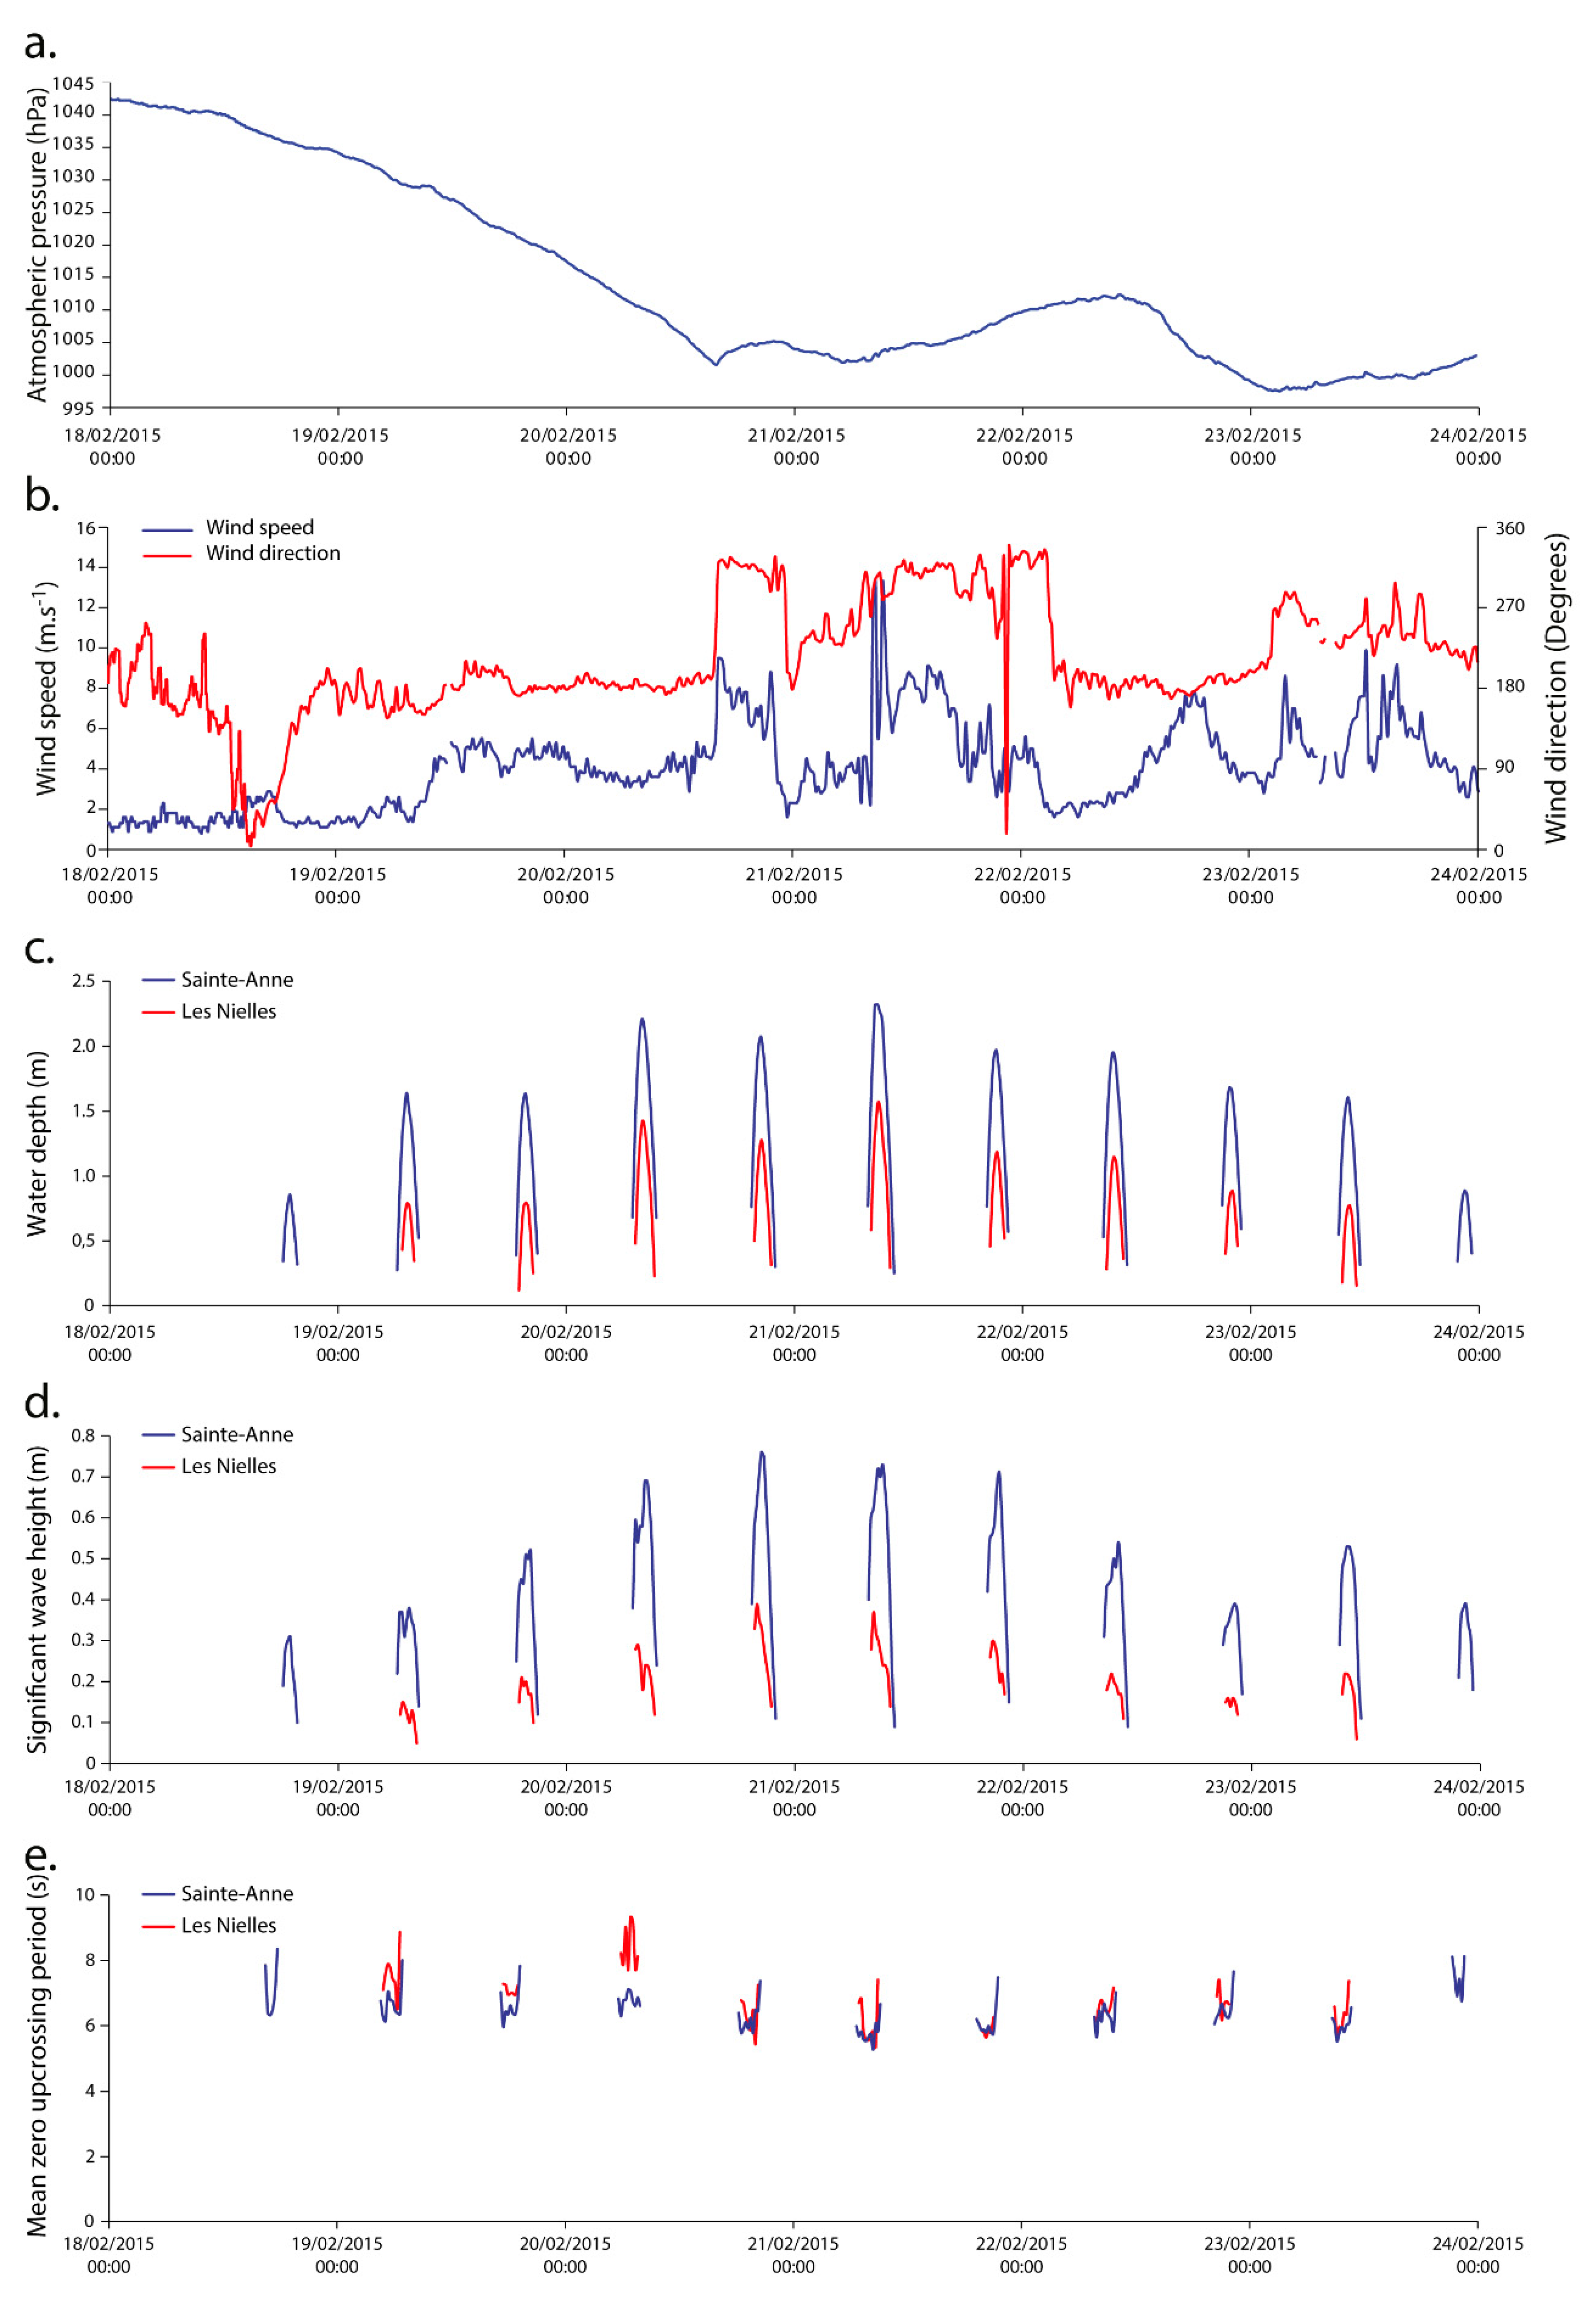
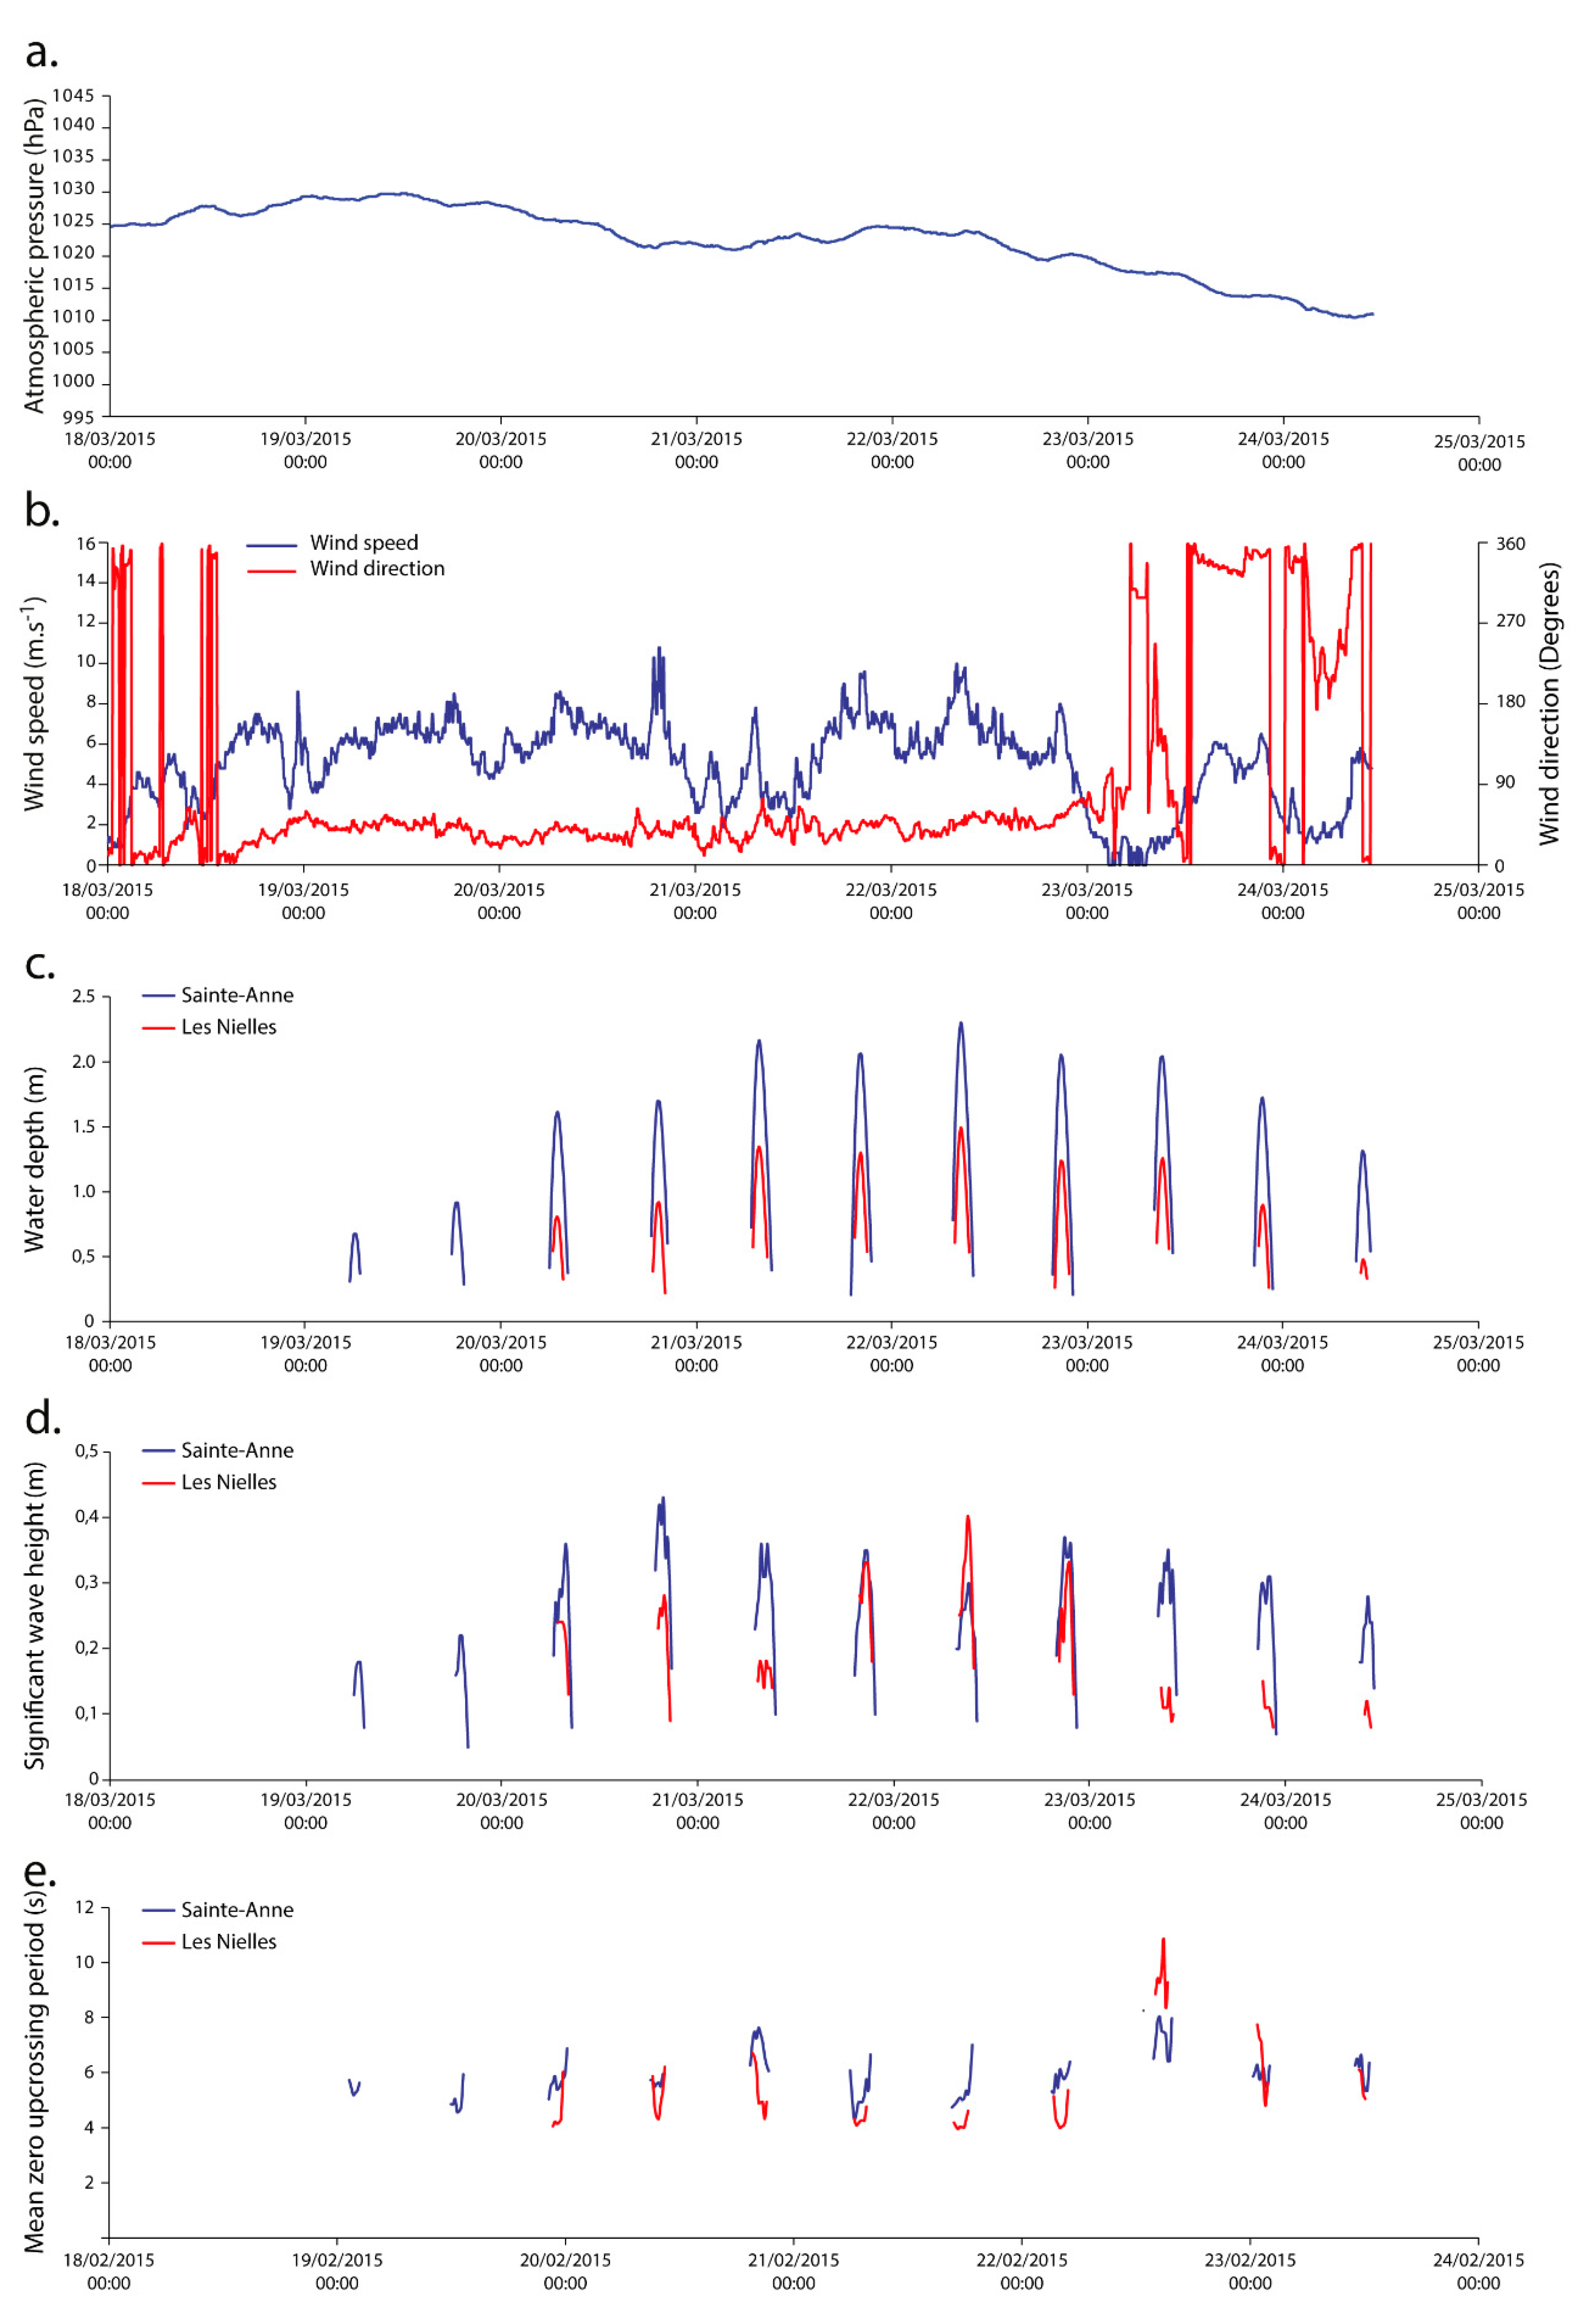
4.1. Hydrodynamic Conditions

During our study period, from February to April 2015, two high energy events were recorded.

4.1.1. Experiment 1–February 2015

Firstly, from February 18 to 24, 2015 (the main event in this study), an important depression occurred with atmospheric data pressure starting from around 1040 hPa on February 18, and progressively decreasing to under 1005 hPA on February 20, before momentarily increasing on February 22, and finally decreasing under 1000 hPa on February 23 (998.3 hPA) (Figure 5a). Western winds predominantly blew during this event (Figure 5b).
During this period, the significant height of the waves in front of the shelly ridge (Figure 5d) was of the order of 0.30 to 0.35 m at the start, increasing gradually to reach 0.76 m on February 20 under the influence of reinforcing NO sector winds. A drop in wave heights was observed on February 22 (Hs = 0.39 m) before a slight increase to 0.53 m.
Concerning Les Nielles site, the observed agitation, under the influence of meteorological conditions, shows very moderate wave height values. The significant height of the waves in front of the shelly ridge (Figure 5d), of the order of 0.15 m at the beginning, increases progressively during the recordings to reach a peak at 0.39 m on the evening of February 20 under the influence of a strengthening of NW sector winds. Agitation remains moderate (Hs = 0.37 m) on February 21 in the morning at the maximum water height reached by the sea, then regularly decreased until February 23 (Hs = 0.16 m), before slightly increasing on the last recorded tide.

4.1.2. Experiment 2–March 2015

The second event, extended from March 19 to March 24, 2015. A progressive decrease of pressure values was monitored from around 1030 hPa to approximatively 1010 hPa, with a slight increase on March 21 (Figure 6a). Wind conditions were calmer, characterized by a dominant north-east sector (Figure 6b).
Significant wave heights recorded during March were lower than in February (Figure 6d). In Sainte-Anne site, they vary between 0.18 and 0.22 m during the first two tides to reach a height of 0.43 m on March 20. They then fluctuate between 0.28 and 0.37 m until the end of the recordings.
In the Les Nielles study site, the observed agitation, under the influence of anticyclonic conditions, shows moderate wave height values. Significant wave heights recorded in front of the shelly ridge (Figure 6d) are quite variable over the duration of the measurements and follow the variations of the wind force. They are of the order of 0.20 to 0.30 m at the beginning of the season before a peak at 0.40 m on March 22 in the morning under the influence of a strengthening of NNE sector winds. A significant decrease was observed during the last three recorded tides (0.15 m) with the weakening of the winds.

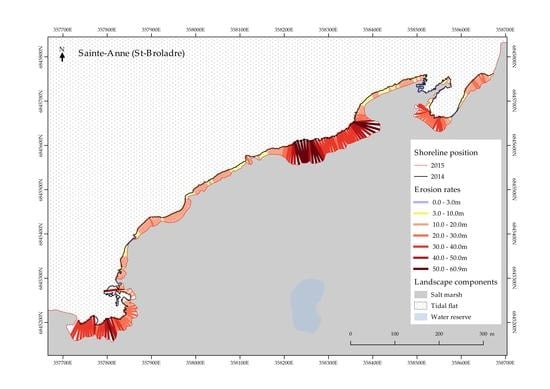
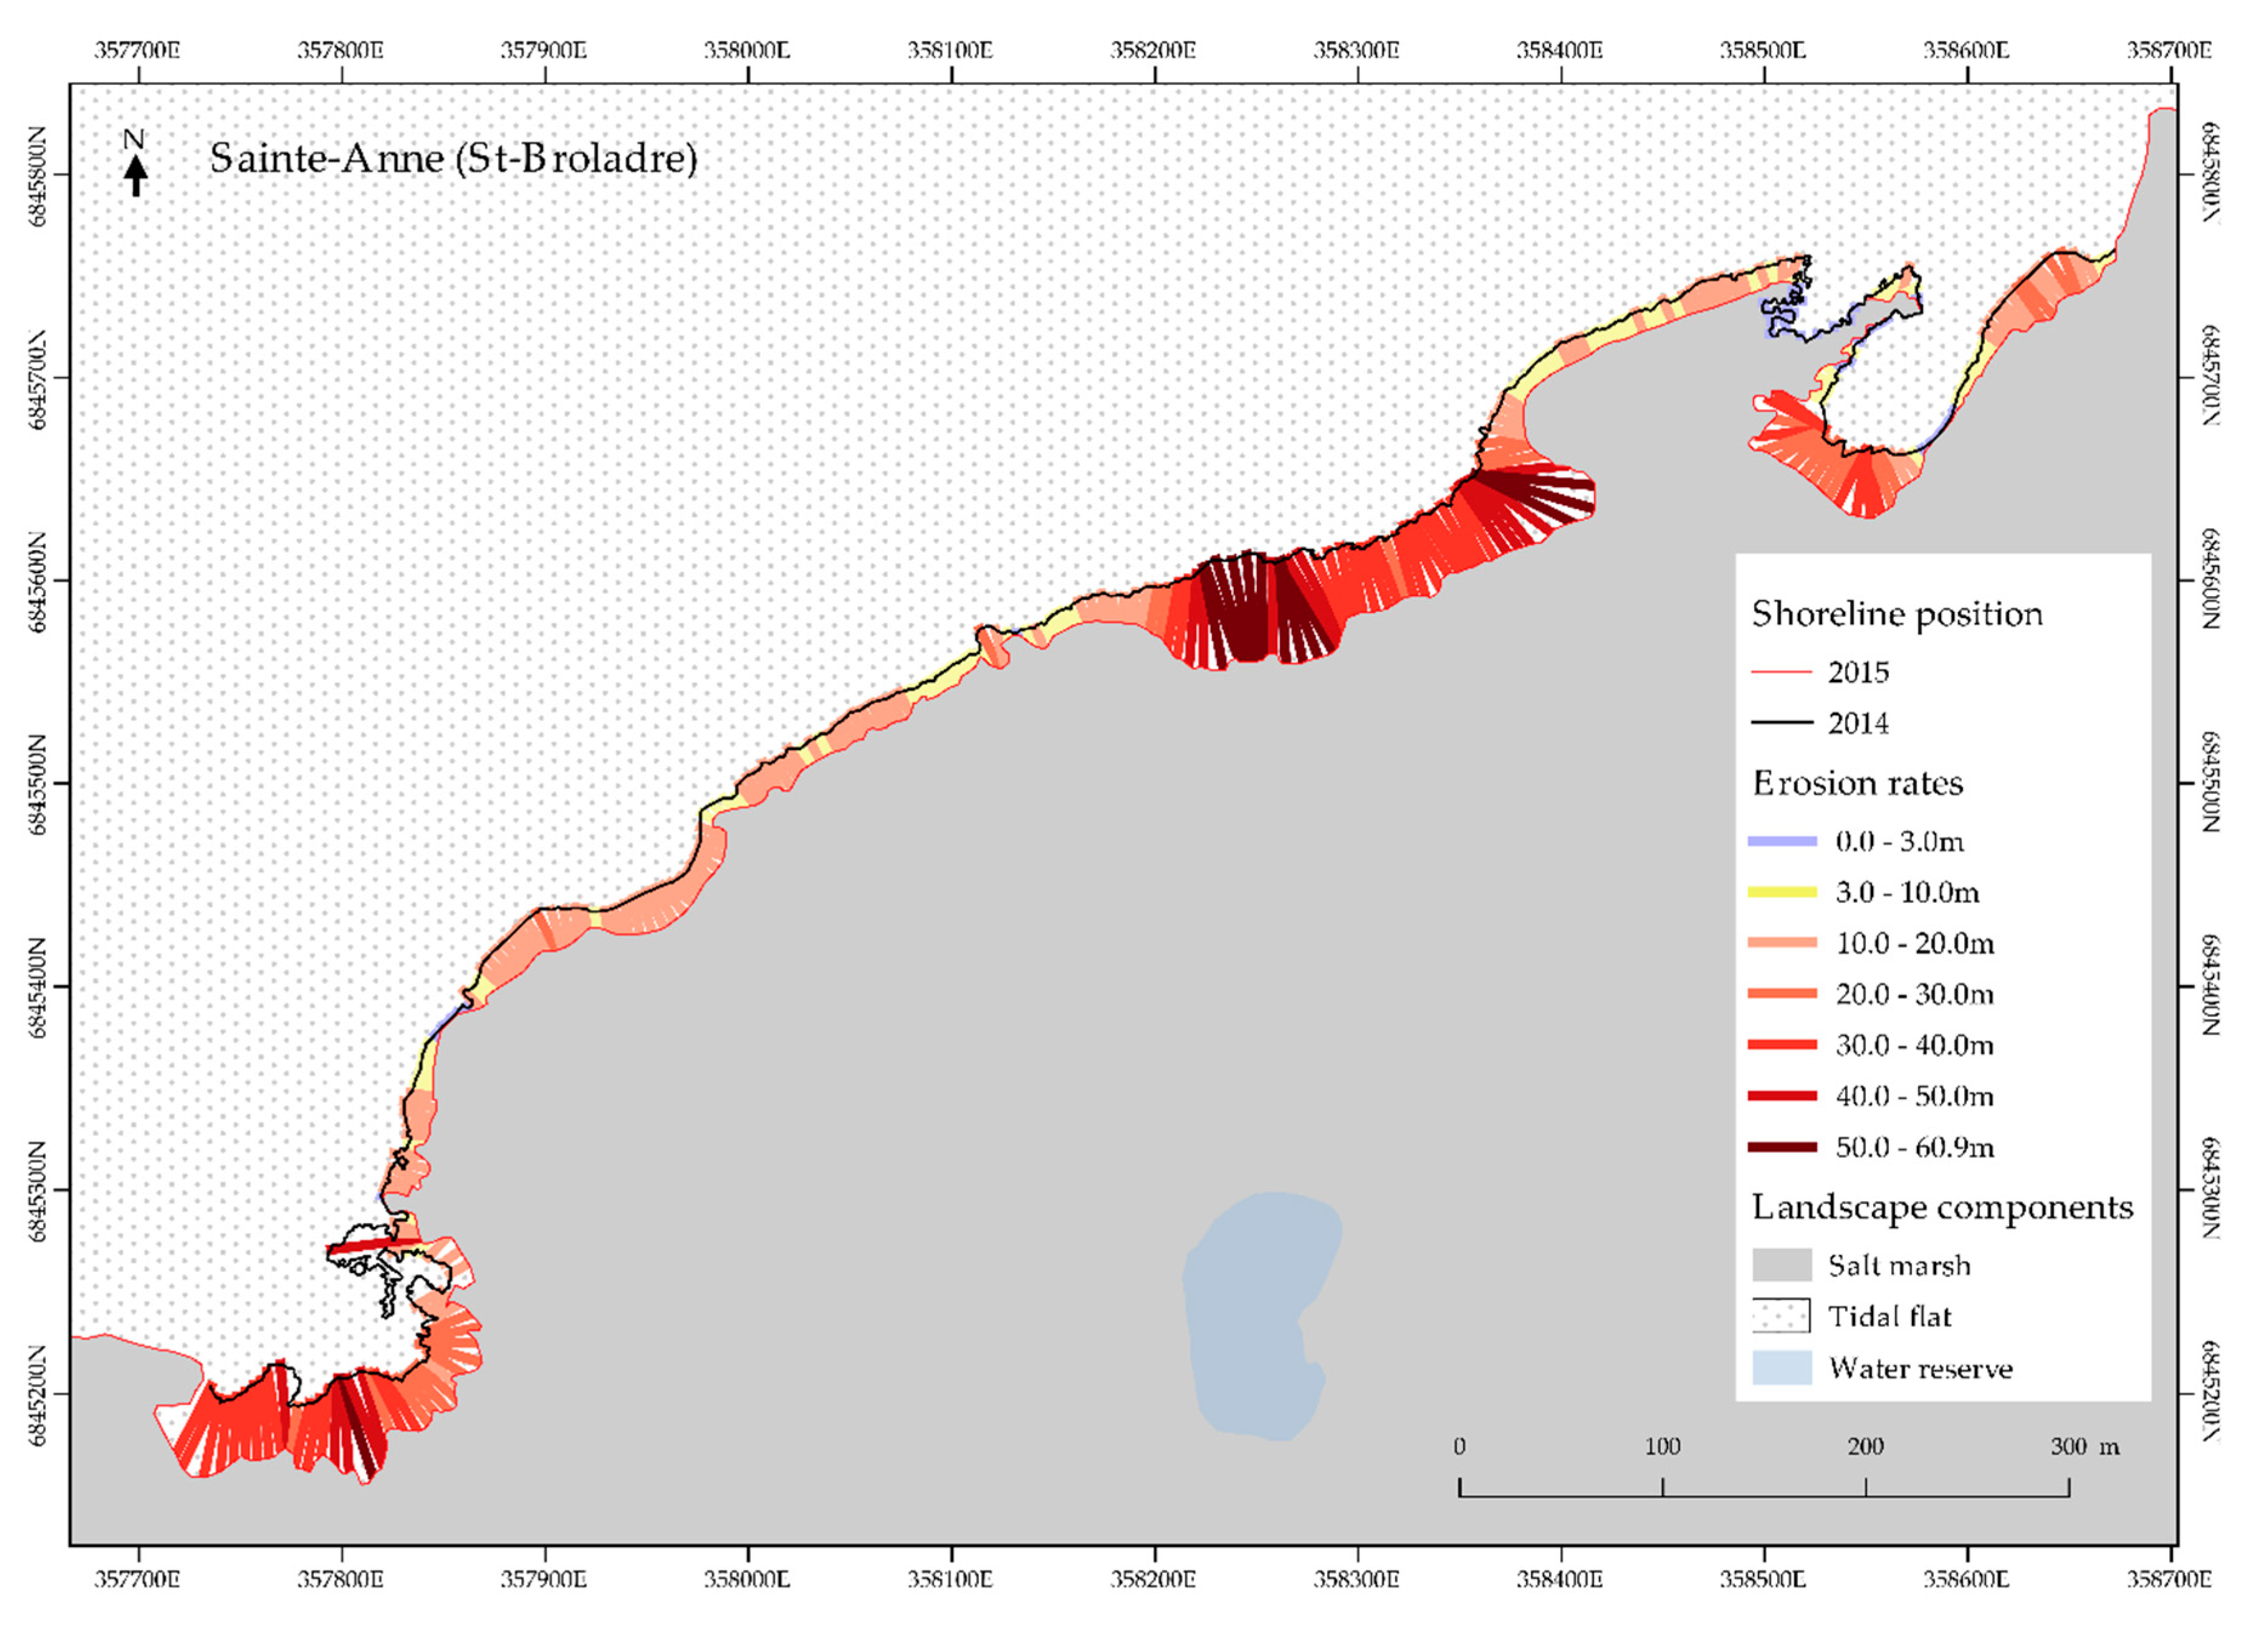
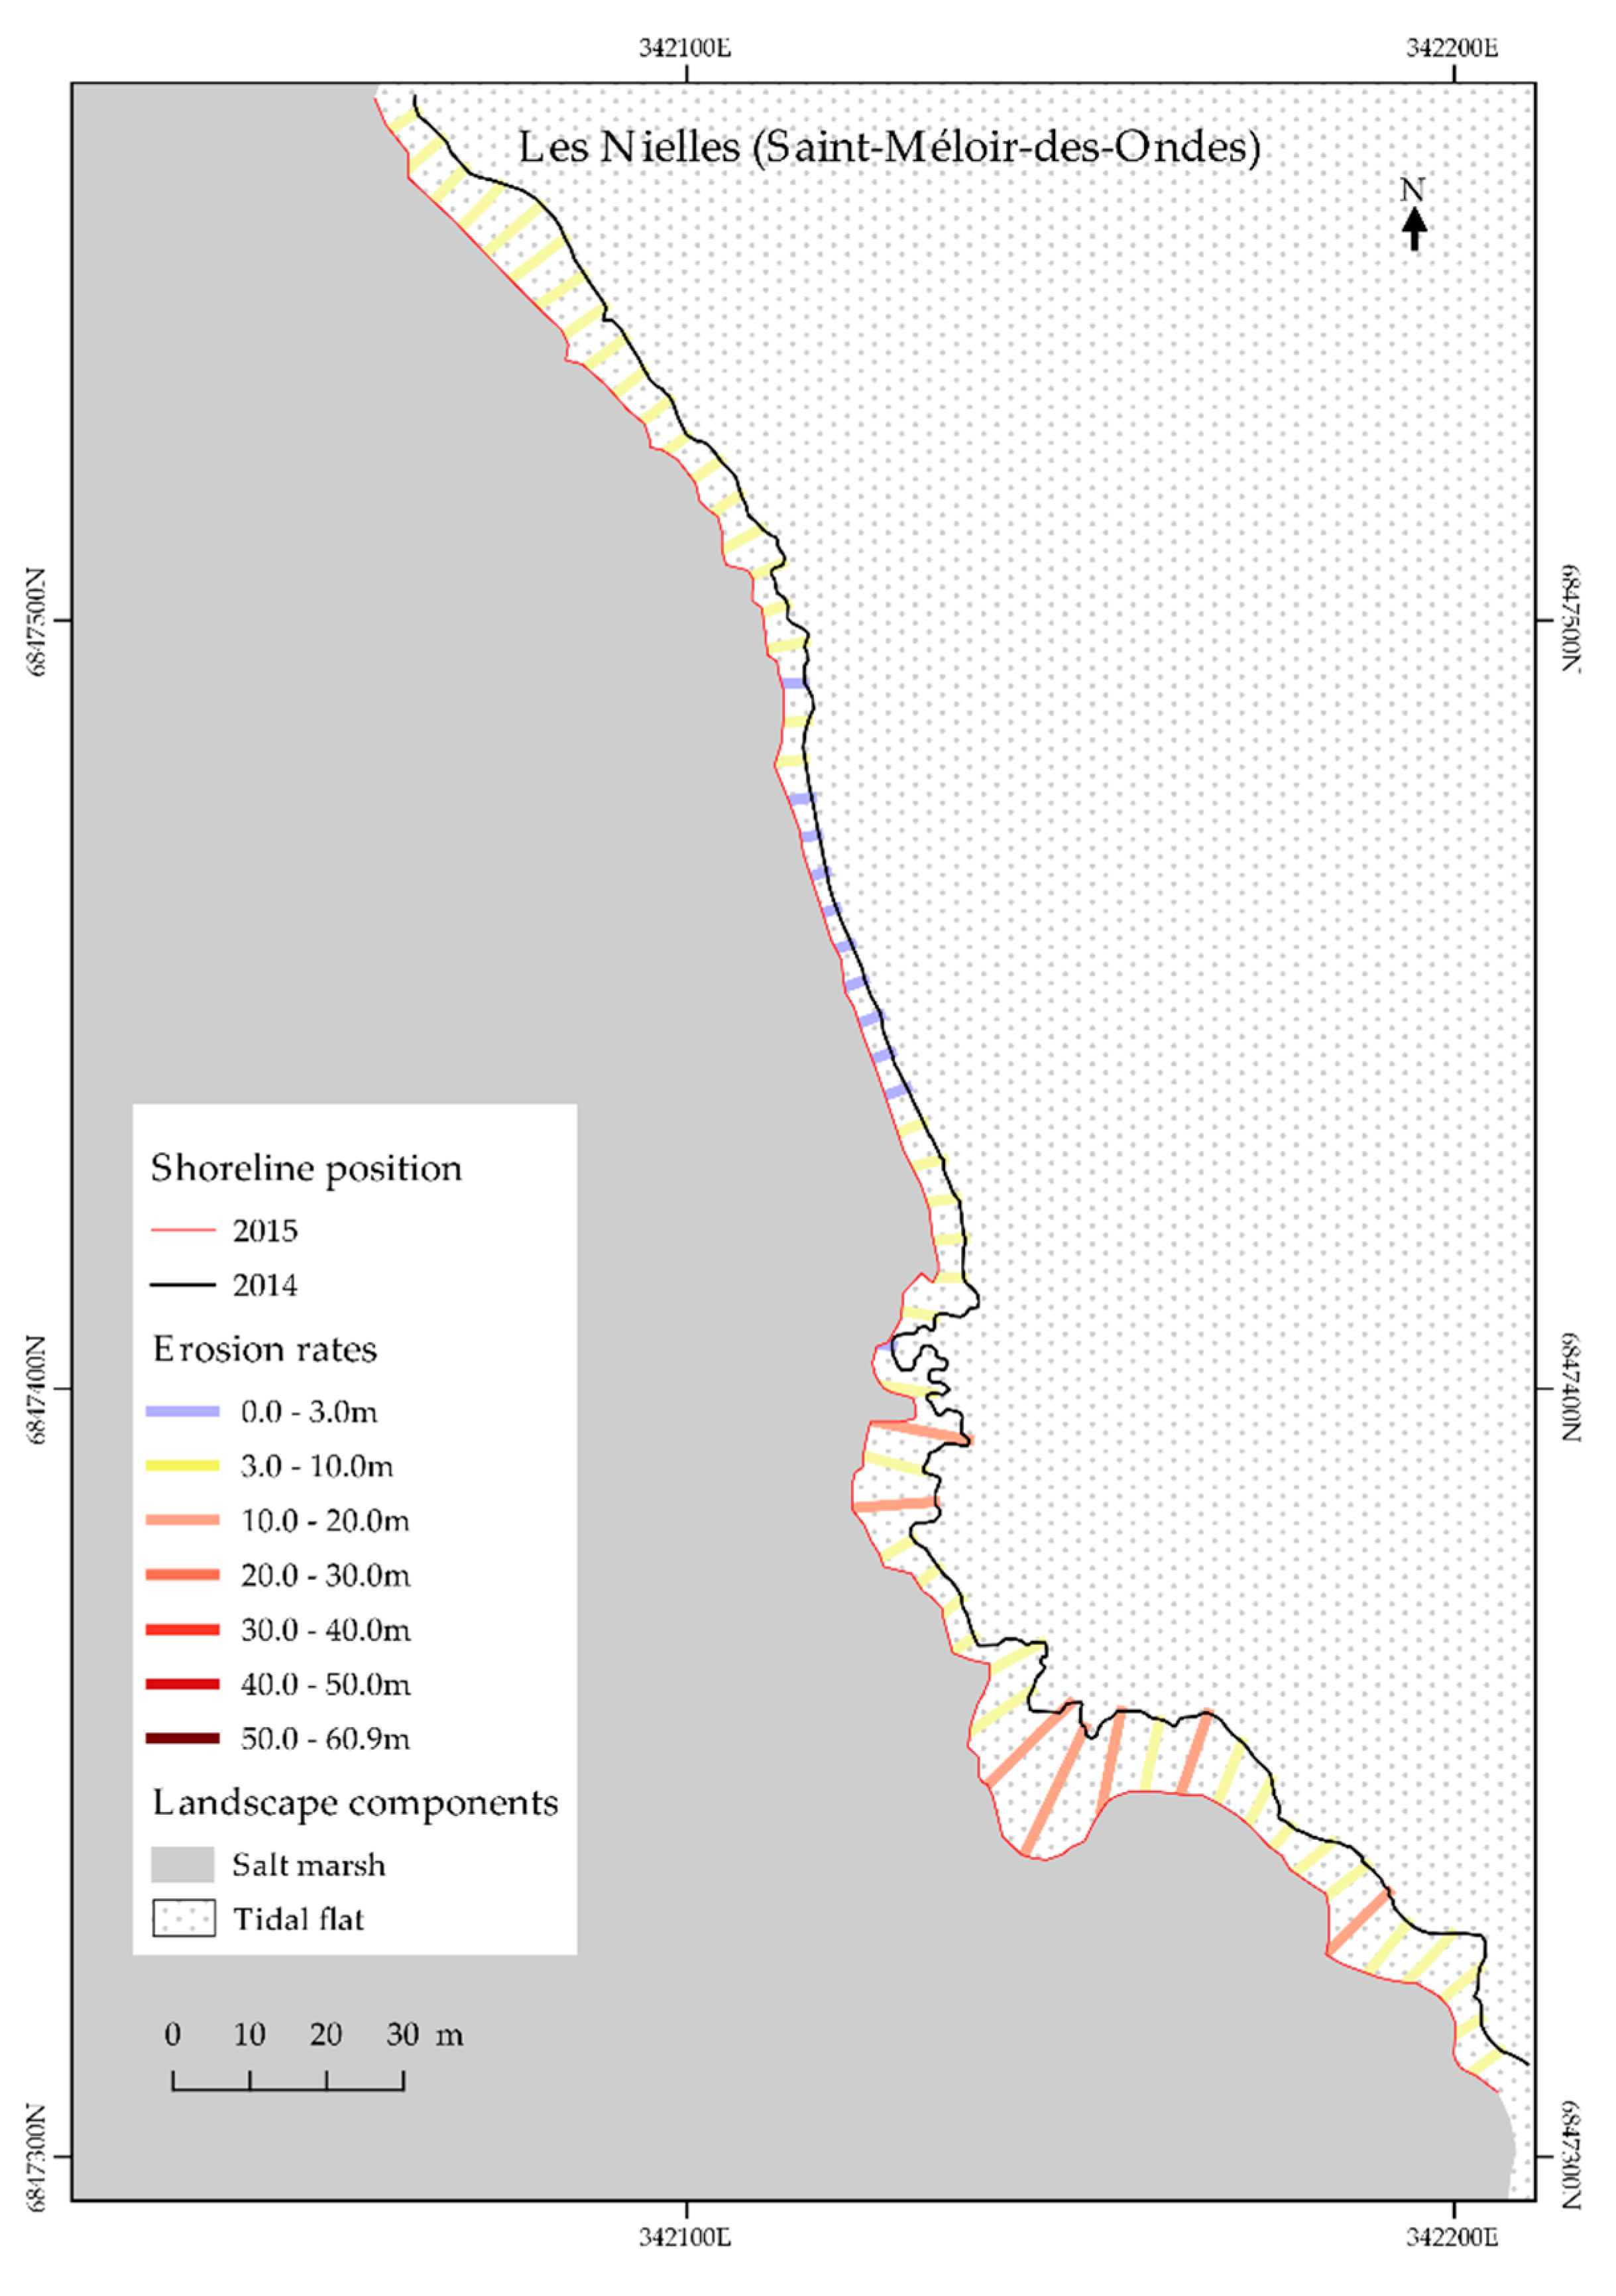
4.2. Shoreline Evolution

In order to quantify the erosion phenomenon on each study site, attributable to the February and March 2015 events, the shoreline change was determined. The measurements were made from cross-shore transects located every 5 m along the shoreline. The 5 m distance between each transects enabled a fine-scale study, with 361 control points.
Regarding descriptive statistics, an average retreat value of 16.50 m was computed between 2014 and 2015 photographs, with a maximum value of 60.9 m, a minimum value of 0 m, and a standard deviation value of 13.67 m. It is noteworthy that no progradation values were recorded on both study sites during this period.
Due to the uncertainty linked to the shoreline interpretation and digitalization, landward movement values between 0 and 3 m have been considered to be a relative stability state.
The eastern Sainte-Anne site was the most erosive site, with individual retreat values over 61 m and a mean value of 18.75 m as a result of the two storm events (Figure 7).
In comparison, the western Les Nielles site has experienced a lower but more homogeneous retreat during the study period with a minimum erosion value of 1.3 m and a maximum of 18.05 m and an average of 5.86 m (Figure 8). Les Nielles standard deviation value attained 3.37 m against 13.96 m for Sainte-Anne site.

4.3. Morphological Changes

Topographic surveys carried out three times (February 17, March 4, April 1, 2015), on three cross-shore transects over both study sites (see Figure 3a,b), combined with the photo-interpretation of shoreline monitoring, provide insights into the behaviour of the geomorphic structures facing the atmospheric and marine forcing. Assuming that the most significant event regarding wave data causes the greatest impact, it obviously happened on 18–24 February 2015, given the most important changes observed.
On the Sainte-Anne site, the P1 transect (Figure 9), which had a weakly marked profile prior to the first storm, experienced morphological changes due to the first event. Most of the changes consisted of a remobilization of the sedimentary material shaping the top of the shelly ridge landward. A spread of the sedimentary deposit was noted at the expense of the salt marsh surface.
The topographic profile P2 (Figure 9), also located at the Sainte-Anne site, exhibited a profile much more marked than P1. Contrary to the changes observed on P1, the P2 transect was characterized by a complete translation of the sedimentary structure during the February 2015 event, since it retained its morphology but underwent landward retreat. The March 2015 event had little impact on the geomorphic structure with only a superficial levelling of the shelly ridge.
Concerning the Les Nielles site, the morphological changes observed on the P3 transect (Figure 9) were similar to those observed on the P2 transect. Indeed, after the February event, a retreat of several meters of the entire geomorphic structure in the direction of the dyke of the Duchess Anne occurred. After the first storm, the ridge was flattened with the sedimentary material, thus enriching its base and pushing back the vegetation line.

5. Discussion

The various in situ measurements (topographic, hydrodynamic) and in silico monitoring (spatial monitoring) allowed us to identify the strong positive correlation between the physical characteristics of high energy events (significant wave height) and the spatial and morphological responses of the shoreline [26]. Indeed, relying on the mean values of the shoreline retreat obtained by photo-interpretation methods, the greatest retreat, observed on Sainte-Anne site (Sainte-Anne site was 18.75 m mean, Figure 7), correlated with the greatest significant wave heights (Hs max: 0.76 m). While the lowest displacement (Les Nielles site: 5.86 m mean, Figure 8), fitted with the lowest significant wave heights (Hs max: 0.37 m). An increase in the number of hydrodynamic measurement points could strongly improve the methodology so as to determine a statistical model (e.g.,: regression or non-linear equation) between significant wave height and computed erosion rate, as [27] developed for wave attenuation mapping.
Although the ridge transition magnitudes observed in the BMSM (Sainte-Anne site: 18.75 m mean, Les Nielles site: 5.86 m mean) were significantly higher than those measured in most coastal marshes (Rehoboth Bay, Delaware (US): 14–43 cm/year [28], Galveston Bay, Texas (US): 2.2 m/year [29]) the landward migration rates observed in the BMSM were quite comparable to those observed in some other coastal areas (the Greater Thames area (UK): 4–16 m/year mean), which presented some remarkable similarities with our study sites, such as the presence of shelly ridges [30]. Considering the retreat rates, we can hypothesize that the presence of shelly ridges is detrimental to the salt marshes’ surface area during high energy winter events. Nevertheless, if we envision a larger time scale, we can assume that the landward migration of the shelly ridges and their colonization by the salt marsh vegetation embodies an adaptive process to the sea level rise. Indeed, the increased supply of sediments on the marsh area during winter events results in a thickening of the marsh, thus maintaining its level above mean sea level [31], and preserving its role as a buffer zone.
Furthermore, the topographic measurements added to the shoreline retreat values, permitted to reveal the linkage between the variability of shelly ridges geomorphology and their response facing high energy events. The most significant retreat values (60.9 m) have been mainly observed around the P1 topographic transect, corresponding to the area where the shelly ridge shape was the least marked (Figure 9). This observation might be explained by the overtopping of the shelly ridges by the waves and the easier remobilization of superficial sediments, resulting in the landward spreading of the structure. The activation of the erosion process in the BMSM is primarily linked to the high tide period because of the megatidal range of the bay, entailing a very short morphogenesis period [9]. This erosive action, particularly intense, might be attributable to the wave run-up phenomenon (sum of the wave set-up and wave swash). The study of the aerial photographs confirms the punctuality of the erosive process: some ancient ridges have been colonized by vegetation in the absence of high-energy events [8], the predominance of calm periods explains the long-term marsh progradation [9,10,22,23], despite the high rates of erosion recorded as a result of high energy events.
Additional field studies, dealing with the interactions between shelly ridges’ composition [12] and shoreline movement rates, could be insightful to increase knowledge of the shoreline evolution, and to identify the most vulnerable sectors facing erosion hazards. Afterwards, the use of alternative sources of imagery data for shoreline monitoring may provide several benefits:
  • very high resolution (VHR) unmanned aerial vehicle (UAV) (pixel size: 0.1 m × 0.1 m) or WorldView-3 (pixel size: 0.3 m × 0.3 m) imageries instead of conventional aerial photographs, to reduce the shoreline digitalization uncertainty [31,32]
  • UAV imagery to easily collect data at high temporal resolution, of special interest just before and immediately after high-energy events
  • VHR WorldView-3 imagery (16-band superspectral dataset) for enhancing classification of ecogeomorphic features [33].

6. Conclusions

The use of HR monitoring methods (photo-interpretation, topographic survey using a differential GPS and wave measurements) allowed us to quantify the spatial and morphological changes of the shoreline and shelly ridges coping with stormy winter events.
Within the BMSM, these measurements made it possible to observe the variability of retreat rates depending on the composition and morphology of the study sites (Sainte-Anne site: 0 to 60.9 m with a mean value of 18.75 m, Les Nielles site: 1.3 to 18.05 m with a mean value of 5.86 m). Our findings highlighted the positive correlation between significant wave heights and retreat rates.
The underlying combination of methodologies can be advocated for coastal managers interested in integrating natural-based solutions to establish plans for their territories, through the assessment of the status of the protection ecosystem service against coastal hazards [4,8], and its use to alleviate risks within vulnerable areas.

Author Contributions

Conceptualization, A.M. and M.J.; Formal analysis, A.M. and M.J.; Investigation, A.M., M.J., A.C. and D.J.; Methodology, A.M. and M.J.; Project administration, M.J. and A.C.; Software, A.M., M.J., A.C. and D.J.; Supervision, M.J., A.C., D.J. and S.E.; Validation, M.J., A.C. and S.E.; Visualization, A.C. and D.J.; Writing—original draft, A.M.; Writing—review & editing, A.M., M.J., A.C., D.J. and S.E.

Funding

This research received no external funding.

Acknowledgments

The authors would like to thank the French Environment Ministry and GEOSUD for providing the optical imagery data, as well as Conseil Départemental d’Ille-et-Vilaine for pressure sensors purchase.

Conflicts of Interest

The authors declare no conflict of interest.

References

  1. Ferreira, J.C.; Silva, L.; Polette, M. The coastal artificialization process. Impacts and challenges for the sustainable management of the coastal cities of Santa Catarina (Brazil). J. Coast. Res. 2009, II, 1209–1213. [Google Scholar]
  2. IPCC. Climate Change 2014: Synthesis Report; Core Writing Team, Pachauri, R.K., Meyer, L.A., Eds.; Contribution of Working Groups I, II and III to the Fifth Assessment Report of the Intergovernmental Panel on Climate Change; IPCC: Geneva, Switzerland, 2014; 151p. [Google Scholar]
  3. EUROSION. Living with Coastal Erosion in Europe: Sediment and Space for Sustainability—Part IV a Guide to Coastal Erosion Management Practices in Europe: Lessons Learned; European Commission: Brussels, Belgium, 2004; 27p. [Google Scholar]
  4. Roebeling, P.C.; Costa, L.; Malgalhães-Filho, L.; Tekken, V. Ecosystem service values losses from coastal erosion in Europe: Historical trends and future projections. J. Coast. Conserv. 2013, 17, 389–395. [Google Scholar] [CrossRef]
  5. Gencarelli, R.; Johnson, B.; Kobayashi, N.; Tomasicchio, G.R. On dune erosion and breaching. In Proceedings of the 5th Coastal Structures International Conference of Coastal Structures, Venice, Italy, 2–4 June 2007. [Google Scholar]
  6. Gencarelli, R.; Tomasicchio, G.R.; Kobayashi, N.; Johnson, B. Effects of Hurricane Isabel along the North Carolina Coastline: Beach Profile Evolution and Dune Erosion. In Proceedings of the 3rd International Short Conference on Applied Coastal Research 2008, Lecce, Italy, 2–4 June 2008; pp. 200–210. [Google Scholar]
  7. D’Alessandro, F.; Tomasicchio, G.R. Wave-dune interaction in large-scale physical model tests. Coast. Eng. 2016, 116, 15–25. [Google Scholar] [CrossRef]
  8. King, S.E.; Lester, J.N. The value of salt marsh as a sea defence. Mar. Pollut. Bull. 1995, 30, 180–189. [Google Scholar] [CrossRef]
  9. Bonnot-Courtois, C.; Fournier, J.; Dréau, A. Recent morphodynamics of shell banks in the western part of the Bay of Mont-Saint-Michel (France). Géomorphologie Relief Process. Environ. 2004, 10, 65–79. [Google Scholar] [CrossRef]
  10. Bonnot-Courtois, C. Dynamique sédimentaire intertidale en baie du Mont-Saint-Michel entre évolution naturelle et aménagements. In Proceedings of the XII èmes Journées Nationales Génie Côtier, Génie Civil, Cherbourg, France, 12–14 June 2012; pp. 187–222. [Google Scholar]
  11. Weill, P.; Tessier, B.; Mouazé, D.; Bonnot-Courtois, C.; Norgeot, C. Shelly cheniers on a modern macrotidal flat (Mont-Saint-Michel bay, France)—Internal architecture revealed by ground-penetrating radar. Sediment. Geol. 2012, 279, 173–186. [Google Scholar] [CrossRef]
  12. Rieux, A.; Weill, P.; Mouazé, D.; Tessier, B. Sorting processes of mixed bioclastic-siliciclastic sediments. In Proceedings of the XIth International Conference on Estuaries and Coasts (ICEC), Caen, France, 20–23 August 2018. [Google Scholar]
  13. Jeanson, M.; Etienne, S. Etude des Services Ecosystémiques de Protection des Dépôts Sédimentaires en baie du Mont-Saint-Michel; Rapport Final; EPHE—Conseil Général d’Ille-et-Vilaine: Dinard, France, 2015; 150p. [Google Scholar]
  14. Jeanson, M.; Etienne, S.; Collin, A. Wave attenuation and coastal protection by shelly ridges: Mont-Saint-Michel Bay, France. J. Coast. Res. 2016, 75, 398–402. [Google Scholar] [CrossRef]
  15. Mury, A.; Collin, A.; Etienne, S. Wave attenuation service of saltmarshes and shelly cheniers: A spatio-temporal study in Mont-Saint-Michel Bay, France. In Proceedings of the EGU General Assembly Conference, Vienna, Austria, 8–13 April 2018. [Google Scholar]
  16. Weill, P.; Tessier, B.; Brun-Cottan, J.C. Hydrodynamic behaviour of coarse bioclastic sand from shelly cheniers. Earth Surf. Process. Landf. 2010, 35, 1642–1654. [Google Scholar] [CrossRef]
  17. Mury, A. Suivi des Dépôts Coquilliers et Etude du Service Ecosystémique de Protection dans la Moitié Ouest de la baie du Mont-Saint-Michel. Master’s Thesis, University of La Rochelle, La Rochelle, France, 2017. [Google Scholar]
  18. Lefeuvre, J.C.; Bouchard, V.; Feunteun, E.; Grare, S.; Lafaille, P.; Radureau, A. European salt marshes diversity and functioning: The case study of the Mont-Saint-Michel, France. Wetl. Ecol. Manag. 2000, 8, 147–161. [Google Scholar] [CrossRef]
  19. Laffaille, P.; Feunteun, E.; Lefeuvre, J.C. Composition of fish communities in a European macrotidal salt marsh (the Mont-Saint-Michel bay, France). Estuar. Coast. Shelf Sci. 2000, 51, 429–438. [Google Scholar] [CrossRef]
  20. Lefeuvre, J.C.; Laffaille, P.; Feunteun, E.; Bouchard, V.; Radureau, A. Biodiversity in salt marshes: From patrimonial value to ecosystem functioning. The case study of the Mont-Saint-Michel bay. C. R. Biol. 2003, 326, 125–131. [Google Scholar] [CrossRef]
  21. Townend, I.; Fletcher, C.; Knappen, M.; Rossington, K. A review of salt marsh dynamics. Water Environ. J. 2010, 25, 477–488. [Google Scholar] [CrossRef]
  22. Larsonneur, C. La baie du Mont-Saint-Michel et l’insularité du Mont. In Le Mont-Saint-Michel; Quétel, C., Ed.; Bordas: Paris, France, 1991; pp. 172–177. [Google Scholar]
  23. Bouchard, V.; Digaire, F.; Lefeuvre, J.C.; Guillon, L.M. Progression des marais salés à l’Ouest du Mont-Saint-Michel entre 1984 et 1994. Mappemonde 1995, 4, 28–34. [Google Scholar]
  24. Valéry, A.; Radureau, A. Evolution de la végétation des marais salés de la baie du Mont-Saint-Michel—Analyse cartographique 1984–2013; Rapport Convention CREBS/Université de Rennes1/Conservatoire du Littoral/Inter-SAGE baie du Mont-Saint-Michel/Agence de l’Eau Seine-Normandie/Agence de l’eau Loire-Bretagne: Rennes, France, 2014; p. 15. [Google Scholar]
  25. Archer, A.W. World’s highest tides: Hypertidal coastal systems in North America, South America and Europe. Sediment. Geol. 2013, 284–285, 1–25. [Google Scholar] [CrossRef]
  26. Suanez, S.; Cancouët, R.; Floc’h, F.; Blaise, E.; Ardhuin, F.; Filipot, J.F.; Cariolet, J.M.; Delacourt, C. Observations and predictions of wave runup, Extreme water levels, and medium-term dune erosion during storm conditions. J. Mar. Sci. Eng. 2015, 3, 674–698. [Google Scholar] [CrossRef]
  27. Collin, A.; Lambert, N.; James, D.; Etienne, S. Mapping wave attenuation induced by salt marsh vegetation using WorldView-3 satellite imagery. Rev. Investig. Mar. 2018, 25, 67–69. [Google Scholar]
  28. Schwimmer, R.A. Rates and processes of marsh shoreline erosion in Rehoboth Bay, Delaware, USA. J. Coast. Res. 2001, 17, 672–683. [Google Scholar]
  29. Ravens, T.M.; Thomas, R.C.; Roberts, K.A.; Santschi, P.H. Causes of salt marsh erosion in Galveston Bay, Texas. J. Coast. Res. 2009, 25, 265–272. [Google Scholar] [CrossRef]
  30. Van der Wal, D.; Pye, K. Patterns, rates and possible causes of salt marsh erosion in the Greater Thames area (UK). Geomorphology 2004, 61, 373–391. [Google Scholar] [CrossRef]
  31. Bitoun, R.E.; Collin, A.; James, D.; Pioch, S. Modelling Saltmarsh Spatial Evolution at High Resolution from 1948 to 2100 (Beaussais’s Bay, France). J. Coast. Res. 2018, 85, 676–680. [Google Scholar] [CrossRef]
  32. Longbotham, N.; Pacifici, F.; Malitz, S.; Baugh, W.; Camps-Valls, G. Measuring the spatial and spectral performance of WorldView-3. In Proceedings of the Hyperspectral Imaging and Sounding of the Environment, Lake Arrowhead, CA, USA, 1–4 March 2015. Paper HW3B.2. [Google Scholar]
  33. Collin, A.; Lambert, N.; Etienne, S. Satellite-based salt marsh elevation, vegetation height, and species composition mapping using the superspectral WorldView-3 imagery. Int. J. Remote Sens. 2018, 39, 5619–5637. [Google Scholar] [CrossRef]
Figure 1. Overview of the Bay of Mont-Saint-Michel.
Jmse 07 00097 g001
Figure 2. Schematic topographic profile, Western part of the Bay of Mont-Saint-Michel.
Jmse 07 00097 g002
Figure 3. Pressure sensors and topographic profiles localization map: (a) Sainte-Anne site, (b) Les Nielles site.
Jmse 07 00097 g003
Figure 4. Optical imagery data sources over Sainte-Anne site: (a) Ortholittorale Version 2 aerial and (b) SPOT-7 satellite imageries.
Jmse 07 00097 g004
Figure 5. Synthesis of hydrodynamics data during Experiment 1, February 2015 (a) atmospheric pressure data, (b) wind data, (c) water depth data, (d) significant wave height data, (e) mean zero upcrossing period data.
Jmse 07 00097 g005
Figure 6. Synthesis of hydrodynamics data during Experiment 2, March 2015 (a) atmospheric pressure data, (b) wind data, (c) water depth data, (d) significant wave height data, (e) mean zero upcrossing period data.
Jmse 07 00097 g006
Figure 7. Mapping of the erosion rates in Sainte-Anne site.
Jmse 07 00097 g007
Figure 8. Mapping of the erosion rates in Les Nielles site.
Jmse 07 00097 g008
Figure 9. Topographic profile across shelly ridges–P1 and P2: Sainte-Anne site, P3: Les Nielles site.
Jmse 07 00097 g009

