Article

Evaluation of Liquefaction Potential in Saturated Sand under Different Drainage Boundary Conditions—An Energy Approach

1
School of Mechanics and Civil Engineering, China University of Mining and Technology, Xuzhou 221116, China
2
State Key Laboratory for Geomechanics and Deep Underground Engineering, China University of Mining and Technology, Xuzhou 221116, China
3
Track Maintenance Division in Xuzhou of Shanghai Bureau Group Limited Company of China Railway, Xuzhou 221116, China
*
Author to whom correspondence should be addressed.
J. Mar. Sci. Eng. 2019, 7(11), 411; https://doi.org/10.3390/jmse7110411
Submission received: 1 October 2019 / Revised: 26 October 2019 / Accepted: 30 October 2019 / Published: 12 November 2019
(This article belongs to the Special Issue Offshore Wind Soil–Structure Interaction (SSI))

Abstract

:
Drainage conditions are supposed to have significant influence on sand liquefaction behavior. An infiltration device was utilized in cyclic triaxial tests to reproduce different drainage conditions by altering dry density of the within silt. Permeability coefficient ratio (kp) was utilized for quantifying the drainage boundary effect. Cyclic triaxial tests were conducted on saturated Fujian standard sand samples. Test results were used to evaluate the liquefaction potential by using the energy approach. It can be concluded that, if kp increases slightly bigger than zero, excess pore water pressure (EPWP) will respond more fiercely, and the dissipated energy that triggers sand liquefaction will be less. By considering kp, an energy-based database was built by taking kp into consideration and different neural network (NN) models were constructed to predict liquefaction potential by energy approaches accurately under different drainage boundary conditions. It was suggested that the neuro-fuzzy (NF)-based NN model has more satisfactory performance.

1. Introduction

Earthquakes and associated aftershocks may cause liquefaction in sand sediments, which can cause substantial damage—for example, excessive settlement and tilt of foundations, bearing capacity failure, failure of offshore embankment, and slope engineering [1,2].
Drainage conditions refer to permeability of soil sediments, drainage path, and drainage boundary conditions. Soil sediments used to be supposed at an undrained state in an earthquake, because the liquefaction occurred rapidly and pore water pressure can hardly dissipate in a short duration of loading. However, it is inferred that the drainage condition is not critically undrained with longer duration of earthquake loading, larger permeability of sand sediments, and better drainage boundary condition. Furthermore, the soil elements adjacent to the drainage boundary are considered under different drainage conditions. Then, some of the excess pore water pressure (EPWP) generated during seismic loading is being dissipated simultaneously. Thus, the effect of different drainage conditions is hard to control and quantify. It is necessary to study the influence that drainage effect exerts on soil liquefaction characteristics.
Several research studies have been carried out to investigate the liquefaction potential and EPWP response in sand sediments under different drainage conditions [3,4,5,6,7]. Ohara and Yamamoto [3] carried out a series of shaking table tests. The drainage boundary condition was controlled by a valve. Then, a parameter that reflected the rate of drain was introduced to quantify the drainage effect. Their study provided an original thought to investigate drainage effect. Yamamoto et al. [5] developed the test scheme and conducted a series of cyclic triaxial tests. The drainage boundary condition under seismic loading was reproduced by employing a triaxial apparatus with a valve to precisely measure the amount of squeezed water. In addition, the pore pressure was measured at the top and bottom of sand samples to make sure no hydraulic gradient is within the specimen. They introduced parameters to consider the drainage effect, which is a function of soil permeability coefficient, the length of drainage path, and the loading frequency. Their study shows that soil samples under partial drained conditions can resist liquefaction better than those under undrained conditions. Adamidis and Madabhushi [7] conducted two dynamic centrifuge tests. The drainage of a part of a soil sample was enclosed in a chamber that was constructed by different materials. Conclusions were drawn that the material property of drainage boundaries influenced the response of EPWP evidently.
Evaluation of liquefaction potential in saturated sands is an important topic among liquefaction research. A dissipated strain energy concept is introduced to analyze soil liquefaction characteristics as an alternative analysis approach. Dissipated energy density (W) represents the energy that soil particles consume in the process of reorganization under seismic loading per unit volume in soil. Capacity energy (Wliq) is denoted as the W that achieves liquefaction and has been identified as a representative indicator in the evaluation liquefaction potential [8,9,10,11,12]. When the test soil mechanical parameters are provided, the Wliq can be predicted by employing different neural network (NN) models [11,13,14,15,16]. Baziar and Jafarian [11] collected data from other energy-based researches [17,18,19,20] and built a database. Considering the initial density parameters such as relative density (Dr, %), initial effective mean confining pressure (σm0, kPa), grains size distribution parameters mean grain size (D50, mm), coefficient of uniformity (Cu), and coefficient of curvature (Cc), and individual parameter non-plastic fines contents (FC, %), a multilayer perceptron (MLP)-based NN model was proposed by Baziar and Jafarian [11] to predict Wliq. The parameters aforementioned were set as input parameters and Wliq was set as a target parameter. The training result of the model indicated that D50 and Cu seemed to be sufficient to represent the characteristics of grains size distribution, and the prediction of FC was disputable since the complex nonlinear relationship between FC and Wliq need further study. Cabalar et al. [15] built a neuro-fuzzy (NF)-based NN model with the same database. The result showed that the NF-based model had high accuracy, and the relationship among input and output parameters was obvious.
However, this energy-based liquefaction potential evaluation research did not consider the effect of drainage boundaries. By the infiltration device installed in the triaxial apparatus, cyclic tests were conducted on Fujian standard saturated sand to explore the effect of drainage conditions. To evaluate sand liquefaction potential, an energy-based database was built, and different NN models were constructed.

2. Cyclic Triaxial Tests with Simulated Drainage Boundary

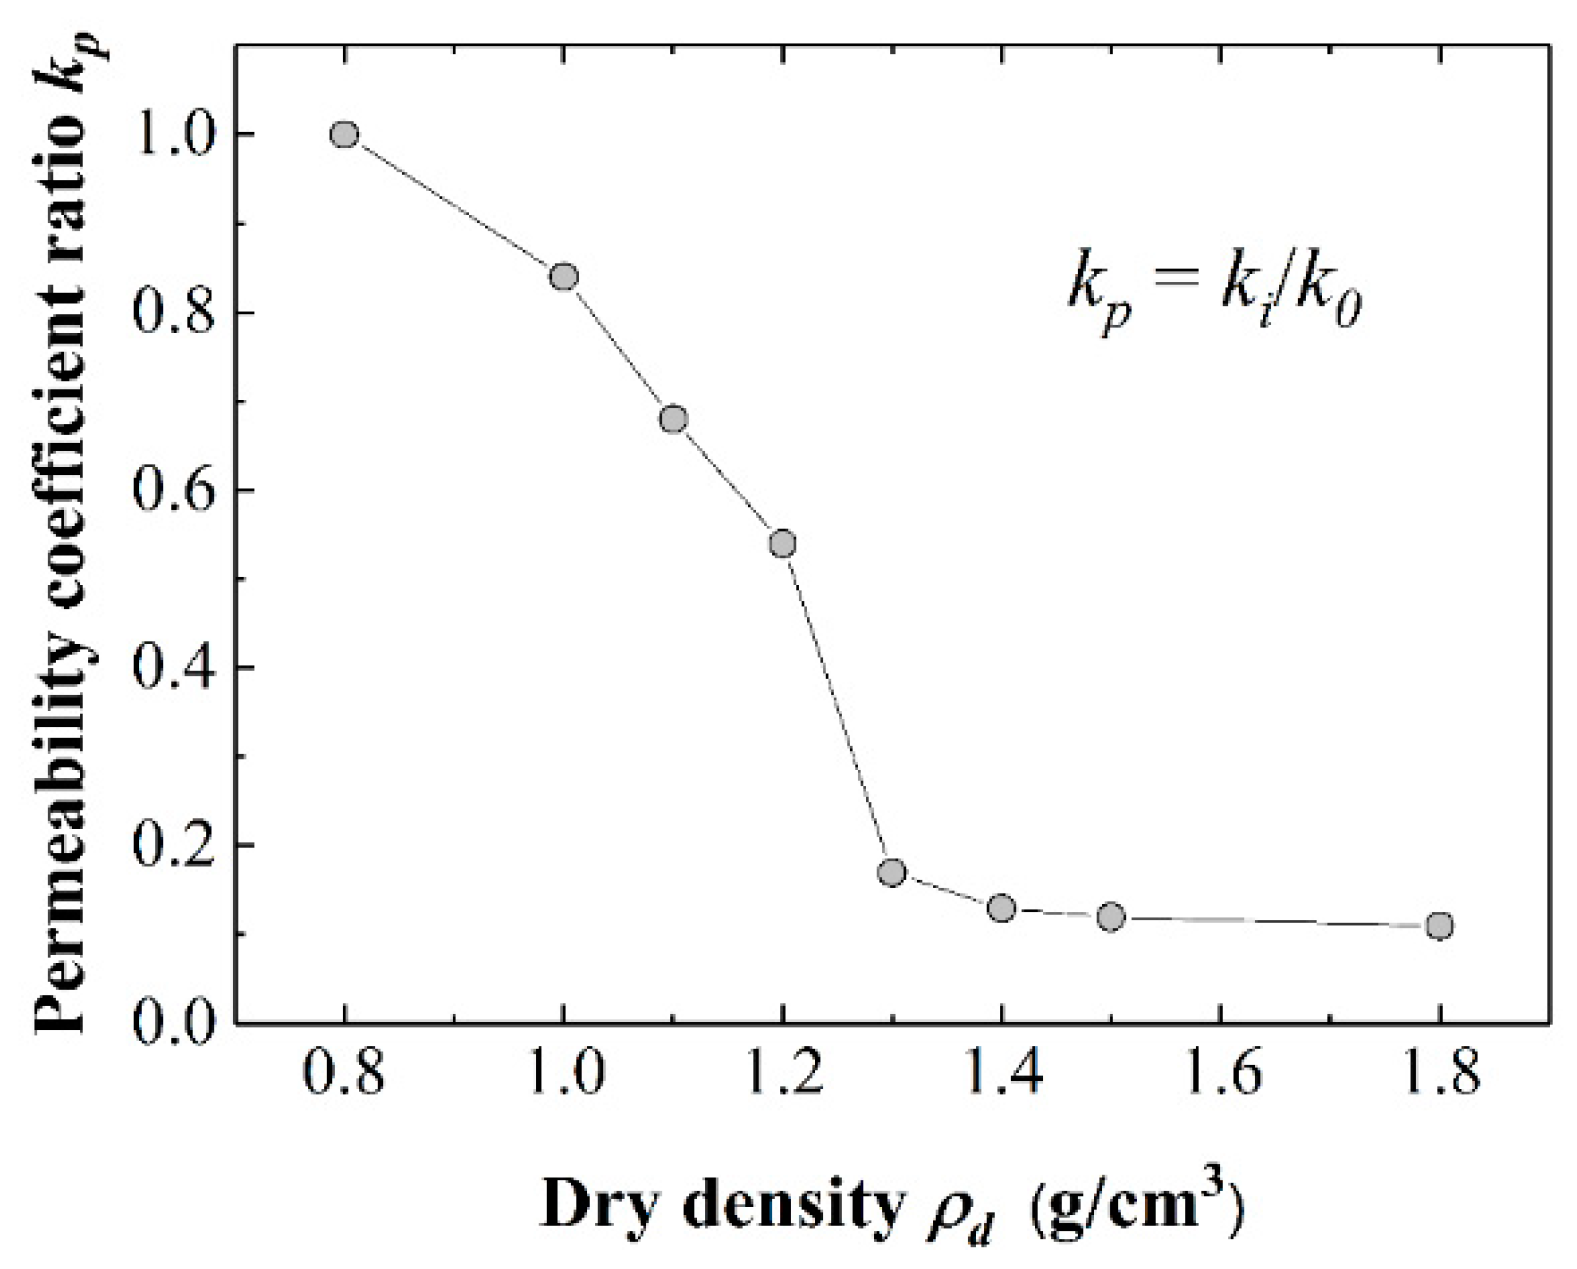
2.1. Basic Concepts and Realization of Different Drainage Conditions

The drainage condition of soil element is illustrated in Figure 1, where ki = permeability coefficient of the soil at the drainage path; k0 = permeability coefficient of the soil element; and u = excess pore water pressure. It is assumed that the resistance of permeability at the drain is zero, and the EPWP here is zero. Thus, the water head difference among analyzed specimens and the drain mainly descends at the drainage path. In addition, there is another assumption in this research: only one plane of the drainage boundary is taken into consideration as shown in Figure 1. The influence of other planes remains to be explored by applying biaxial dynamic loading [21,22]. By controlling ki, the permeability of the drainage path can be simulated. ki = 0 represents the undrained state. Therefore, the in-situ drainage condition under seismic loading theoretically is able to be reproduced by regulating a drainage system.
The simplified illustration of the employed triaxial apparatus is shown in Figure 2. To reproduce different drainage conditions, an infiltration device connecting a flowmeter was installed onto the top of specimen to control permeability of the silt. The infiltration device can retain soil and free the drained water. More detail was mentioned by Wang et al. [23]. Note that the difference in cross sections between the infiltration device and the drain pipe results in no head loss, considering the hypothesis that the EPWP is zero at the drain pipe. The valve at the bottom is closed, and the valve at the top is open during a test. With the designed infiltration device, the cyclic triaxial equipment can conduct tests under the replicated drainage boundary conditions.
The position of drainage path in the infiltration device was illustrated in Figure 2; tests were carried out to calibrate the permeability of silt layer with varied dry density. Then, kp was introduced to represent the effect of the drainage boundary condition considering permeability of the soil element, which is shown as
k p = k i k 0 .
kp can represent the silt with different density, which is only appropriate for silt and sand used in this research. The result of calibration was depicted in Figure 3. There is a strong negative correlation between kp and ρ d . When ρ d is larger than 1.3 g/cm3, the kp descends more slowly. It is suggested the permeability resistance of infiltration device develops mostly when the density reaches a certain value. In addition, kp = 0 represents the undrained state. With the calibration test results, the response of a soil element adjacent to a soil layer of arbitrary permeability can be predicted.

2.2. Sand Properties and Experiment Conditions

Fujian standard sand was employed in the tests. Some important parameters of the sand are listed in Table 1. The average relative density before consolidation (Dr0, %) of specimens were controlled to 50.0% approximately, and the average relative density post consolidation (Dr, %) was 48.7%. The fractal dimension of sand particles may be an influential parameter and need further investigation [24]. The specimens were constituted by the water pluviation because this method can ensure the uniformity of relative density of specimens [25]. Then, the specimens were saturated by applying back pressure of 500 kPa until the B value surpassed 0.95. The dense silt layer in the infiltration device may cause the applied back pressure much higher than common value.
The employed cyclic triaxial apparatus is electric servo-type. With the flowmeter fitted to the infiltration device, the amount of water drained out of soil can be measured. Considering high permeability of the saturated sand specimens, the EPWP is assumed to equally-redistributed rapidly under the stress condition in short time intervals. Thus, this study measured the pore water pressure at the bottom of specimen to represent the whole element approximately.
The cyclic triaxial tests series were performed according to ASTM D5311/D5311M-13, Standards Test Method for Load Controlled Cyclic Triaxial Strength of Soil [26]. The scheme of test series was concluded in Table 2. The tests were conducted under isotropic consolidation with 200 kPa initial effect confining pressure ( σ 0 ) and the top valve was unbolted and connected to the infiltration device; then, the specimen was applied a cyclic loading. The applied loading was a sinusoidal wave with amplitude ( σ d ) of 50 kPa. The tests were stress-controlled with loading frequency of 1.0Hz. Initial liquefaction is obvious to observe herein and appropriate to be the liquefaction criterion. Two stress parameters were shown to present the traditional triaxial test results: deviator stress:   q   =   σ 1 σ 3 , average effective principal stress, p =   ( σ 1 + 2 σ 3 ) / 3 .

3. Test Results and Analysis

3.1. Preliminary Results

Figure 4 and Figure 5 showed the liquefaction behavior characteristics of test results conducted under a certain drainage condition (kp = 0.17). Time histories of axial deviator stress (q), axial strain (εa), and EPWP were plotted in Figure 4 at the same time scale. Stress path and stress–strain curves were plotted in Figure 5. As pore pressure in the sand specimen accumulated under cyclic loading, the effective confining stress decreased. Then, the deformation resistance ability of specimen decreased. Then, EPWP increased to σ 0 and initial liquefaction achieved, accompanied by a sudden increase in the q and εa. Cyclic mobility behavior was also displayed, leading to a near zero effective stress state with a typical “butterfly” stress path as illustrated in Figure 5a. The hysteresis loops of specimen were plotted in Figure 5b, and the first few circles of loops are indiscernible. As the axial strain increased, the shape of the loops demonstrated a nonlinear hysteresis stress–strain behavior.
Comparing with the aforementioned test results in Figure 5, stress path and stress–strain curves of an unliquefied condition (kp = 0.84) were plotted in Figure 6 to discriminate different patterns of soil liquefaction behavior characteristics. Both curves in Figure 6 are indiscernible; the variation of stress and strain are in a narrow scale, and no sudden increase occurred. The value of p under cyclic loading remains a relative high level, which means that the pore water dissipated rapidly with a good drainage boundary condition. Thus, the ability to resist deformation mostly remains under a good drainage boundary condition. Note that the polylines in Figure 6a resulted from the fact that the amount of water that passed through the drainage boundary under cyclic loading was not proportional to the deviator stress.
The EPWP response time–history was provided in Figure 7. N refers to the loading cycles. Two groups were divided by whether liquefaction achieved. The response regularity of EPWP and the influence of kp have been discussed [24].
Drainage boundary conditions have a strong influence on the liquefaction behavior of sand specimens. In Figure 8, schematic diagrams were plotted based on the observation in each group to illustrate a probable cause of the sand liquefaction under different drainage boundary conditions. The mechanism of how the drainage boundary influences the liquefied specimen is discussed: cyclic loading acts on the sand element under different drainage boundaries. The sand particles were condensed from the bottom of specimens under the effect of loading and gravity. The condensing of sand and seismic loading both cause a process of upward seepage, which accumulates the pore water at the top. The poor drainage boundary condition may induce the sand more susceptible to liquefy at a localized zone. The more significant of the seepage effect will make pore water response more fiercely.

3.2. Liquefaction Potential Evaluation

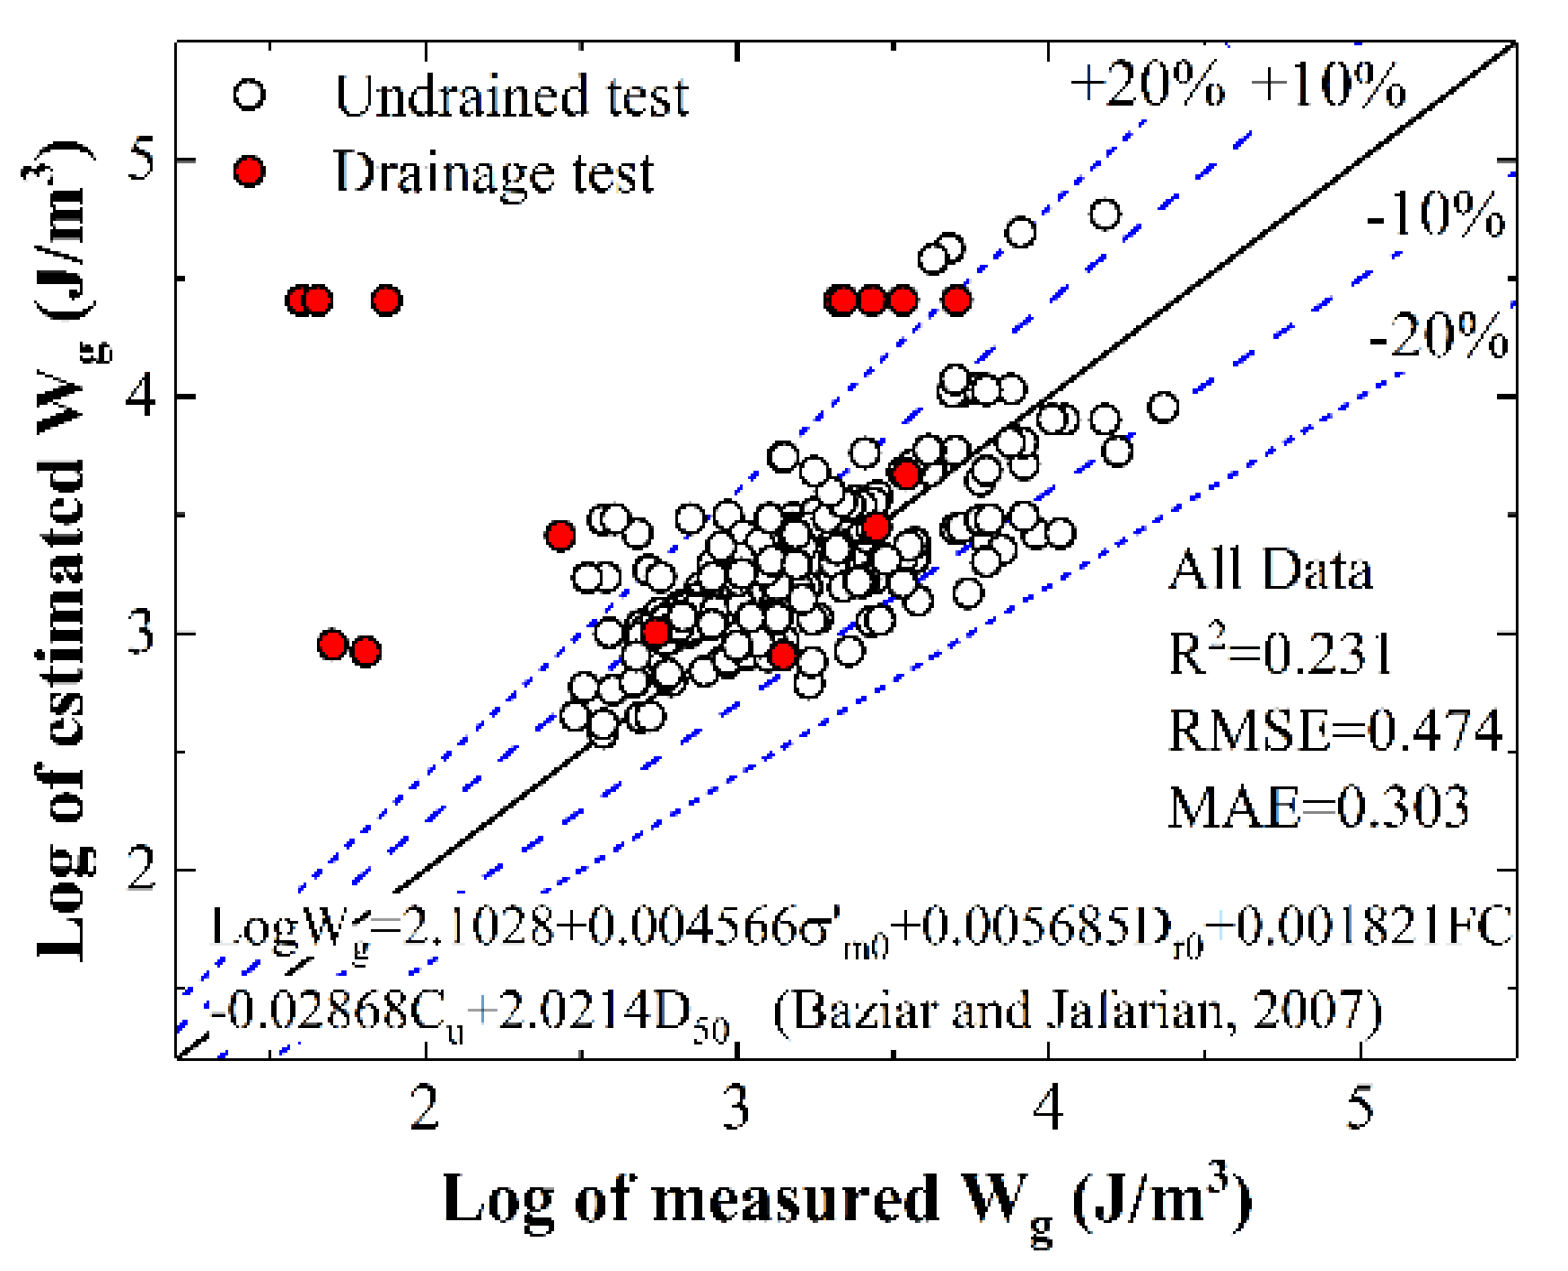
3.2.1. Energy-Based Analysis and Database Building

As Figure 9 depicted, in cyclic triaxial tests, W can be calculated using trapezoidal rule results as follows:
W = i = 1 n 1 ( q i + 1 + q i ) ( ε i + 1 ε i ) ,
where n = number of total loading cycles; qi = deviatoric stress in the ith cycle; εa,i = axial strain in the ith cycle; and the stored energy is denoted as Ws. Physically, W represents the energy inside sand sediments that need to be dissipated and indirectly reflects the friction of sand particles and the extent that the sand skeleton breaks down. Thus, employing W as an indicator for liquefaction evaluation is rational because the energy approach accounts for both seismically induced stress and strain.
In the liquefied group, test results were analyzed by an energy approach. An example (kp = 0.17) was plotted in Figure 10. Time-history of W and the calculated Wliq were shown, which is a typical curve of stress-controlled test results. The majority of the strain energy was dissipated in the last several cycles close to liquefaction occurrence. It has been proved that both the stress- and strain- controlled cyclic triaxial undrained tests have similar EPWP generation results analyzed by an energy approach [27].
In the unliquefied group, different drainage conditions showed evident influence on the behavior of W. As shown in Figure 11, W would rise to a peak value and then decreased, which is different with the cyclic rising curve in Figure 10 of liquefied groups. Then, the peak value of W was denoted as Wmax. Considering the physical meaning, the trend that W decreases circularly indicates that the structure of soil is repaired or densified, rather than being damaged or broken down in case of good drainage boundary conditions.
To numerically investigate how the drainage effect influenced W, the generalized W (Wg) are defined including both Wliq and Wmax. The relationship between Wg and kp was shown in Figure 12. It is indicated that Wliq and Wmax can be correlated through parameter kp. The function is shown as follows:
W g = 5391.3 e 6.6 k p .
The liquefaction probability of a certain ground condition can be evaluated by considering drainage boundary conditions. The evaluation system based on sand liquefaction behavior characteristics is concluded: the effect of drainage boundary condition can be quantified to the corresponding kp according to the permeability of soil. It can be discriminated whether the sand specimen will achieve liquefaction based on the value of kp. The probability of liquefaction occurring is high, if the kp represents that the sand is under bad drainage boundary conditions. The Wliq can be roughly predicted by Equation (3).
The energy-based database was developed by taking in new test results [8,9,12,28], and these tests were undrained with kp = 0. Whether before or post consolidation, relative density is almost the same for saturated sand under undrained conditions. While the data from research focused on drainage conditions are shown in Table 3. To analyze these test results with different drainage effects quantifying parameters by an energy approach, the different parameters were converted into kp uniformly. The hysteresis loop curves were reconstituted based on the provided stress and strain time-histories; then, the corresponding Wliq can be calculated.
For example, Figure 13 and Figure 14 illustrate the procedure of Wliq calculation in a centrifuge test under different drainage conditions performed by Ohara and Yamamoto [3]. In Figure 13, the shear stress time–history was reconstructed based on the recorded acceleration time–history within the zones between the accelerometers by a technique [29], and the shear strain time–history was shown together. The technique can evaluate the shear stress curve according to acceleration curve based on shear beam theory and was depicted as
τ m a x = ρ h a m a x ,
where ρ is the mass density of sand and assumed 2000 kg/m3, h is the depth of liquefaction zone, and amax is the peak acceleration. The technique has been proved effective [9,11,30]. In Figure 14, reconstructed shear stress–strain loops were shown for calculation of Wliq and recalculated parameters σ’m0 and kp were also provided. In anisotropically consolidated tests, the parameter σm0 was calculated as follows:
σ m 0 = σ v 0 ( 1 + 2 K 0 ) 3 ,
where σv0 is the initial vertical effective stress acting on the specimen and K0 is the at-rest lateral earth pressure coefficient and is assumed as 1 for saturated sand. The drainage parameter was converted into kp: based on Darcy’s law, ki can be converted by parameter vt that employed in their research to quantify drainage effect, and k0 has also been shown.
With all the research mentioned above, the corresponding database of 217 test results was built containing input parameters, such as initial effective mean confining pressure (σm0, kPa), Dr0, kp, Cu, and Cc and target parameter Wliq (J/m3). Since the complex nonlinear relationship remains disputable between FC and Wliq [11,15,28], only the data with FC = 0 were chosen to build the database.

3.2.2. MLP-Based and NF-Based NN Model

The performance of a widely used model was shown. Multiple-linear regression (MLR) is a sort of a statistic model, in which different parameters exert the influence on the dependent variable of function through linear regression. It used to be primary option in Wliq prediction to obtain approximations of the relations between variables for its convenience and high-efficiency [11,13,31,32]. The MLR-based model previously developed by Baziar and Jafarian [11] was employed on the new database as
Log W l i q = 2.1028 + 0.004566 σ m 0 + 0.005685 D r 0 + 0.001821 F C 0.02868 C u + 2.0214 D 50 .
In terms of Figure 15 and the corresponding parameters such as correlation coefficients (R2), root mean square error (RMSE), and mean absolute error (MAE), the MLR-based model did not predict the Wliq with a good degree of accuracy. Values of the Wliq in tests under different drainage conditions appear to be overestimated as marked. It can be indicated that kp is an influential parameter and the necessity for developing a model of better performance is obvious.
NN practitioners can handle sophisticated problems and the complexity of NN models can be varied simply by altering the network architecture [33]. As for architecture of NNs, multilayer perceptron (MLP) and neuro-fuzzy (NF) are different kind feedforward (FF) NNs [34]. MLP is the most basic kind NN. It is adaptive and widely applied. The NF-based NN is based on an integration of NNs and fuzzy logic, which means a complex fuzzy system is designed to obtain the learning capability of networks. NF-based models offer the advantages of both fields and have provided more accurate results than a simple NN model in many prediction applications [34]. Moreover, the relationship between input parameters can be illustrated by a visual perception figure in an NF-based model.
With the new parameter kp taken into account, the performance of two sort of NNs mentioned above are supposed to be different in Wliq prediction. The MLP-based and NF-based NN models were both constructed on the new database and the proceedings were concluded:
In data division aspects, both NN models chose the random approach and the data group can be divided into training, testing, and validation data sets [35]. Testing data will be also used to train the network and the division of it can be omitted. Validation data will be used to check whether the model performs well. In architecture design aspects, both NN models are feedforward (FF) and back propagation (BP), which means that the direction of calculation is from input parameters to target parameters, and the calculated error will be distributed back forward to calibrate the networks till the model meets the criterion set at beginning. In structure aspects, the neuros number in the hidden-layer of an MLP-based NN model is 5, which is the same as the number of input parameters [33], and the number of membership functions (MFs) is 3, which can represent the results well enough and is less computationally-consuming.
Other main features of the two kind NN models are listed in Table 4.
The training results of the MLP-based and NF-based NN models were given in Figure 16. The accuracy of the models was verified by validation sets, and the results were plotted in Figure 17. By comparison of R2, RMSE, and MAE, the accuracy of an MLP-based model is slightly better than the NF-based model. However, it has a data point whose error is about 30%. It may result from the fact that the data were collected from the centrifuge test, in which the stress condition is uncertain and needs to be calculated according to the acceleration time–history. In the NF-based model, errors of all data are less than 20%. For the centrifuge test data, performance of NF-based model is better than an MLP-based model. Compared with the prediction performance of an MLR-based model shown in Figure 15, both NN models perform better than MLR-based models (R2 = 0.231, RMSE = 0.474, MAE = 0.303). The capacity energy of a certain kind sand specimen under different drainage boundary conditions can be evaluated by imputing soil mechanical parameters to the developed NF-based model with accuracy of about 80%.
As elucidated in Figure 18, a visual perception figure was provided by an NF-based NN model to analyze the influence of input parameters on the Wliq prediction. It can be concluded that the drainage condition effect on Wliq will increase as σm0 increases. When other soil parameters are constant, Wliq will increase as drainage conditions get worse slightly (kp decreases) as well as σm0 increases. These results are in agreement with the observed phenomena in cyclic triaxial tests (as shown in Figure 8); when kp increases, sand will achieve liquefaction with less dissipated energy density, and the loading cycling number for liquefaction will be less.

4. Conclusions

The study was to exploit the influence of different drainage boundary conditions on the liquefaction behavior characteristics of saturated sand. The infiltration device was utilized to simulate drainage boundary effects. The parameter kp was introduced to quantify drainage boundary effects. Cyclic triaxial tests were carried out to assess the drainage effect on the liquefaction behavior characteristics. Test results were analyzed by the energy approach. Different NN models were constructed to evaluate liquefaction potential. The main conclusions were drawn as follows:
(1)
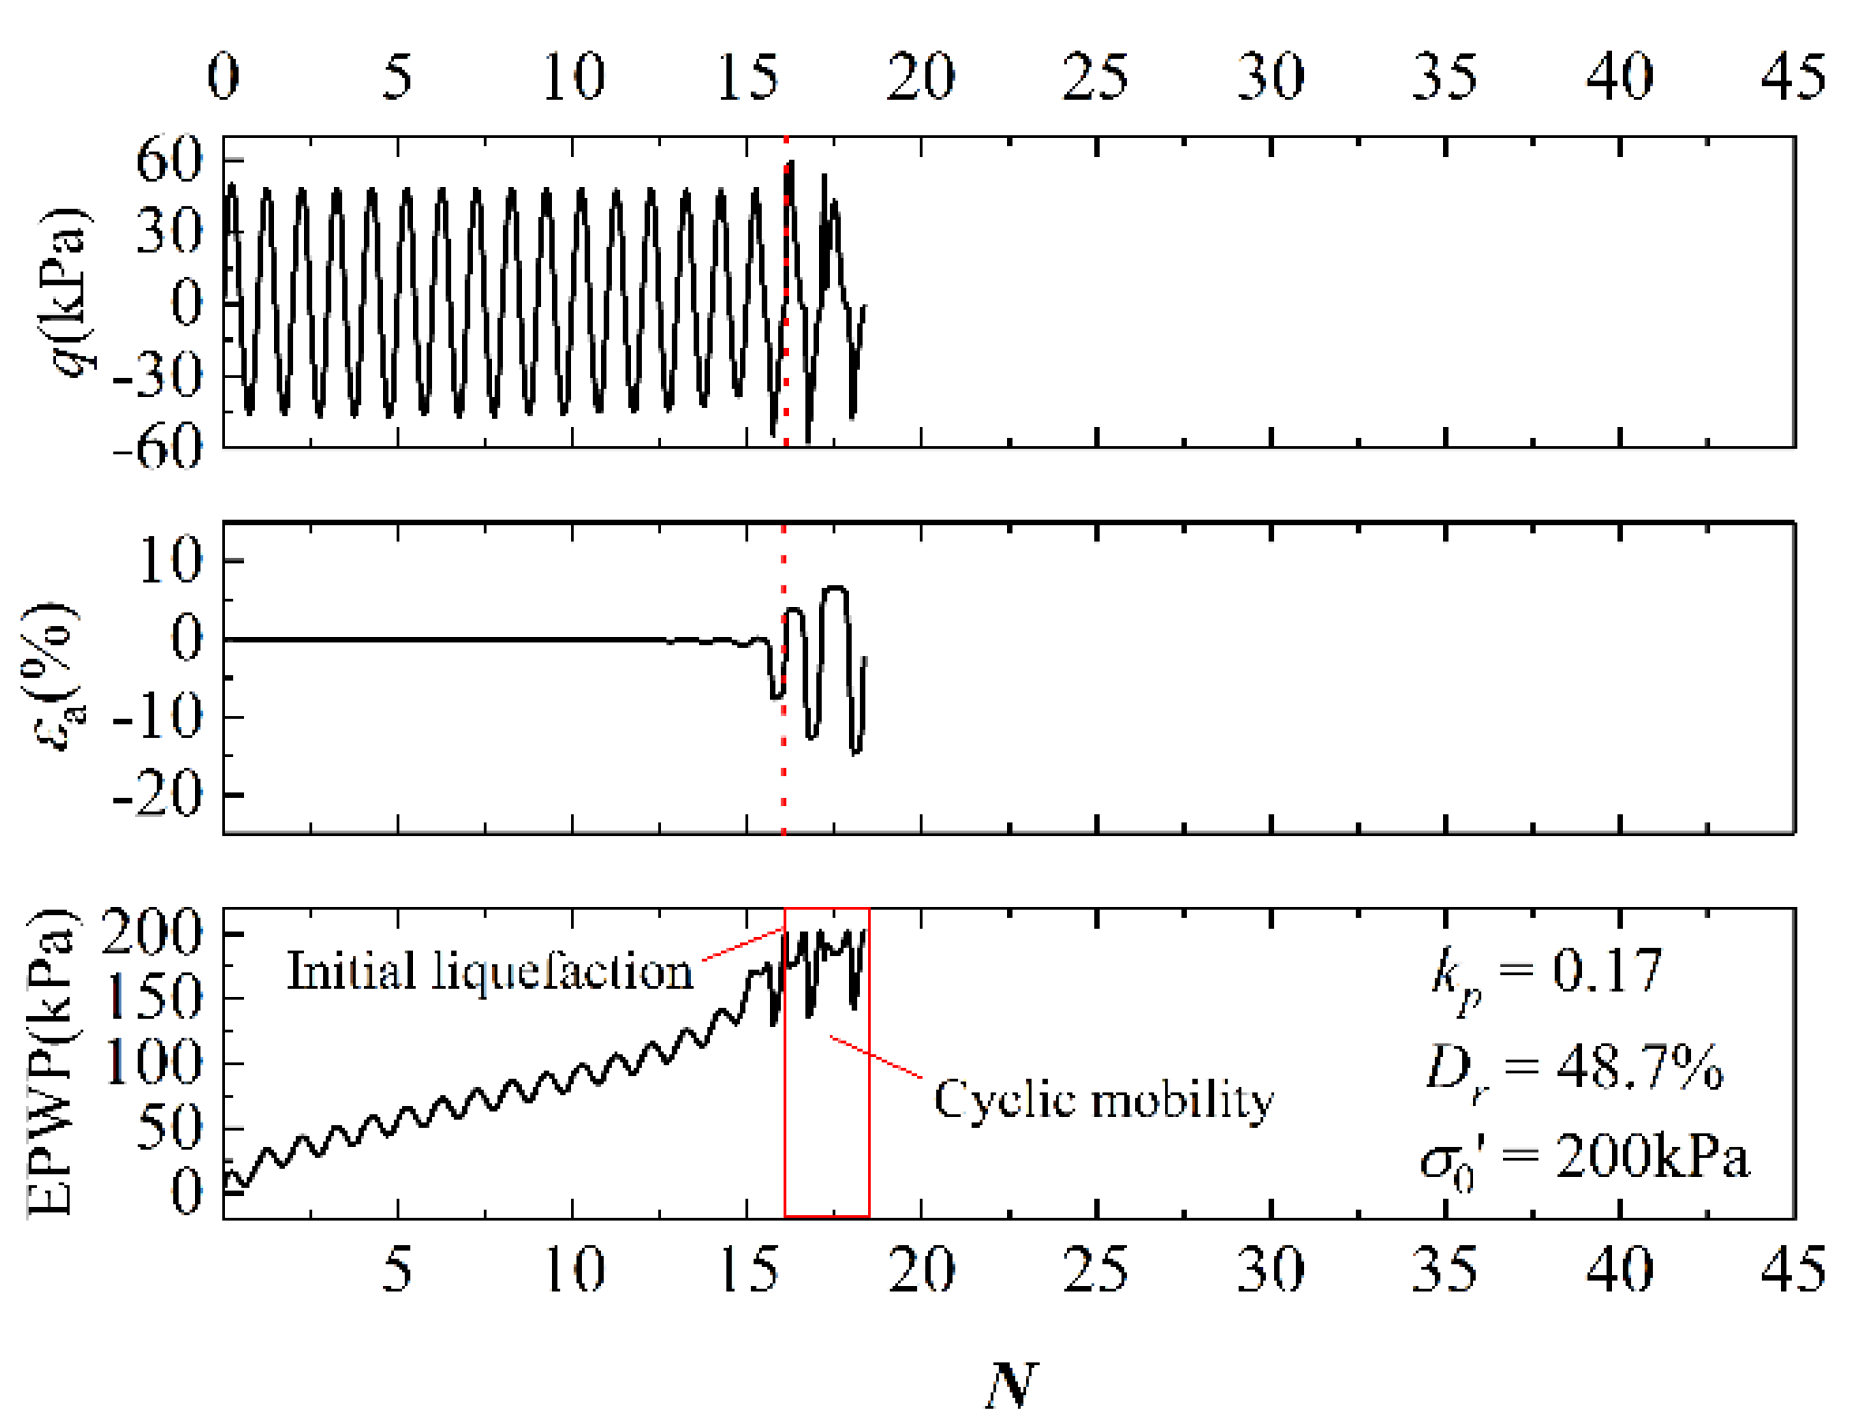
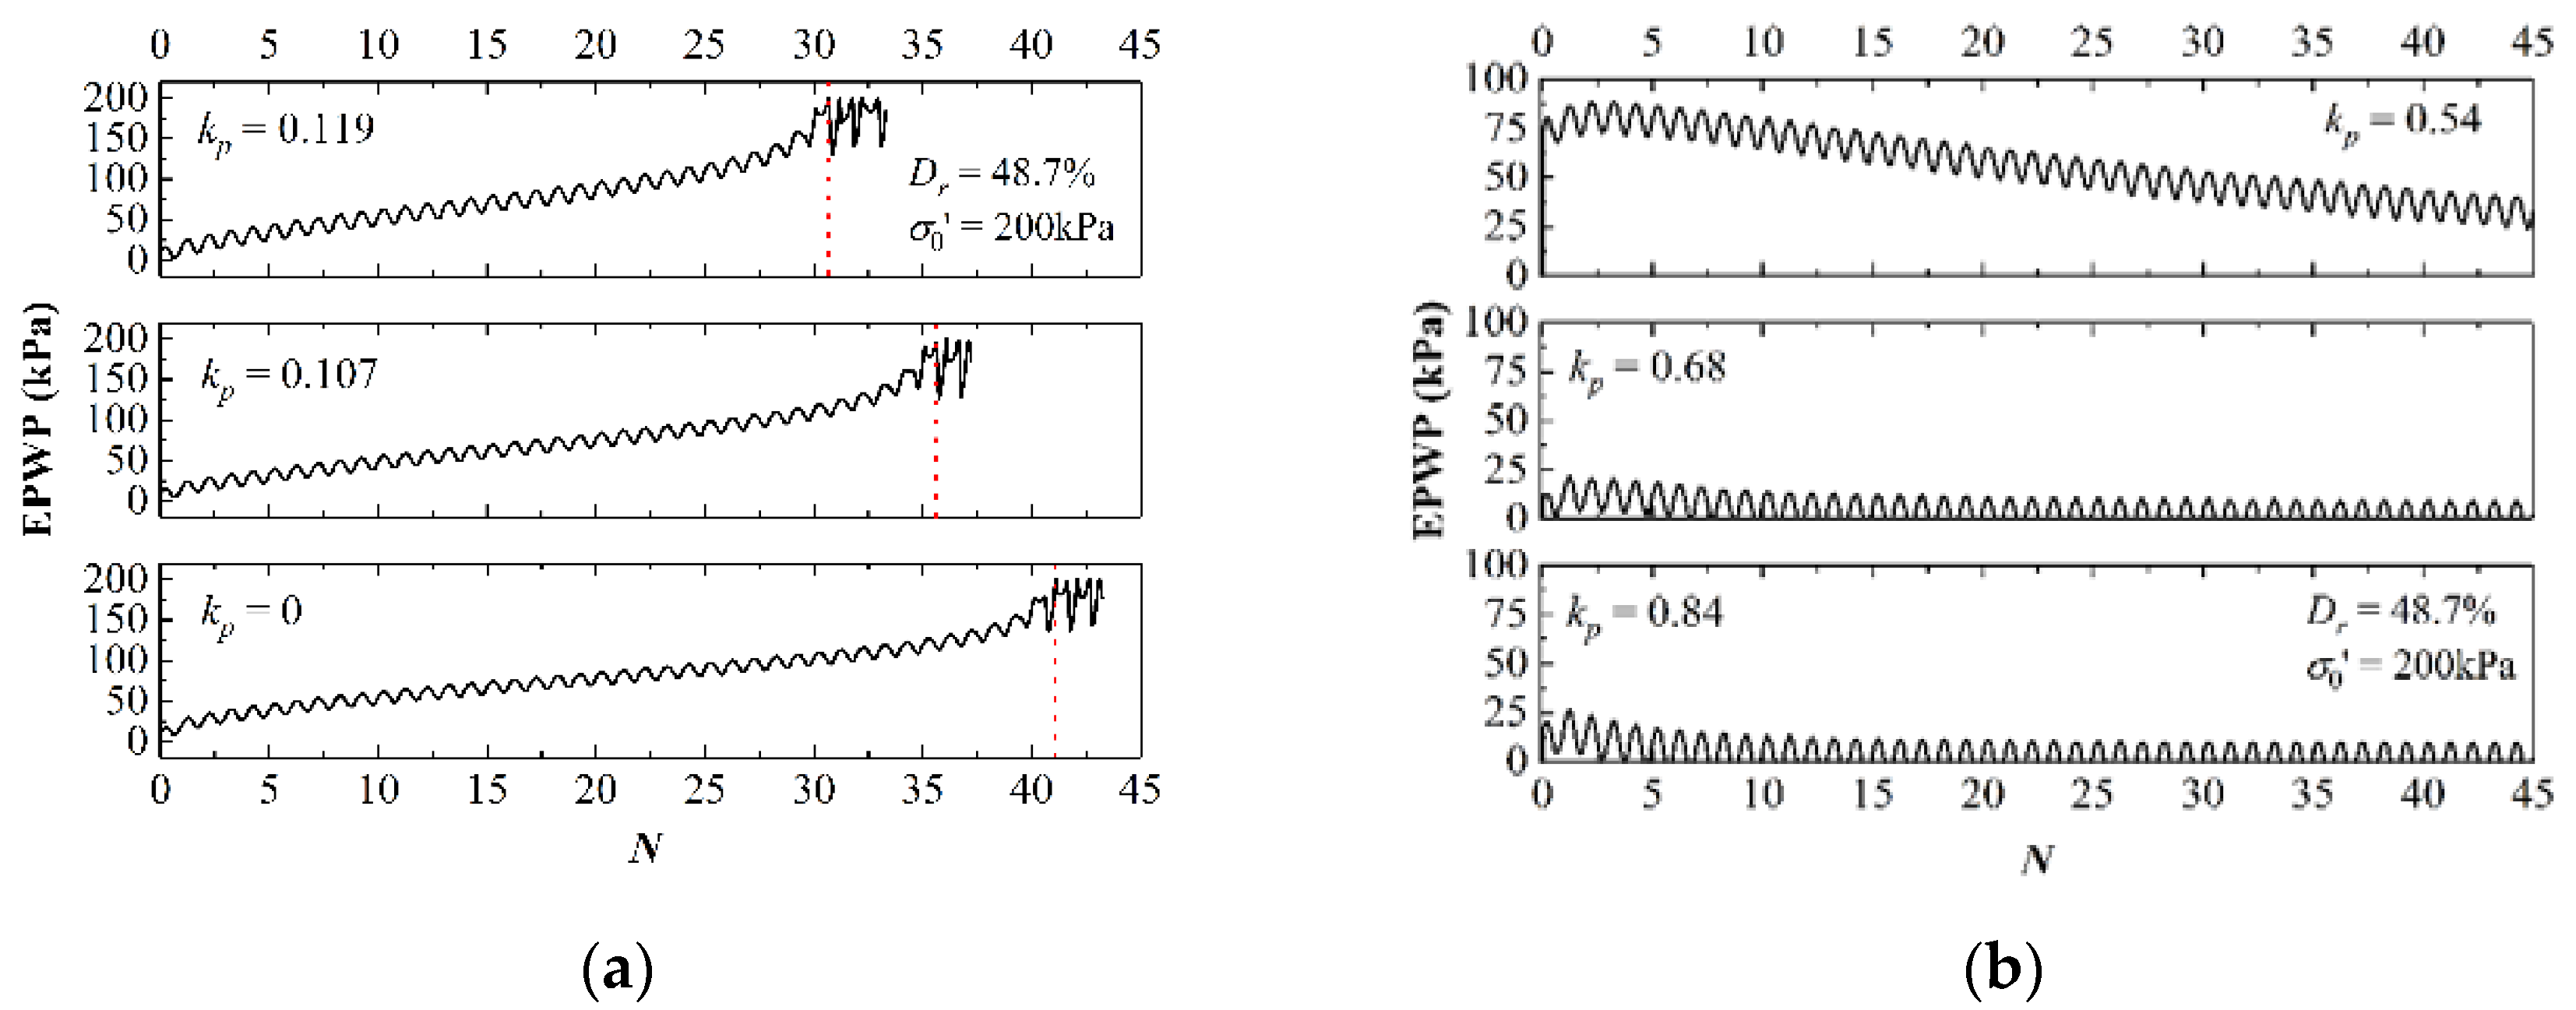
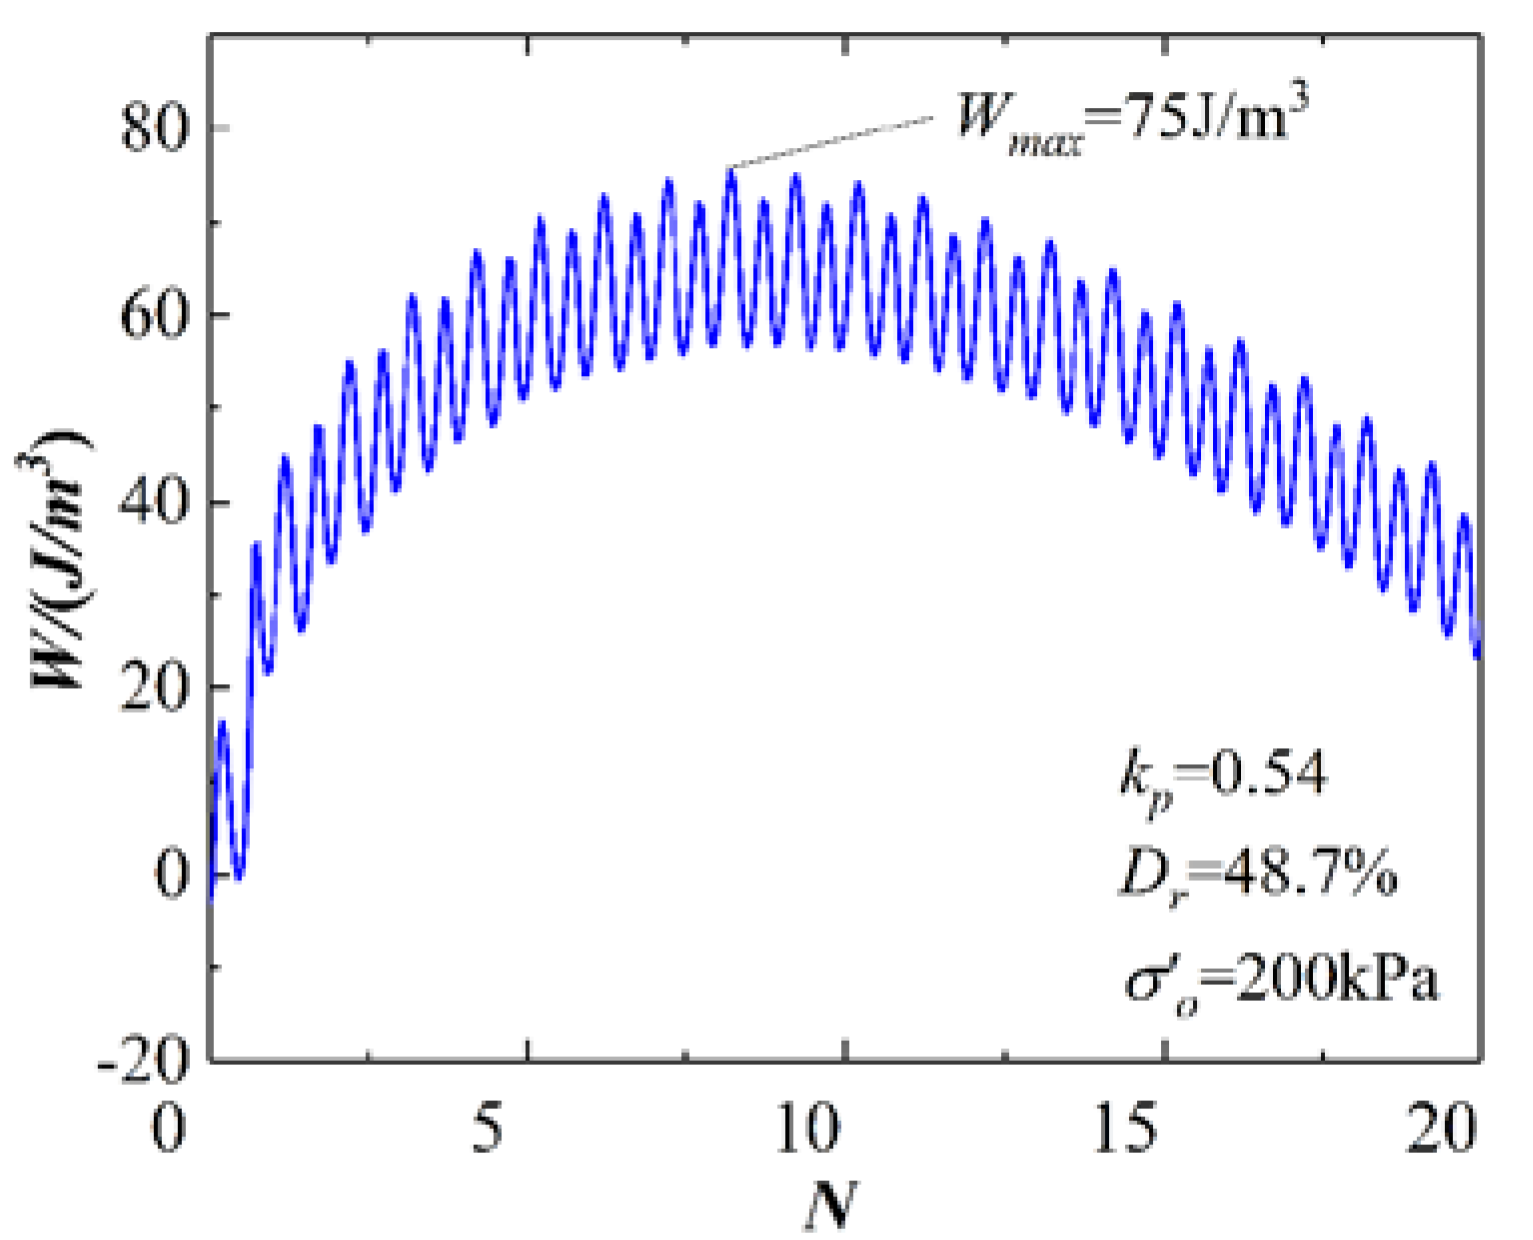
The test results indicate that the drainage boundary evidently affect the EPWP response regularity. The sand specimens will not achieve liquefaction under cyclic loading as drainage ability is good (0.54 ≤ kp ≤ 1.0). Otherwise, the specimens will liquefy under poor drainage boundary conditions (0 ≤ kp ≤ 0.17). Analyzed by an energy approach, it results from the fact that the sample consumes less capacity energy as the drainage boundary alerts better. It is assumed that a seepage in sand caused by the partial drainage boundary condition results in pore water accumulating and EPWP increases rapidly in a liquefied group.
(2)
A technique was employed to calculate Wliq from the stress–strain curves of other research. After gathering data and conversion of the drainage effect quantifying parameter from drainage effect research, a database considering kp was built for Wliq prediction.
(3)
The traditional statistical model and different NN models were constructed for Wliq prediction. Results indicate that an NF-based NN model has better performance and the accuracy rate of capacity energy assessment under different drainage is about 80%. The visual perception figure provided by an NF-based model suggests that the dense specimen will consume more capacity energy (as Dr0 increases).

Author Contributions

Data curation, Z.-Q.L.; Formal analysis, X.-H.C.; Investigation, H.F.; Methodology, F.-H.S.; Resources, B.W.; Supervision, B.W.; Writing—original draft, C.-R.Y.; Writing—review and editing, C.-R.Y.

Funding

The authors are grateful for the support from the Fundamental Research Funds for the Central Universities of China (Grant No. 2013QNB22), the National Science Foundation of China (Grant No. 51408595), the Scientific Research Starting Foundation for Returned Overseas Chinese Scholars, Ministry of Education, China (Grant No. (2015)1098).

Acknowledgments

This study was supported by the Fundamental Research Funds for the Central Universities of China (Grant No. 2013QNB22), the National Science Foundation of China (Grant No. 51408595), the Scientific Research Starting Foundation for Returned Overseas Chinese Scholars, Ministry of Education, China (Grant No. (2015)1098), and the support is gratefully acknowledged.

Conflicts of Interest

The authors declare no conflict of interest.

References

  1. Liu, H.; Chen, Y.; Yu, T.; Yang, G. Seismic analysis of the zipingpu concrete-faced rockfill dam response to the 2008 wenchuan, china, earthquake. J. Perform. Constr. Facil 2013, 29, 04014129. [Google Scholar] [CrossRef]
  2. Sassa, S.; Takagawa, T. Liquefied gravity flow-induced tsunami: First evidence and comparison from the 2018 indonesia sulawesi earthquake and tsunami disasters. Landslides 2018, 16, 195–200. [Google Scholar] [CrossRef]
  3. Ohara, S.; Yamamoto, T. Effect of drainage on the liquefaction resistance of saturated sand using shaking table. Soils Found. 1982, 22, 17–22. (In Japanese) [Google Scholar]
  4. Umehara, Y.; Zen, K.; Hamada, K. Evaluation of soil liquefaction potentials in partially drained conditions. Soils Found. 1985, 25, 57–72. [Google Scholar] [CrossRef]
  5. Yamamoto, Y.; Hyodo, M.; Orense, R.P. Liquefaction resistance of sandy soils under partially drained condition. J. Geotech. Geoenviron. Eng. 2009, 135, 1032–1043. [Google Scholar] [CrossRef]
  6. Wang, B.; Zen, K.; Chen, G.Q.; Zhang, Y.B.; Kasama, K. Excess pore pressure dissipation and solidification after liquefaction of saturated sand deposits. Soil Dyn. Earthq. Eng. 2013, 49, 157–164. [Google Scholar] [CrossRef]
  7. Adamidis, O.; Madabhushi, S.P.G. Experimental investigation of drainage during earthquake-induced liquefaction. Geotechnique 2018, 68, 655–665. [Google Scholar] [CrossRef]
  8. Baziar, M.H.; Jafarian, Y.; Shahnazari, H.; Movahed, V.; Tutunchian, M.A. Prediction of strain energy-based liquefaction resistance of sand-silt mixtures: An evolutionary approach. Comput. Geosci. 2011, 37, 1883–1893. [Google Scholar] [CrossRef]
  9. Jafarian, Y.; Towhata, I.; Baziar, M.H.; Noorzad, A.; Bahmanpour, A. Strain energy based evaluation of liquefaction and residual pore water pressure in sands using cyclic torsional shear experiments. Soil Dyn. Earthq. Eng. 2012, 35, 13–28. [Google Scholar] [CrossRef]
  10. Polito, C.; Green, R.A.; Dillon, E.; Sohn, C. Effect of load shape on relationship between dissipated energy and residual excess pore pressure generation in cyclic triaxial tests. Can. Geotech. J. 2013, 50, 1118–1128. [Google Scholar] [CrossRef]
  11. Baziar, M.H.; Jafarian, Y. Assessment of liquefaction triggering using strain energy concept and ann model: Capacity energy. Soil Dyn. Earthq. Eng. 2007, 27, 1056–1072. [Google Scholar] [CrossRef]
  12. Yang, Z.X.; Pan, K. Energy-based approach to quantify cyclic resistance and pore pressure generation in anisotropically consolidated sand. J. Mater. Civ. Eng. 2018, 30, 10. [Google Scholar] [CrossRef]
  13. Baziar, M.H.; Sharafi, H. Assessment of silty sand liquefaction potential using hollow torsional tests—An energy approach. Soil Dyn. Earthq. Eng. 2011, 31, 857–865. [Google Scholar] [CrossRef]
  14. Alavi, A.H.; Gandomi, A.H. Energy-based numerical models for assessment of soil liquefaction. Geosci. Front. 2012, 3, 541–555. [Google Scholar] [CrossRef]
  15. Cabalar, A.F.; Cevik, A.; Gokceoglu, C. Some applications of adaptive neuro-fuzzy inference system (anfis) in geotechnical engineering. Comput. Geotech. 2012, 40, 14–33. [Google Scholar] [CrossRef]
  16. Zhang, W.; Goh, A.T.; Zhang, Y.; Chen, Y.; Xiao, Y. Assessment of soil liquefaction based on capacity energy concept and multivariate adaptive regression splines. Eng. Geol. 2015, 188, 29–37. [Google Scholar] [CrossRef]
  17. Towhata, I.; Ishihara, K. Shear work and pore water pressure in undrained shear. Soils Found. 1985, 25, 73–84. [Google Scholar] [CrossRef]
  18. Liang, L. Development of an Energy Method For Evaluating The Liquefaction Potential of a Soil Deposit. Ph.D. Thesis, Case Western Reserve University, Cleveland, OH, USA, 1995. [Google Scholar]
  19. Dief, H.M. Evaluating the Liquefaction Potential of Soils by the Energy Method in the Centrifuge. Ph.D. Thesis, Case Western Reserve University, Cleveland, OH, USA, 2001. [Google Scholar]
  20. Green, R.A. Energy-Based Evaluation and Remediation of Liquefiable Soils. Ph.D. Thesis, Virginia Polytechnic Institute and State University, Blacksburg, VA, USA, 2001. [Google Scholar]
  21. Zeghal, M.; El-Shafee, O.; Abdoun, T. Analysis of soil liquefaction using centrifuge tests of a site subjected to biaxial shaking. Soil Dyn. Earthq. Eng. 2018, 114, 229–241. [Google Scholar] [CrossRef]
  22. Shafee, O.E.; Abdoun, T.; Zeghal, M. Centrifuge modelling and analysis of site liquefaction subjected to biaxial dynamic excitations. Géotechnique 2017, 67, 260–271. [Google Scholar] [CrossRef]
  23. Wang, B.; Yao, C.; Liu, Z.; Fan, H.; Xiao, H. Development of an energy-based epwp generation model under different drainage conditions. IOP Conf. Ser. Earth Environ. Sci 2019, 304, 022053. [Google Scholar] [CrossRef]
  24. Ma, L.; Li, Z.; Wang, M.; Wei, H.; Fan, P. Effects of size and loading rate on the mechanical properties of single coral particles. Powder Technol. 2019, 342, 961–971. [Google Scholar] [CrossRef]
  25. Lagioia, R.; Sanzeni, A.; Colleselli, F. Air, water and vacuum pluviation of sand specimens for the triaxial apparatus. Soils Found. 2006, 46, 61–67. [Google Scholar] [CrossRef]
  26. ASTM D5311/D5311M-13, 2013, Standard Test Method for Load Controlled Cyclic Triaxial Strength of Soil. ASTM International: West Conshohocken, PA, USA, 2013; Available online: www.astm (accessed on 12 November 2019).
  27. Polito, C.P.; Moldenhauer, H.H.M. Energy dissipation and pore pressure generation in stress-and strain-controlled cyclic triaxial tests. Geotech. Test. J. 2019, 42, 1083–1089. [Google Scholar] [CrossRef]
  28. Javdanian, H. Evaluation of soil liquefaction potential using energy approach: Experimental and statistical investigation. Bull. Eng. Geol. Environ. 2019, 78, 1697–1708. [Google Scholar] [CrossRef]
  29. Zeghal, M.; Elgamal, A.-W.; Zeng, X.; Arulmoli, K. Mechanism of liquefaction response in sand–silt dynamic centrifuge tests. Soil Dyn. Earthq. Eng. 1999, 18, 71–85. [Google Scholar] [CrossRef]
  30. Baziar, M.H.; Rostami, H. Earthquake demand energy attenuation model for liquefaction potential assessment. Earthq. Spectra 2017, 33, 757–780. [Google Scholar] [CrossRef]
  31. Figueroa, J.L.; Saada, A.S.; Liang, L.; Dahisaria, N.M. Evaluation of soil liquefaction by energy principles. J. Geotech. Eng. 1994, 120, 1554–1569. [Google Scholar] [CrossRef]
  32. Liang, L.; Figueroa, J.L.; Saada, A.S. Liquefaction under random loading: Unit energy approach. J. Geotech. Eng. 1995, 121, 776–781. [Google Scholar] [CrossRef]
  33. Maier, H.R.; Dandy, G.C. Neural networks for the prediction and forecasting of water resources variables: A review of modelling issues and applications. Environ. Model. Softw. 2000, 15, 101–124. [Google Scholar] [CrossRef]
  34. Maier, H.R.; Jain, A.; Dandy, G.C.; Sudheer, K.P. Methods used for the development of neural networks for the prediction of water resource variables in river systems: Current status and future directions. Environ. Model. Softw. 2010, 25, 891–909. [Google Scholar] [CrossRef]
  35. Shahin, M.A.; Maier, H.R.; Jaksa, M.B. Data division for developing neural networks applied to geotechnical engineering. J. Comput. Civ. Eng. 2004, 18, 105–114. [Google Scholar] [CrossRef]
Figure 1. Assumed drainage conditions of soil element.
Jmse 07 00411 g001
Figure 2. Schematic of the infiltration device in cyclic triaxial equipment.
Jmse 07 00411 g002
Figure 3. Relationship between kp and ρ d of silt in the infiltration device.
Jmse 07 00411 g003
Figure 4. Time–histories of test results with kp = 0.17.
Jmse 07 00411 g004
Figure 5. Test result (kp = 0.17) of (a) stress path; (b) stress–strain curves.
Jmse 07 00411 g005
Figure 6. Test result (kp = 0.84) of (a) stress path; (b) stress–strain curves.
Jmse 07 00411 g006
Figure 7. Time–history of excess pore water pressure (EPWP): (a) liquefied group; (b) unliquefied group.
Jmse 07 00411 g007
Figure 8. The schematic diagrams for phenomena under different drainage conditions: (a) liquefied group; (b) unliquefied group.
Jmse 07 00411 g008
Figure 9. Energy density and hysteresis loop modified after Yang and Pan [12].
Jmse 07 00411 g009
Figure 10. Time–history of W with kp of 0.17.
Jmse 07 00411 g010
Figure 11. Time–history of W with kp of 0.54.
Jmse 07 00411 g011
Figure 12. Relationship between generalized Wg and kp.
Jmse 07 00411 g012
Figure 13. Average shear stress and strain time–history curves.
Jmse 07 00411 g013
Figure 14. Reconstructed average shear stress–strain curves.
Jmse 07 00411 g014
Figure 15. Prediction performance of an multiple-linear regression (MLR)-based model.
Jmse 07 00411 g015
Figure 16. Training results (a) MLP-based model; (b) NF-based NN model.
Jmse 07 00411 g016
Figure 17. Validation results (a) MLP-based model; (b) NF-based NN model.
Jmse 07 00411 g017
Figure 18. Nonlinear mapping for liquefaction potential: kp vs. σ’m0 (kPa).
Jmse 07 00411 g018
Table 1. Properties of Fujian standard sand.
emaxeminCuCcD50 (mm)
0.8480.5975.60.450.63
Table 2. Cyclic triaxial tests series at different boundary drainage states.
Test No.Dr (%)σ’0 (kPa)σd (kPa)kp
148.7200500
248.7200500.107
348.7200500.119
448.7200500.132
548.7200500.17
648.7200500.54
748.7200500.68
848.7200500.84
Table 3. Summary of sand liquefaction potential under different drainage boundary conditions using an energy approach.
σm0 (kPa)Dr0 (%)kpCuD50 (mm)Wliq (J/m3)
Niigata sand, cyclic triaxial tests, Umehara et al. (1985)
10045.80.1081.90.32271
Toyura sand, cyclic triaxial tests, Yamamoto et al. (2009)
20049.90.031.20.23494
10091.50.031.20.22797
Fujian standard sand, cyclic triaxial tests, this study
20050.005.60.635067
20050.00.1075.60.633402
20050.00.1195.60.632119
20050.00.1325.60.632706
20050.00.175.60.632191
Toyura sand, centrifuge tests, Ohara and Yamamoto (1982)
9.448.701.60.2784
9.453.60.081.60.2767
Table 4. Different features between MLP-based and NF-based NN models.
NFMLP
Fuzzy Inference System TypeSugenoTraining functionTrainlm
Input membership function typeTriangularAdaption learning functionLearngdm
Output membership function typeLinearTransfer functionTansig
Performance criterion EpochsPerformance criterionMSE

