A Study on the Estimation of Facilities in LNG Bunkering Terminal by Simulation—Busan Port Case


Abstract
:1. Introduction
2. Precedent Studies
2.1. LNG Bunkering Type
2.2. LNG Bunkering Demand
2.3. LNG Bunkering Facilities for Estimation
2.4. LNG Emission, Technology, Operations, and Fuel Gas Supply Systems
3. Assumptions for Estimating
3.1. Assumptions for Estimating LNG Bunkering
3.2. Formulas for Estimating LNG Bunkering Facility
3.3. Estimation of Fuel Consumption by Region and Ship Type
4. Case Study: LNG Bunkering Environment of Busan Port
4.1. Analysis of Vessels Entering the Port of Busan
4.2. Analysis of Transit Time, Charging Time and Bunkering Time
4.3. Estimation of Sailing Distance by Area and by Ship Type
5. Case Study: Simulation Modeling and Results
5.1. Statistical Analysis of Vessel Arrival
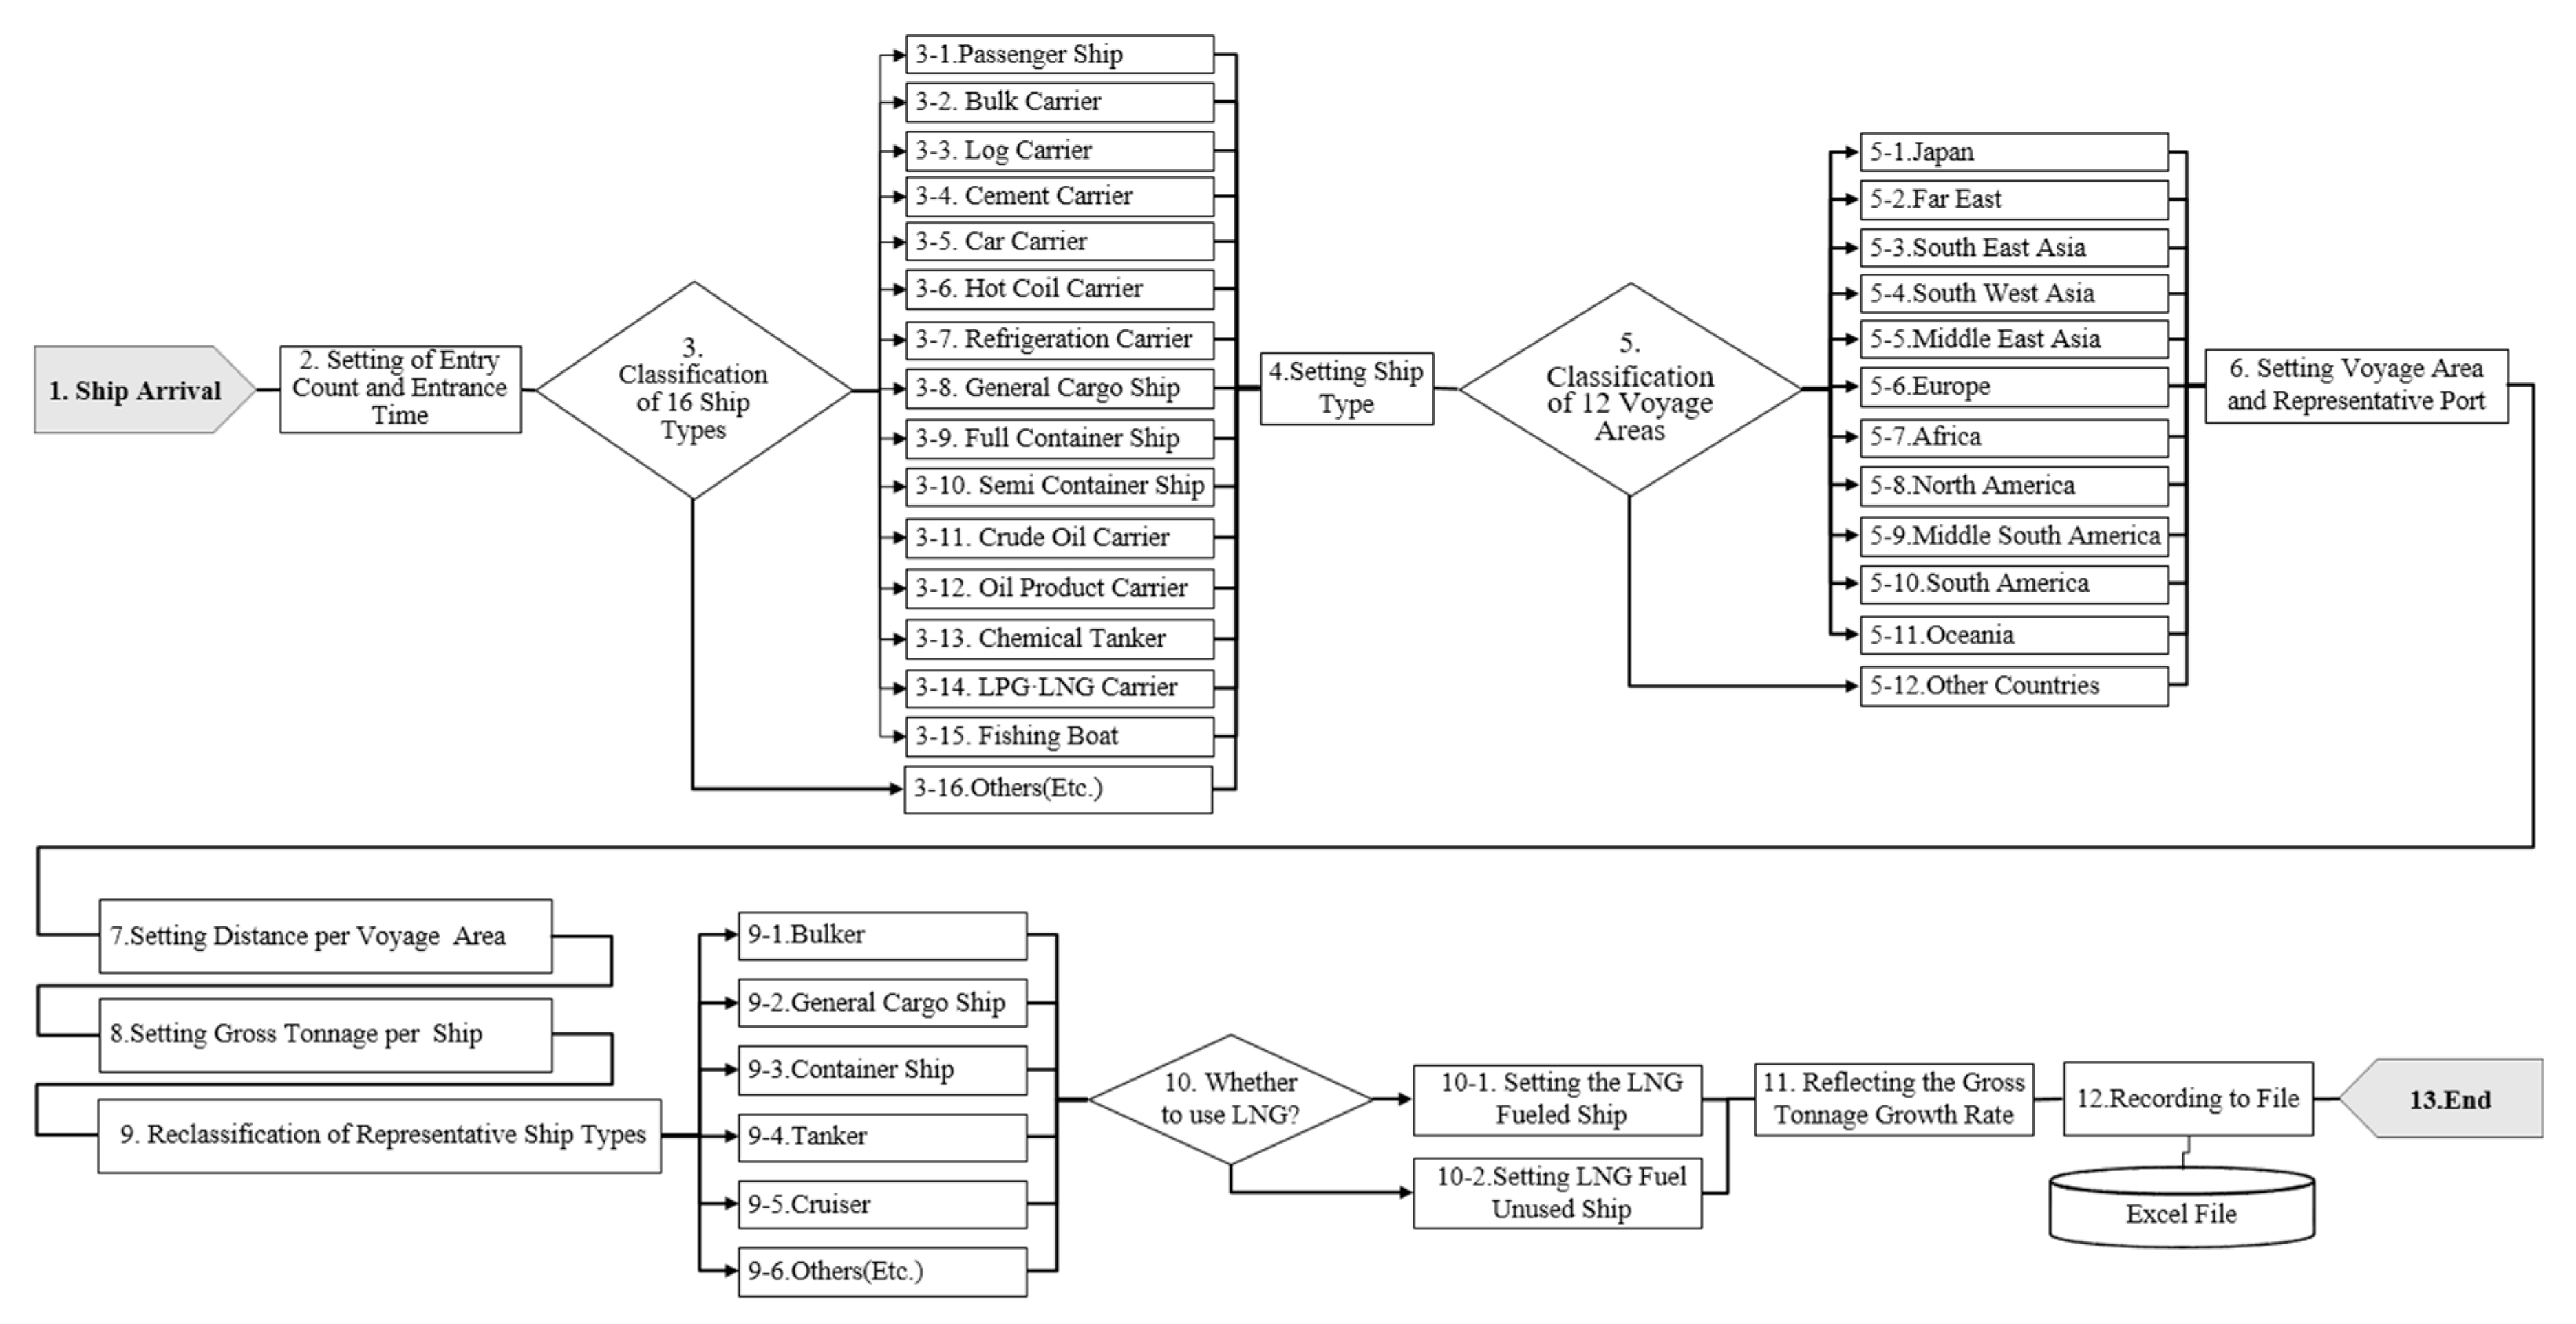
5.2. Simulation Model Development
5.3. Simulation Execution Results
5.4. Verification of Simulation Modeling Results
6. Case Study: Estimation of LNG Bunkering Facilities Using Simulation Results
6.1. Results of Detailed Items
6.2. Main Facility Specification
6.3. Summary of Results
7. Conclusions
Author Contributions
Funding
Acknowledgments
Conflicts of Interest
Appendix A

| Classification | Japan | Far East | South East Asia | South West Asia | Middle East Asia | Europe | Africa | North America | Middle South America | South America | Oceania | Other Countries |
|---|---|---|---|---|---|---|---|---|---|---|---|---|
| Japan /Osaka | China /Shanghai | Singapore | India /Mumbai | Catarrh /Doha | Netherlands /Rotterdam | South Africa /Cape Town | USA /LA | Mexico /San Padito Port | Chile /San Antonio | Australia /Sydney | Brunei /Seria | |
| One way - Sailing Distance (days) | 0.7 | 0.93 | 4.74 | 9.35 | 11.57 | 20.44 | 15.09 | 9.91 | 12.07 | 18.72 | 8.68 | 3.8 |
| Classification | Japan | Far East | South East Asia | South West Asia | Middle East Asia | Europe | Africa | North America | Middle South America | South America | Oceania | Other Countries | |
|---|---|---|---|---|---|---|---|---|---|---|---|---|---|
| G/T | TEU | Japan /Osaka | China /Shanghai | Singapore | India /Mumbai | Catarrh /Doha | Netherlands /Rotterdam | South Africa /Cape Town | USA /LA | Mexico /San Padito Port | Chile /San Antonio | Australia /Sydney | Brunei /Seria |
| 50,000 | 4400 | 53 | 70 | 355 | 700 | 867 | 1530 | 1130 | 742 | 904 | 1402 | 650 | 284 |
| 100,000 | 9200 | 89 | 117 | 597 | 1178 | 1458 | 2575 | 1901 | 1248 | 1521 | 2358 | 1094 | 478 |
| 150,000 | 14,000 | 113 | 150 | 764 | 1506 | 1864 | 3292 | 2431 | 1596 | 1945 | 3015 | 1398 | 611 |
| 200,000 | 18,800 | 136 | 180 | 917 | 1809 | 2238 | 3953 | 2919 | 1916 | 2335 | 3620 | 1679 | 734 |
| 220,000 | 20,700 | 147 | 194 | 988 | 1949 | 2411 | 4258 | 3144 | 2064 | 2516 | 3900 | 1808 | 791 |
| Classification | Storage Capacity | No. of Ships | Built Year | Gross Tonnage | Dead Weight | LOA | Width | Maximum Draft | Loading capacity | Loading Time |
|---|---|---|---|---|---|---|---|---|---|---|
| Unit | (m3) | - | - | (G/T) | (DWT) | (m) | (m) | (m) | (m3/hour) | (hour) |
| 1 | 260,000 | 10 | 2009 | 163,922 | 130,176 | 345 | 53.8 | 12.2 | 14,000 | 18.66 |
| 2 | 250,000 | 3 | 2009 | 168,399 | 155,000 | 345 | 55.0 | 10.7 | 15,000 | 17.2 |
| 3 | 210,000 | 16 | 2008 | 136,308 | 109,239 | 315 | 50.0 | 12.4 | 14,125 | 15.07 |
| 4 | 200,000 | 13 | 2008 | 136,952 | 120,091 | 314 | 50.0 | 13.6 | 14,769 | 13.97 |
| 5 | 180,000 | 2 | 2017 | 130,000 | 96,103 | 296 | 50.0 | 10.9 | - | - |
| 6 | 170,000 | 52 | 2015 | 113,031 | 92,660 | 293 | 46.5 | 12.1 | 14,080 | 12.48 |
| 7 | 160,000 | 32 | 2012 | 106,997 | 86,512 | 288 | 44.8 | 12.0 | 13,943 | 11.7 |
| 8 | 150,000 | 85 | 2013 | 106,363 | 84,374 | 288 | 44.6 | 11.9 | 14,368 | 10.8 |
| 9 | 140,000 | 96 | 2007 | 104,466 | 81,336 | 287 | 44.9 | 12.0 | 13,180 | 11.22 |
| 10 | 130,000 | 83 | 2001 | 101,682 | 75,195 | 284 | 44.6 | 11.6 | 12,773 | 10.87 |
| 11 | 120,000 | 32 | 1987 | 96,593 | 70,885 | 277 | 45.3 | 11.4 | 11,268 | 11.27 |
| 12 | 80,000 | 2 | 1993 | 66,174 | 48,837 | 239 | 40.0 | 11.0 | 7600 | 11.54 |
| 13 | 70,000 | 5 | 1993 | 50,371 | 43,237 | 234 | 34.9 | 10.4 | 7214 | 10.43 |
| 14 | 60,000 | 2 | 1997 | 46,555 | 35,760 | 215 | 33.9 | 9.5 | 6400 | 10.1 |
| 15 | 30,000 | 2 | 2016 | 25,450 | 16,303 | 182 | 32.0 | 7.4 | - | - |
| 16 | 20,000 | 7 | 2011 | 21,349 | 18,462 | 171 | 26.4 | 8.6 | 3300 | - |
| 17 | 10,000 | 9 | 2002 | 15,460 | 11,889 | 141 | 24.2 | 7.8 | 2243 | - |
| 18 | 4400 | 16 | 2005 | 5028 | 4043 | 98.9 | 16.3 | 5.5 | 824 | - |
| Total | 124,444 | 467 | 2006 | 88,617 | 71,117 | 256 | 40.9 | 10.6 | 10,318 | 12.72 |
| Latest 5 years (2013–2017) | 170,000 | 171 | 2014 | 114,098 | 89,912 | 291 | 46.5 | 12.1 | 14,130 | 11.66 |
| Classification | Total | 1. Passenger | 2. Bulk Carrier | 3. Log Carrier | 4. Cement Carrier | 5. Car Carrier | |||||
|---|---|---|---|---|---|---|---|---|---|---|---|
| Total | Ratio | 1.00000 | 0.12573 | 0.03496 | 0.00004 | 0.00238 | 0.01291 | ||||
| Japan | Ratio | 0.32255 | 0.69558 | 0.18289 | 0.00000 | 0.27068 | 0.30791 | ||||
| Distribution of GT | NORM (8.92 × 10³, 1.84 × 10³) | NORM (2.8 × 10⁴, 5.55 × 10³) | 3,049 | NORM (4.54 × 10⁴, 4.6 × 10³ | |||||||
| Far East | Ratio | 0.50731 | 0.30028 | 0.38064 | 0.50000 | 0.72180 | 0.51734 | ||||
| Distribution of GT | (1.09 × 10⁴) + (1.58e × 105) × BETA (1.21, 0.778) | NORM (2.71 × 10⁴, 2.73 × 10³) | 21,525 | 4,945 | NORM(4.48 × 10⁴, 8.89 × 10³) | ||||||
| South East Asia | Ratio | 0.04232 | 0.00128 | 0.08555 | 0.00000 | 0.00000 | 0.03329 | ||||
| Distribution of GT | NORM (8.01 × 10³, 1.6 × 10³) | NORM (3.54 × 10⁴, 3.59 × 10³) | 45,026 | ||||||||
| South West Asia | Ratio | 0.00048 | 0.00000 | 0.00512 | 0.00000 | 0.00000 | 0.00000 | ||||
| Distribution of GT | 33,079 | ||||||||||
| Middle East Asia | Ratio | 0.00589 | 0.00000 | 0.00359 | 0.00000 | 0.00000 | 0.00416 | ||||
| Distribution of GT | 40,641 | 65,545 | |||||||||
| Europe | Ratio | 0.02103 | 0.00214 | 0.01486 | 0.00000 | 0.00000 | 0.01803 | ||||
| Distribution of GT | NORM (7.8 × 10⁴, 1.56 × 10⁴) | 36,587 | 58,226 | ||||||||
| Africa | Ratio | 0.00768 | 0.00000 | 0.00564 | 0.00000 | 0.00000 | 0.00555 | ||||
| Distribution of GT | 40,641 | 61,459 | |||||||||
| North America | Ratio | 0.04125 | 0.00014 | 0.17520 | 0.50000 | 0.00000 | 0.07490 | ||||
| Distribution of GT | 35,847 | 37,583 | 21,525 | 52,455 | |||||||
| Middle South America | Ratio | 0.01476 | 0.00043 | 0.02510 | 0.00000 | 0.00000 | 0.01664 | ||||
| Distribution of GT | 54,553 | 34,786 | 51,716 | ||||||||
| South America | Ratio | 0.00444 | 0.00000 | 0.02459 | 0.00000 | 0.00000 | 0.00555 | ||||
| Distribution of GT | 53,530 | 55,578 | |||||||||
| Oceania | Ratio | 0.01143 | 0.00000 | 0.06301 | 0.00000 | 0.00000 | 0.00971 | ||||
| Distribution of GT | 44,444 | 53,888 | |||||||||
| Other Countries | Ratio | 0.02086 | 0.00000 | 0.03381 | 0.00000 | 0.00752 | 0.00693 | ||||
| Distribution of GT | 43,868 | 3,415 | 53,730 | ||||||||
| Classification | 6. Hot Coil Carrier | 7. Refrigeration Carrier | 8. General Cargo Ship | 9. Full Container Ship | 10. Semi Container Ship | 11. Crude Oil Carrier | |||||
| Total | Ratio | 0.00000 | 0.04254 | 0.13375 | 0.53632 | 0.00070 | 0.00070 | ||||
| Japan | Ratio | 0.17979 | 0.33182 | 0.27272 | 0.00000 | 0.00000 | |||||
| Distribution of GT | NORM (1.2 × 10³, 240) | NORM (4.2 × 10³, 427) | NORM (8.47 × 10³, 861) | NORM (8.42 × 10³, 836) | |||||||
| Far East | Ratio | 0.62400 | 0.53642 | 0.53563 | 0.13070 | 0.66667 | |||||
| Distribution of GT | NORM (3.54 × 10³, 352) | NORM (6.22 × 10³, 613) | NORM (3.64 × 10⁴, 3.55 × 10³) | NORM (6.03 × 10³, 297) | NORM (3.82 × 10⁴, 3.82 × 10³) | ||||||
| South East Asia | Ratio | 0.02316 | 0.04914 | 0.05273 | 0.00370 | 0.12821 | |||||
| Distribution of GT | NORM (5.2 × 10³, 522) | NORM (1.18 × 10⁴, 1.2 × 10³) | NORM (4.51 × 10⁴, 4.54 × 10³) | 21,517 | 104,547 | ||||||
| South West Asia | Ratio | 0.00000 | 0.00040 | 0.00033 | 0.00123 | 0.00000 | |||||
| Distribution of GT | 27,045 | NORM (6.42 × 10⁴, 3.24 × 10³) | 18,391 | ||||||||
| Middle East Asia | Ratio | 0.00000 | 0.00187 | 0.00975 | 0.00617 | 0.02564 | |||||
| Distribution of GT | 18,217 | NORM (7.29 × 10⁴, 3.64 × 10³) | 23,132 | 497 | |||||||
| Europe | Ratio | 0.04379 | 0.02102 | 0.02264 | 0.00370 | 0.12821 | |||||
| Distribution of GT | 4,006 | 6,309 | NORM (9.47 × 10⁴, 4.77 × 10³) | 5,127 | 50,580 | ||||||
| Africa | Ratio | 0.00926 | 0.00254 | 0.01182 | 0.00000 | 0.00000 | |||||
| Distribution of GT | 1,209 | 16,291 | NORM (5.19 × 10⁴, 2.63 × 10³) | ||||||||
| North America | Ratio | 0.04926 | 0.02799 | 0.05082 | 0.00123 | 0.02564 | |||||
| Distribution of GT | NORM (6.6 × 10³, 654) | 28,252 | NORM (7.07 × 10⁴, 7.13 × 10³) | 25,345 | 28,777 | ||||||
| Middle South America | Ratio | 0.00505 | 0.00830 | 0.02234 | 0.00000 | 0.02564 | |||||
| Distribution of GT | 4,264 | 17,970 | NORM (7.43 × 10⁴, 3.69 × 10³) | 81,493 | |||||||
| South America | Ratio | 0.00168 | 0.00295 | 0.00518 | 0.00000 | 0.00000 | |||||
| Distribution of GT | 13,618 | 43,719 | NORM (8.14 × 10⁴, 4.11 × 10³) | ||||||||
| Oceania | Ratio | 0.01305 | 0.00670 | 0.00838 | 0.14427 | 0.00000 | |||||
| Distribution of GT | NORM (3.39 × 10³, 346) | 30,099 | NORM (5.09 × 10⁴, 2.55 × 10³) | 20,074 | |||||||
| Other Countries | Ratio | 0.05095 | 0.01085 | 0.00765 | 0.00740 | 0.00000 | |||||
| Distribution of GT | NORM (3.61 × 10³, 364) | 12,380 | NORM (4.34 × 10⁴, 2.19 × 10³) | 22,376 | |||||||
| Classification | 12. Oil Product Carrier | 13. Chemical Tanker | 14. LPG·LNG Carrier | 15. Fishing Boat | 16. Others | ||||||
| Total | Ratio | 0.01730 | 0.02445 | 0.00355 | 0.04157 | 0.00930 | |||||
| Japan | Ratio | 0.19979 | 0.34066 | 0.26263 | 0.01637 | 0.23699 | |||||
| Distribution of GT | NORM (3.88 × 10³, 389) | NORM (2.53 × 10³, 252) | NORM (8.3 × 10³, 842) | 413 | NORM (3.77 × 10³, 189) | ||||||
| Far East | Ratio | 0.56729 | 0.59927 | 0.59091 | 0.69280 | 0.48940 | |||||
| Distribution of GT | NORM (5.55 × 10³, 547) | NORM (3.68 × 10³, 370) | NORM (7.39 × 10³, 739) | NORM (1.37 × 10³, 136) | NORM (5.88 × 10³, 1.01 × 10³) | ||||||
| South East Asia | Ratio | 0.03209 | 0.03150 | 0.04040 | 0.00474 | 0.11753 | |||||
| Distribution of GT | NORM (1.51 × 10⁴, 1.48 × 10³) | NORM (1.24 × 10⁴, 1.23 × 10³) | NORM (2.97 × 10⁴, 2.97 × 10³) | 1,052 | NORM (4.55 × 10³, 462) | ||||||
| South West Asia | Ratio | 0.00000 | 0.00000 | 0.00000 | 0.00000 | 0.00578 | |||||
| Distribution of GT | 9,424 | ||||||||||
| Middle East Asia | Ratio | 0.00311 | 0.00000 | 0.01010 | 0.00086 | 0.00000 | |||||
| Distribution of GT | 14,139 | 25,088 | 183 | ||||||||
| Europe | Ratio | 0.00725 | 0.00220 | 0.01010 | 0.06204 | 0.02697 | |||||
| Distribution of GT | 23,220 | 10,917 | 111,242 | 1,089 | 5,148 | ||||||
| Africa | Ratio | 0.00621 | 0.00147 | 0.00505 | 0.00172 | 0.01156 | |||||
| Distribution of GT | 4,005 | 29,093 | 17,840 | 565 | 4,314 | ||||||
| North America | Ratio | 0.02899 | 0.00586 | 0.04040 | 0.00000 | 0.02119 | |||||
| Distribution of GT | 24,372 | 26,176 | 47,437 | 44,849 | |||||||
| Middle South America | Ratio | 0.00725 | 0.00366 | 0.01515 | 0.00000 | 0.00193 | |||||
| Distribution of GT | 37,082 | 26,319 | 37,139 | 9,025 | |||||||
| South America | Ratio | 0.00207 | 0.00073 | 0.00000 | 0.00431 | 0.00385 | |||||
| Distribution of GT | 38,526 | 28,160 | 2,217 | 35,353 | |||||||
| Oceania | Ratio | 0.01242 | 0.00293 | 0.01515 | 0.00819 | 0.03854 | |||||
| Distribution of GT | NORM(1.34 × 10⁴, 1.36 × 10³) | 17,438 | 109,588 | 1,179 | 42,201 | ||||||
| Other Countries | Ratio | 0.13354 | 0.01172 | 0.01010 | 0.20896 | 0.04624 | |||||
| Distribution of GT | NORM(2.8 × 10³, 279) | 9,099 | 48,393 | NORM(1.07 × 10³, 105) | 22,746 | ||||||
| Year | LNG Fuel Requirements per Year (ton) (a) | LNG Carriers (LNGC) | ||
|---|---|---|---|---|
| One Time Capacity (ton) (b) | Number of LNGCs Required per Year (c = a/b) | Interval per One Time (days) (d = 365 days /c) | ||
| 2025 | 380,885 | 81,600 (170,000 m3) | 4.67 | 78.20 |
| 2030 | 2,005,399 | 24.58 | 14.85 | |
| Year | Average LNG Fuel Requirements per Day (ton) (a) | Peak Ratio (b) | Maximum LNG Fuel Requirements per Day (ton) (c = a*b) | STS (More than 100 tons per Supply) | TTS (Less than 100 tons per Supply) | ||||||
|---|---|---|---|---|---|---|---|---|---|---|---|
| Number of Supply | Number of LNGBVs | Daily Supply(ton) | Average Supply per One Time (ton) | Number of Supply | Number of LNGTLs | Daily Supply (ton) | Average Supply per One Time (ton) | ||||
| 2025 | 1,043.52 | 137.7% | 1,437 | 1.5 | 0.59 | 1215.31 | 816.20 | 7.4 | 15.83 | 221.62 | 29.83 |
| 2030 | 5494.02 | 7567 | 7.1 | 3.12 | 6,451.12 | 902.84 | 32.2 | 79.68 | 1115.53 | 34.60 | |
| Year | Average LNG Fuel Requirements per Day (ton) (a) | Inventory Warranty Period(day) (b) | Minimum LNG Inventory(ton) (c = a*b) | Pure LNG Capacity per Tank (ton) (d) | Estimated LNG Storage Tank Quantity (unit) (e = c/d) | Minimum LNG Storage Tank Quantity (unit) (f) | LNG Storage Capacity (ton) (g = d*f) |
|---|---|---|---|---|---|---|---|
| 2025 | 1043.52 | 30 | 31,306 | 116,640 | 0.27 | 1.00 | 116,640 |
| 2030 | 5494.02 | 164,851 | 1.41 | 2.00 | 233,280 |
| One Time Capacity of LNGC (m3) (a) | Unloading Performance (m3/hour) (b) | Unloading Required Time (hour) (c = a/b) | Docking Required Time(hour) (d) | Total Berth Occupancy Time (hour) (e = c+d) | Comments |
|---|---|---|---|---|---|
| 170,000 | 14,130 | 12.03 | 2.0 (Docking 1 h + Undocking 1 h) | 14.03 | Shipboard transit conditions due to tide difference only are not considered. |
| Charging Time (hour) (a) | Average Moving Time (hour) (b) | Bunkering Time (hour) (c) | Return Time (hour) (d) | Total Time (hour) (e = a+b+c+d) |
|---|---|---|---|---|
| 1.10 | 0.53 | 1.10 | 0.53 | 3.25 |
| Year | Tank Lorries (LNGTLs) | Bunkering Station | Required Parking Facilities (unit) (h) | |||||
|---|---|---|---|---|---|---|---|---|
| Number of LNGTLs Required per Day (a) | Rotation Count per Day (b) | Number of LNGTLs Required (c = a/b) | Charge Time per Charger per Day(hour) (d) | Charging Time per LNGTL (hour) (e) | Chargeable Number of Days per Charger (f = d/e) | Number of Chargers Required (g = a/f) | ||
| 2025 | 16.0 | 3 | 5.0 | 18.0 | 1.27 (Pure Charging time 1.1 h + margin 10 min added) | 14.0 | 1.14 (2 units) | 16.0 |
| 2030 | 80.0 | 27.0 | 5.71 (6 units) | 80.0 | ||||
| Year | Loading Time per LNGBV (hour) (a) | Moving Time per LNGBV (hour) (b) | One day | Bunkering Time per One LNGBV (hour) (i) | Return Time per One LNGBV (hour) (j) | Required Total Time per One LNGBV (hour) (k = a+b+h+i+j) | Daily Operation Time per One LNGBV (hour) (l) | Rotation Count per One LNGBV (m = l/k) | |||||
|---|---|---|---|---|---|---|---|---|---|---|---|---|---|
| Number of Supply (c) | Count of LNGBV (d) | Average Number of Supply per One LNGBV (e = c/d) | Average Moving Time(hour) (f) | Average Berthing Time(hour) (g) | Total Moving Time per LNGBV (hour) (h = e*(f+g)) | ||||||||
| 2025 | 6.70 | 1.07 | 1 | 1 | 1(1.00) | 0.34 | 1.25 | 1.59 | 7.83 | 1.07 | 18.25 | 24.00 | 1.31 |
| 2030 | 7 | 3 | 2(2.33) | 3.17 | 19.84 | 1.21 | |||||||
| Operation Time per One Day of Jetty Loading Arm (hour) (a) | Loading Time per LNGBV (hour) (b) | Operation Count per Day (c = a/b) |
|---|---|---|
| 24.00 | 6.70 | 3.58 |
| Year | Number of LNGBV (a) | Rotation Count per One LNGBV (b) | Calculated LNGBVs (c = a/b) | Required LNGBVs (d) |
|---|---|---|---|---|
| 2025 | 0.59 | 1.31 | 0.45 | 1.0 |
| 2030 | 3.12 | 1.21 | 2.58 | 3.0 |
| Year | Jetty Loading Arm & Berth | Required Mooring Facilities (e) | |||
|---|---|---|---|---|---|
| Required LNGBVs (a) | Number of Ships Available per Day per Loading Arm (b) | Calculated Loading Arm (c=a/b) | Required Loading Arm & Berth (d) | ||
| 2025 | 1.0 | 3.58 | 0.23 | 1.00 | 1 berth |
| 2030 | 3.0 | 0.84 | 1.00 | 3 berths | |
| Classification | Description (Name) | Facility Capacity | Etc. |
|---|---|---|---|
| LNG Unloading System | LNG Loading Arm | 5000 m3/h x 3 | - |
| Vapor Return Arm | 14,000 m3/h | 270,000 m3 | |
| Jetty K.O Drum | 26 m3/h | - | |
| LNG Storage System | LNG Storage Tank | 270,000 m3 | - |
| LNG Reloading Pump | 1000 m3/h | - | |
| BOG Processing System | BOG Compressor K.O Drum | 20 m3 | - |
| BOG Compressor | 12 ton/h | - | |
| Liquefaction Unit | 2.5 ton/h | - | |
| LNG Weighing System | Weighing and Regulator Unit | 1000 m3/h | - |
| LNG Reloading System | LNG Reloading Arm | Max 1000 m3/h | 5000 m3 |
| Vapor Return System | Vapor Return Arm | Max 1000 m3/h | 5000 m3 |
| Flare System | Flare Stack | 70 ton/h | - |
| Flare Stack K.O Drum | 85 m3 | - |
| LNG Storage Capacity | Design Density | Tank Size | Reloading Pump Capacity | |
|---|---|---|---|---|
| Diameter (Outer) | Height (Total) | |||
| 270,000 m3 | 480 kg/m3 | 94.80 m | 59.65 m | 1000 m3/h |
| Carrying Capacity | Vessel | Unloading Capacity | |||
|---|---|---|---|---|---|
| LOA | Width | Height | Draft | ||
| 170,000 m3 ~270,000 m3 | 300.0 m ~ 350.0 m | 47.0 m ~ 55.0 m | 26.0 m ~ 27.0 m | 12.0 m ~ 14.0 m | 14,000 m3/h |
| Items | Capacity | Specification | Unit | Estimated Cost (USD) |
|---|---|---|---|---|
| LNG Tank Lorry (Truck) | 30 m3 | 30 m3/hour | EA | 100,000 |
| LNG Truck Loading Arm (TTS) | 30 m3 | 30 m3/hour | EA | 1,000,000 |
| LNG Jetty Loading Arm (STS) | 1000 m3 | 1000 m3/hour | EA | 5,000,000 |
| LNG Bunkering Shuttle (STS) | 5000 m3 | 600 m3/hour | EA | 50,000,000 |
| 23,000 m3 | 1500 m3/hour | EA | 70,000,000 | |
| LNG Bunkering Port Construction (Based on 2035) | LNG Storage Tank: 270,000 m3 × 3 EA Unloading Berth: 160,000G/T × 1 EA Loading Berth: 7,400G/T × 3 EA | EA | 900,000,000-1,100,000,000 | |
References
- IMO. IMO Sets 2020 Date for Ships to Comply with Low Sulphur Fuel Oil Requirement. Available online: http://www.imo.org/en/MediaCentre/PressBriefings/Pages/MEPC-70-2020sulphur.aspx (accessed on 1 May 2019).
- IMO. Studies on the Feasibility & Use of LNG as a Fuel for Shipping. 2016. Available online: http://www.imo.org/en/OurWork/Environment/PollutionPrevention/AirPollution/Documents/LNG%20Study.pdf (accessed on 1 May 2019).
- IPCC (Intergovernmental Panel on Climate Change). Climate Change 2007; Synthesis Report 36; Intergovernmental Panel on Climate Change: Geneva, Switzerland, 2007.
- IMO. MEPC 67/INF.3. Third IMO GHG Study 2014—Final Report, 24 July 2014. Available online: http://www.imo.org/en/OurWork/Environment/PollutionPrevention/AirPollution/Documents/MEPC%2067-INF.3%20-%20Third%20IMO%20GHG%20Study%202014%20-%20Final%20Report%20(Secretariat).pdf (accessed on 1 May 2019).
- IAPH. Available online: http://www.lngbunkering.org/lng/ports/lng-bunker-infrastructure (accessed on 10 May 2019).
- IAPH. Available online: http://www.lngbunkering.org/lng/ports/safe-bunker-operations (accessed on 10 May 2019).
- IAPH. Available online: http://www.lngbunkering.org/lng/bunker-checklists (accessed on 10 May 2019).
- LNG World News. South Korea Confirms Push to Revitalize LNG Bunkering. 2018. Available online: https://www.lngworldnews.com/south-korea-confirms-push-to-revitalize-lng-bunkering/ (accessed on 13 July 2019).
- MOF (Ministry of Maritime Affairs and Fisheries). A Study on the Construction of LNG Bunkering Infrastructure of Major Ports in Korea-Final Report; Ministry of Maritime Affairs and Fisheries: Seoul, Korean, 2018.
- Lowell, D.; Wang, H.; Lutsey, N. Assessment of the Fuel Cycle Impact of Liquefied Natural Gas as used in International Shipping, ICCT 2013. pp. 11–12. Available online: https://www.researchgate.net/publication/260792434 (accessed on 7 May 2019).
- The Steering Committee for LNG Bunkering at the Port of Yokohama, Feasibility Study Report on the LNG Bunkering Hub Development Plan at the Port of Yokohama. Available online: https://www.mlit.go.jp/common/001157232.pdf (accessed on 7 May 2019).
- Lloid’s Register, LNG-fuelled Deep Sea Shipping: The Outlook for LNG Bunker and LNG-Fuelled Newbuild Demand up to 2025. Available online: http://www.lngbunkering.org/sites/default/files/2012_Lloyds_LNG-fuelled%20deep%20sea%20shipping.pdf (accessed on 29 May 2019).
- DNV Korea. A Study on Establishment of Basic Plan for Southeastern LNG Bunkering, KOGAS (Korea Gas Corporation). Available online: https://www.lngworldnews.com/dnv-kogas-to-conduct-lng-bunkering-study-in-korea/ (accessed on 3 October 2019).
- Kim, H.-s.; Choi, k.-h. A Study on the Development and Operation of LNG Bunkering Hub Port in Korea. Korea Int. Commer. Rev. 2018, 33, 335–352. Available online: http://www.riss.kr/link?id=A105298125 (accessed on 10 May 2019).
- Yun, S.; Ryu, J.; Seo, S.; Lee, S.; Chung, H.; Seo, Y.; Chang, D. Conceptual design of an offshore LNG bunkering terminal: a case study of Busan Port. J. Mar. Sci. Technol. 2015, 20, 226–237. [Google Scholar] [CrossRef]
- KRISO (Korea Research Institute of Ships and Ocean engineering). Development Phase of Floating LNG Bunkering Terminal in Korea, International LNG Fueled Ship Bunkering Conference 2018 (Nov. 15. Busan, Korea). Available online: http://lngkorea.co.kr/2018/pt/session_2/2-2_Sung_Hong-gun.pdf (accessed on 13 July 2019).
- Kim, K.; Park, K.; Roh, G.; Chun, K. Case Study on Boil-Of-Gas (BOG) Minimization for LNG Bunkering Vessel Using Energy Storage System (ESS). J. Mar. Sci. Technol. 2019, 7, 130. [Google Scholar] [CrossRef]
- Xuan, S.; Hu, S.; Li, Z.; Li, W.; Li, B. Dynamics Simulation for Process Risk Evolution on the Bunker Operation of an LNG-fueled Vessel with Catastrophe Mathematical Models. J. Mar. Sci. Technol. 2019, 7, 299. [Google Scholar] [CrossRef]
- Choi, J.; Park, E.Y. Comparative Study on Fuel Gas Supply Systems for LNG Bunkering Using Carbon Dioxide and Glycol Water. J. Mar. Sci. Technol. 2019, 7, 184. [Google Scholar] [CrossRef]
- Engineering Tool Box. Liquefied Natural Gas—LNG. 2008. Available online: https://www.engineeringtoolbox.com/liquefied-natural-gas-lng-d_1092.html (accessed on 10 May 2019).
- KOGAS (Korea Gas Corporation). Main Business—LNG Supply—Production & Supply. Available online: http://www.kogas.or.kr/portal/contents.do?key=1963 (accessed on 15 May 2019).
- MarineTraffic: Global Ship Tracking Intelligence—AIS Marine Traffic. Available online: https://www.marinetraffic.com/en/ais/details/ships/shipid:4404786/mmsi:205703000/imo:9750024/vessel:ENGIE_ZEEBRUGGE (accessed on 15 May 2019).
- MAN B&W ME-GI Dual-Fuel, Low-Speed Engine. Available online: https://marine.man-es.com/docs/default-source/shopwaredocuments/man-b-w-me-giee40ba7d787543c688da0d9c11628006.pdf?sfvrsn=9b35f9bd_3 (accessed on 15 May 2019).
- Lloyd’s Register Marine. Lloyd’s Register LNG-as-Fuel Tank Capacity Calculator. Available online: https://www.lr.org/en/fuel-testing/fuel-management-toolkit/ (accessed on 3 October 2019).
- MOF (Ministry of Maritime Affairs and Fisheries). PORT-MIS. Available online: https://new.portmis.go.kr/portmis/websquare/websquare.jsp?w2xPath=/portmis/w2/main/index.xml&page=/portmis/w2/sp/vssl/vsch/UI-PM-SP-104-02.xml&menuId=1319&menuCd=M0129&menuNm=선박입출항현황 (accessed on 17 May 2019).
- Kakao Map. Available online: https://map.kakao.com/ (accessed on 17 May 2019).
- Google Map. Available online: https://www.google.co.kr/maps/ (accessed on 17 May 2019).
- Busan Port Authority. Available online: https://www.busanpa.com/eng/Contents.do?mCode=MN0031 (accessed on 13 July 2019).
- Busan Harbor Pilot Association, Busan Port Navigation Rules. Available online: http://www.busanpilot.kr/PMS/raw/raw.do?mcode=04 (accessed on 17 May 2019).
- Swedish Marine Technology Forum, LNG Ship to Ship Bunkering Procedure. Available online: http://www.lngbunkering.org/sites/default/files/SMTF,%20Ship%20to%20Ship%20Bunkering.pdf (accessed on 22 May 2019).
- Sea-Distances.Org. Available online: https://sea-distances.org/ (accessed on 22 May 2019).
- Park, S.K.; Park, N.K. A Study on the Estimation Model of the Proper Cargo Handling Capacity based on Simulation in Port - Port Cargo Exclusive Pier Example. J. Korea Inst. Inf. Commun. Eng. 2013, 17, 2454–2460. [Google Scholar] [CrossRef]
- Nam-Kyu, P.A.R.K.; Sang-Cheol, S.U.H. The Analysis of Ship Waiting in Oil Terminal by Simulation: The Case of Gwangyang Port. J. FMSE 2018, 30, 1891–1900. [Google Scholar]
- MarineTraffic: Global Ship Tracking Intelligence—AIS Marine Traffic. Available online: https://www.marinetraffic.com/ (accessed on 29 May 2019).
- Republic of Korea. Article 6-3 of the Enforcement Decree of the Urban Gas Business Act (Natural Gas Stockpile). Available online: http://www.law.go.kr/lsInfoP.do?lsiSeq=200488&efYd=20180107#J6:3 (accessed on 29 May 2019).
- Korea Gas Corporations (KOGAS). Available online: http://www.kogas.or.kr/eng/index.do (accessed on 13 July 2019).


| Research Organization | Estimation Time (Year) | Percentage of the Replacement from Heavy Oil to LNG |
|---|---|---|
| Boston Consulting Group | 2025 | 5%–27% |
| Lloyd’s Register | 2030 | 11% |
| DNV-GL | 2025 | 6%–11% |
| IHS | 2030 | 8% |
| Year | 2025 | 2030 |
|---|---|---|
| Forecasting(tons) | 380,000 | 2,005,000 |
| Year | Bulker | Tanker | Container | General Cargo Ship | Cruiser | Total |
|---|---|---|---|---|---|---|
| 2025 | 19.28% | 21.52% | 31.25% | 47.70% | 23.08% | 27.13% |
| 2030 | 39.06% | 45.66% | 57.41% | 72.30% | 29.17% | 51.65% |
| Classification | Details | Units | Applied Value | Formula Symbols | Basis of Estimation | Reference |
|---|---|---|---|---|---|---|
| Density | LNG Storage Tank | kg/m3 | 480 | 410 kg/m3 ~ 500 kg/m3 | [20] | |
| LNGTL | 480 | |||||
| LNGBV | 460 | |||||
| LNGC (LNG carrier) | Storage Tank Size | m3 | 170,000 | Actual 174,000 cubic meters (m3) reduced by about 2% on safety standards | Appendix A Table A3. Latest 5 years | |
| ton | 81,600 | |||||
| Loading Capacity | ton/hour | 5000 | Based on KOGAS Tongyeong base | - | ||
| LNG Storage Tank | Size | m3 | 270,000 | KOGAS’s largest LNG storage tank scale (Samcheok Station) | [21] | |
| ton | 129,600 | |||||
| Minimum Stock Basis | % | 10 | Maintain a minimum inventory of 6% to 13% for normal self-cooling | - | ||
| Pure Capacity | ton | 121,814 | ||||
| LNGTL (TTS) | Storage Tank Size | m3 | 30 | - | ||
| ton | 14 | |||||
| Charging Capacity (Tank→LNGTL) | ton/min | 0.25 | 14 ton/hour | - | ||
| Loading Capacity (LNGTL→LNGFV) | ||||||
| LNGBV (STS) | Storage Tank Size | m3 | 5000 | LNG bunkering vessel (ENGIE ZEEBRUGGE, IMO: 9750024) Technical standards | [17] | |
| ton | 2300 | |||||
| Minimum Stock Basis | % | 6 | Maintain at least 6% pre-stock for self-cooling and fuel | - | ||
| Pure Capacity | ton | 2162 | - | |||
| Loading Arm System Loading Capacity (Tank→LNGBV) | m3/hour (ton/hour) | 1000 (460) | In 2017, Hanjin Heavy Industries LNG bunker shuttle vessel (ENGIE ZEEBRUGGE, IMO: 9750024) Technical standards | [22] | ||
| Charging Capacity (LNGBV→ LNGFV) | m3/hour (ton/hour) | 600 (276) | ||||
| STS/TTS Classification Standard | ton | 100 | - | 100ton↓(TTS), 100ton↑(STS) | [2] | |
| LNGFV’s Fuel Consumption | Reference Engine Model | g/kWh | MAN B&W (Germany) | - | LNG Engine Model: S90ME-C9-GI | [23] |
| LNG Usage Calculation | m3 | Lloyd’s of the UK | - | LNG-as-Fuel Tank Capacity Calculator | [24] | |
| Classification | Container | Bulker, General Cargo | Tanker | Cruiser | |
|---|---|---|---|---|---|
| Basic Assumptions | Total Power (kWh) | 5178/9988/14,500/25,000/47,500/53,500/65,000 | |||
| MCR (%) | 75% | 50% | 75% | 75% | |
| LNG Consumption (g/kWh) | 156.3 | 159.5 | 156.3 | 156.3 | |
| LNG Density (kg/m3) | 442 | ||||
| Average Speed (knots) | 22.0 | 15.0 | 16.0 | 22.0 | |
| Types of Ships | Count of Ships | Ratio | Gross Tonnage (GT) | Average Gross Tonnage (AGT) |
|---|---|---|---|---|
| Bulker | 947 | 3.47% | 28,184,196 | 29,777 |
| Tanker | 1245 | 4.56% | 11,010,155 | 8843 |
| Container | 15,277 | 55.94% | 556,413,868 | 36,422 |
| General Cargo Ship | 5849 | 21.42% | 36,514,892 | 6243 |
| Cruiser | 3838 | 14.05% | 19,005,955 | 4952 |
| Other | 154 | 0.56% | 1,695,311 | 11,009 |
| Total | 27,310 | 100.00% | 652,824,376 | 23,905 |
| Year | 2018 (Actual) | 2025 (Estimation) | 2030 (Estimation) |
|---|---|---|---|
| Increase Rate | - | 27.08% | 46.43% |
| Average Gross Tonnage | 24,116 | 30,648 | 35,313 |
| Number of Vessels | 27,636 | 27,739 | 27,812 |
| Classification | Ship Count (2018) | Gross Tonnage (GT) | Peak Ratio |
|---|---|---|---|
| Total | 27,310 | 652,824,376 | - |
| Average Ships per Day | 75 | 1,792,034 (a) | - |
| Average Ships for Upper 20 Days | 86 | 2,468,302 (b) | 137.7% ( (b/a) × 100% ) |
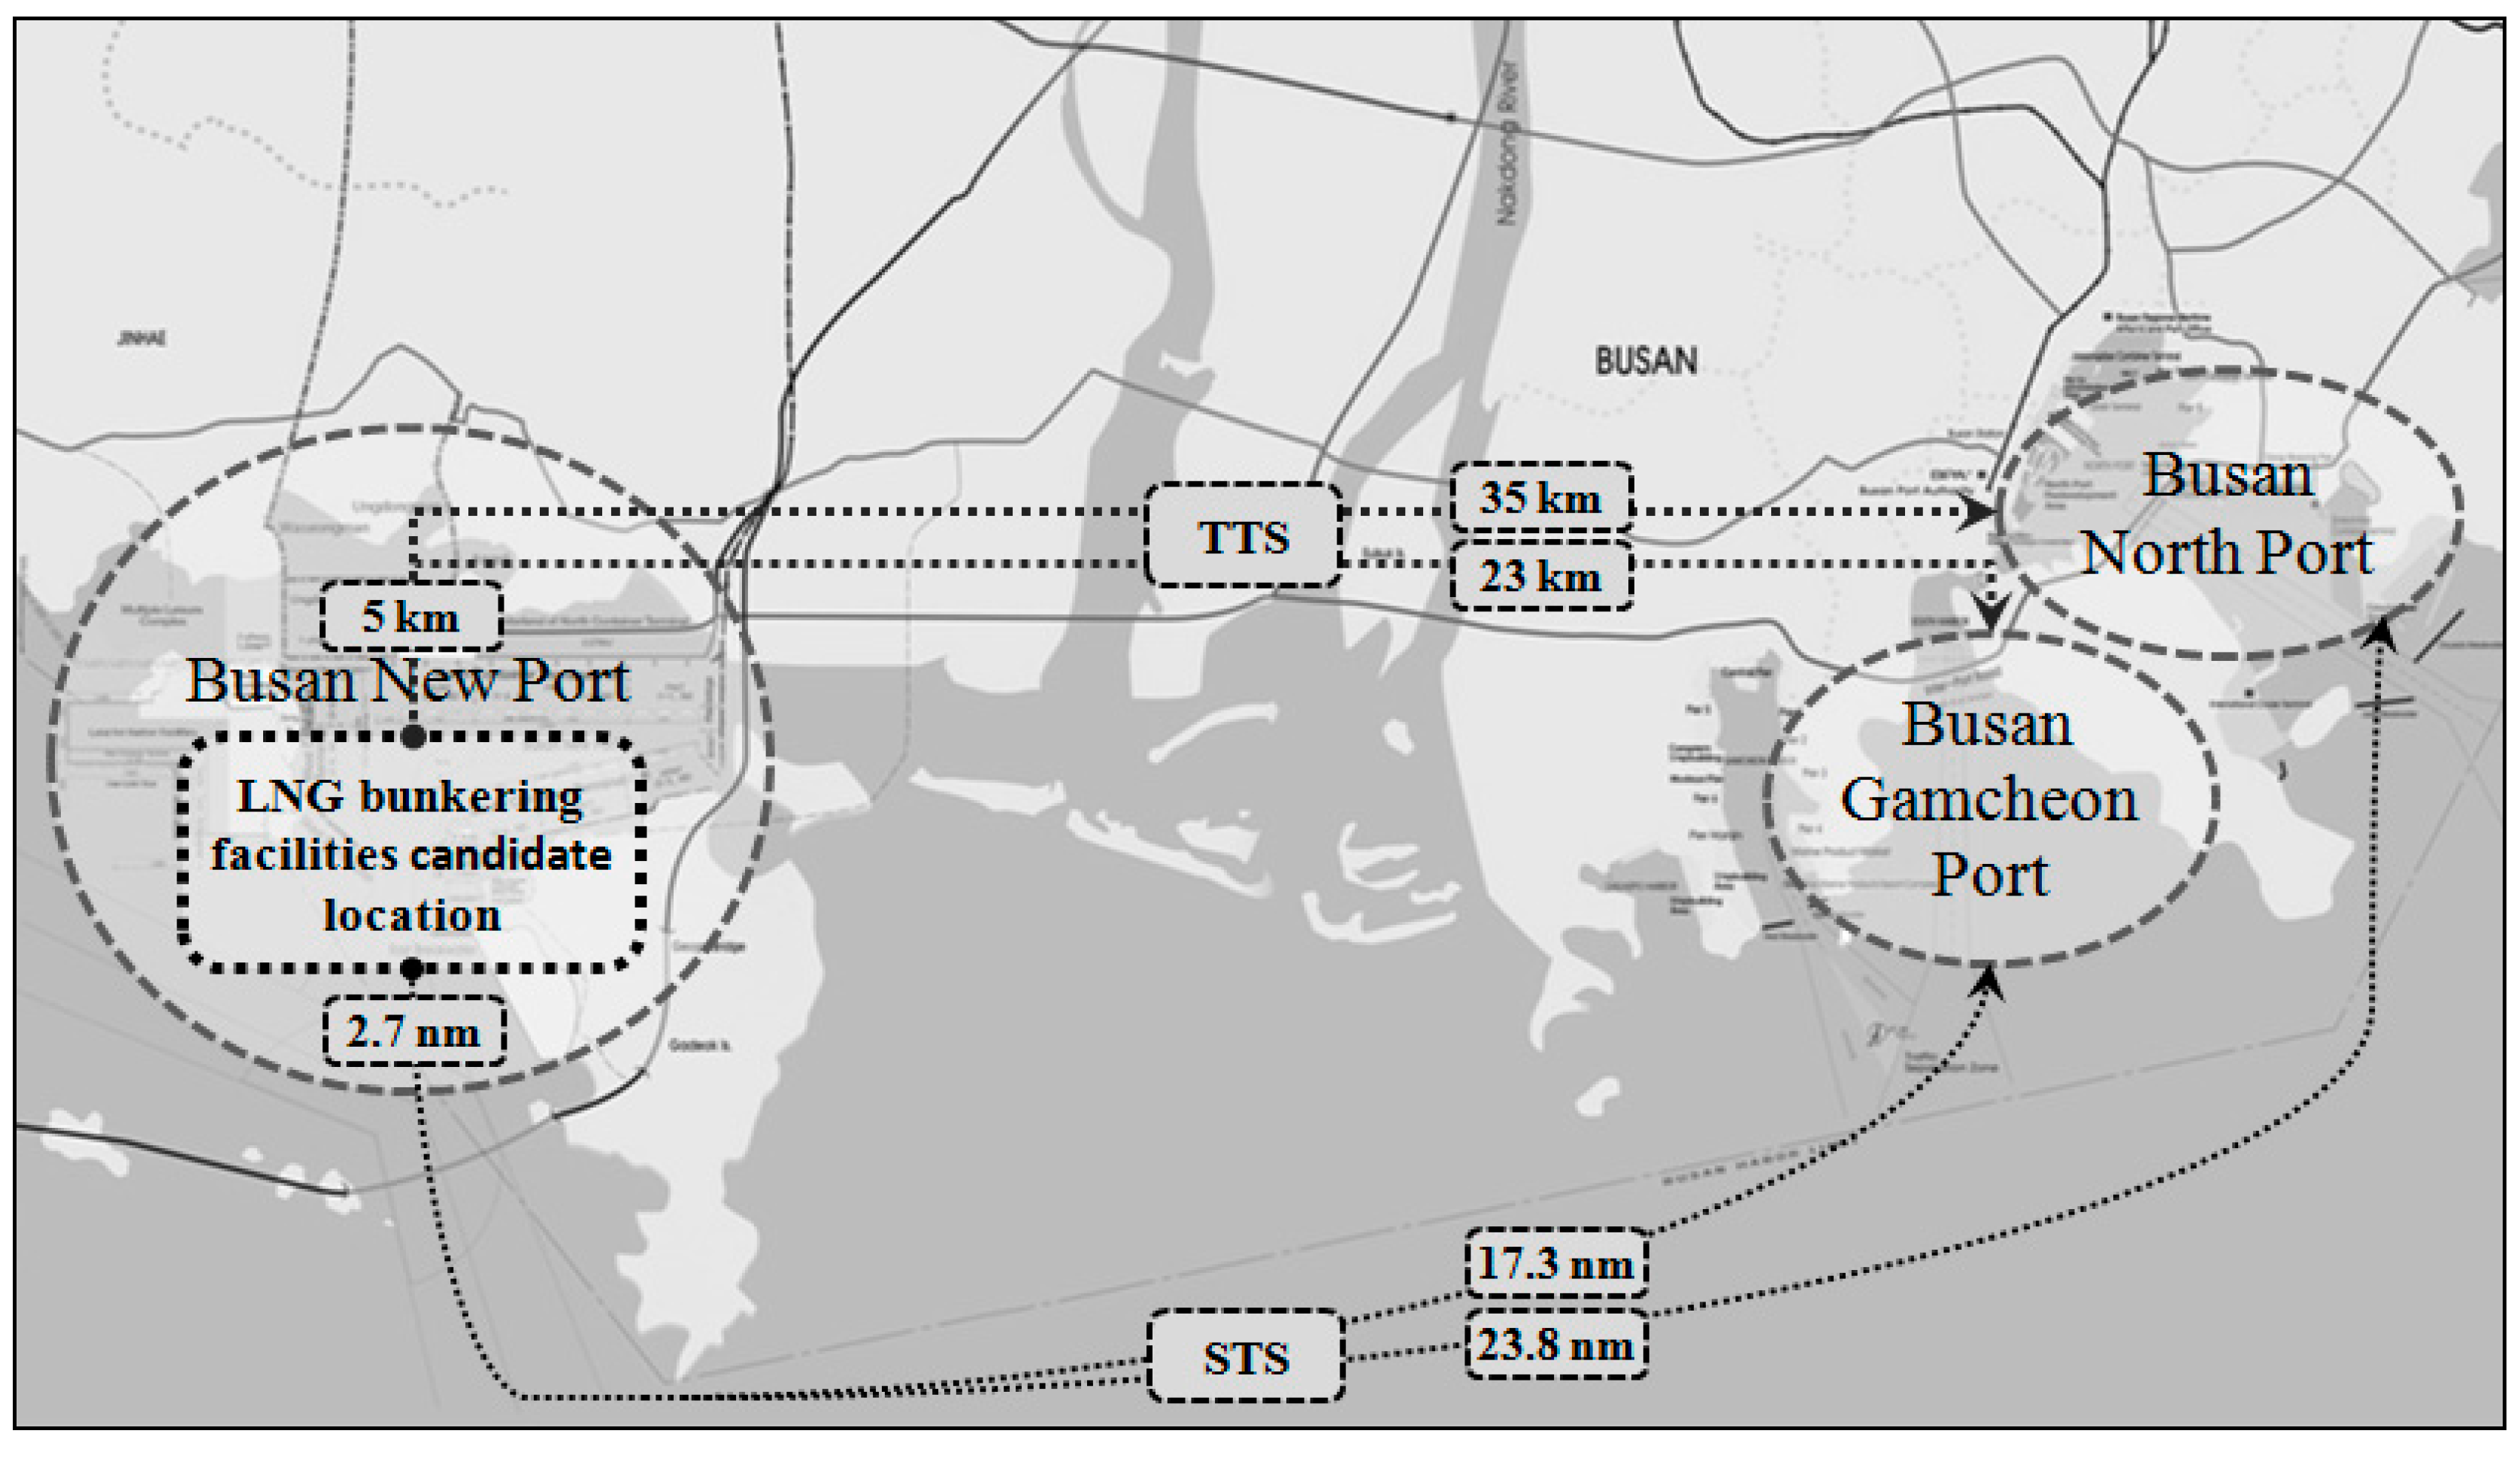
| Classification | Busan New Port (Yeondo) | Gamcheon Port (Joongang Pier) | North Port (Sinsundae Pier) | Average |
|---|---|---|---|---|
| Distance | 5 km | 23 km | 35 km | 21 km |
| LNGTL (truck) Speed | 40 km/h | |||
| Transit Time | 7.5 min | 34.5 min | 52.5 min | 31.5 min |
| 0.12 h | 0.58 h | 0.88 h | 0.53 h | |
| Classification | Busan New Port (Yeondo) | Gamcheon Port (Anchorage Area) | North Port (Shinsundae Pier) | Average | In Port |
|---|---|---|---|---|---|
| Distance | 5 km (2.7 nm) | 32 km (17.3 nm) | 44 km (23.8 nm) | 5 km (2.7 nm) | - |
| LNGBV Speed | 10 knots | 14 knots | - | 8 knots | |
| Transit Time | 16.2 min | 74.1 min | 101.8 min | - | 20.2 min |
| 0.27 h | 1.23 h | 1.70 h | 1.07 h | 0.34 h | |
| Classification | Required Time | Comment | |
|---|---|---|---|
| TTS Charging | Preparatory Time before Charging (min) | 5 min | Bunkering Station → LNGTL |
| Charging Time (min) | 56 min | ||
| Cleanup Time after Charge (min) | 5 min | ||
| Sub Total (a) | 1.1 h | ||
| TTS Bunkering | Preparatory Time before Bunkering (min) | 5 min | LNGTL → LNGFV |
| Bunkering Time (min) | 56 min | ||
| Cleanup Time after Bunkering (min) | 5 min | ||
| Sub Total (b) | 1.1 h | ||
| Total (= a + b) | 2.2 h | ||
| Classification | Required Time | Comment | |
|---|---|---|---|
| STS Loading | Berthing Time and Preparatory Time before Loading (min) | 60 min | Loading Arm System → LNGBV |
| Loading Time (min) | 282 min | ||
| Cleanup Time and Unberthing Time after Loading (min) | 60 min | ||
| Sub Total (a) | 6.70 h | ||
| STS Bunkering | Berthing Time and Preparatory Time before Bunkering (min) | 40 min | LNGBV → LNGFV |
| Bunkering Time (min) | 470 min | ||
| Cleanup Time and Unberthing Time after Bunkering (min) | 35 min | ||
| Sub Total (b) | 9.08 h | ||
| Total (= a + b) | 15.78 h | ||
| Classification | Japan | Far East | South East Asia | South West Asia | Middle East Asia | Europe | ||
|---|---|---|---|---|---|---|---|---|
| Representative Countries and Ports | Average Speed (knots) | Japan /Osaka | China /Shanghai | Singapore | India /Mumbai | Catarrh /Doha | Netherlands /Rotterdam | |
| Sailing Distance (knots) | - | 372 | 492 | 2503 | 4938 | 6111 | 10,791 | |
| Sailing Days (days) | Container, Cruiser | 22.0 | 0.70 | 0.93 | 4.74 | 9.35 | 11.57 | 20.44 |
| Tanker | 16.0 | 0.97 | 1.28 | 6.52 | 12.86 | 15.79 | 28.1 | |
| Bulker, General Cargo Ship | 15.0 | 1.03 | 1.37 | 6.95 | 13.72 | 16.98 | 29.98 | |
| Classification | Africa | North America | Middle South America | South America | Oceania | Other Countries | ||
|---|---|---|---|---|---|---|---|---|
| Representative Countries and Ports | Average Speed (knots) | South Africa /Cape Town | USA /LA | Mexico /San- Padito Port | Chile /San Antonio | Australia /Sydney | Brunei /Seria | |
| Sailing Distance (knots) | - | 7968 | 5230 | 6375 | 9883 | 4583 | 2004 | |
| Sailing Days (days) | Container, Cruiser | 22.0 | 15.09 | 9.91 | 12.07 | 18.72 | 8.68 | 3.80 |
| Tanker | 16.0 | 20.75 | 13.62 | 16.6 | 25.74 | 11.93 | 5.22 | |
| Bulker, General Cargo Ship | 15.0 | 22.13 | 14.53 | 17.71 | 27.45 | 12.73 | 5.57 | |
| Classification | Values | Remarks | |
|---|---|---|---|
| Port Name | Busan Port | PORT-MIS of MOF in Korea | |
| Analysis Period | Jan. 1, 2018–Dec. 31, 2018 | 1 year | |
| Count of Arrival Ships in 2018 | 27,310 | Ocean-going Vessels | |
| Analysis Tool | Data Analysis | Input Analyzer | Rockwell Automation Co. Ltd. (USA) |
| Simulation Modeling | Arena Version 12.4 | ||
| Statistical Distribution Summary | Probability Distribution | Exponential | |
| Arrival Formula | -0.001 + EXPO (19.1) | Unit: Min. | |
| Deviation | 0.000177 | Square Error | |
| Classification | Description | Source | |
|---|---|---|---|
| Input Variables | Arrival Formula | Arrival distribution | Table 15 |
| Ratio of 16 Ship Types | Percentage by 16 Ship Types | Appendix A Table A4. | |
| Ratio of 12 Voyage Areas | Percentage of 12 Navigation Zones | ||
| Gross Tonnage per Ship Types & Voyage Areas | 12 Types of Navigation Zones by Type of Ship | Distribution | |
| Increase Rate of Gross Tonnage | Gross Tonnage Increase Rate | Table 7 | |
| Conversion Ratio to LNGFVs | Conversion rate to LNG fueled vessels | Table 3 | |
| Output Variables | Count of Ship Arrivals | Number of Calling Ships | |
| Time of Entry | Arrival Time | ||
| Ship Type 1 | 16 Ship Types | ||
| Ship Type 2 | 5 Ship Types | ||
| Voyage Area | 12 Navigation Zones | Table 13 and Table 14 | |
| Gross Tonnage | Percentage of 12 Navigation zones | ||
| Ship Average Speed (knots) | Average Speeds by 5 Ship Types | Table 5 | |
| Representative Port of Voyage Area | - | Table 13 and Table 14 | |
| LNG Consumption per Day (ton) | - | Equations (32)–(35) | |
| One-way Voyage Distance (km) | - | Table 13 and Table 14 | |
| One-way Sailing Day (day) | - | Table 13 and Table 14 | |
| One-way LNG Consumption (ton) | - | - | |
| Round-trip sailing distance (km) | - | Table 13 and Table 14 | |
| Round-trip sailing day (day) | - | Table 13 and Table 14 | |
| Round-trip LNG consumption (ton) | - | - | |
| Whether to use LNG Fuel | - | Table 3 | |
| Bunkering Type | - | TTS or STS | |
| Number of Supply of TTS | - | TTS Case | |
| Number of LNGTLs | Number of TTS Bunkering Tank Lorries | " | |
| Number of Supply of STS | - | STS Case | |
| Number of LNGBVs | Number of STS Bunkering Shuttle Vessels | " | |
| Year | Count of Arrival Ships | LNG Fuel Requirements (ton) | STS | TTS | ||
|---|---|---|---|---|---|---|
| Number of Supply | Number of LNGBVs | Number of Supply | Number of LNGTLs | |||
| 2025 | 27,879 | 380,884 | 395 | 155.62 | 1970 | 4196.08 |
| 2030 | 28,037 | 2005,683 | 1894 | 826.08 | 8547 | 21,120.92 |
| Year | Arrival Formula (Unit: min) | Count of Arrival Ships | Average Gross Tonnage | ||||||
|---|---|---|---|---|---|---|---|---|---|
| Estimation (a) | Simulation (b) | Accuracy (b/a*100%) | Variation | Estimation (c) | Simulation (d) | Accuracy (d/c*100%) | Variation | ||
| 2018 | -0.001 + EXPO (19.1) | 27,636 | 27,452 | 99.33% | -0.67% | 24,116 | 24,177 | 100.25% | +0.25% |
| 2025 | -0.001 + EXPO (18.8) | 27,739 | 27,879 | 100.50% | +0.50% | 30,648 | 31,281 | 102.07% | +2.07% |
| 2030 | -0.001 + EXPO (18.7) | 27,812 | 28,037 | 100.81% | +0.81% | 35,313 | 36,384 | 103.03% | +3.03% |
| Year | Prediction (a) | Simulation (b) | Accuracy (b/a*100%) | Variation |
|---|---|---|---|---|
| 2025 | 380,000 tons | 380,884 tons | 100.02% | +0.02% |
| 2030 | 2,005,000 tons | 2,005,683 tons | 100.03% | +0.03% |
| Classification | Detailed Items | Symbols | Unit | Specifications | Facilities Required | |||
|---|---|---|---|---|---|---|---|---|
| Unit | 2025 | 2030 | ||||||
| Land Facilities | LNG Storage Tank | (a) | m3 | 270,000 | EA | 1 | 3 | |
| TTS (Bunkering Station) | Chargers | (b) | ton/min | 0.25 | EA | 2 | 6 | |
| Tank Lorries (LNGTLs) | (c) | ton(m3) | 14(30) | EA | 5 | 27 | ||
| Parking Facilities | (d) | EA | - | EA | 5 | 27 | ||
| Offshore Facilities | LNG carriers (LNGC) | Mooring Facilities | (e) | G/T | 160,000 | Berth | 1 | 1 |
| STS (Bunkering Shuttle Vessel) | Jetty Berth | (f) | m3 | 5000 | Berth | 1 | 1 | |
| Loading Arm System | (g) | ton/hour | 500 | EA | 1 | 1 | ||
| Bunkering Shuttle Vessels (LNGBVs) | (h) | m3 | 5000 | EA | 1 | 3 | ||
| Mooring Facilities | (i) | G/T | 7,400 | Berth | 1 | 3 | ||
| Total | EA | 18 | 72 | |||||
© 2019 by the authors. Licensee MDPI, Basel, Switzerland. This article is an open access article distributed under the terms and conditions of the Creative Commons Attribution (CC BY) license (http://creativecommons.org/licenses/by/4.0/).
Share and Cite
Park, N.K.; Park, S.K. A Study on the Estimation of Facilities in LNG Bunkering Terminal by Simulation—Busan Port Case. J. Mar. Sci. Eng. 2019, 7, 354. https://doi.org/10.3390/jmse7100354
Park NK, Park SK. A Study on the Estimation of Facilities in LNG Bunkering Terminal by Simulation—Busan Port Case. Journal of Marine Science and Engineering. 2019; 7(10):354. https://doi.org/10.3390/jmse7100354
Chicago/Turabian StylePark, Nam Kyu, and Sang Kook Park. 2019. "A Study on the Estimation of Facilities in LNG Bunkering Terminal by Simulation—Busan Port Case" Journal of Marine Science and Engineering 7, no. 10: 354. https://doi.org/10.3390/jmse7100354