1. Introduction
Developing alternative water resources through the use of desalination is important to human activities. However, desalination technologies are inherently energy-intensive, with the majority of processes requiring high levels of electricity consumption. Further, in many areas where water is scarce, electricity prices are also high, for example, in California, or areas with limited electrical grid connection (e.g., Hawaii, small islands and isolated coastal communities). Thus, reverse osmosis (RO) has been the most commonly-used desalination process because of the lower energy consumption than traditional thermal processes, which, among other reasons, makes RO one of the most promising near-term desalination approaches. However, RO still requires a great amount of energy to create the pressure needed to generate freshwater through the reverse-osmosis membranes.
A wave energy converter (WEC) system has the potential to convert wave energy directly into the high-pressure flow that is needed by the RO system and to eliminate the electricity production process to reduce potentially the cost of water. Wave energy has gained great interest in recent years because of its energy resource potential [
1,
2]. In addition, by opening new markets, wave-powered desalination may provide opportunities to further advance WEC technologies for both water and electricity generation. Areas such as structural and hydrodynamic designs, foundation and mooring configurations and balance of plant will provide significant technology learning that will advance the state of the art in WEC design leading to future cost reductions. In niche markets, such as island communities, military bases and areas with unreliable grid connections, WEC-powered desalination can provide a near-term solution that is not affected by the volatile pricing and risk associated with diesel fuel and fuel delivery. Several designs have been proposed to develop wave-powered desalination plants in the past 30 years, for example a linear-pump-based buoy system (Delbuoy) in the 1980s [
3], an oscillating water column-type of WEC in India in 2004 [
4] and, more recently, a fixed-bottom flapper design from Resolute Marine [
5]. Folley et al. showed how a bottom-fixed flapper type of WEC design can be used to drive the RO process, and the case study was demonstrated for a typical wave environment [
6]. An associated techno-economic analysis was performed to demonstrate the economic potential of the system [
7]. A case study on the application of WECs for desalination has been also carried out to evaluate its potential to reduce the environmental impact in Sicily, Italy [
8,
9,
10]. More details on projects of freshwater production using wave energy were recently reviewed by Leijon and Boström and documented in [
11].
Yu and Jenne [
12] presented a preliminary study on the potential levelized cost of water (LCOW) for California, which showed a similar LCOW as compared to the value estimation for the United Kingdom provided by Folley et al. [
7]. In the study, the WEC and hydraulic interaction was simulated using a wave-to-water numerical model. The model simulated both the device hydrodynamics and reverse-osmosis process and was developed from WEC-Sim, which is a time-domain, radiation-and-diffraction-method-based numerical tool [
13]. WEC-Sim has been used to simulate a wide range of WEC designs, and the simulation results have been verified and validated against those produced from other numerical models and experimental measurements [
13]. Directly coupling the hydrodynamic model with a solution-diffusion model to simulate the reverse-osmosis process provides a useful tool for investigating the potential water-generation performance of the wave-powered desalination system (WPDS), as well as for evaluating the sizing and loading of the components in the system.
The RO model was further improved and verified in this study, where the RO model was characterized based on a commercial off-the-shelf membrane and the membrane manufacturer’s model, which has been widely used to design and simulate traditional RO systems. The objective of this research is to evaluate the dynamics of WPDS design using the fully-coupled wave-to-water model and to investigate the overall efficiency for a range of wave conditions and for a multiple-WECs-coupled RO system. The article first describes the wave-to-water modeling methods. Next, it presents a validation study of the hydrodynamics model, followed by a verification study for the solution-diffusion model. Then, the wave-to-water model specification and the analysis of the overall efficiency of the system under various wave conditions and for a multiple-WECs-coupled RO system are presented. Last is a discussion on the potential dynamic impact of pressure and flow rate fluctuation on the RO system performance, as well as different options to reduce the fluctuation and associated trade-offs.
2. Wave-Powered Desalination System
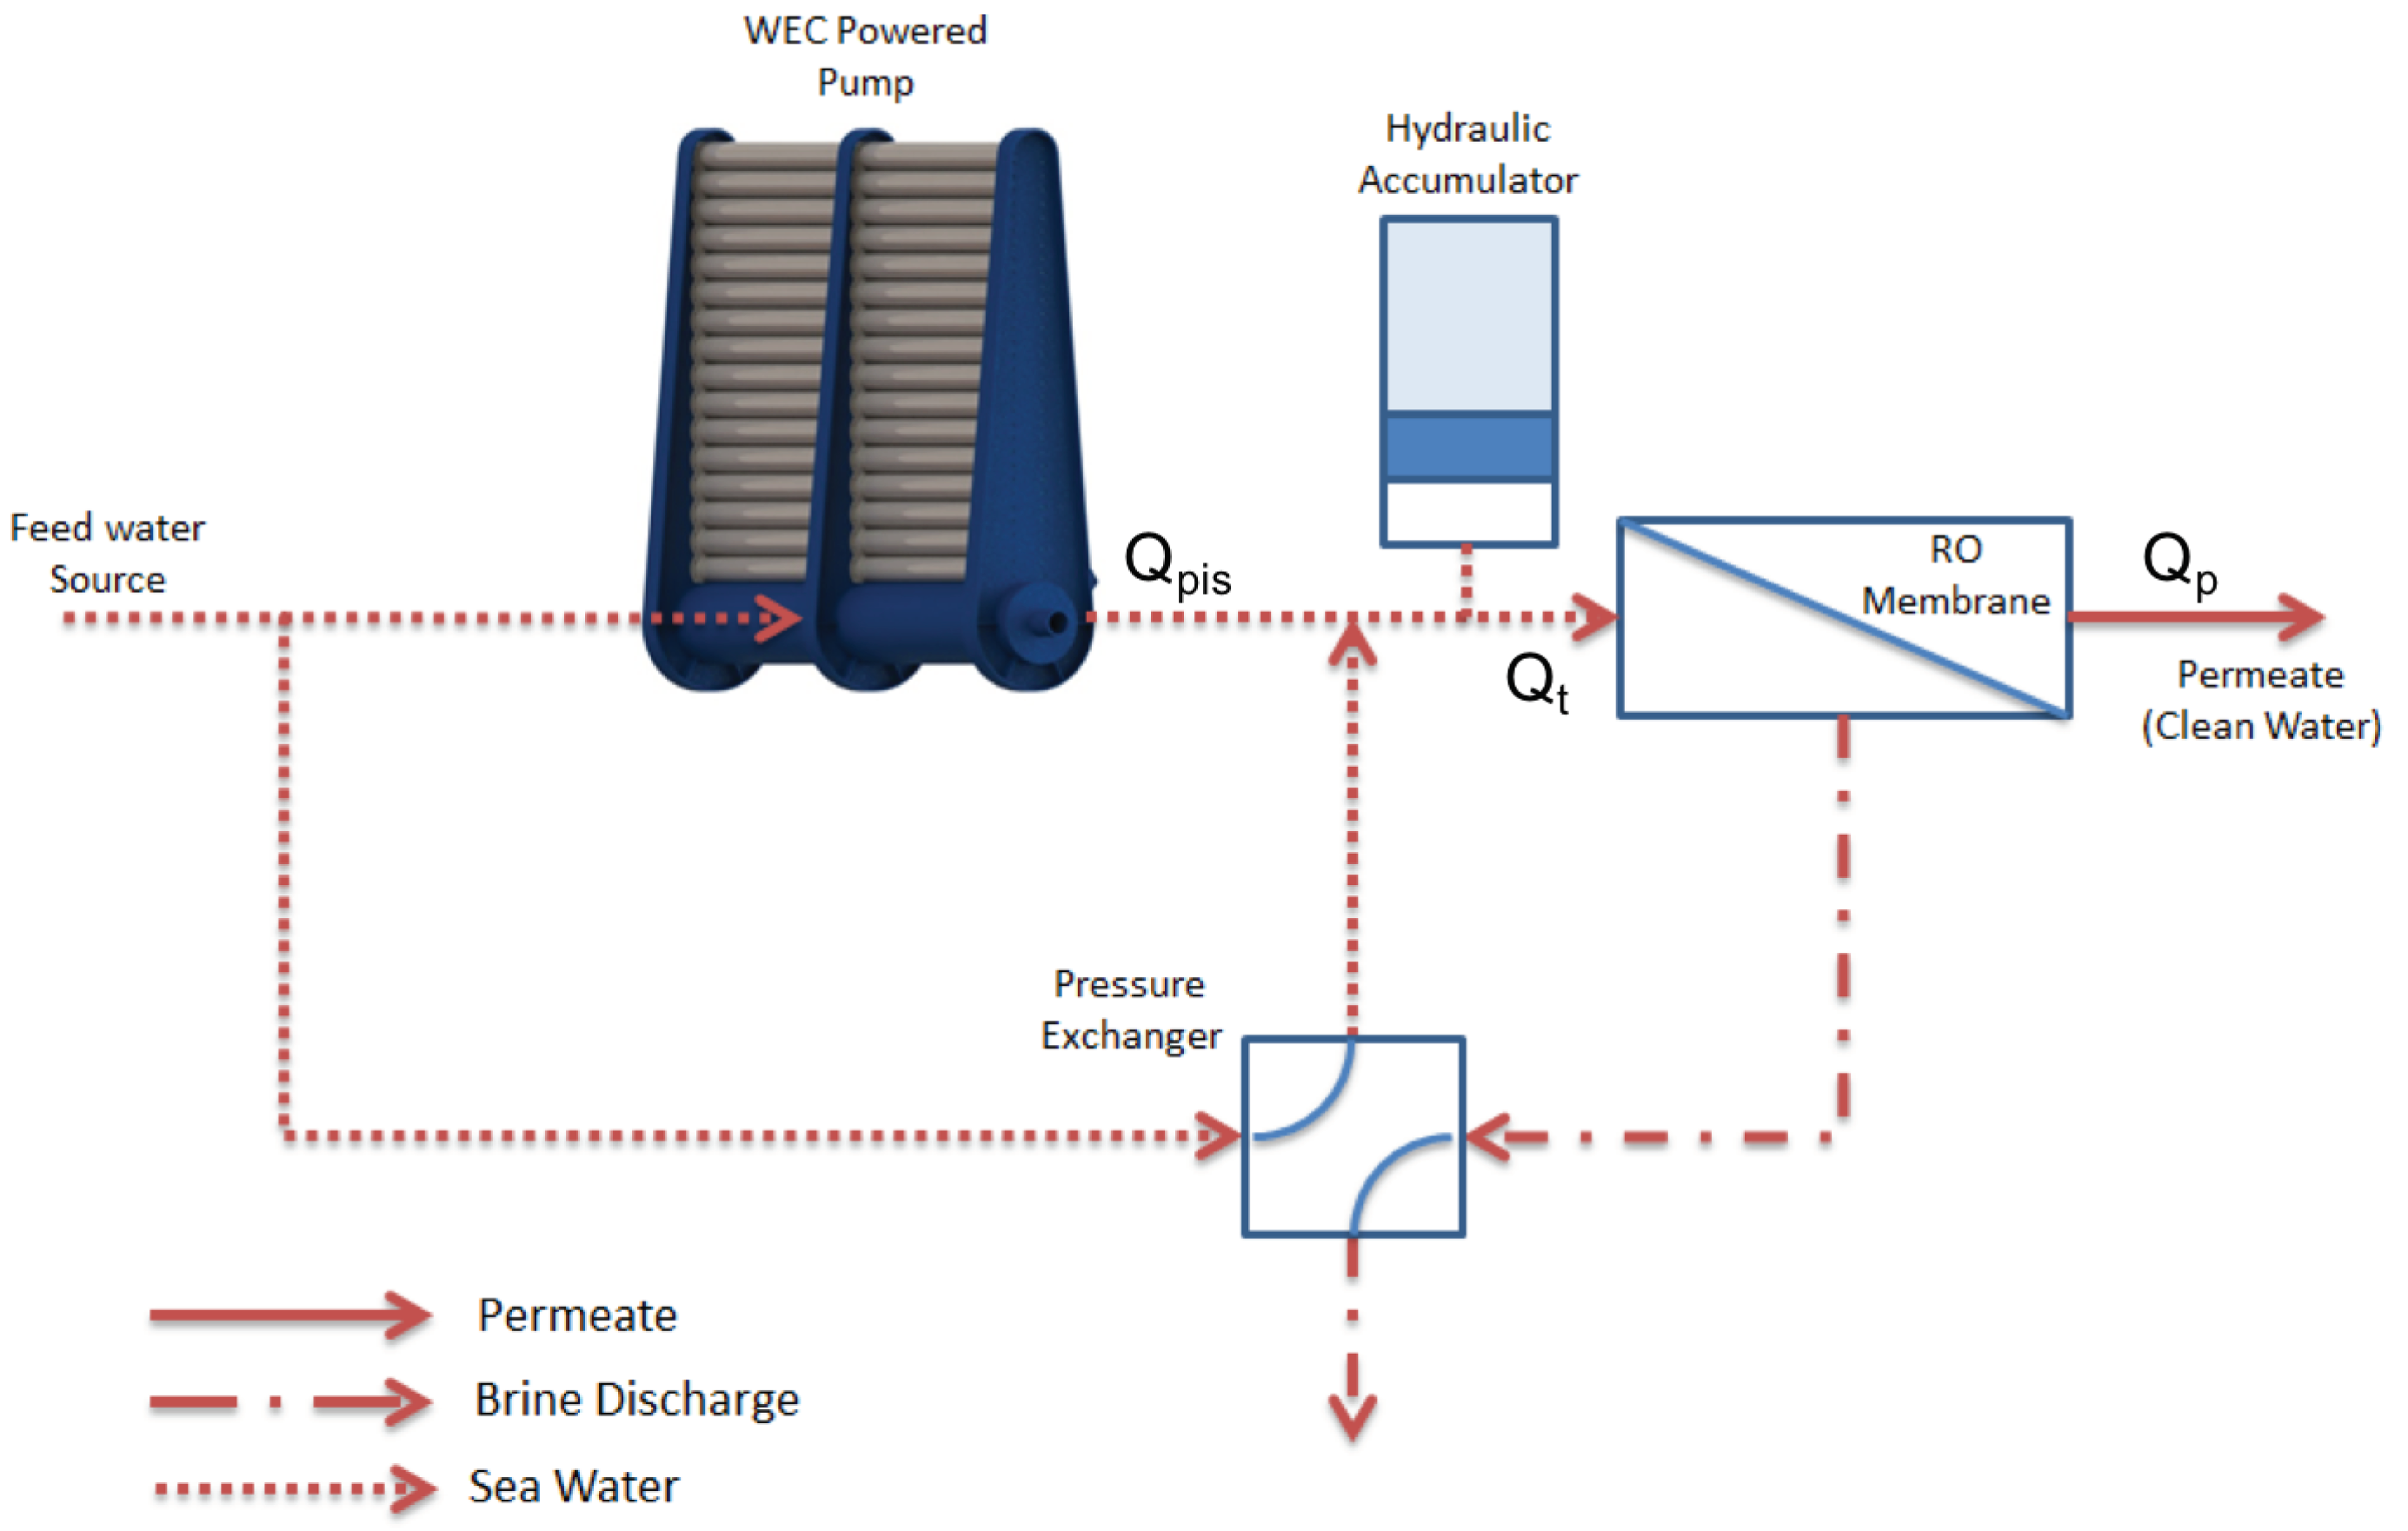
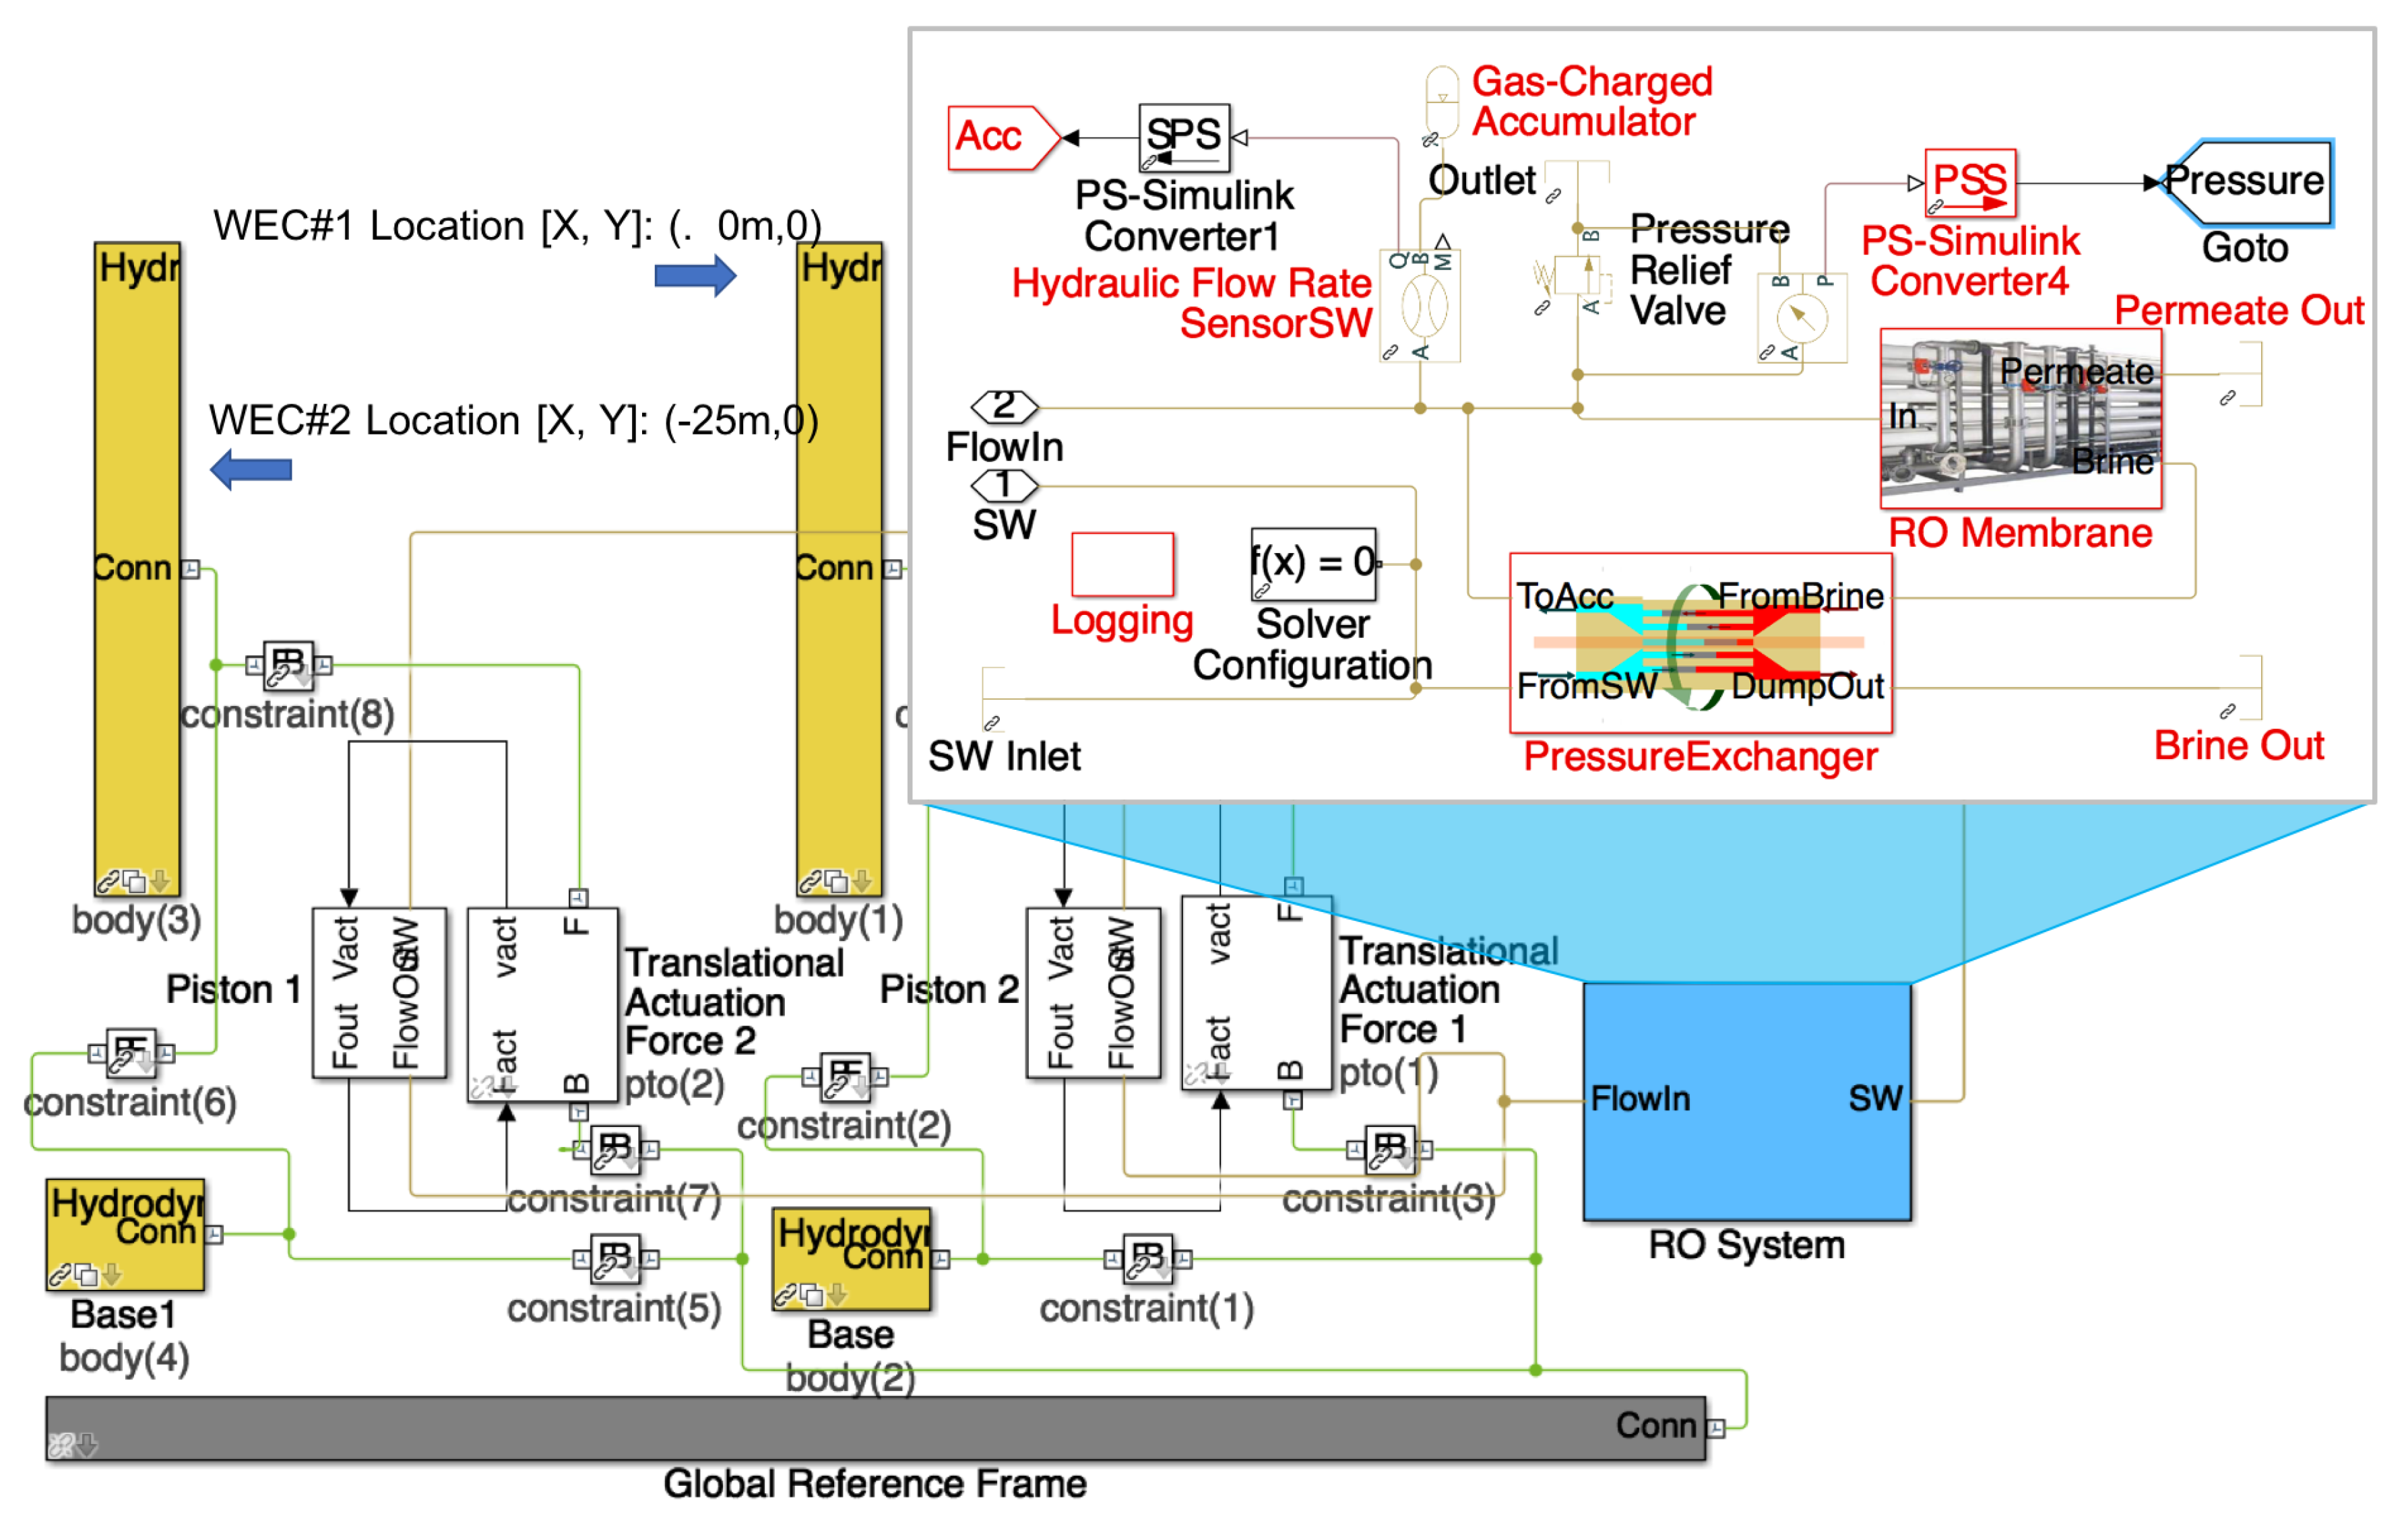
The WPDS consists of a bottom-hinged oscillating surge wave energy converter (OSWEC), a set of reverse-osmosis membranes, a pressure exchanger and an accumulator.
Figure 1 shows the schematic representation of the system, which was adopted based on the designs from Folley and Whittaker [
7] and Sarai Atab et al. [
14]. The OSWEC captures wave energy from the relative rotational motion between the flap and the fixed base. This process is used to create the required hydraulic pressure to compensate the osmotic pressure difference and the resistance caused by the membrane and fouling layers if the latter exist. The accumulator was used to minimize the pressure and flow variation induced by the flap’s oscillatory motion, and the pressure exchanger (an energy recovery unit) was included to recover the energy loss from the rejected brine to pump additional seawater back to the system. Note that the WPDS presented here is a pure mechanical system; therefore, the research does not consider any electricity production.
3. Methodology
This section describes the numerical methods used for modeling the hydrodynamics of the WEC (WEC-Sim) and for the reverse-osmosis desalination process.
3.1. WEC Hydrodynamics
WEC-Sim is a time-domain numerical model for solving the system dynamics of WECs that consist of multiple bodies, power-take-off (PTO) systems and mooring systems [
13]. The dynamic response in WEC-Sim is calculated by solving the equation of motion for each body about its center of gravity, based on Cummins’ equation [
15], which can be written as:
where A
is the added mass matrix at infinite frequency, X is the (translational and rotational) displacement vector of the body,
m is the mass matrix, K is the matrix of impulse-response function,
,
,
,
and
are the vector of the wave-excitation force, external force, mooring force, quadratic viscous drag term calculated using Morison’s equation and net buoyancy restoring force. The external force includes the PTO force, multibody constraint forces and the resisting force from the RO system. Simulations are performed in the time domain by solving the governing equations of motion in 6 degrees of freedom for each body. In this study, we used WAMIT [
16]—which is a boundary-element-method-based frequency-domain potential flow solver—to obtain the added mass, wave excitation, impulse-response function and restoring stiffness terms. The RO membrane resisting force was obtained from the RO desalination model.
3.2. Reverse-Osmosis Desalination
To simulate the RO process, which generates permeate flow through a membrane, a solution-diffusion model was developed. The model assumes that the permeate flow
is primarily dictated by the net driving pressure, which is equal to the incoming feed pressure (
) minus the difference in osmotic pressure (
) over the membrane [
14],
where
is the permeability coefficient, depending on the membrane permeability, temperature and fouling factor, and
is the membrane active surface area. Furthermore, based on the model, the solute concentration in the permeate can be expressed as:
where
is the solute concentration in the membrane (seawater side) and
is the solute transport parameter.
4. Numerical Model
This section describes the mass properties of the WEC, the WEC-Sim hydrodynamic model, the developed RO desalination model and the verification and validation of the two models.
4.1. WPDS Model and Mass Properties
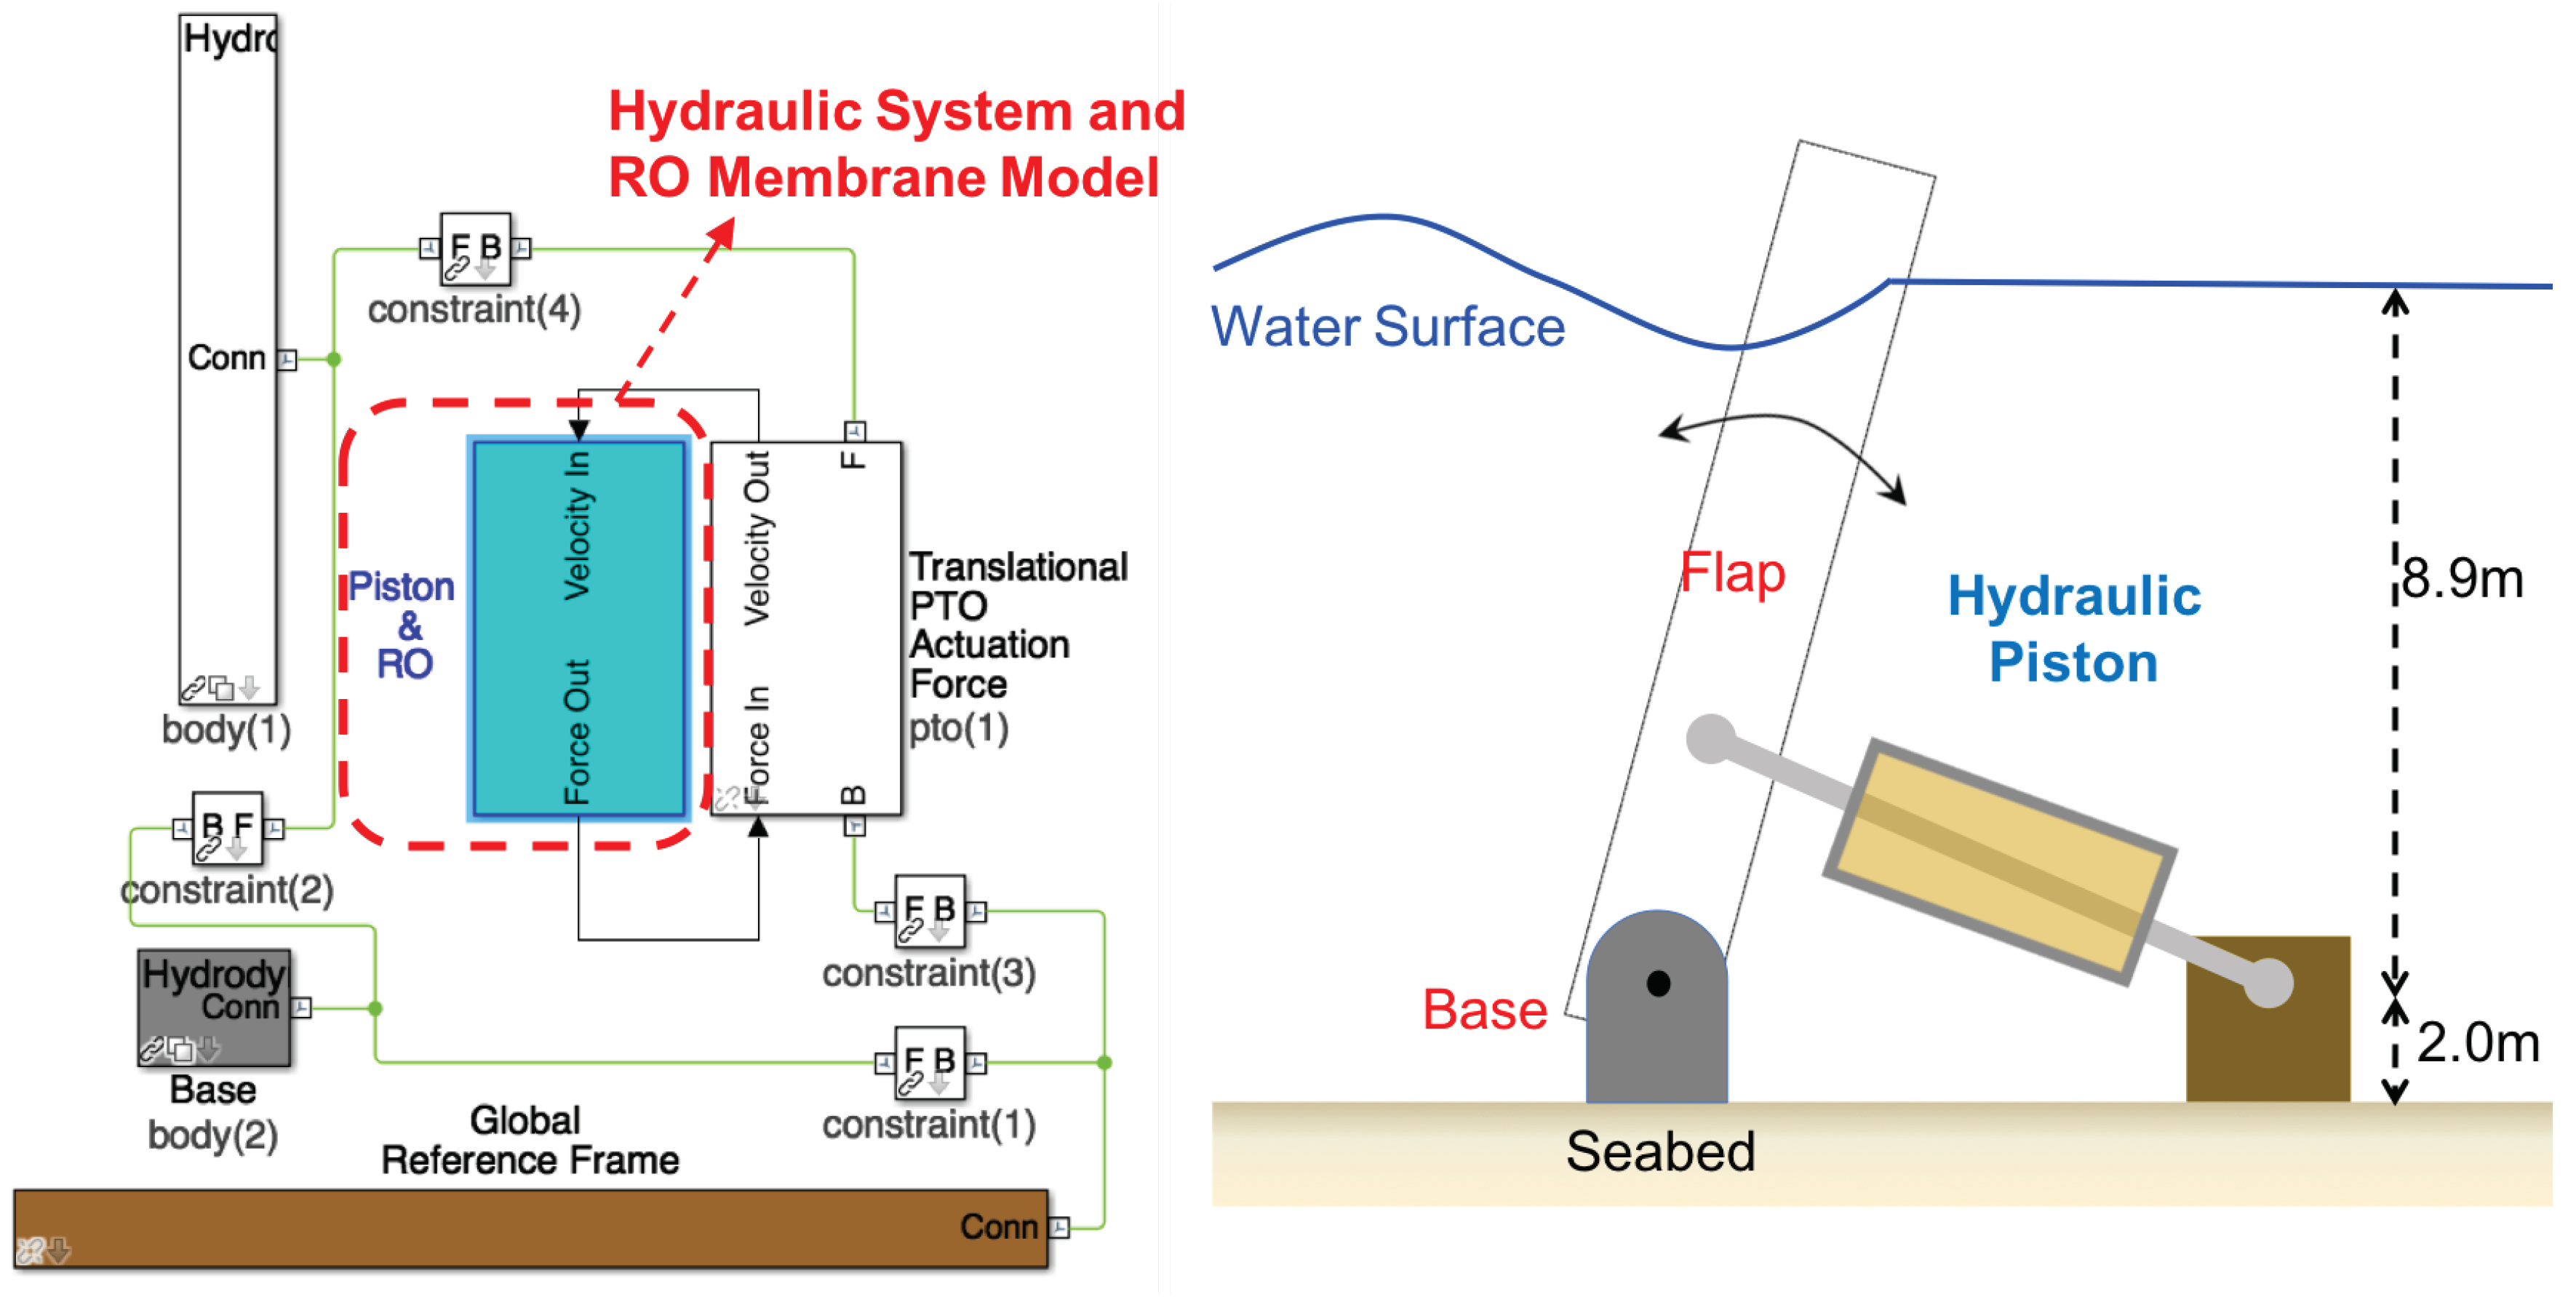
We analyzed the performance of the wave-powered RO desalination system using the developed wave-to-water numerical model, as shown in
Figure 2. The WEC-Sim hydrodynamic model and the RO desalination model were developed using the MATLAB SimScape Multibody and SimScape Fluids toolboxes. The simulated bottom-hinged OSWEC contains a flap and a base, where the top of the flap is 2.1 m above the mean water surface (MWS).The flap and the base are connected using a rotational joint. The flap is also connected to a linear hydraulic piston to convert the wave-induced torque to linear force to pump seawater through the RO membrane. The dimensions and mass properties for the OSWEC (in full scale) are listed in
Table 1 and are given based on the values from van’t Hoff [
17].
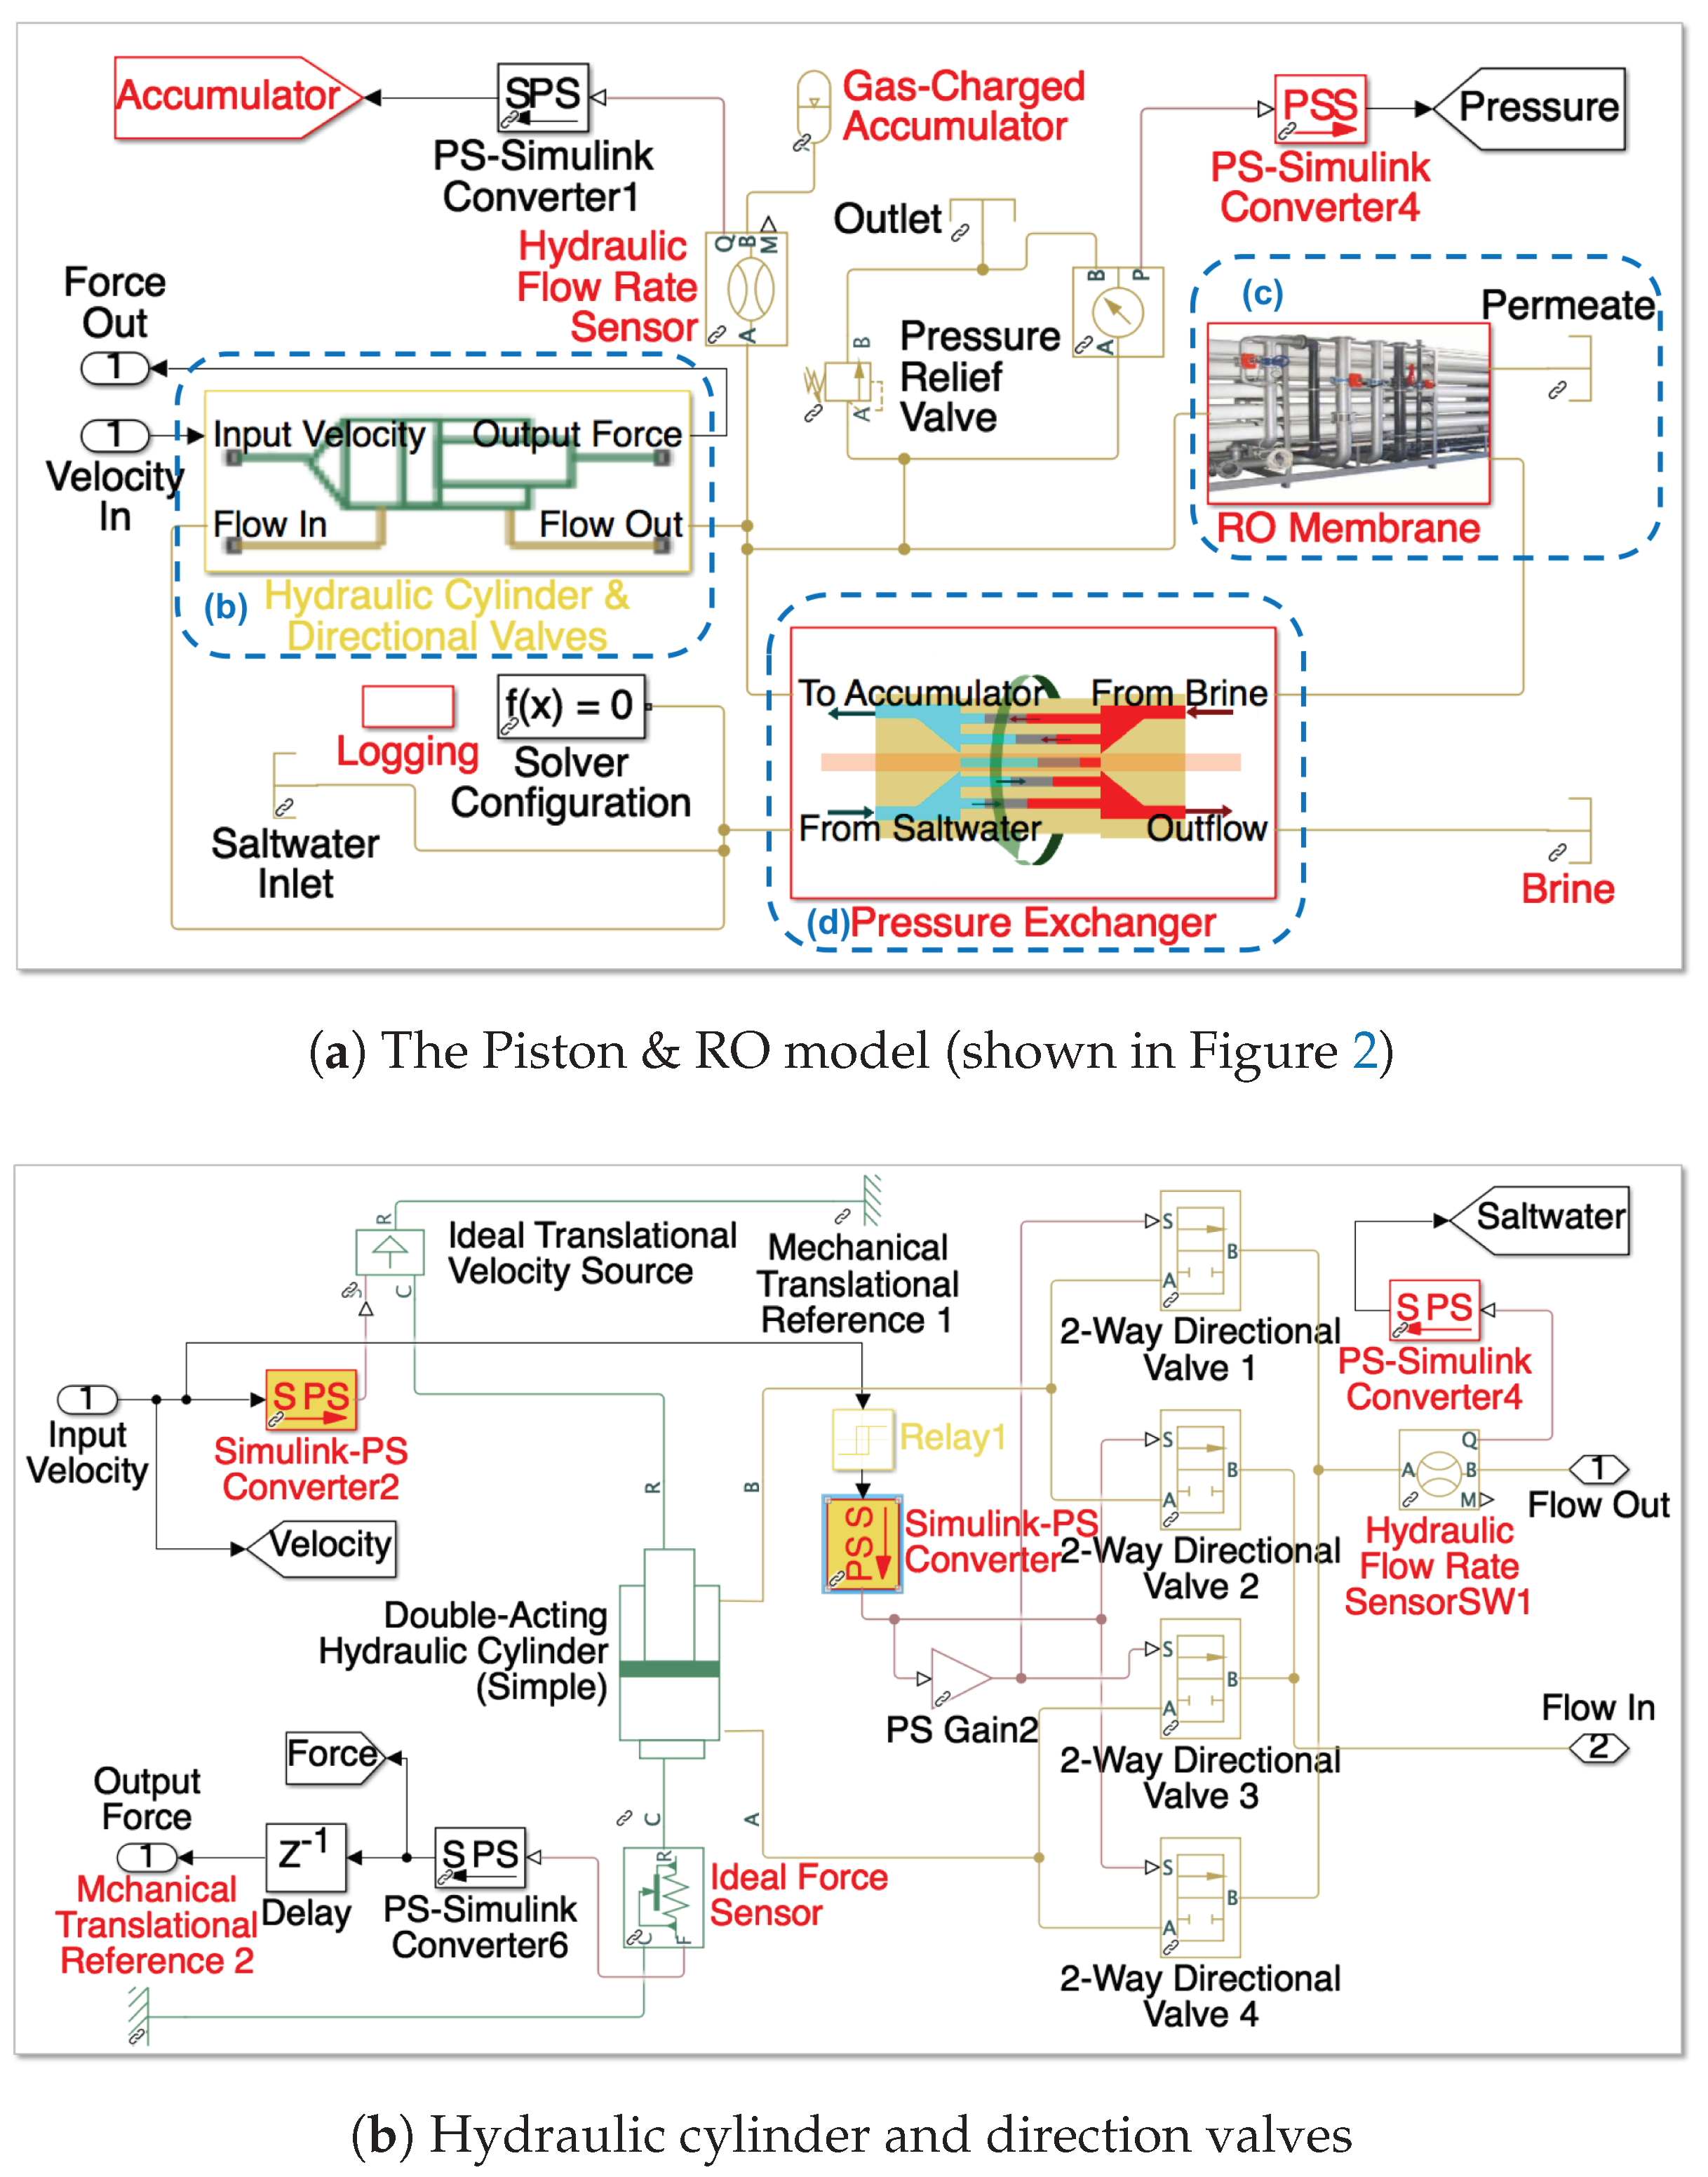
Figure 3 shows the hydraulic component inside the “Piston and RO” block from the WEC-Sim model (as shown in
Figure 2). The hydraulic system consists of a set of subsystems, including a dual-acting hydraulic cylinder, a set of directional valves, a gas-pressure accumulator, a pressure-relief valve, sets of RO membranes and a pressure exchanger. The RO membrane model was developed using Equation (
2). Note that the gas-pressure accumulator and the pressure-relief valve are essential to mitigate the pressure fluctuation to keep the WPDS operating at a pressure level that is within the designed membrane operational range, which will be described in greater detail in a later section.
A pressure exchanger—also known as an energy recovery device—is used to recover energy from the high-pressure brine exiting the membrane. The pressure drop from the membrane inlet to the brine discharge is typically less than 1 bar. The pressure exchanger in this study is a variant of the hydraulic turbocharger model. The hydraulic turbochargers are commonly modeled as a centrifugal turbine that is directly coupled to a centrifugal pump [
18], as shown in
Figure 3. In this study, the centrifugal turbine was replaced with a positive displacement motor, and the centrifugal pump was replaced with a positive displacement pump. This configuration can be tuned to the desired pressure by adjusting the ratio between the motor and pump displacement.
The hydrodynamics and hydraulics are simulated using different time-step sizes to improve the coupling efficiency. The numerical model solves the equation of motion for each WEC body in the time-domain module using a fourth-order Runge–Kutta algorithm with a given fixed time-step size. Conversely, the hydraulics and RO system are solved using a variable time-step method.
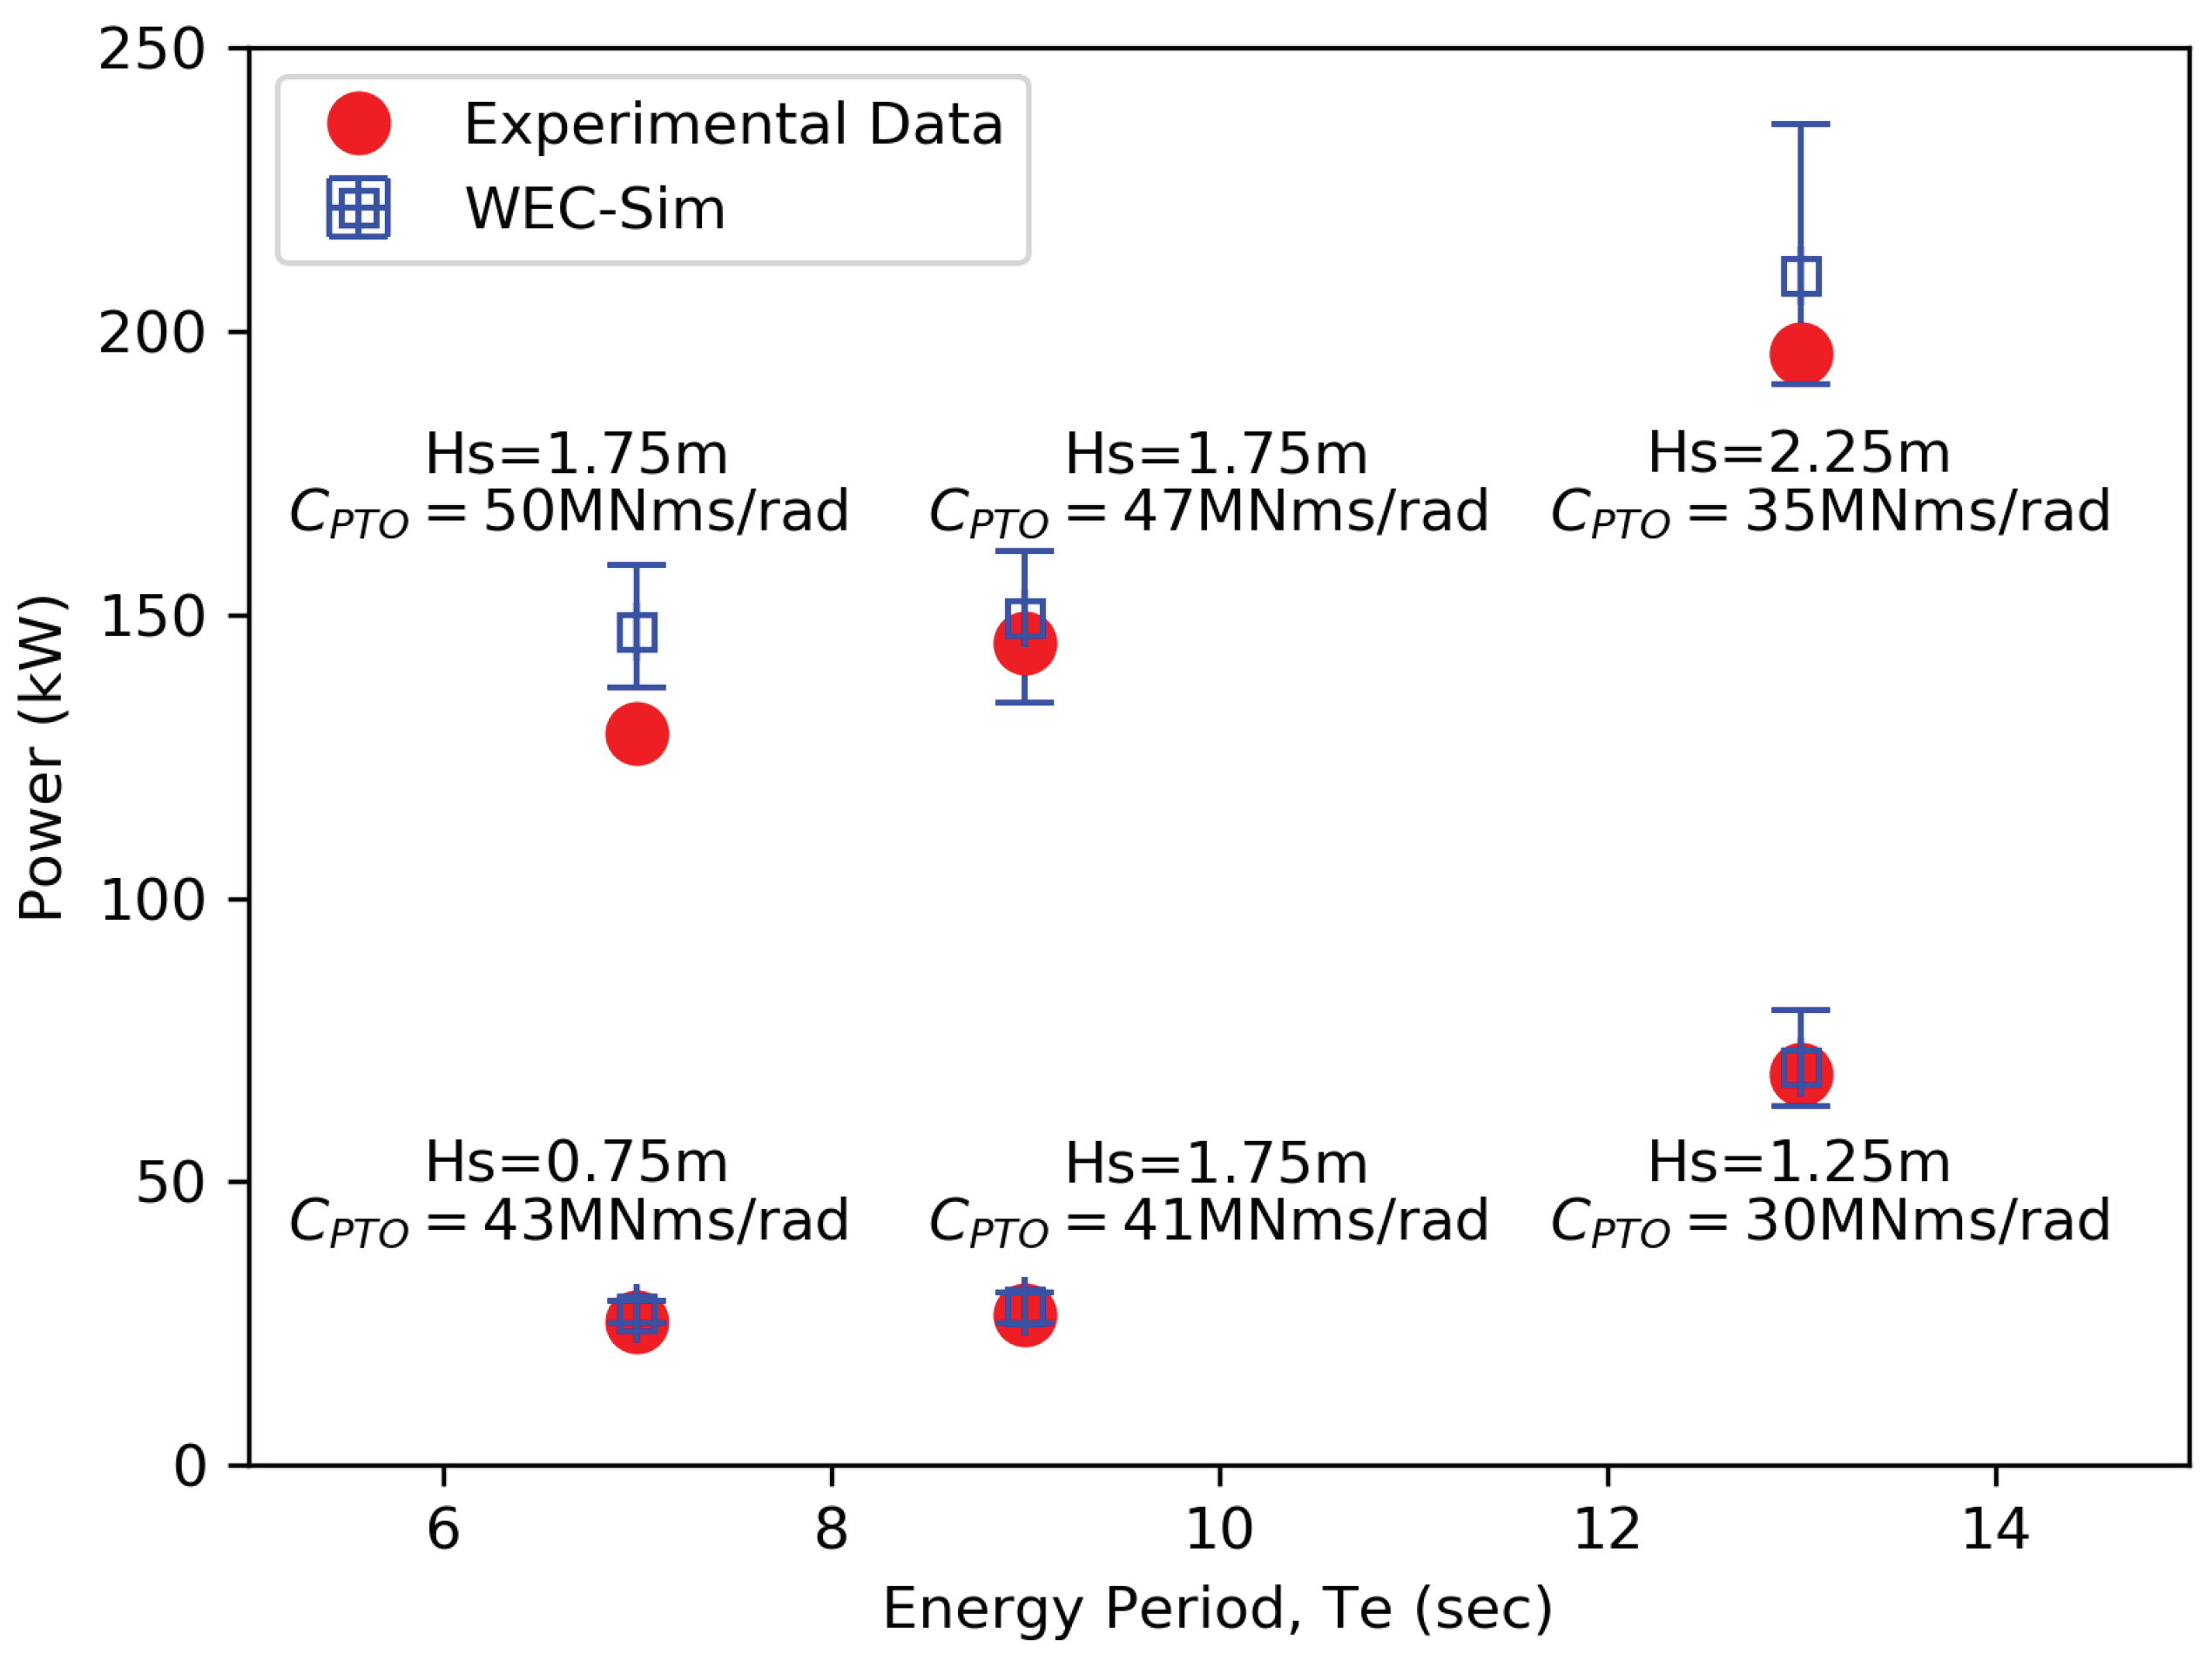
4.2. Hydrodynamic Model Validation
To validate the WEC-Sim model, the OSWEC was first simulated in WEC-Sim without the rotary-to-linear adjustable rod to match experimental test settings, where the power take-off (PTO) was represented using a rotary damper in the WEC-Sim model. The predicted averaged mechanical power values were compared to the measurements from the 1/20 model-scale wave tests, reported by van’t Hoff in his experimental study [
17]. To account for the effect of viscosity on the WEC hydrodynamics, the flap was represented by five Morison elements in the vertical direction with a drag coefficient of
specified for the direction normal to the flap surface. The irregular wave environments were simulated using the Bretschneider spectrum and sampled with 10 realizations for each sea state. Each simulation was 2000 s long, with a ramp time of 250 s and a time-step size of 0.01 s. Only the results from the last 1500 s were used for calculating the time-averaged power output.
Figure 4 shows a comparison between the averaged WEC-Sim results and van’t Hoff’s measurement data, wherein power is plotted against the energy period, Te, for various significant wave heights, Hs, and PTO damping coefficients,
. An error bar was calculated from the 10 realizations, and it represents the 95% confidence interval of the mean value. Overall, the WEC-Sim simulation results agreed well with those from the experimental data. The averaged power output from WEC-Sim for all sea states is within 12% of the experimental value.
4.3. RO Model Characterization and Verification
Typically, the RO system comes with a series of pressure vessels that house a set of RO membranes. For some applications, multiple stages of RO membranes are used in series to produce the required water quality. These design considerations affect the overall permeability of the RO system and the values of the parameters given in Equations (
2) and (
3). This study assumes a single-pass RO system with three off-the-shelf membranes (SW30HR-380) in each pressure vessel. It also assumes that the concentration polarization effect on the membrane is negligible to simplify the analysis. To characterize our RO model and obtain the parameters, we used a water application value engine (WAVE) model. WAVE is a water-treatment design tool developed by the Dow Chemical Company that can be used to evaluate a combination of RO, ultrafiltration (UF) and ion exchange (IX) water-purification technologies [
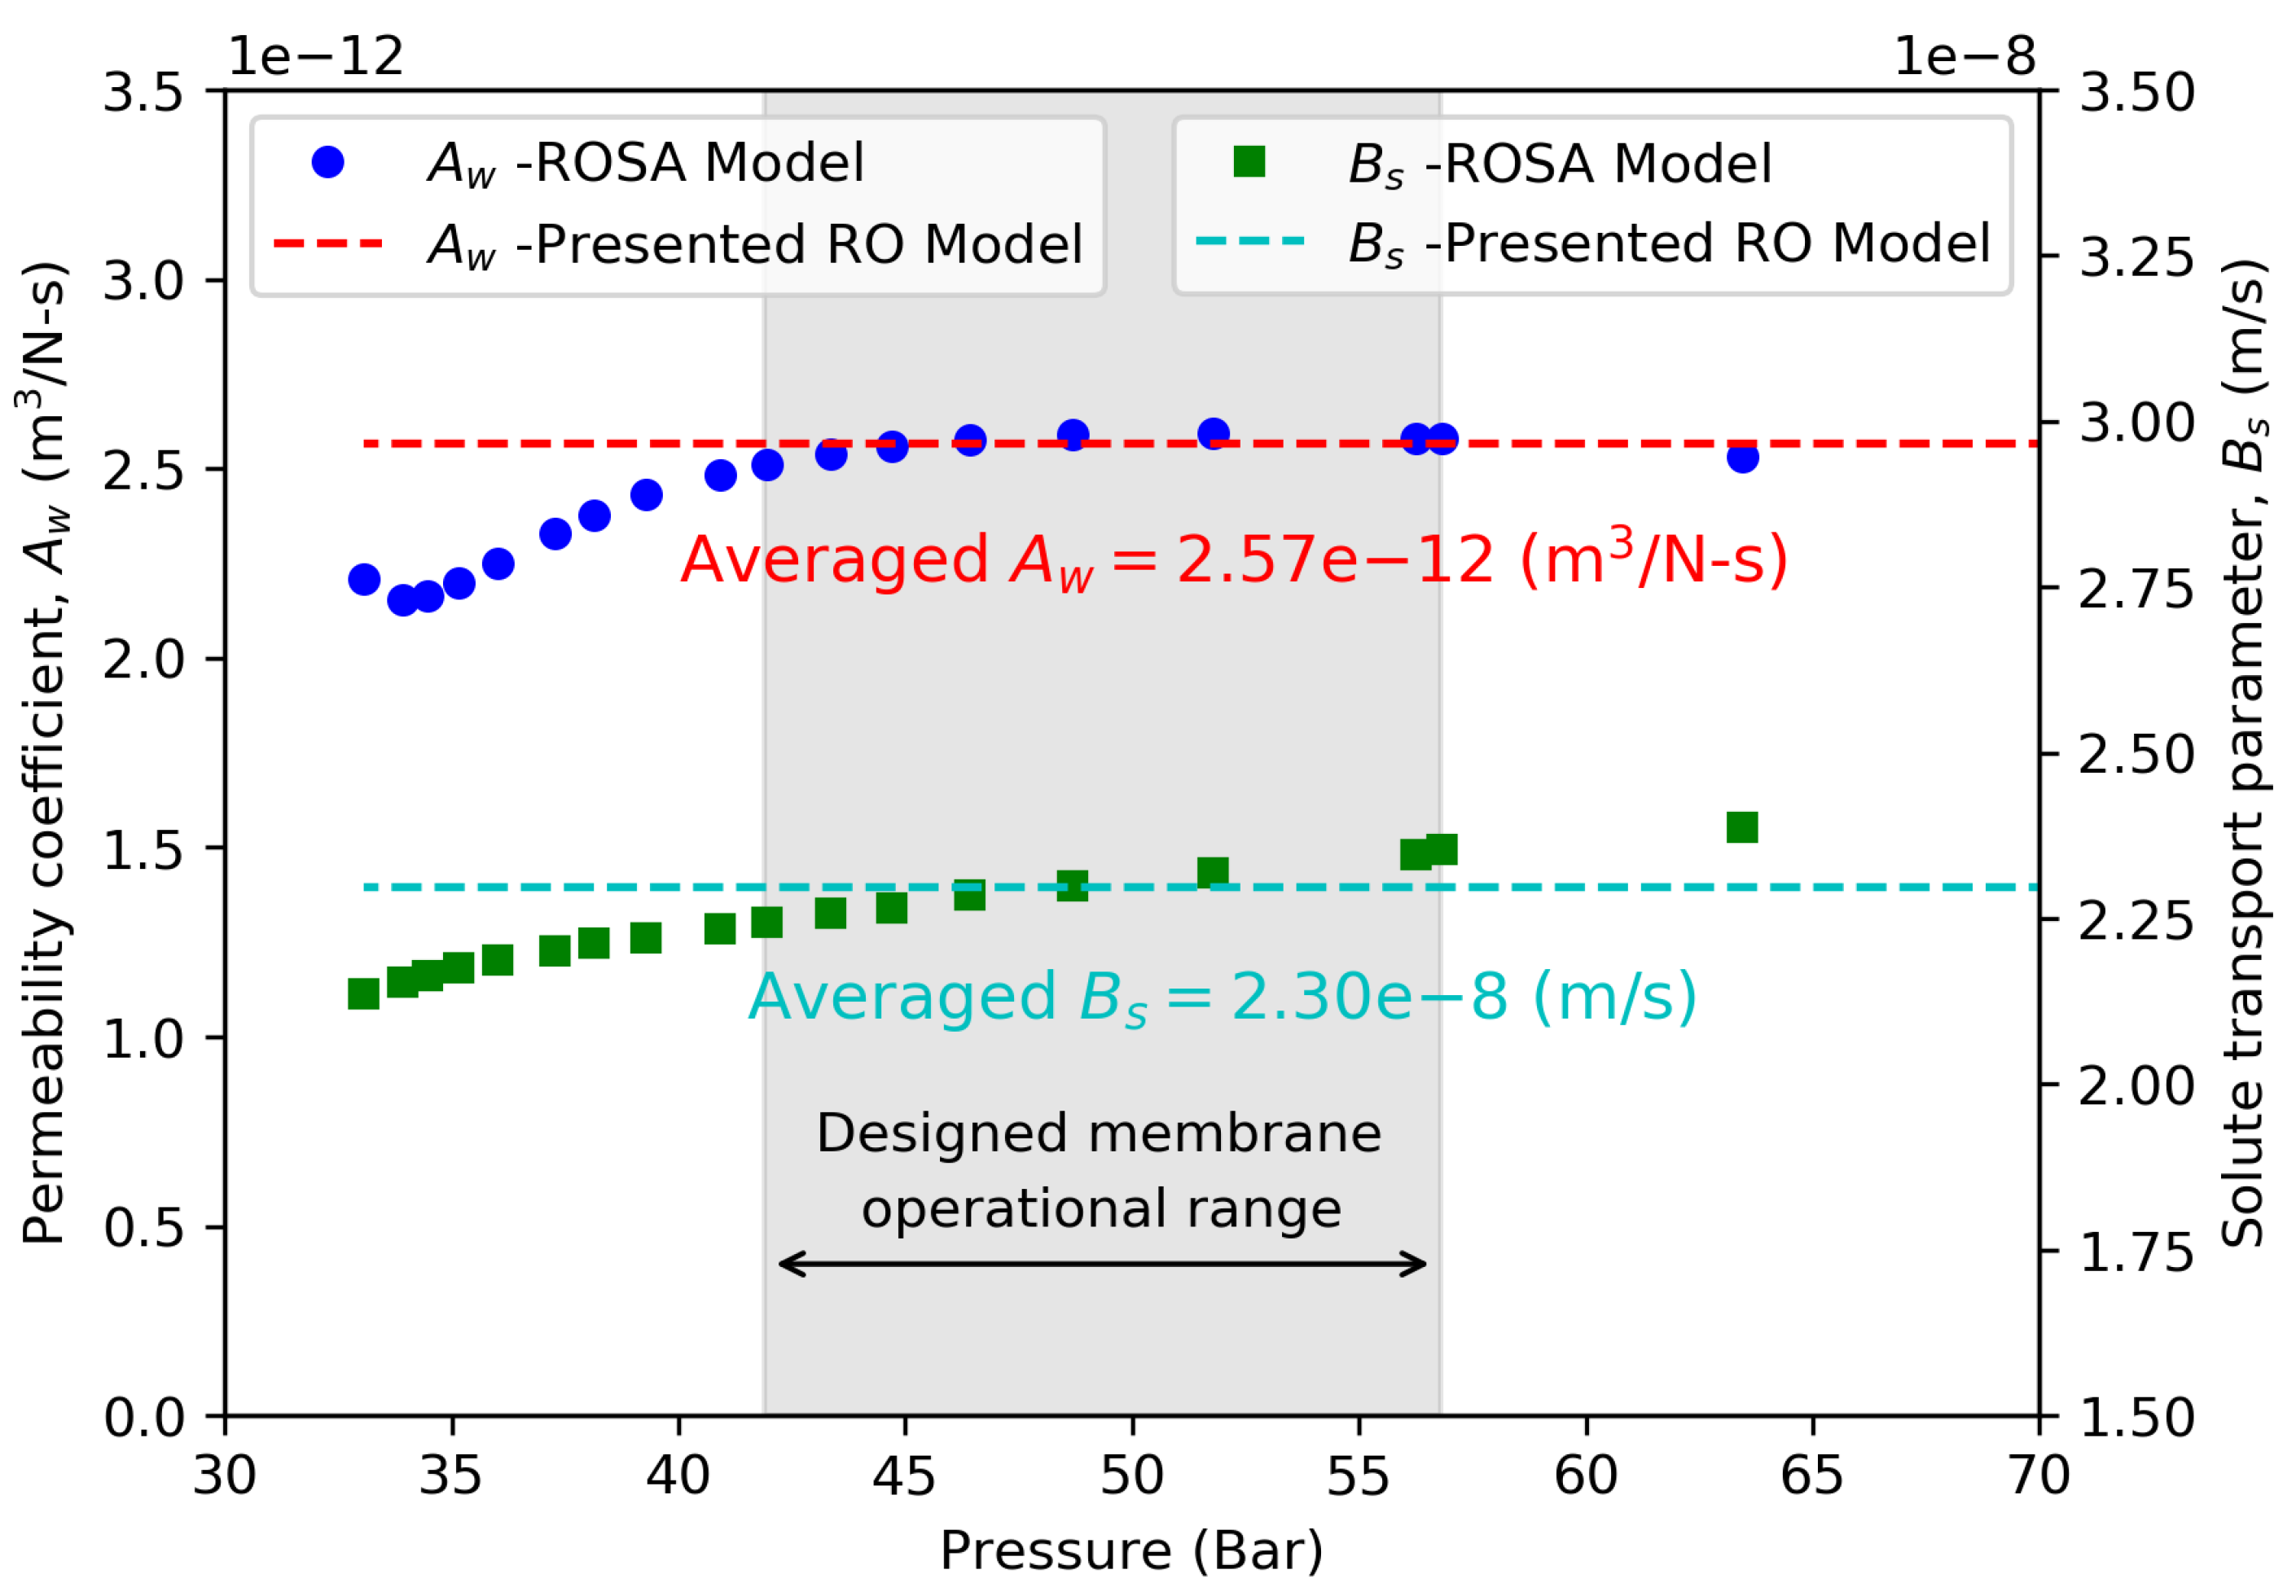
19]. WAVE also includes a reverse-osmosis system analysis (ROSA) model that can be used to design and simulate the RO system. ROSA allows for multistage and multi-pass calculations to calculate flow, pressure, water quality and recovery at every element within the system. In this study, the ROSA model was used to calculate the pressure and water quality before and after the membrane and to calculate the membrane flux for a variety of membrane configurations and flows.
Typically, from a manufacturing perspective, membranes are designed for a certain pressure range, which depends on the design of the membrane, number of stages of the RO system, recovery ratio and number of membranes per pressure vessels. Based on the ROSA model, the membranes are designed to operate for a pressure range of 42–57 bar in this study. The coefficients
and
of Equation (
3) are shown in
Figure 5 as a function of pressure calculated using the ROSA model. The average values for
and
were used in the RO model for this study.
and
were calculated by substituting
and
obtained from the ROSA model into Equations (
2) and (
3), assuming salinity of 35,946 ppm and an osmotic pressure of 30 bar. The values are close to constant under the designed membrane operational range, but drop quickly as the pressure is close to the osmosis pressure. The averaged
and
used in our WEC-Sim RO model were calculated by averaging the
and
values within the designed pressure range for the membrane.
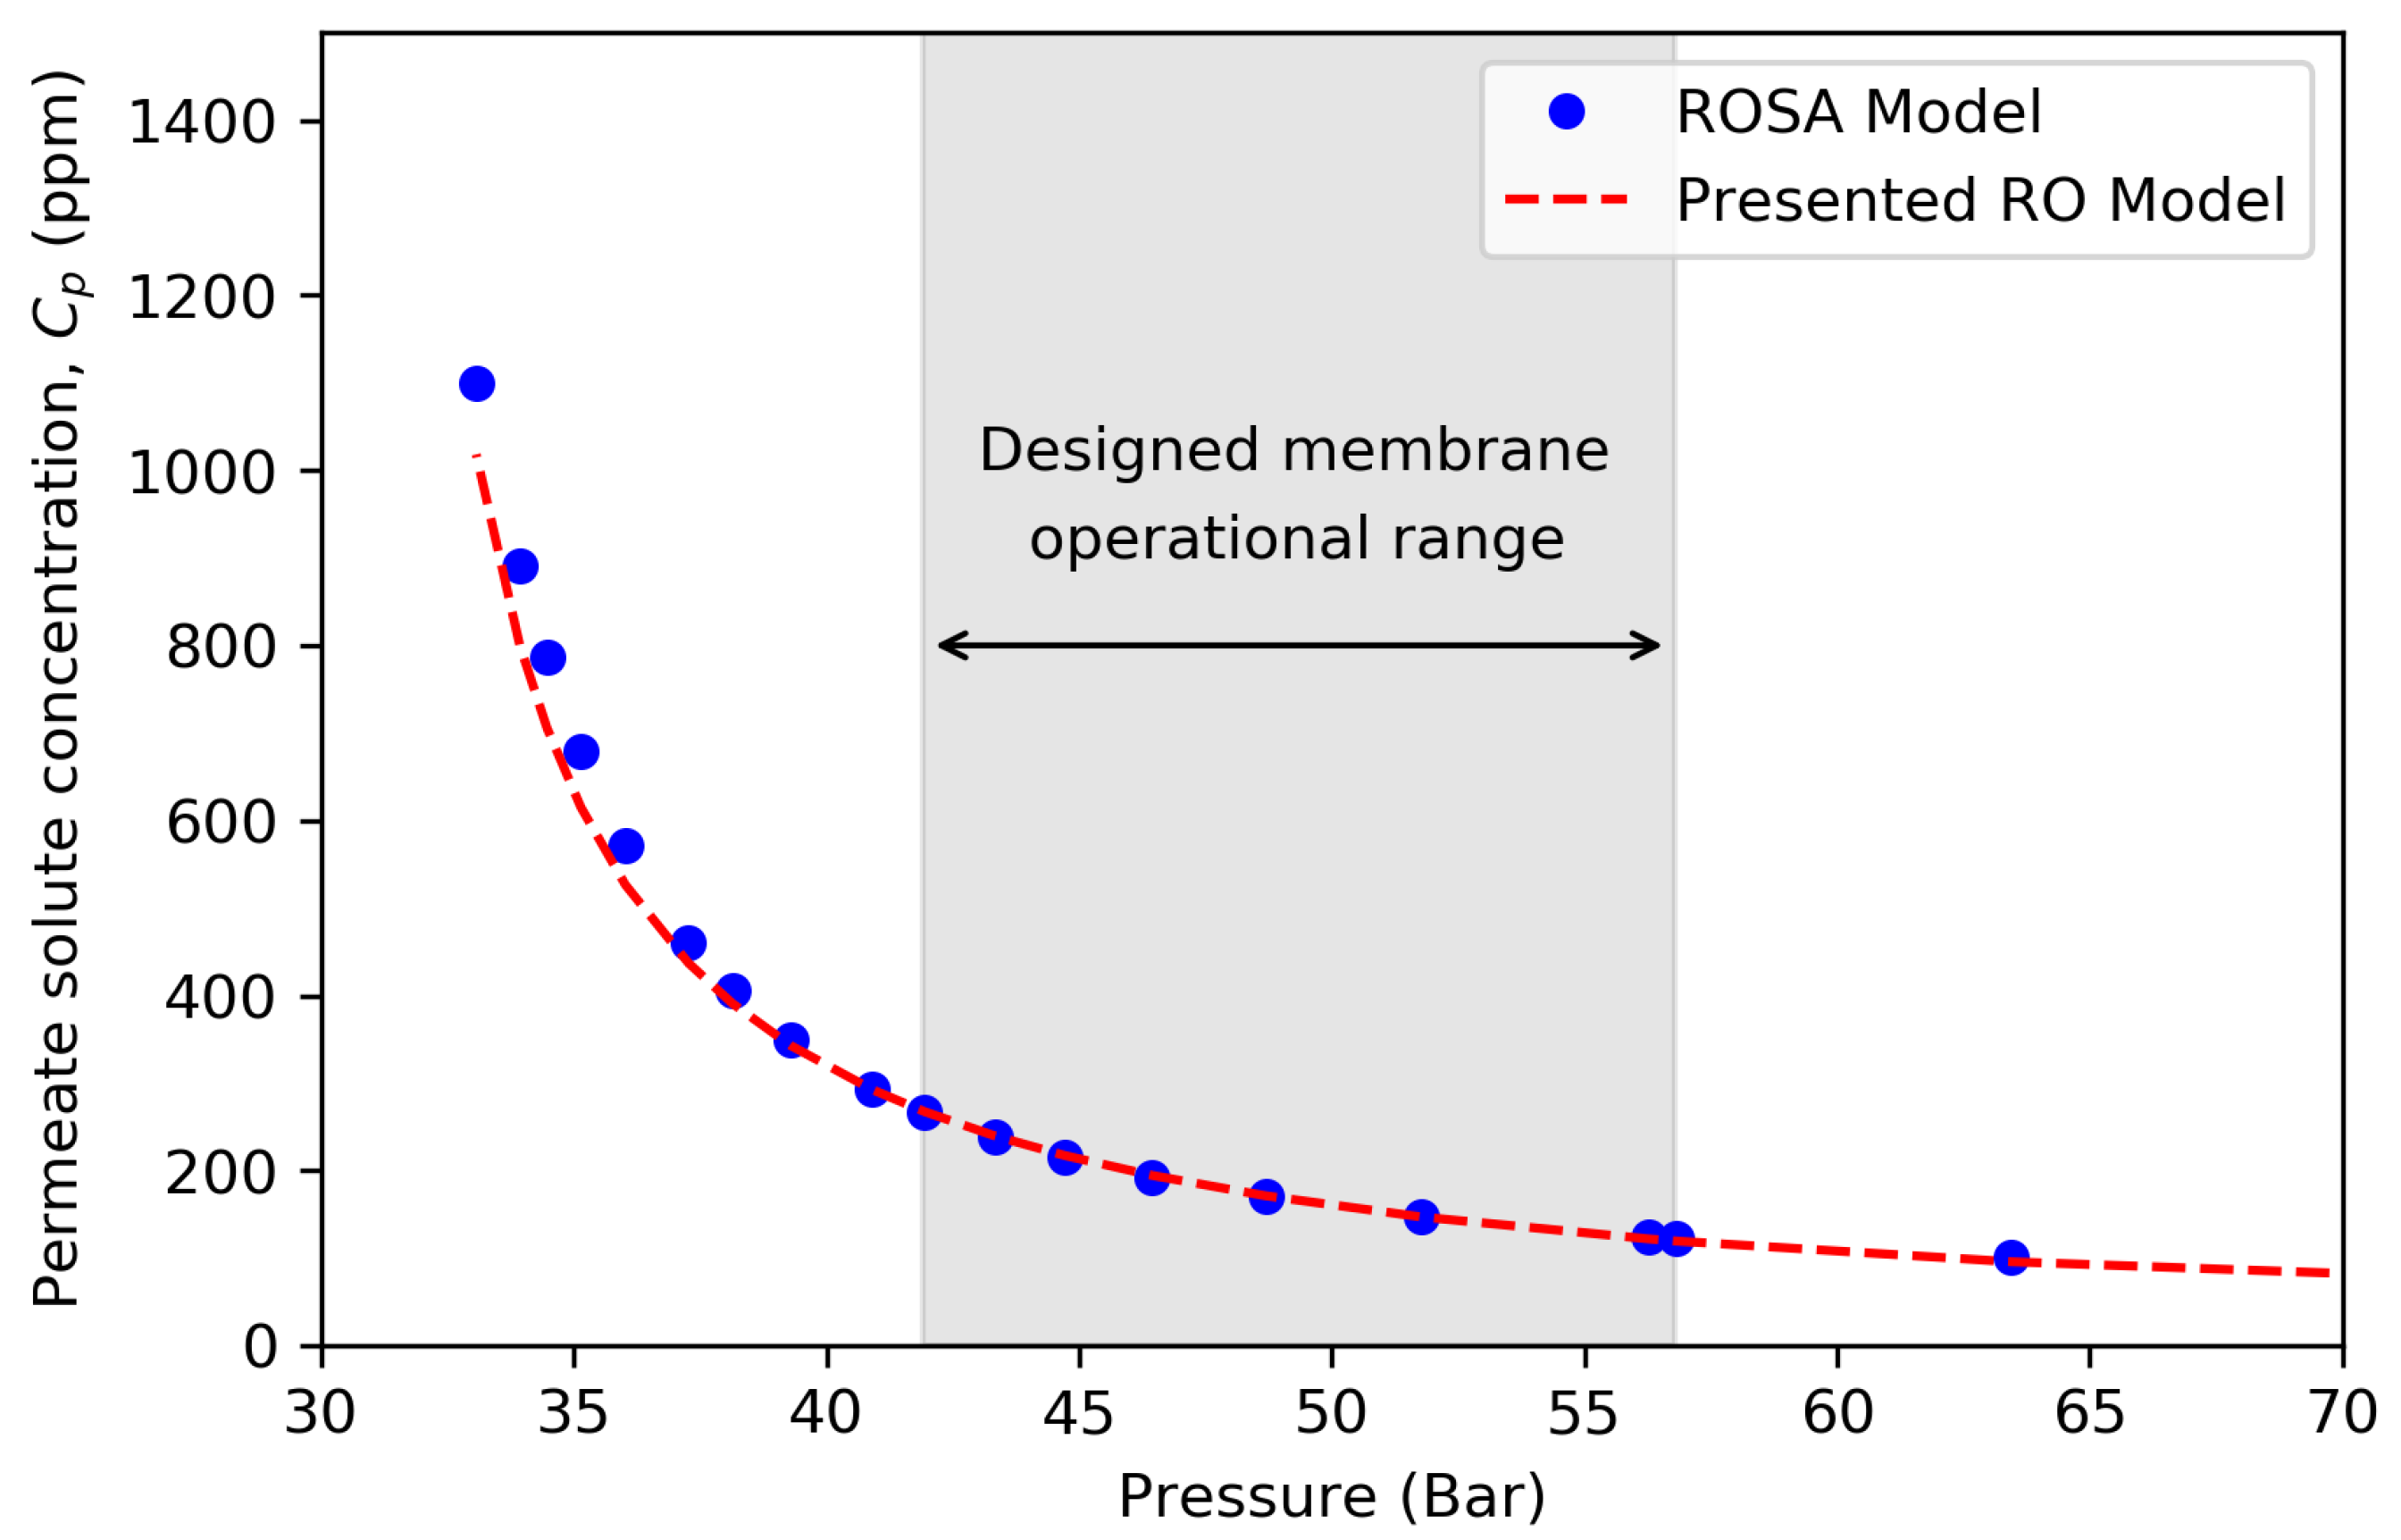
The effect of system-feed pressure on the water quality (salinity) of the permeate flow is plotted in
Figure 6. The resulting water quality from our RO model calculated using Equation (
3) and an averaged value of
and
was verified with the curve from the ROSA model that simulates the details of the single-pass RO system. Note that the analysis did not consider the influence of the dynamic fluctuation of the flow and pressure on the membrane permeability and the resulting water quality. Further investigation is necessary, particularly for WPDS, because of the fluctuating nature of wave resources.
5. Results
This section describes how the design parameters for the WPDS system were determined, as well as the overall efficiency of the WPDS under different sea states and the influence on water production when using two WECs to drive the same RO system. The sea states were selected by following the approach used in the Wave Energy Prize, where six sea states were considered, as listed in
Table 2 [
20]. Each WEC-Sim simulation was 3000 s long, with a ramp time of 250 s and a time-step size of 0.01 s, and the results from the last 1500 s were used for calculating the time-averaged performance.
5.1. Hydraulic and RO Systems Parameters
The hydraulic and RO systems include the hydraulic piston, gas-pressure accumulator, RO membrane, pressure-relief valve and pressure exchanger, as shown in
Figure 3. The specifications for the piston and membrane were sized based on the wave environment of SS2. First, a WEC-Sim simulation was performed without the hydraulic system, which was replaced by a linear damper. The damping coefficient was passively controlled to maximize the averaged power output, which led to an average damping force of
kN. The hydraulic cylinder piston area was then determined based on the averaged force and a targeted pressure of 56 bar
1. For the RO model, the simulated single-stage RO system contained 183 membranes (i.e., 60 pressure vessels and three membranes for each vessel). This was determined from the model with a target flow rate of 0.035 m
/s,
of 150 ppm and a recovery ratio of 25%. The recovery ratio was controlled using the resistance in the pressure exchanger to force the split of flow at the membrane.
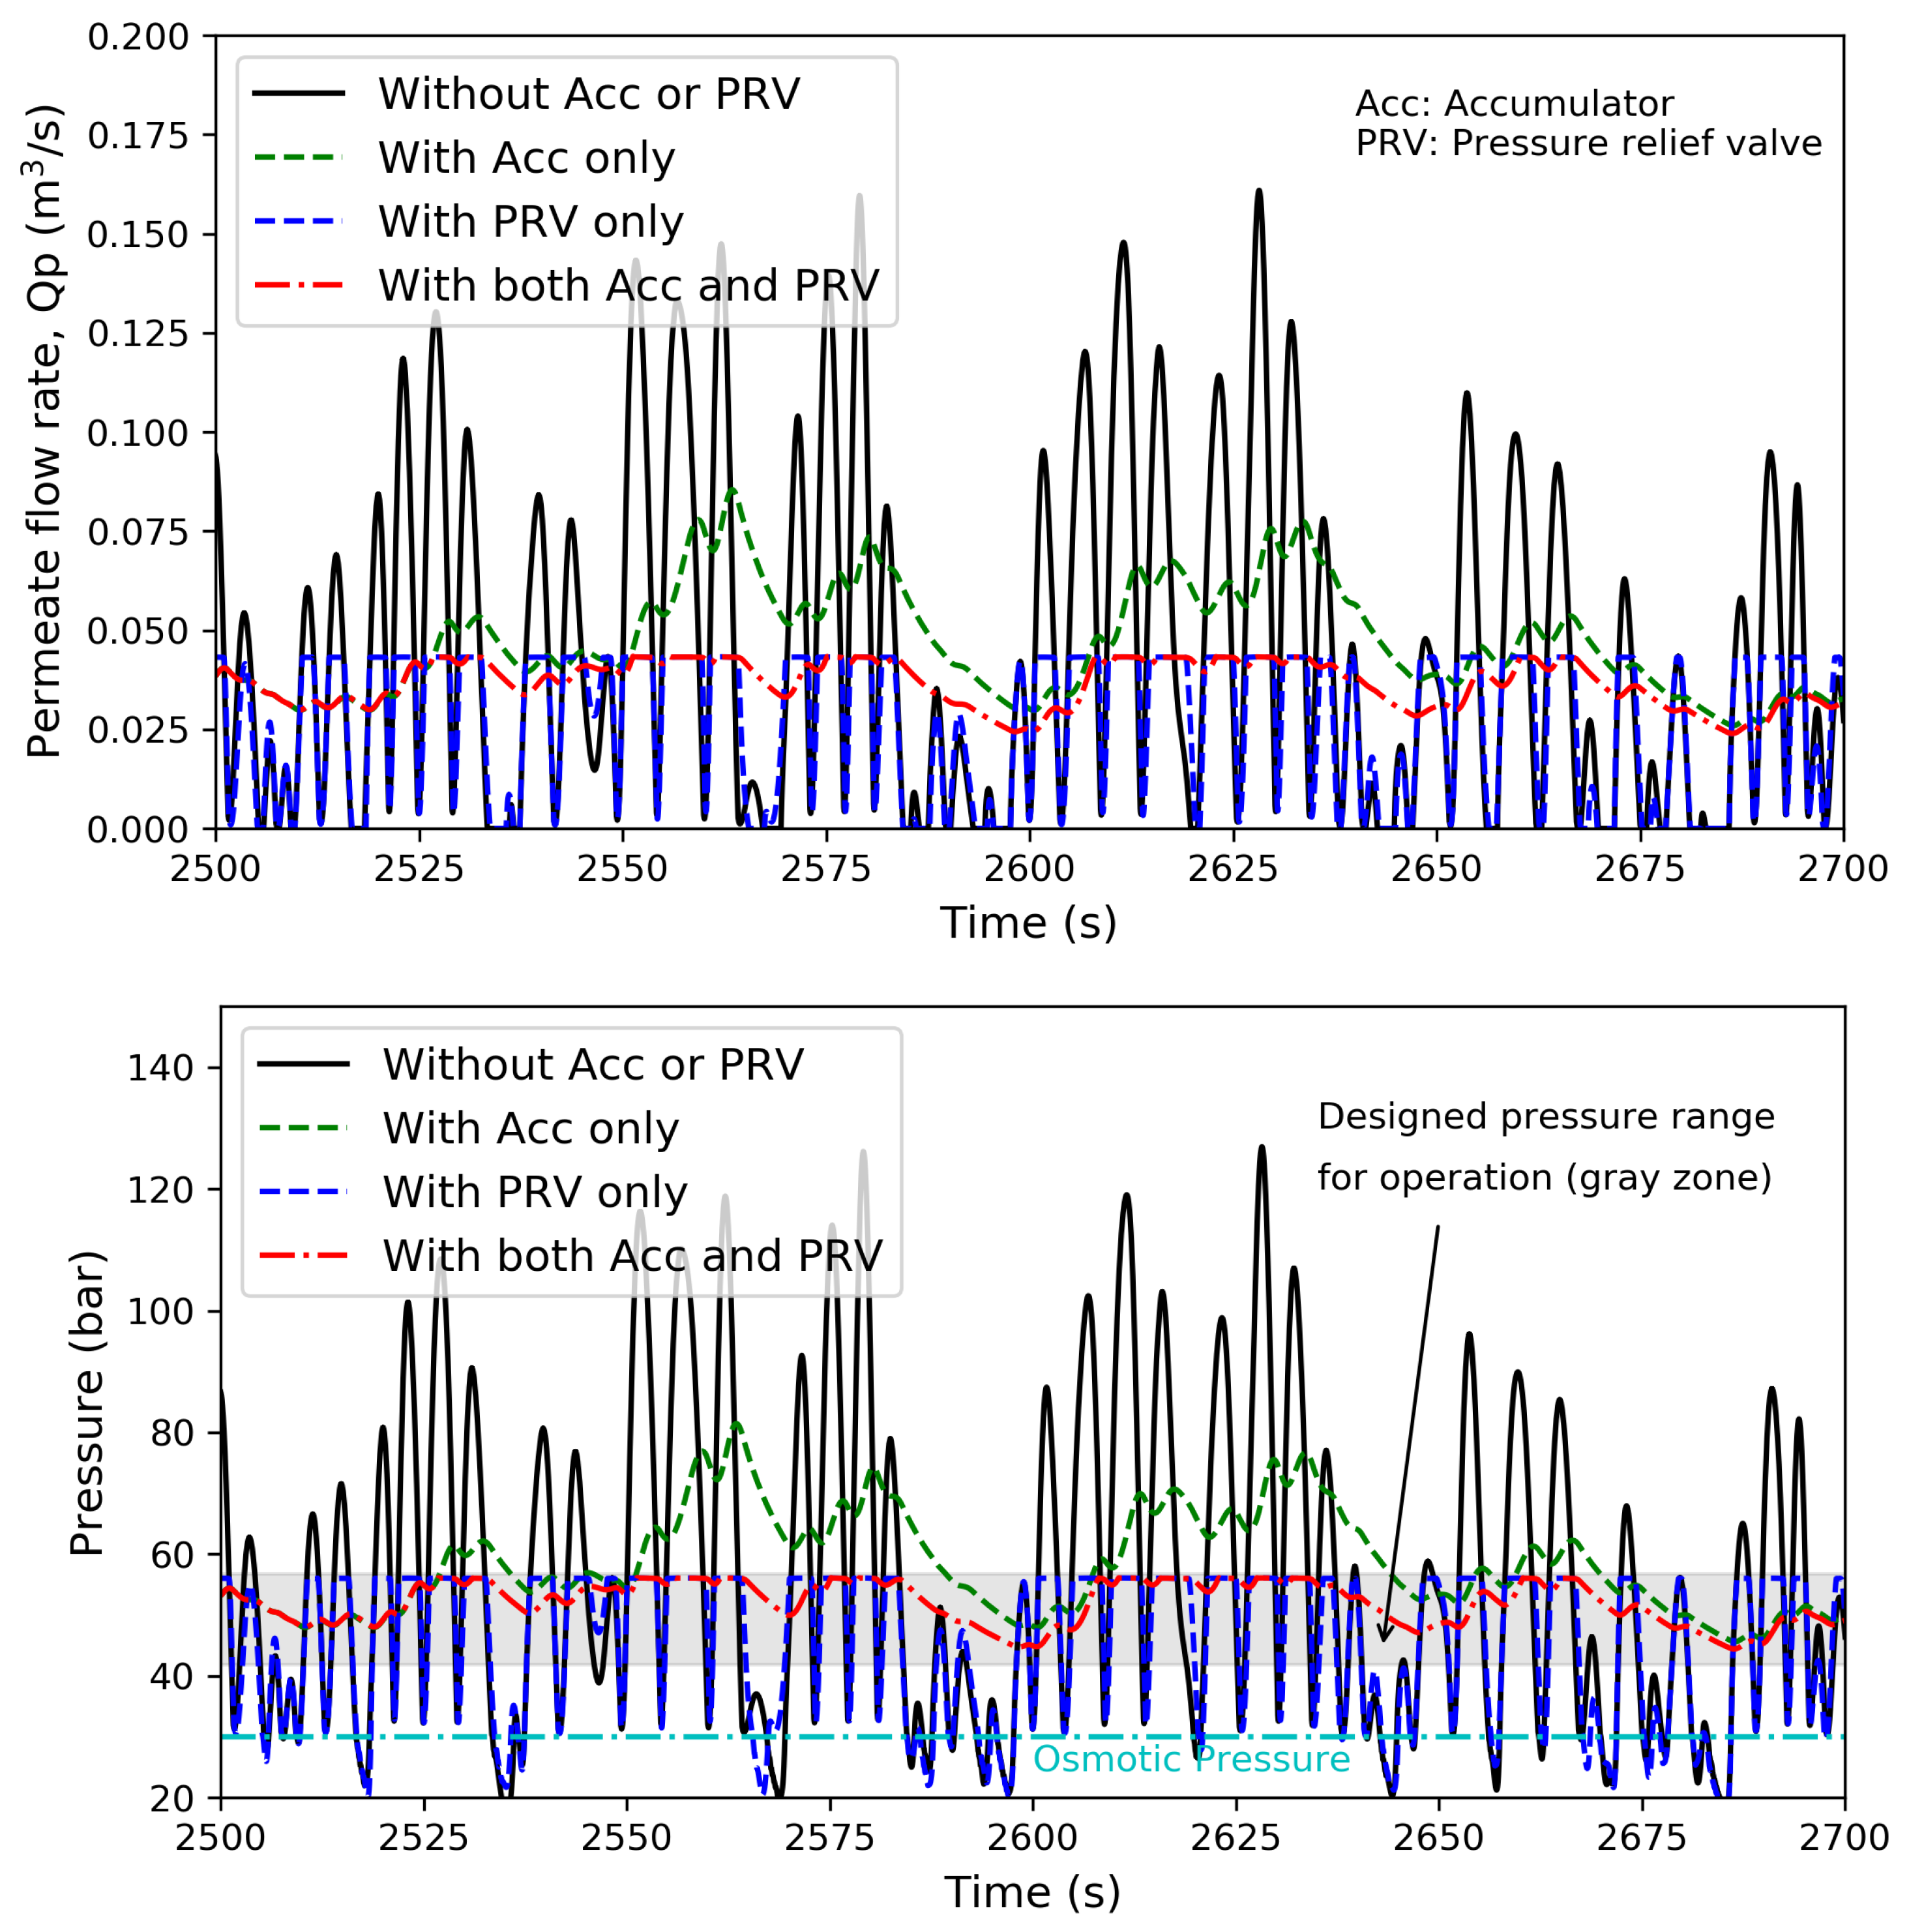
An example of the time history for the flow rate and pressure with and without using the accumulator and pressure-relief valve is presented in
Figure 7, and a summary of the corresponding water-production quantity and quality for each case is described in
Table 3. To keep the hydraulic pressure within the design range, both a pressure accumulator and pressure-relief valve were used. The accumulator helps reduce the hydraulic fluctuation in the system while preserving energy and preventing the pressure from dropping below the osmotic pressure, although it is less effective at reducing the large pressure spikes. For that, we were able to incorporate a pressure-relief valve that vents seawater to the atmosphere (or ocean) if the system reaches a predetermined threshold to prevent overpressuring the membrane. The obvious downside of this technique is that energy is being “thrown away”, and it results in reduced water production.
In this study, the pressure-relief valve was set to 56 bar, which was slightly below the upper limit of the membrane design pressure. When both the accumulator and the pressure-relief valve were used, the accumulator was able to minimize pressure fluctuation, therefore reducing the loss in water production through the pressure-relief valve. This combination increased the overall water production, as compared to the case where only a pressure-relief valve was used.
Note that to account for the influence of the osmotic pressure on instantaneous water generation in our simple solution-diffusion model, the permeated flow could be generated only when the wave-induced feed pressure to the membrane was greater than the osmotic pressure. Otherwise, it assumed that the permeate flow went to zero, and the flow was diverted to the pressure exchanger to re-energize more fresh seawater to the accumulator.
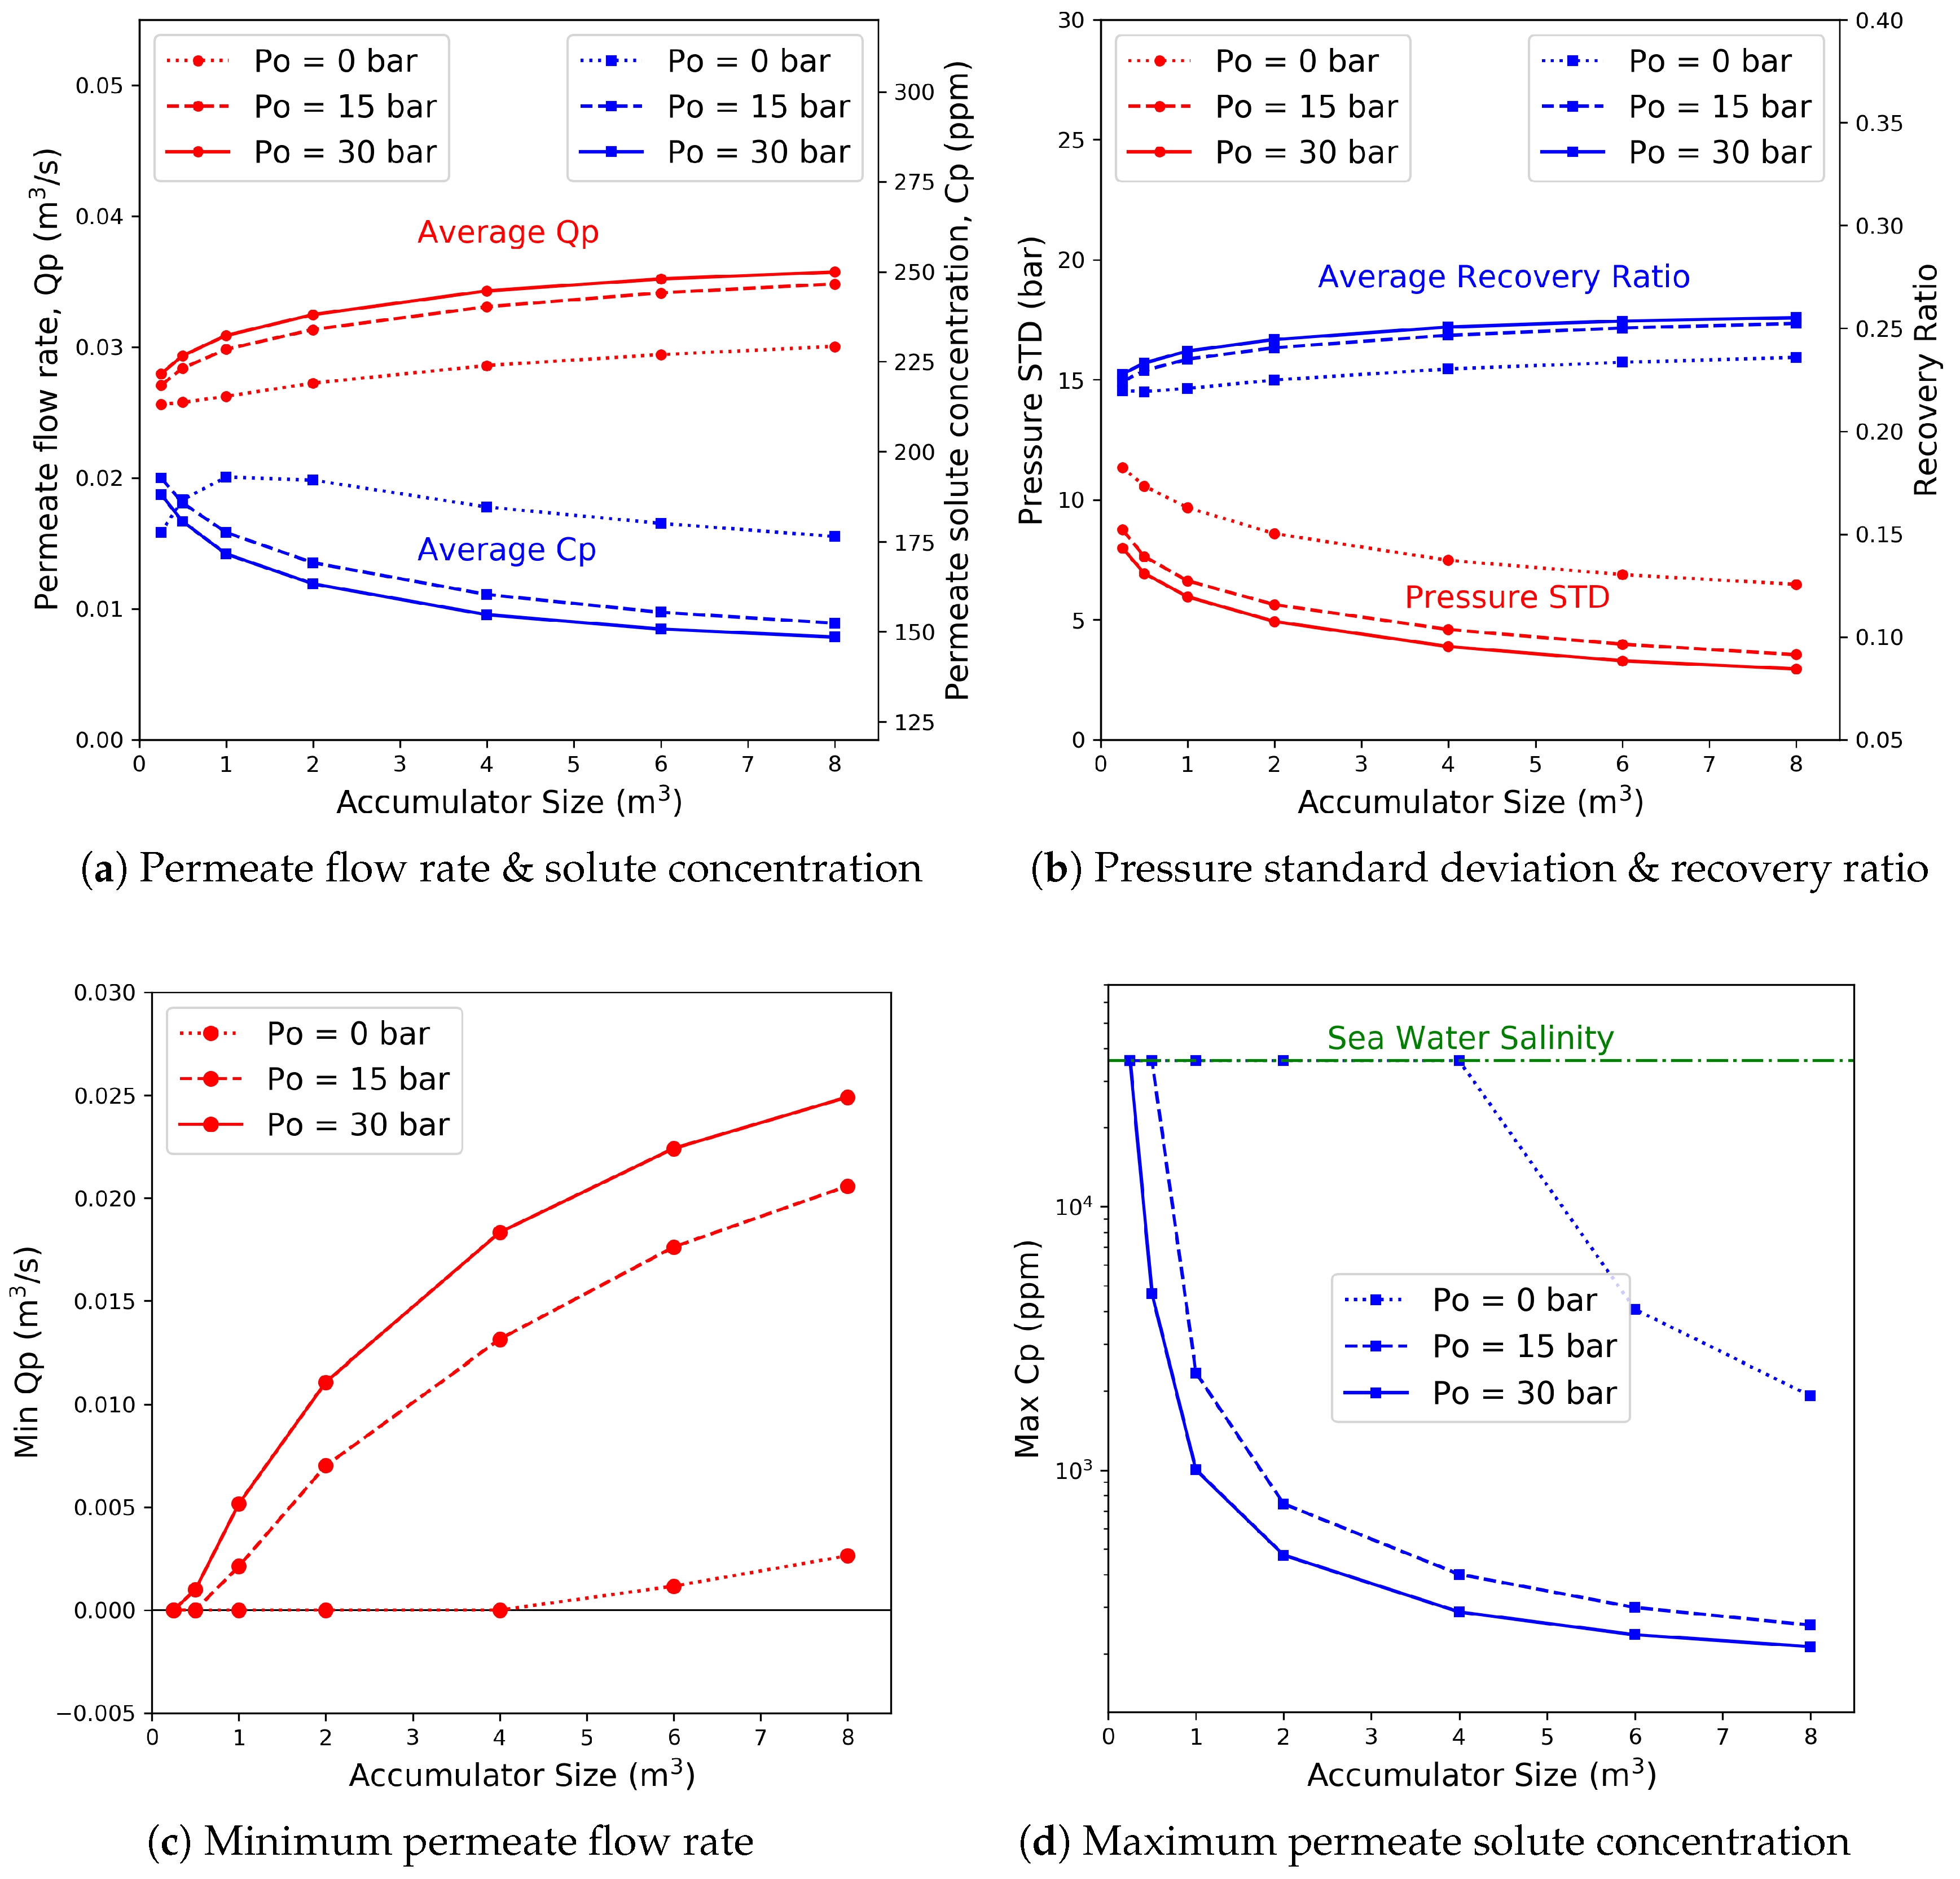
The influence of accumulator size and precharge pressure on the dynamics of WPDS was also investigated. The results are plotted in
Figure 8. As expected, the pressure and flow rate fluctuation were reduced as the size of the pressure accumulator became larger and the precharge pressure increased. While one can further increase the accumulator volume to smooth the pressure, it may not be a practical solution. Conversely, adjusting the precharge pressure affected the mean volume of air and fluid in the accumulator during operation. Smaller precharge pressure resulted in smaller air volume, which reduced the capacity of the accumulator, and the accumulator became less effective. The final desalination model specifications for the WPDS model are listed in
Table 4.
5.2. Overall Efficiency
The overall efficiency of the WPDS under different sea states and the influence on water production were investigated using the previously mentioned model specifications.
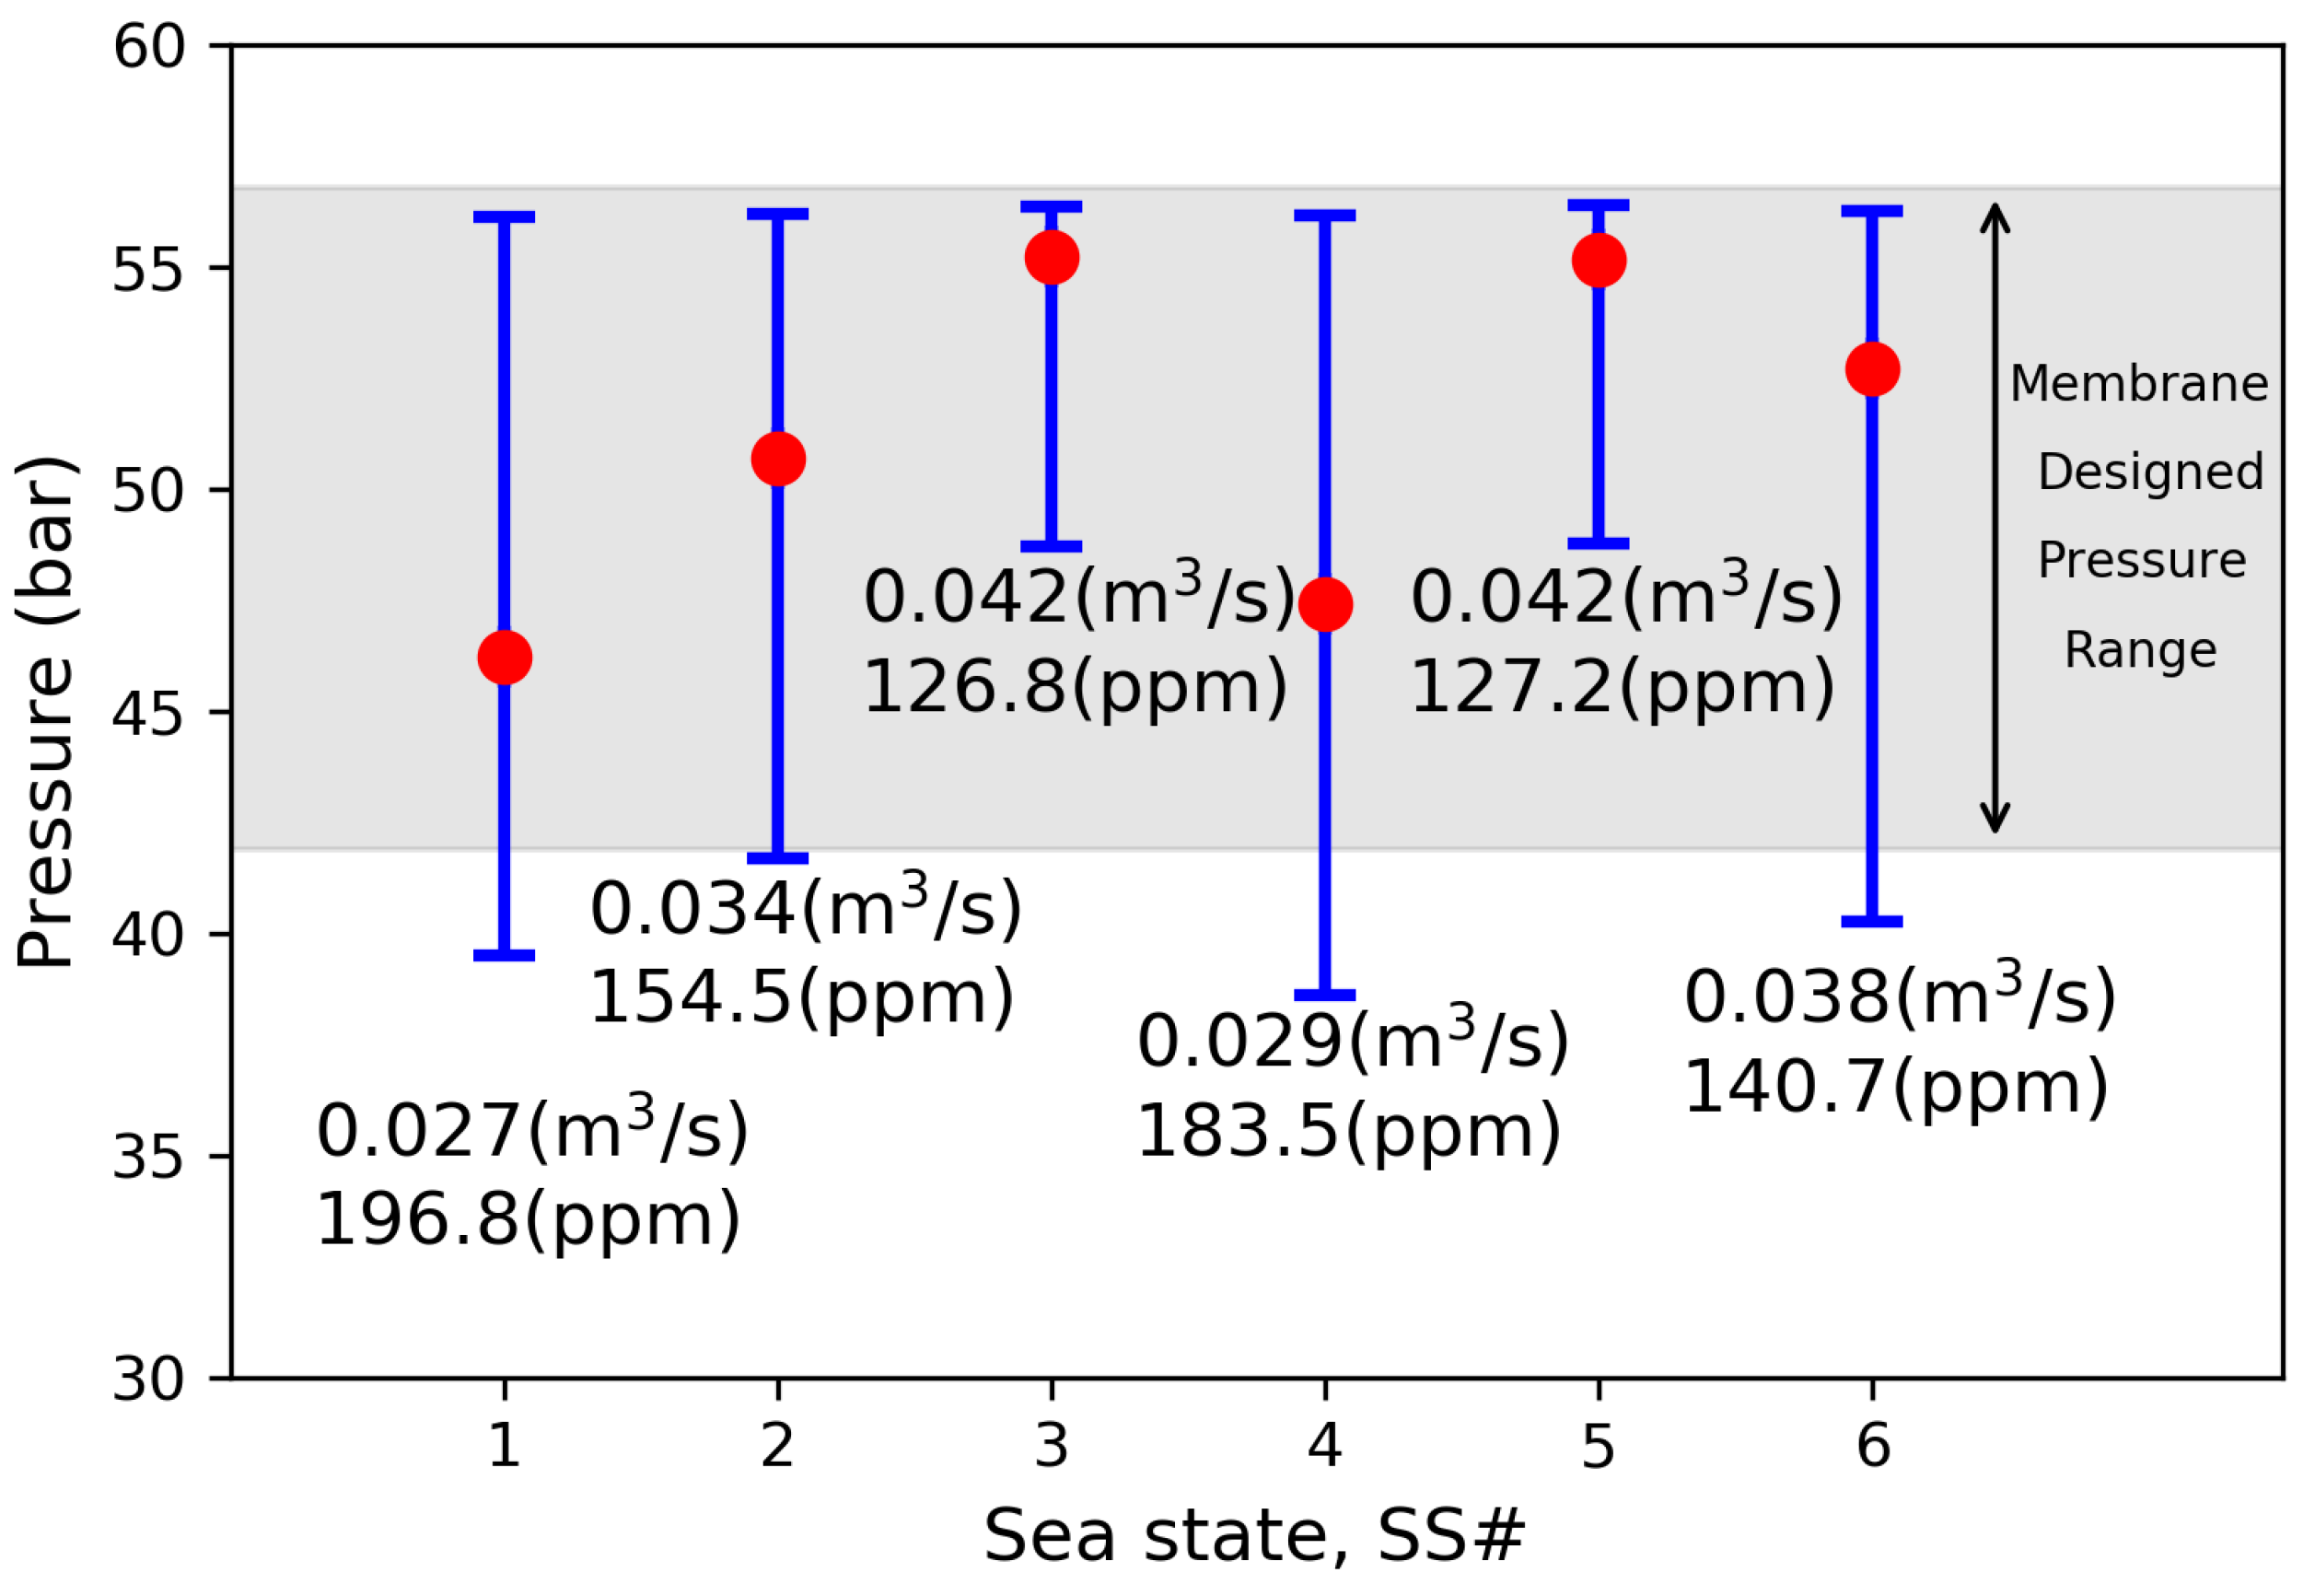
Figure 9 shows a summary of the overall WPDS efficiency in all six sea states listed in
Table 2. Both the averaged
and
are also listed in the figure. The red dots represent the averaged hydraulic pressure, and the blue bar indicates the range of fluctuation, where the maximum and minimum values are calculated using the 99.9 and 0.1 percentiles of identified peaks from the simulated time history.
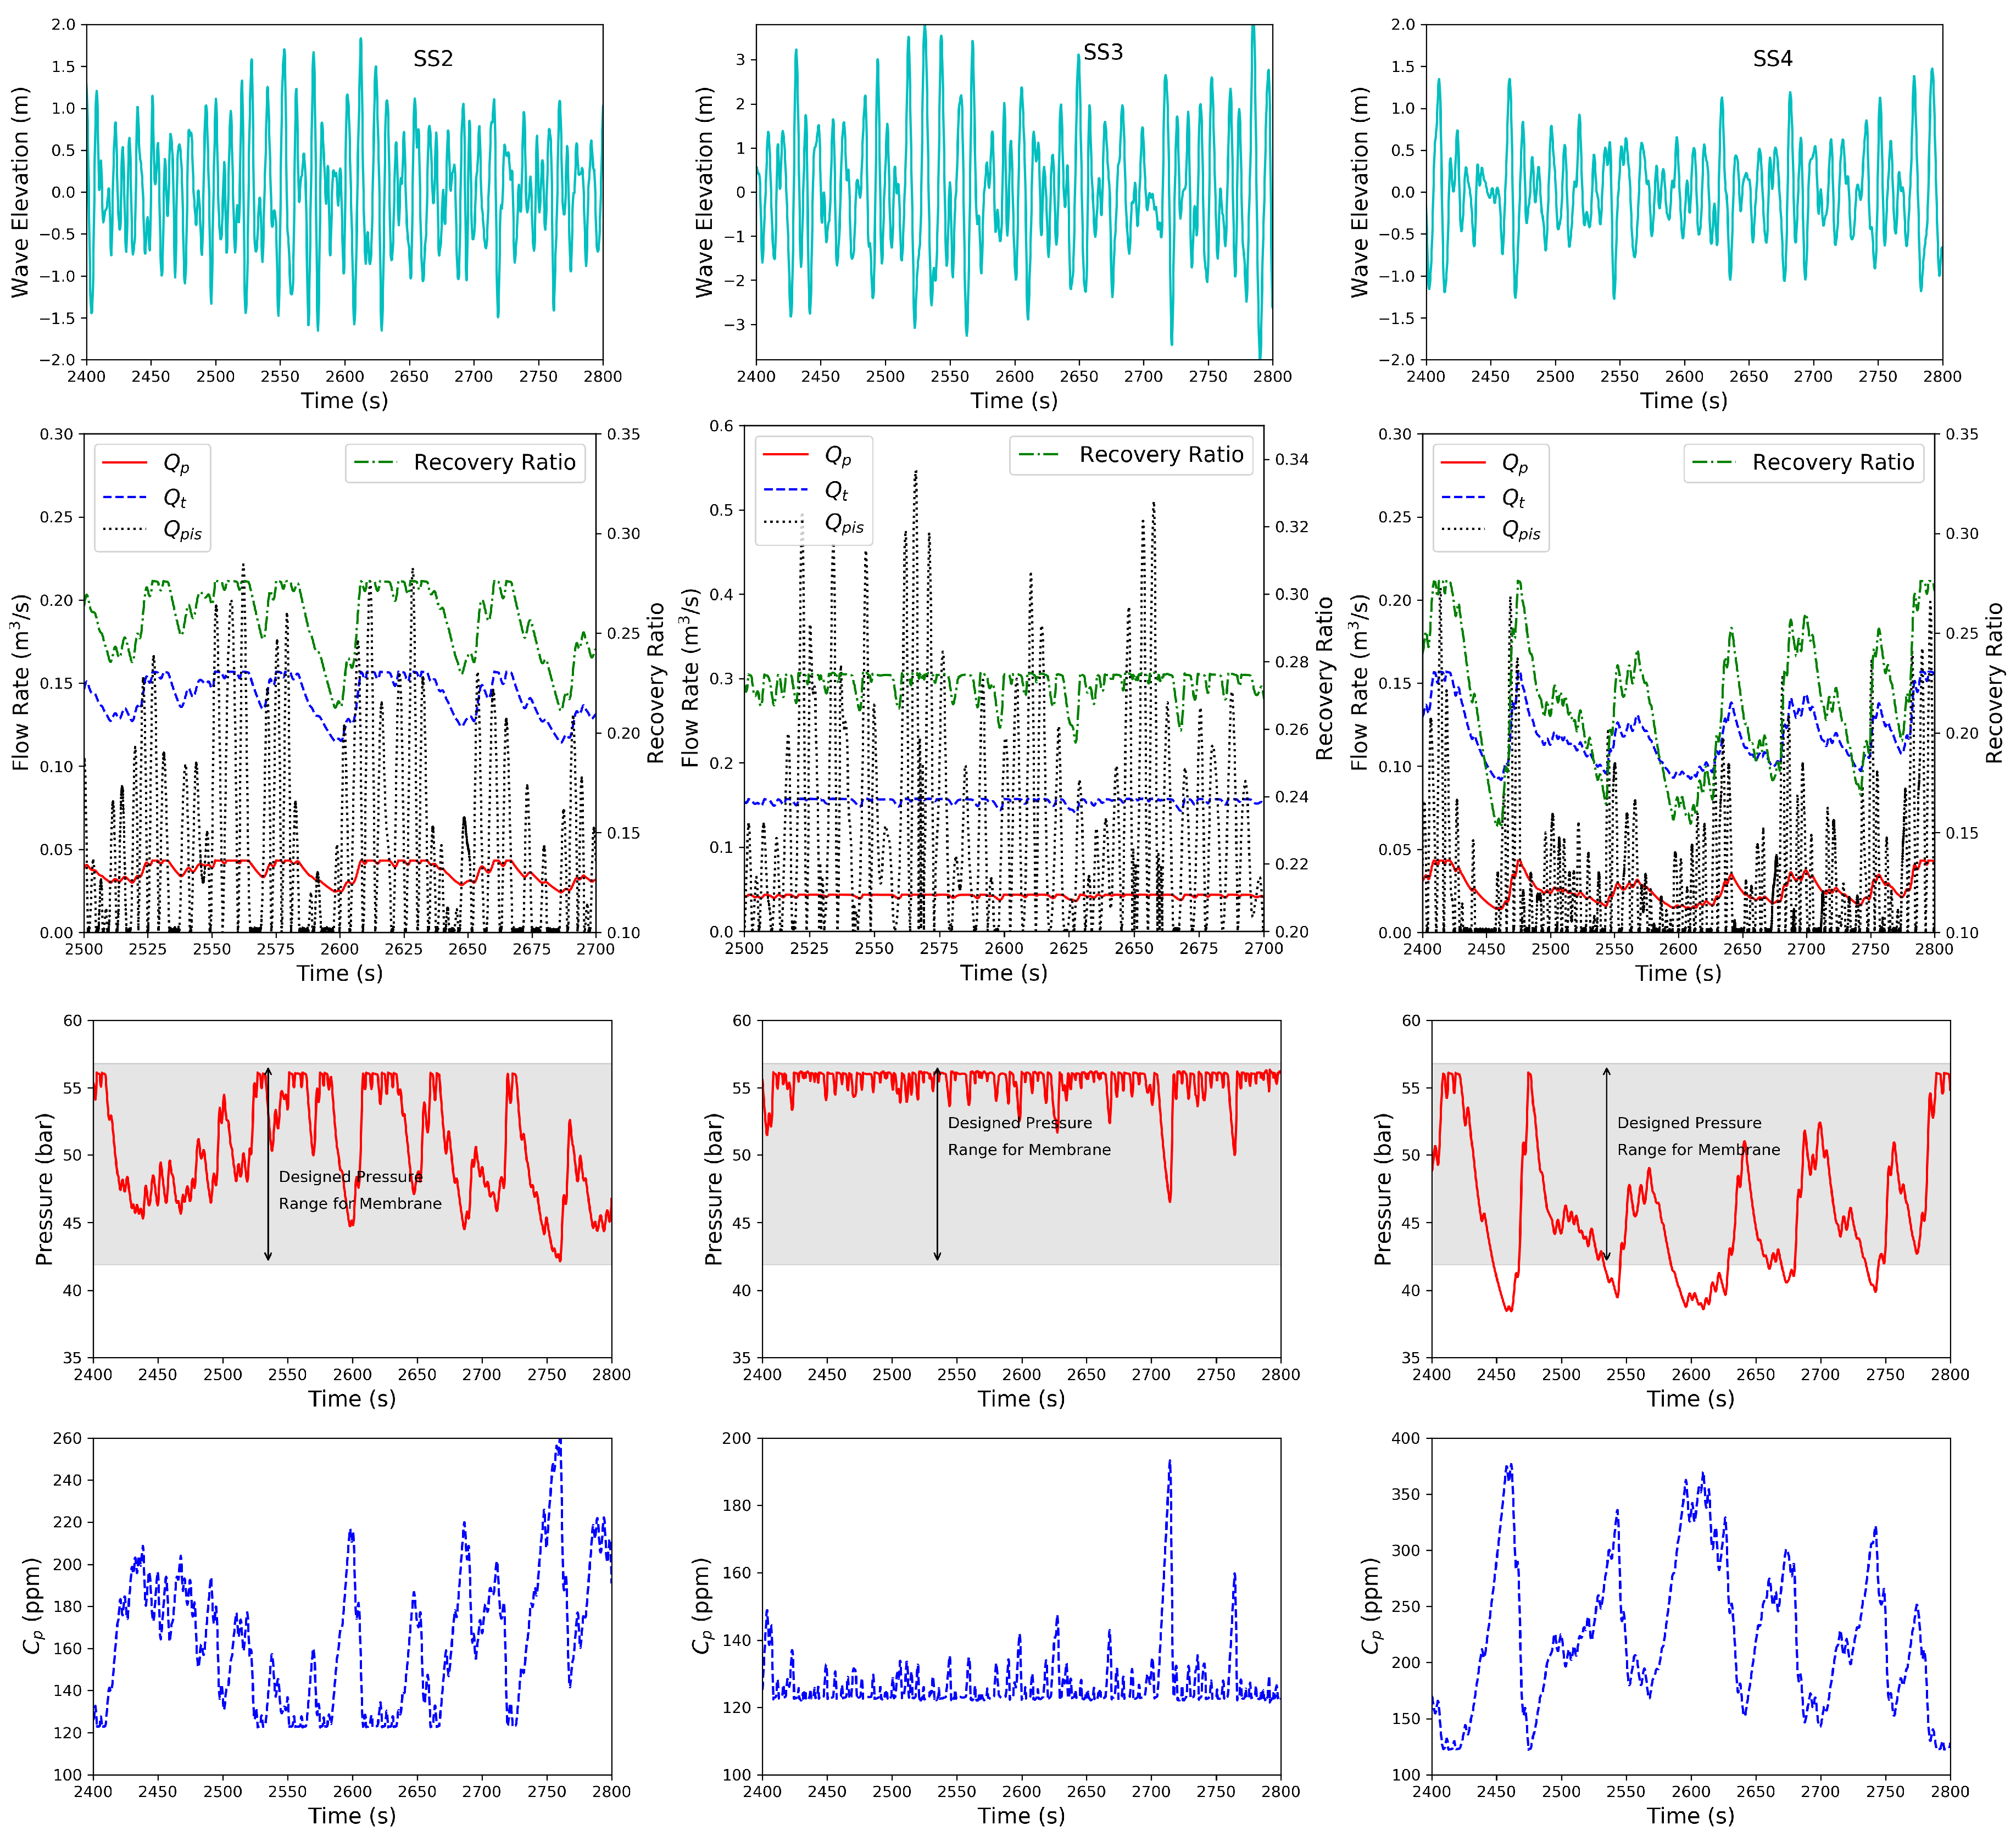
Figure 10 plots the time history of the wave elevation, permeate flow rate (see
Figure 1 for the definition), the RO-membrane-driven pressure, recovery ratio and the water quality of the permeate flow for three different sea states (SS2, SS3, and SS4). The three sea states represent the designed, high-energy and low-energy wave conditions, respectively. The gray zone indicates the design pressure range for the membrane based on the ROSA model. The averaged recovery ratio ranged between 22% and 27%, with an instantaneous value of 15%–28%, depending on the wave environment. The accumulator helped reduce the pressure fluctuation in the hydraulic system, and the pressure-relief valve kept the hydraulic pressure in the system below the upper limit. For high-energy sea states (e.g., SS3 and SS5), the mean hydraulic pressure is relatively higher than the other sea states, where the WPDS can be operated at a pressure level that is close to the upper limit of the membrane design pressure. However, this also indicates that a significant portion of the energy has been rejected through the pressure-relief valve. Conversely, for low-energy sea states (e.g., SS4 and SS6), a redesign of the RO system is needed to avoid system pressure below the lower operational limit for the membrane. The redesign may include the use of a larger accumulator, a smaller piston area or a specific control method or other configurations, all of which are beyond the scope of this study.
5.3. Multiple-WECs-Coupled RO System
Because WEC-Sim was intended to model multibody WEC designs, this capability can be leveraged to run multiple WECs and capture the potential interactions between them.
Figure 11 shows the WEC-Sim model for the two-WECs-coupled desalination system. WAMIT was also used to compute the hydrodynamic loads of the two WECs. For this study, device interactions were not of interest, but instead, an intentional phase shift from two WECs driving the same RO system. Because the dominant wavelength is approximately 100 m, spacing the WECs 25 meters apart creates a phase shift close to 90 degrees, resulting in a system that minimized the instantaneous passing through zero by putting the two WECs out of phase.
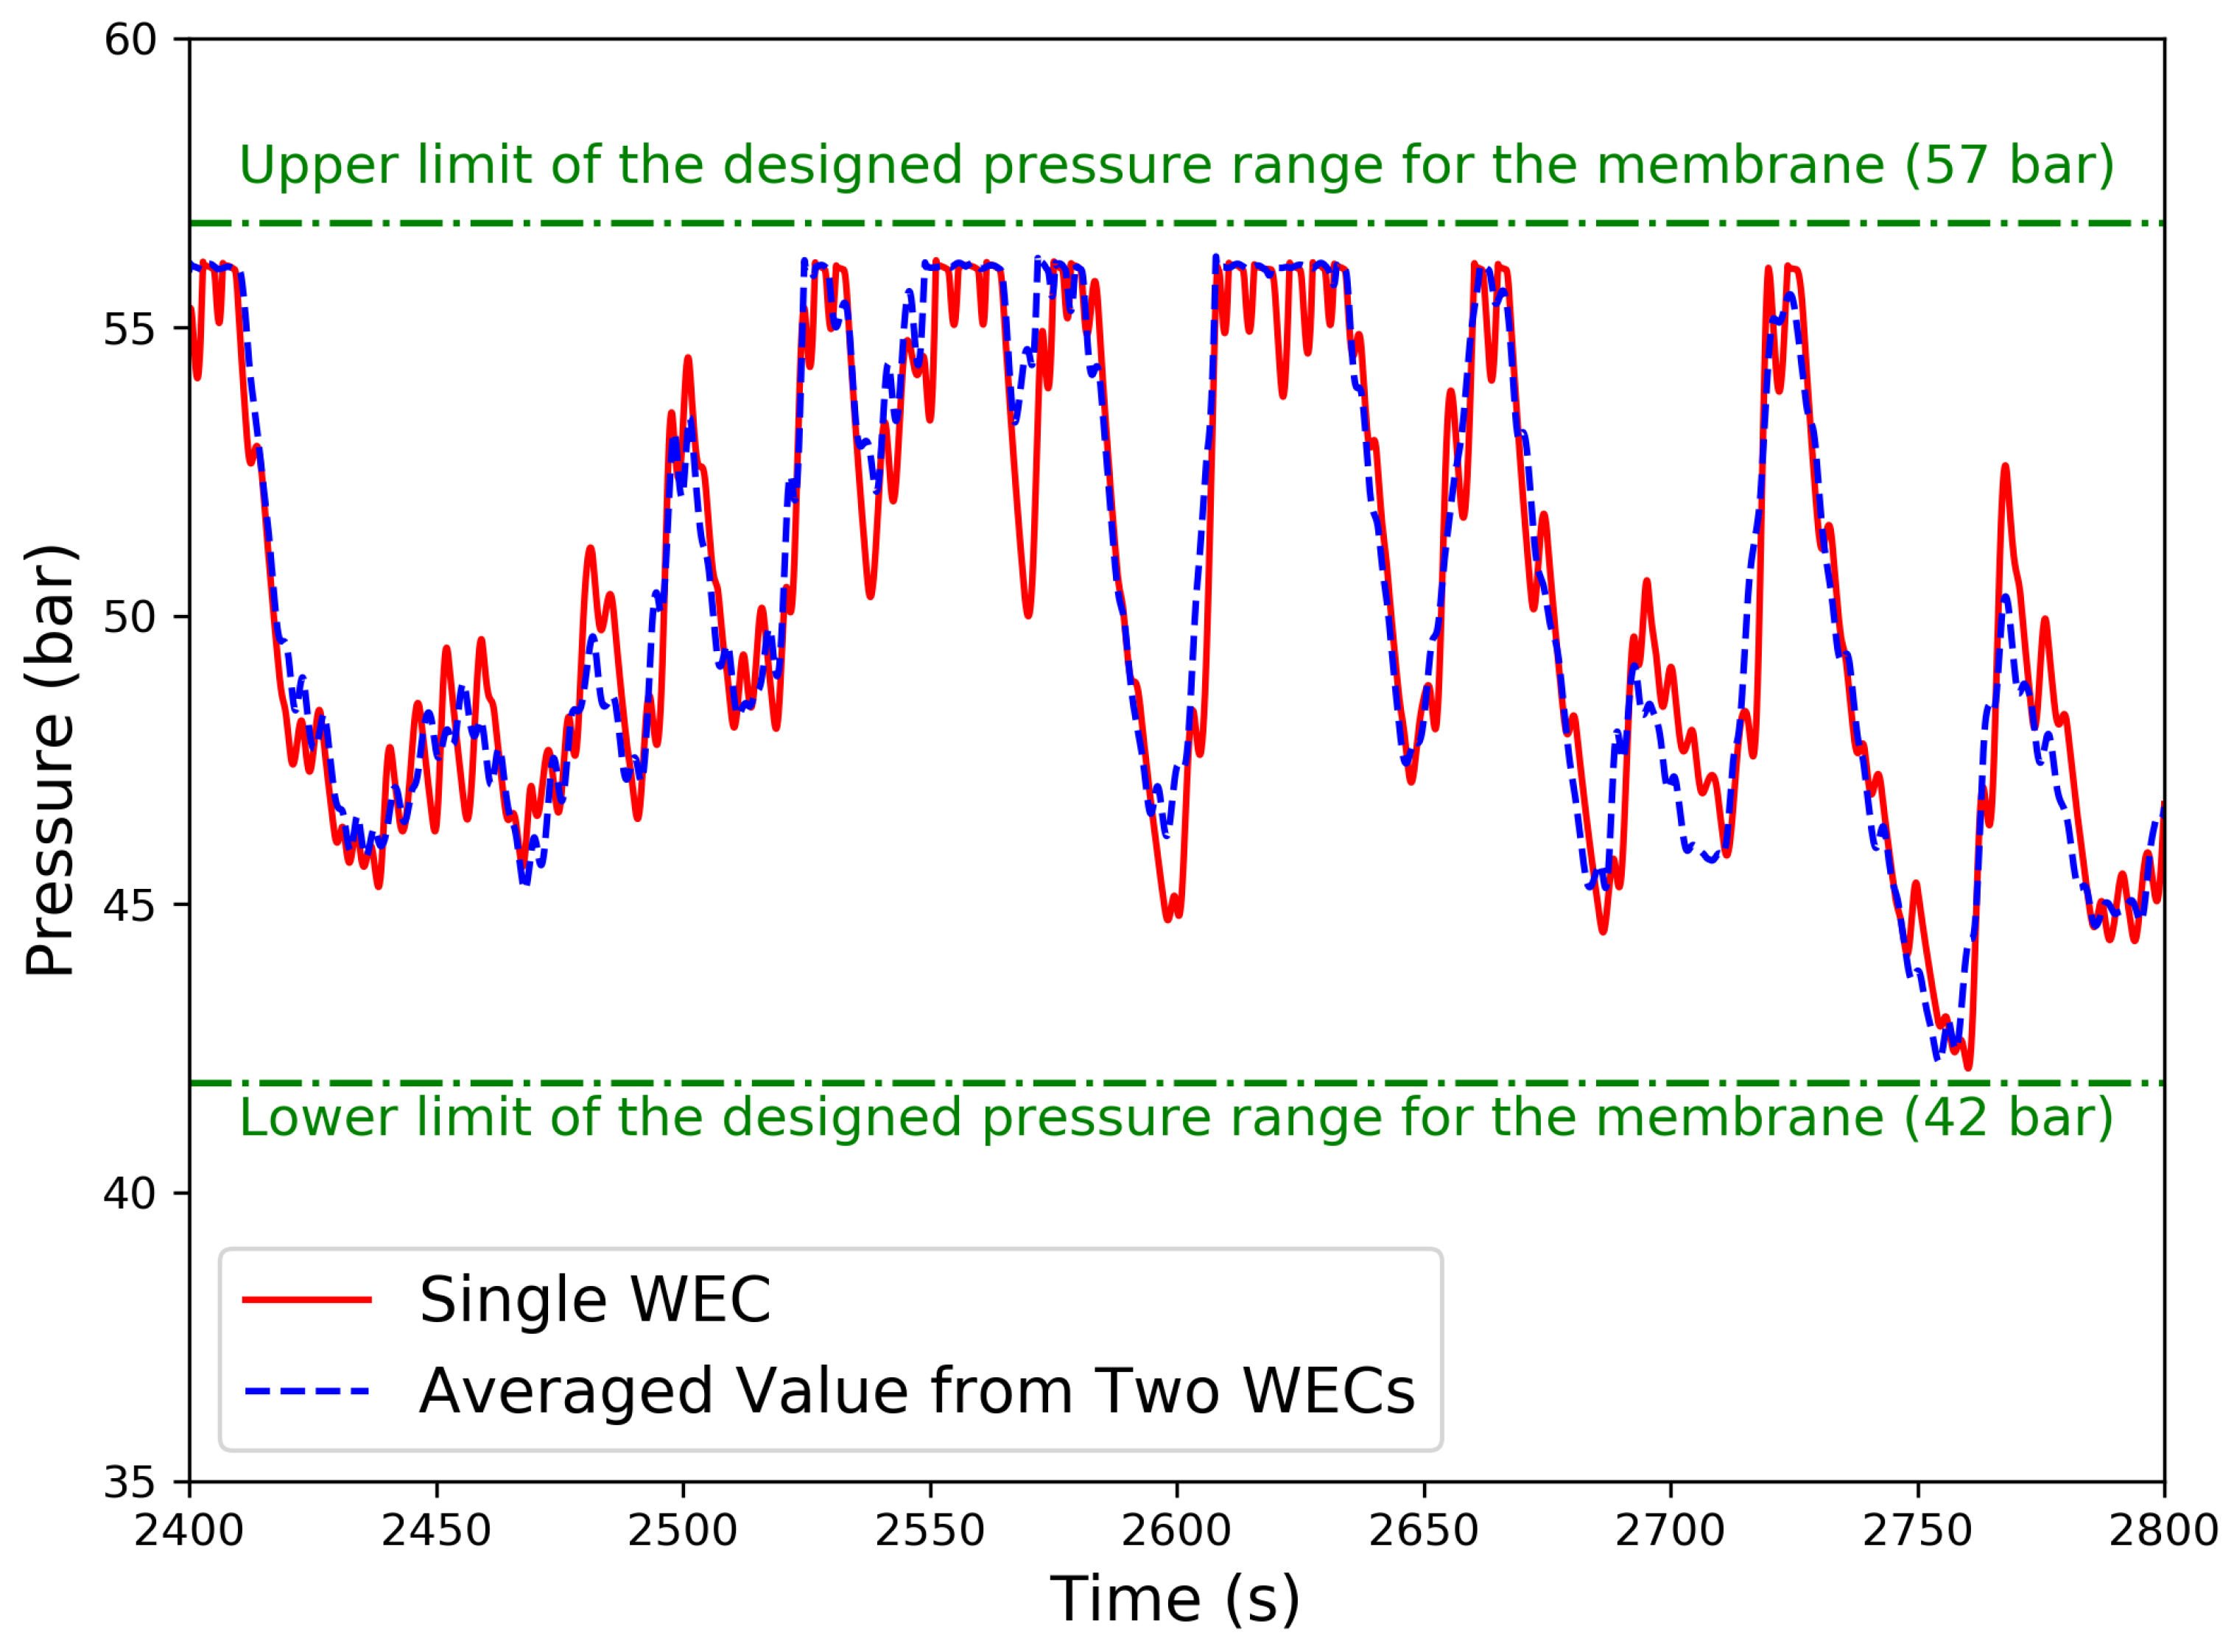
Figure 12 plots the comparison of system hydraulic pressure between the results from a single WPDS and those from the averaged value of the two-WECs-coupled RO system. As shown in the simulations, by splitting the RO system with two WECs, the local (wave-to-wave) peak load can be reduced.
6. Discussion
Wave power fluctuates from wave to wave and from season to season, which makes it challenging to design WPDS, given that an RO system is typically operated under a constant flow rate that requires a steady energy supply. In addition, membranes are designed to operate efficiently for only a small range of pressure. Reducing the hydraulic fluctuation of the system can be achieved using a combination of the accumulator and pressure-relief valve. The accumulator stores the wave energy by pressurizing a fixed volume of compressible gas, which reduces the fluctuations in the hydraulic fluid. However, it is less effective at reducing the large pressure spikes because of the size limitation. For high-pressure spikes, the pressure-relief valve can be used to vent seawater to the atmosphere (or ocean) if the system reaches a predetermined threshold to prevent overpressuring the membrane.
To evaluate the WPDS performance in this study, we used a set of off-the-shelf membranes, designed for a pressure range between 42 bar and 57 bar. The membrane model used to analyze the freshwater production for WPDS was characterized based on the constant flow rate solution, where the dynamic impact of pressure and flow rate fluctuation on the membrane efficiency was neglected in the study. It is expected that the fluctuation has a direct impact on the efficiency, but the level of impact needs to be further investigated.
Further reducing the hydraulic fluctuation will most likely benefit not only the efficiency, but also the reliability of membranes. Increasing the size of the accumulator is the simplest solution. However, because of the high volume of accumulators needed, the cost increase will have a significant impact on the cost of water, limiting the practical application. In addition, in those higher energetic sea state cases (e.g., SS3 and SS5), the hydraulic fluctuation was relatively small. This was because the area of the hydraulic piston was undersized for those sea states, which resulted in higher mean pressure in the system. This also means that, for a given WPDS, the hydraulic fluctuation in the system can be reduced by decreasing the area of the hydraulic piston. However, this results in more energy being given away through the pressure-relief valve to keep the pressure below the upper threshold limit. Finally, as shown in
Figure 12, connecting multiple WECs to the same RO system would reduce the local (wave-to-wave) oscillation. However, the multiple-WECs-coupled RO system would be less effective at reducing the low-frequency fluctuation in the system, which was caused by the randomness of ocean waves. Theoretically, the influence of random waves on the hydraulic fluctuation can be reduced if a WEC array is deployed with a large number of devices that are widely spread. However, the feasibility of doing so in practice needs further investigation.
As shown in the study, it is possible to reduce the hydraulic fluctuation for a range of operational sea states while maintaining a certain level of freshwater production. However, this could come with a cost, and a successful WPDS design requires a balance between the design performance and cost. In this study, the selection of the hydraulic and RO system parameters is suboptimal. There is a benefit to further exploring alternative approaches to mitigate the fluctuation, for example a multistage RO system with an advanced control method and variable displacement pressure intensifier. All of the previously mentioned WPDS design trade-offs are important considerations when attempting to minimize the cost of water, which requires further investigation.
7. Conclusions
A wave-to-water model was developed by coupling WEC-Sim, a time-domain hydrodynamics model for simulating WECs, to a solution-diffusion model to simulate the process of using wave energy to pump high-pressure seawater through the membrane for freshwater production. Both the hydrodynamics and RO desalination simulations were validated and verified separately. The hydrodynamics WEC-Sim simulation results were validated against existing experimental data. The RO model was verified by comparing the simulation results to those from the ROSA model that has been widely used to design and simulate RO systems. The wave-to-water model was then used to analyze the WPDS under a range of sea states and for the two-WECs-coupled RO system under the dominant wave condition to evaluate the influence of pressure and flow rate fluctuation on the WPDS performance. The results show that the instantaneous energy fluctuation from waves has a significant influence on the responding hydraulic pressure and flow rate, as well as the recovery ratio and, ultimately, the water-production quality. Nevertheless, the fluctuation can be contained within the designed pressure range for the membrane using a pressure accumulator and pressure-relief valve. The effectiveness relies on the wave condition and the selected specifications of the hydraulic components used in the WPDS. Additionally, the concept of a multiple-WECs-coupled RO system was found to be helpful to reduce the wave-to-wave fluctuation when the devices were properly located.
Reducing the hydraulic fluctuation also comes with a price, and evaluating the trade-offs associated with the fluctuation and design specifications is essential for accelerating the wave-powered desalination technology development. Moreover, there is a need to further explore the dynamic impact of hydraulic fluctuation to understand the limitation of state-of-the-art membranes under a fluctuating energy resource. Further investigation could include studying the membrane efficiency and reliability, particularly in association with pressure and flow rate oscillation and biofouling, as well as alternative approaches to mitigate the fluctuation, which are important considerations when attempting to minimize the cost of water.
Author Contributions
Y.-H.Y. developed the wave-to-water numerical model and performed the simulations. D.J. developed the model concept for the reverse-osmosis system and conducted the DOW WAVE model simulations, which were used to verify the developed solution-diffusion model.
Funding
Funding was provided by the U.S. Department of Energy Water Power Technologies Office.
Acknowledgments
This work was authored by the National Renewable Energy Laboratory, operated by the Alliance for Sustainable Energy, LLC, for the U.S. Department of Energy (DOE) under Contract No. DE-AC36-08GO28308. The views expressed in the article do not necessarily represent the views of the DOE or the U.S. Government. The U.S. Government retains, and the publisher, by accepting the article for publication, acknowledges that the U.S. Government retains a nonexclusive, paid-up, irrevocable, worldwide license to publish or reproduce the published form of this work, or allow others to do so, for U.S. Government purposes.
Conflicts of Interest
The authors declare no conflict of interest.
References
- Cornett, A.M. A Global Wave Energy Resource Assessment. In Proceedings of the 18th International Offshore and Polar Engineering Conference (ISOPE’08), Vancouver, BC, Canada, 6–11 July 2008. [Google Scholar]
- Jacobson, P.; Hagerman, G.; Scott, G. Mapping and Assessment of the United States Ocean Wave Energy Resource; Technical Report; Electric Power Research Institute (EPRI): Palo Alto, CA, USA, 2011. [Google Scholar]
- Hicks, D.C.; Mitcheson, G.R.; Pleass, C.M.; Salevan, J.F. Delbouy: Ocean wave-powered seawater reverse osmosis desalination systems. Desalination 1989, 73, 81–94. [Google Scholar] [CrossRef]
- Sharmila, N.; Jalihal, P.; Swamy, A.; Ravindran, M. Wave powered desalination system. Energy 2004, 29, 1659–1672. [Google Scholar] [CrossRef]
- Resolute Marine Energy. Available online: http://www.resolutemarine.com (accessed on 5 November 2018).
- Folley, M.; Suarezb, B.P.; Whittaker, T. An autonomous wave-powered desalination system. Desalination 2008, 220, 412–421. [Google Scholar] [CrossRef]
- Folley, M.; Whittaker, T. The cost of water from an autonomous wave-powered desalination plant. Renew. Energy 2009, 34, 75–81. [Google Scholar] [CrossRef]
- Viola, A.; Curto, D.; Franzitta, V.; Trapanese, M. Sea water desalination and energy consumption: A case study of wave energy converters (WEC) to desalination applications in sicily. Int. J. Heat Technol. 2016, 34. [Google Scholar] [CrossRef]
- Francipane, A.; Pumo, D.; Viola, F.; Noto, L.V. Long term analysis of small desalination plant for potable water supply of tourist areas (in Sicily). Proceedings of Sustainable Management of Environmental Issues Related to Water Stress in Mediterranean Islands—Final Conference and Stakeholders Event, Palermo, Italy, 2013; pp. 197–205. Available online: https://pure.unipa.it/it/publications/long-term-analysis-of-small-desalination-plant-for-potable-water--2 (accessed on 8 November 2018).
- Franzitta, V.; Curto, D.; Milone, D.; Viola, A. The desalination process driven by wave energy: A challenge for the future. Energies 2016, 9, 1032. [Google Scholar] [CrossRef]
- Leijon, J.; Boström, C. Freshwater production from the motion of ocean waves—A review. Desalination 2018, 435, 161–171. [Google Scholar] [CrossRef]
- Yu, Y.H.; Jenne, D. Analysis of a wave-powered reverse-osmosis system and its economic availability in the United States. In Proceedings of the 36th International Conference on Ocean, Offshore and Arctic Engineering, Trondheim, Norway, 25–30 June 2017. [Google Scholar]
- Yu, Y.H.; Lawson, M.; Ruehl, K.; Michelen, C. Development and Demonstration of the WEC-Sim Wave Energy Converter Simulation Tool. In Proceedings of the 2nd Marine Energy Technology Symposium (METS’14), Seattle, WA, USA, 15–17 April 2014. [Google Scholar]
- Sarai Atab, M.; Smallbone, A.; Roskilly, A. An operational and economic study of a reverse osmosis desalination system for potable water and land irrigation. Desalination 2016, 397, 174–184. [Google Scholar] [CrossRef]
- Cummins, W. The Impulse Response Function and Ship Motions; Technical Report; David Taylor Model Basin (DTNSRDC): Washington, DC, USA, 1962. [Google Scholar]
- Lee, C.; Newman, J. WAMIT® User Manual Version 7.1; WAMIT, Inc.: Chestnut Hill, MA, USA, 2015. [Google Scholar]
- Van’t Hoff, J. Hydrodynamic Modelling of the Oscillating Wave Surge Converter. Ph.D. Thesis, The Queen’s University of Belfast, Belfast, UK, 2009. [Google Scholar]
- Guirguis, M.J. Energy Recovery Devices in Seawater Reverse Osmosis Desalination Plants with Emphasis on Efficiency and Economical Analysis of Isobaric Versus Centrifugal Devices. Ph.D. Thesis, University of South Florida, Tampa, FL, USA, 2011. [Google Scholar]
- DOW Water & Process Solutions. DOW Water Solution Design Software. Available online: https://www.dow.com/en-us/water-and-process-solutions/resources/design-software (accessed on 5 November 2018).
- Bull, D.; Dallman, A.R. Wave Energy Prize Experimental Sea States Selection. In Proceedings of the 36th International Conference on Ocean, Offshore and Arctic Engineering, Trondheim, Norway, 25–30 June 2017. [Google Scholar]
| 1. | This did not consider the influence of energy storage and smoothing. When a pressure-relief valve and accumulator were used, the averaged hydraulic pressure in the system dropped to 51 bar. |
Figure 1.
Schematic representation of the wave-powered reverse-osmosis (RO) desalination system.
Figure 1.
Schematic representation of the wave-powered reverse-osmosis (RO) desalination system.
Figure 2.
WEC-Sim wave to water model (left) and schematic representation of the OSWEC (right).
Figure 2.
WEC-Sim wave to water model (left) and schematic representation of the OSWEC (right).
Figure 3.
WEC-Sim and reverse-osmosis desalination models.
Figure 3.
WEC-Sim and reverse-osmosis desalination models.
Figure 4.
Comparison of power performance from WEC-Sim (using a linear damper) and van’t Hoff’s experimental measurements (presented in full scale).
Figure 4.
Comparison of power performance from WEC-Sim (using a linear damper) and van’t Hoff’s experimental measurements (presented in full scale).
Figure 5.
Influence of feed pressure on the permeability coefficient and solute transport parameter.
Figure 5.
Influence of feed pressure on the permeability coefficient and solute transport parameter.
Figure 6.
Influence of feed pressure on the water quality (salinity) of the permeate flow.
Figure 6.
Influence of feed pressure on the water quality (salinity) of the permeate flow.
Figure 7.
Time history of the permeate flow rate (top) and pressure (bottom) for SS2.
Figure 7.
Time history of the permeate flow rate (top) and pressure (bottom) for SS2.
Figure 8.
Influence of accumulator size and precharge pressure on the dynamics of WPDS.
Figure 8.
Influence of accumulator size and precharge pressure on the dynamics of WPDS.
Figure 9.
Summary of the WPDS overall efficiency under different wave conditions.
Figure 9.
Summary of the WPDS overall efficiency under different wave conditions.
Figure 10.
Time history of wave elevation and the dynamics of the RO desalination system (row 1: SS2; row 2: SS3; row 3: SS4; col 1: wave elevation; col 2: flow rate & recovery ratio; col 3: pressure; col 4: permeate solute concentration.
Figure 10.
Time history of wave elevation and the dynamics of the RO desalination system (row 1: SS2; row 2: SS3; row 3: SS4; col 1: wave elevation; col 2: flow rate & recovery ratio; col 3: pressure; col 4: permeate solute concentration.
Figure 11.
WEC-Sim model for the two-WECs-coupled desalination system.
Figure 11.
WEC-Sim model for the two-WECs-coupled desalination system.
Figure 12.
Hydraulic pressure time history from the WPDS and the averaged value from the two-WECs-coupled WPDS case.
Figure 12.
Hydraulic pressure time history from the WPDS and the averaged value from the two-WECs-coupled WPDS case.
Table 1.
Oscillating surge wave energy converter (OSWEC) mass properties and dimensions. MWS, mean water surface.
Table 1.
Oscillating surge wave energy converter (OSWEC) mass properties and dimensions. MWS, mean water surface.
| Parameters | Values (Unit) |
|---|
| Device width and thickness | 18 m × 1.8 m |
| Flap height | 11 m |
| Base height | 2 m |
| Hinge depth | 8.9 m (from MWS) |
| Center of gravity (CG) | 3.9 m (from MWS) |
| Water depth | 10.9 m |
| Mass | 127,000 kg |
| Moment of inertia (at CG) | 1.85 kgm |
Table 2.
Selected wave environment.
Table 2.
Selected wave environment.
| Sea state, SS# | Peak period, Tp (s) | Hs (m) |
|---|
| SS1 | | 2.34 |
| SS2 | | 2.64 |
| SS3 | | 5.36 |
| SS4 | | 2.05 |
| SS5 | | 5.84 |
| SS6 | | 3.25 |
Table 3.
Water-production quantity (permeate flow rate ), quality (permeate solute concentration ), and recovery ratio () using an accumulator and pressure-relief valve.
Table 3.
Water-production quantity (permeate flow rate ), quality (permeate solute concentration ), and recovery ratio () using an accumulator and pressure-relief valve.
| Case Name | Settings | (m/s) | (ppm) | |
|---|
| Baseline | No accumulator or pressure-relief valve | 0.040 | 112 | 0.27 |
| With Acc | With accumulator | 0.041 | 130 | 0.27 |
| With PRV | With pressure-relief valve | 0.026 | 173 | 0.22 |
| With Acc and PRV | With accumulator or pressure-relief valve | 0.034 | 155 | 0.25 |
Table 4.
Desalination model specifications.
Table 4.
Desalination model specifications.
| | Parameters | Values |
|---|
| Hydraulic System | Hydraulic cylinder piston area | 0.26 m |
| Accumulator size | 4 m |
| Accumulator precharge pressure | 30 bar |
| Pressure-relief valve pressure | 56 bar |
| Reverse Osmosis | Osmotic pressure | 30 bar |
| Salinity | 35,946 ppm |
| Membrane area | 35.3 m |
| Number of membranes | 183 |
| Pressure Exchanger | Area ratio | 0.95 |
| Pressure exchanger resistance | 2.7 kNm/s |
© 2018 by the authors. Licensee MDPI, Basel, Switzerland. This article is an open access article distributed under the terms and conditions of the Creative Commons Attribution (CC BY) license (http://creativecommons.org/licenses/by/4.0/).


