Article

RNA-TGGE, a Tool for Assessing the Potential for Bioremediation in Impacted Marine Ecosystems

by
Krishna K. Kadali
1,2,
Esmaeil Shahsavari
1,2,
Keryn L. Simons
2,
Petra J. Sheppard
1,2 and
Andrew S. Ball
1,2,*
1
Centre for Environmental Sustainability and Remediation, School of Applied Sciences, RMIT University, PO Box 71, Bundoora 3083, Australia
2
School of Biological Sciences, Flinders University, GPO Box 2100, Adelaide 5001, Australia
*
Author to whom correspondence should be addressed.
J. Mar. Sci. Eng. 2015, 3(3), 968-980; https://doi.org/10.3390/jmse3030968
Submission received: 18 June 2015 / Accepted: 26 August 2015 / Published: 31 August 2015
(This article belongs to the Special Issue Marine Oil Spills)

Abstract

:
Cultivation-independent genomic approaches have greatly advanced our understanding of the ecology and diversity of microbial communities involved in biodegradation processes. However, much still needs to be resolved in terms of the structure, composition and dynamics of the microbial community in impacted ecosystems. Here we report on the RNA activity of the microbial community during the bioremediation process using RNA Temperature Gradient Gel Electrophoresis (RNA-TGGE). Dendrograms constructed from similarity matching data produced from the TGGE profiles separated a community exhibiting high remediation potential. Overall, increased Shannon Weaver Diversity indices (1–2.4) were observed in the high potential remediation treatment samples. The functionality of the microbial community was compared, with the microbial community showing the greatest organisation also showing the highest levels of hydrocarbon degradation. Subsequent sequencing of excised bands from the microbial community identified the presence of Gammaproteobacteria together with a number of uncultured bacteria. The data shows that RNA TGGE represents a simple, reproducible and effective tool for use in the assessment of a commercial bioremediation event, in terms of monitoring either the natural or augmented hydrocarbon-degrading microbial community.

1. Introduction

In the past, detection and analysis of bacteria in the environment was performed mainly by methods based on bacterial culture [1]. As widely reported, the application of this technique leads to the isolation only of around 0.001% of the microbial population present in sea water and 0.3% present in soil [2,3]. In terms of commercial bioremediation and the management of a bioremediation event, this technology has only been of limited value due to the length of time required for isolation [4]; on many occasions by the time a drop in hydrocarbonoclastic organisms has been observed [5], the bioremediation has already stalled.
Developments in cultivation-independent genomic approaches have greatly advanced our understanding of the ecology and diversity of microbial communities [6]. For example, the separation or detection of small differences in specific DNA sequences can give important information about community structure and the diversity of microbes containing critical genes [4,7]. Many fingerprinting techniques have been developed and used in applied microbial ecology situations, such as bioremediation [1,4,8]. Molecular genetic fingerprinting techniques provide a pattern or profile of the community diversity on the basis of the physical separation of unique nucleic acid species. The general strategy for genetic fingerprinting of microbial communities consist of first, the extraction of nucleic acids (DNA and RNA), second the amplification of genes encoding 16S rRNA and third, the analysis of PCR products by a genetic fingerprinting technique [9,10]. Different amplified products can be separated by electrophoresis to create banding patterns known as a molecular fingerprint. Changes in the molecular fingerprint can be analysed to identify the microbial community structure in space and in time [11].
TGGE (Temperature Gradient Gel Electrophoresis) is an established community profiling tool that allows the study of the complexity and behaviour of microbial communities [9]. TGGE separates the PCR amplified DNA fragments (200–700 bp) of the same length but with different sequences [8] like DGGE (Denaturing Gradient Gel Electrophoresis). TGGE uses temperature gradient to separate DNA fragments. In TGGE, the use of a controlled temperature gradient simplifies the experiment and leads to reproducible gel results [12].
Genomic DNA (16S rDNA) has been widely used in fingerprinting techniques like TGGE to study the microbial community in various environments including petroleum contaminated soils [13], waste water treatment [14], streams and rivers [15] and marine waters [16]. DNA based TGGE is popular because the extraction protocols of DNA are simple and DNA samples can be readily handled. However, genomic DNA may not always be considered a suitable technique because detection of the DNA neither indicates the activity nor proves the viability of cells [17,18]; DNA can persist for long periods of time in the environment after the cells have lost viability [19]. The alternative approach is to use is RNA. rRNA sequences have been used as a marker for bacterial activity since the amount of ribosomes (and their rRNA) per cell was found to be roughly proportional to the growth and activity of bacteria in pure cultures [20]. It was also reported that extraction of RNA instead of DNA followed by reverse transcription polymerase chain reaction gives information on the metabolically active microbial community [4]. Therefore, fingerprints based on RNA better represent the most abundant as well as the more active populations [21]. However, limitations to successful RNA based TGGE exists, including difficulty in extracting intact RNA [22,23]. To date there is limited research in terms of RNA based TGGE [18,24]. The role of many bacteria in the natural environment remains unknown and our knowledge about the structure, composition and dynamics of the microbial community that inhabits impacted ecosystems is still lacking [25]. Recent progress in metagenomic approaches such as next generation sequencing (NGS) may lead to a better understanding of microbial communities involved in hydrocarbon degradation in marine environments. However, these methods are still labour intensive, and expensive. For example, metagenomics generates huge amounts of data which needs high-performance computing and automated software whereas RNA-TGGE fingerprinting as a simple routine technique may be more suitable for monitoring a bioremediation project.
The aim of this study was to analyse the 16S rRNA amplicons based on TGGE from mesocosms which examined the role of bioaugmentation and/or biostimulation on the extent of mineralisation of weathered crude oil in sea water and study their diversity and functionality through Parento-Lorenz curves. We suggest that this is a potentially important tool for use in the assessment of a bioremediation event, in terms of monitoring either the natural or augmented hydrocarbon-degrading microbial community. To date, certainly in the remediation industry, the application of molecular microbial ecological techniques has not been widely adopted. This study highlights the potential of RNA-TGGE as a reproducible tool for the monitoring of assessing biodegradation potential during bioremediation.

2. Materials and Methods

2.1. Sample Collection

Sea water and weathered crude oil samples were collected from the three treatments C (seawater + BH medium + weathered crude oil + consortia), O (seawater + BH medium + weathered crude oil) and S (seawater + BH medium) obtained from previous work [26] in which consortia comprised of six bacterial strains grown separately and mixed (final OD600 0.04). Samples were collected from the oil-medium interface using sterile 10 mL tubes. All the samples used were in duplicates. Samples were further analyzed sequentially using molecular techniques as described below. All the sea water used for the experiment was freshly collected from the South Australian coast.

2.2. Nucleic Acid Extraction

Glass beads (0.5 g) (212–300 μm) were measured into 2 mL tubes and sterilised at 121 °C for 15 min. Samples (600 μL) and stool lysis buffer (800 μL) (Qiagen, Hilden, Germany) were added into the sterile tubes containing glass beads. The tubes were bead beaten for 1 min using a mini-bead beater (Biospec Product, Bartlesville, OK, USA), then incubated for 6 min at 70 °C. After incubation the tubes were centrifuged at 13,000 rpm at 4 °C for 2 min. The supernatant from the tubes was separated into sterile 2 mL Eppendorf tubes (Melbourne, Australia) and equal volumes of phenol chloroform (1:1 ratio) added. Eppendorf tubes were centrifuged at 13,000 rpm at 4 °C for 2 min. The supernatants were separated into new sterile Eppendorf tubes and again equal volumes of phenol-chloroform were added. The tubes were re-spun at 13,000 rpm at 4 °C for 2 min. Supernatants were placed into sterile Eppendorf tubes containing an equal volume of cold iso-propanol. The tubes were incubated at −20 °C for 1 h. After incubation the tubes were centrifuged at 13,000 rpm at 4 °C for 12 min. Supernatants were discarded and an equal volume of cold ethanol added. After mixing the tubes were centrifuged for 13,000 rpm at 4 °C for 12 min. The supernatant was discarded and the pellet was allowed to dry. Finally the pellet was dissolved in nuclease-free water (50 μL) and stored at −20 °C.

2.3. DNase Treatment of RNA Samples

RNA samples were treated with using RQ1 (RNase free DNase, Promega, Melbourne, Australia) according to the manufacturer’s guidelines.

2.4. cDNA Synthesis

The first cDNA strand was synthesised using a two-step process (Promega, Melbourne, Australia). In the first step 14 μL reaction mixture containing RNA (8 μL), reverse primer 518R (2 μL) (10 pmol/μL) and sterile nuclease-free water was incubated at 70 °C for 8 min and cooled on ice quickly for 5 min. In the second step the 25 μL reaction mixture containing RNA (14 μL) (from step 1), M-MLV RT buffer (5 μL) (5×), deoxynucleoside triphosphate (dNTP) mixture (1.25 μL) (10 mM), M-MLV reverse transcriptase (1 μL) (100U/μL) and sterile nuclease-free water was incubated at 55 °C for 60 min followed by 70 °C for 15 min to get final cDNA.

2.5. Bacterial cDNA Amplification

The active bacterial community (cDNA) was evaluated by PCR using universal primers of 16S rDNA using the following primers, 341F (5′ CCTACGGGAGGCAGCAG 3′) with GC clamp (CGCCCGCCGCGCGCGGCGGGCGGGGCGGGGGCACGGGGGG) and 518R (50-ATTACCGCGGCTGCTGG) [10]. The PCR amplification of bacterial cDNA was performed in a 50 μL polymerase chain reaction (PCR) mixture. The master mix contained forward primer (2 μL) (10 pmol/μL), reverse primer (2 μL) (10 pmol/μL), magnesium chloride (3 μL) (25 mM), deoxynucleoside triphosphate (dNTP) mixture (1 μL) (10 mM), GoTaq flexi buffer (10 μL) (5×), Taq polymerase enzyme (0.25 μL) (5U/μL) and sterile nuclease-free water per PCR reaction. The cDNA extract (2 μL) was added to 48 μL of master mix. The thermocycling program used consisted of one cycle 5 min at 95 °C; 4 cycles of 30 s at 94 °C, 30 s at 55 °C, 1 min at 72 °C; 25 cycles of 30 s at 92 °C, 30 s at 55 °C, 1 min at 72 °C; and a final extension at 72 °C for 10 min. All the reagents were obtained from Promega, Melbourne, Australia.

2.6. TGGE (Temperature Gradient Gel Electrophoresis)

Products obtained from PCR were analysed by TGGE, using a TGGE Maxi System (Biometra, Germany). Gels were composed of 6% acrylamide (37:5:1). Polymerization of gels were catalysed by the addition of N,N,N′,N′-tetramethylethylenediamine (50 μL) and 10% ammonium persulfate solution (500 μL) added to the gel solution (50 mL). The gel was loaded with products amplified with 341F-GC and 518R primers (8 μL) and a dye solution (2 μL) and run for 8 h at 250 V with a parallel temperature gradient ranging from 45 to 60 °C. After electrophoresis, the gel was silver stained [27]. Gel images were scanned with an Epson V700 scanner (Epson, Melbourne, Australia).

2.7. Identification of Bacterial Species from TGGE Gel

Bands of interest on the TGGE gel was excised aseptically with sterile scalpels and incubated in sterile nuclease-free water (100 μL) overnight at 4 °C. The eluted DNA was subjected to PCR using primers 341F and 518R.
PCR reactions were purified using a PCR clean up kit (Promega, Melbourne, Australia) and quantified by Nanodrop (Thermo Fisher Scientific, Melbourne, Australia). The samples were then sent for sequencing to AGRF (Australian Genome Research Facility) according to AGRF requirements. Chromatographs of the sequences received from the AGRF were checked, edited and assembled using Sequencher software (Version 4.9). The aligned sequences were analysed using the nucleotide BLAST program. Species were matched with highest identity scoring.

2.8. Statistical Analyses

Relative band intensities or peaks on TGGE community profiles were calculated using Phoretix 1D advanced analysis package (Totallab, Newcastle, UK). Each band was considered to be an operational taxonomic unit (OTU) and the band densities were then used to calculate the Shannon Weaver diversity and Pareto-Lorenz curve [28]. For each TGGE lane, the respective bands were ranked from high to low based on their intensities; subsequently, the cumulative normalized number of bands was used as X-axis, and their respective cumulative normalized intensities represent the Y-axis.

3. Results and Discussion

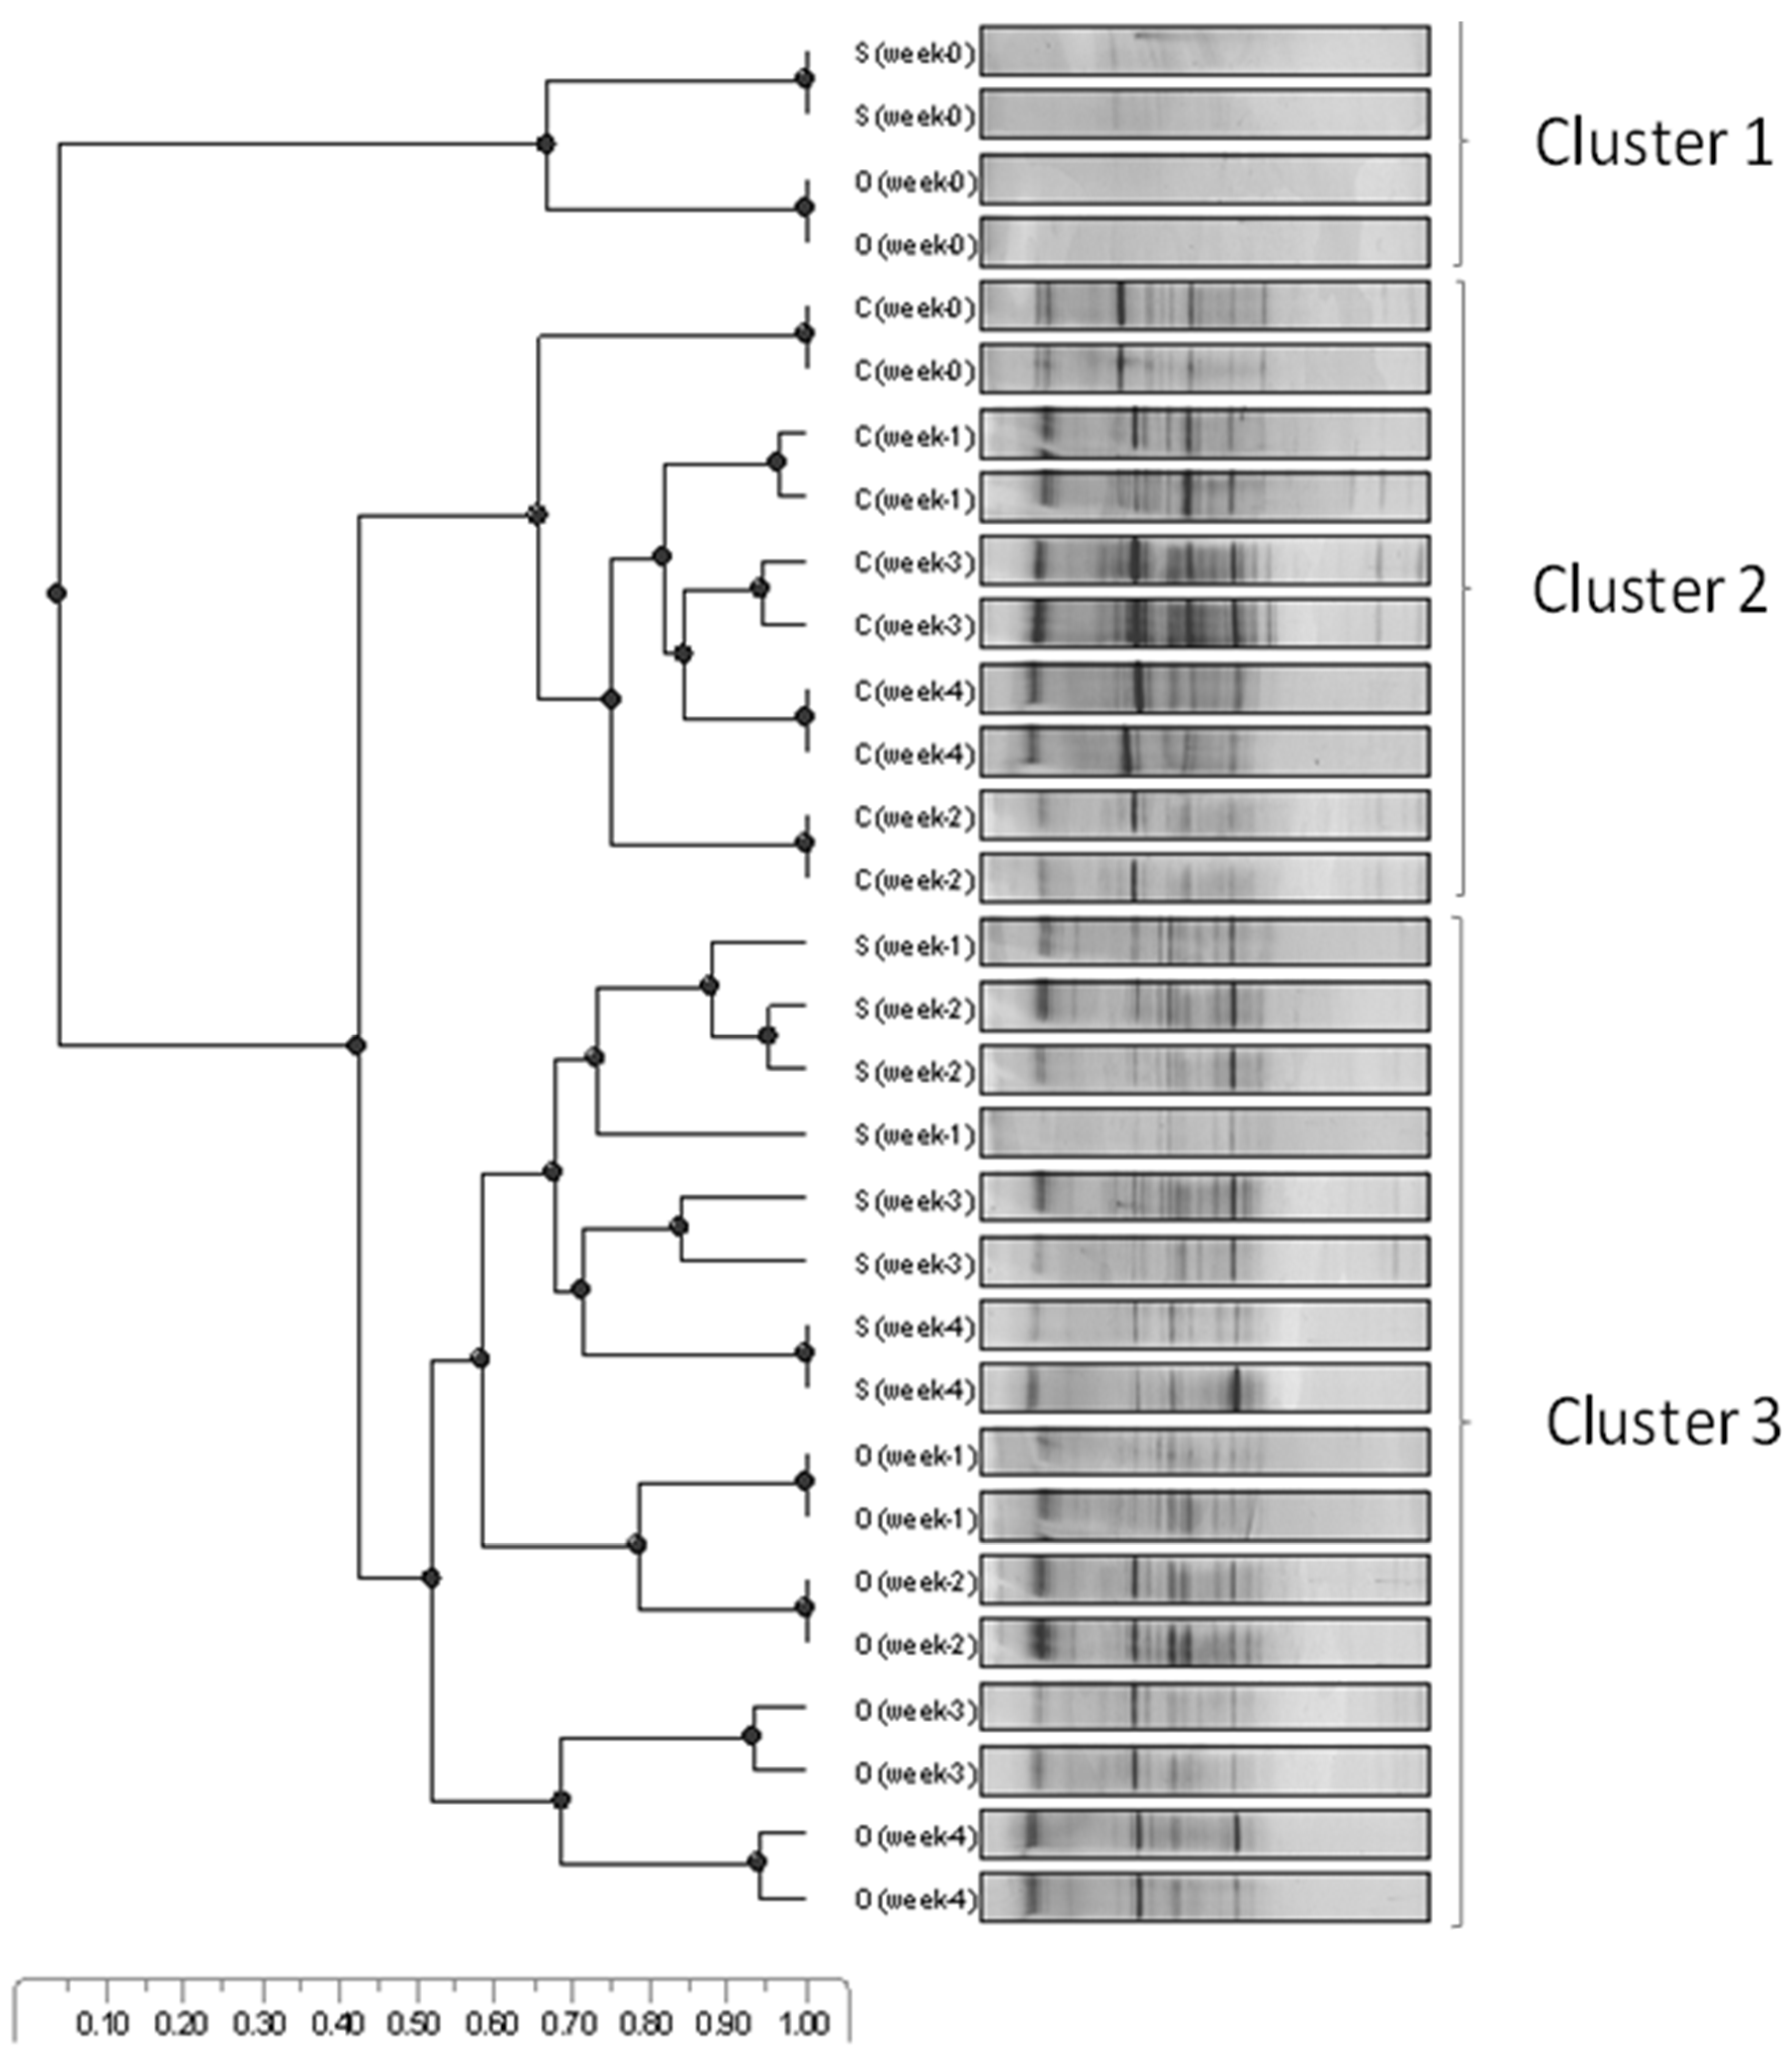
3.1. Microbial Community Dynamics

The samples collected were used to extract rRNA and subsequent cDNA were produced using primers 341F-GC and 518Rfor use in the TGGE gel. TGGE gel profiles were used to construct an UPGMA dendrogram (Figure 1) from similarity matching data. The samples were C (seawater + BH medium + weathered crude oil + consortia), O (seawater + BH medium + weathered crude oil) and S (seawater + BH medium). Sample C represented a high remediation capacity community, able to significantly degrade weathered crude oil (28% degradation). Sample O represented a microbial community with a lower remediation potential in terms of degradation of weathered crude oil (16%). Sample S represented the microbial community of a pristine sea water sample which was amended with nutrients but was not contaminated with petrogenic hydrocarbons [26].
The amplified PCR products from Week 0 through to Week 4, of all three different treatment samples (C, O and S) were analysed by TGGE. Generally at Week 0, the bacterial community gave risetoonly a few bands with low intensity in all treatments (Figure 1). Bacterial profile analysis of the highest remediation potential community (C) showed consistently greater band intensities (Figure 1). Bacterial communities in three different treatment samples represented three distinct clusters (Figure 1); cluster 1 was the smallest representing Week 0 samples of S (seawater + BH medium) and O (seawater + BH medium + weathered crude oil) and showed a similarity value of 67%. Cluster 2 represented treatment C (seawater + BH medium + weathered crude oil + consortia) for all samples from Week 0 to Week 4; Week 0 were different from Week 1; Week 2, Week 3 and Week 4 showed 66% similarity while Week 3 and Week 4 profile were84% similar (Figure 1). Cluster 3 represented Week 1 to Week 4 samples of O (seawater + BH medium + weathered crude oil) and Week 1 to Week 4 of S (seawater + BH medium) (Figure 1).
Figure 1. UPGMA dendrogram constructed from similarity matching data produced from the TGGE profiles of cDNA amplified from Week 0 to Week 4 of samples S (seawater + BH medium), O (seawater + BH medium + weathered crude oil), and C (seawater + BH medium + weathered crude oil + consortia). The scale bar represents percent similarity. Duplicate samples were analysed.
Jmse 03 00968 g001
During the initial week (Week 0) the natural community in sea water should be similar in all treatments, so treatments S (seawater + BH medium), O (seawater + BH medium + weathered crude oil) from Week 0 represented the same cluster (Figure 1). However treatment C (seawater + BH medium + weathered crude oil + consortia) from Week 0 did not fall into same cluster (Cluster 1) presumably due to fact that the community in sea water was already changed by adding the consortia. Further weeks (Week 1 to Week 4) of treatment S (seawater + BH medium) formed the same cluster which included treatment O (sea water + BH medium + weathered crude oil) from Week 1 to Week 4, showing that the community in natural sea water changed from the initial week. Throughout the experiment, for Week 0 to Week 4 for treatment C (seawater + BH medium + weathered crude oil + consortia) all samples clustered together (Cluster 2) (Figure 1). However within the cluster, changes were observed, presumably due to changes in the dominance of the bacterial species. This was observed clearly in Week 3 (Figure 1).
It can be concluded that TGGE was found to be an excellent tool for analysing communities and separating those exhibiting a greater ability to carry out bioremediation from other, less active communities (Figure 1).
RNA-TGGE data was not only used to cluster the communities or differentiate the communities having high potential in bioremediation but can also be used for a range of analyses (Shannon Weaver diversity, Pareto-Lorenz curve) as well as for sequencing through excision of the TGGE bands which provides further information. All this data represents important management and reporting information relating to successful bioremediation.

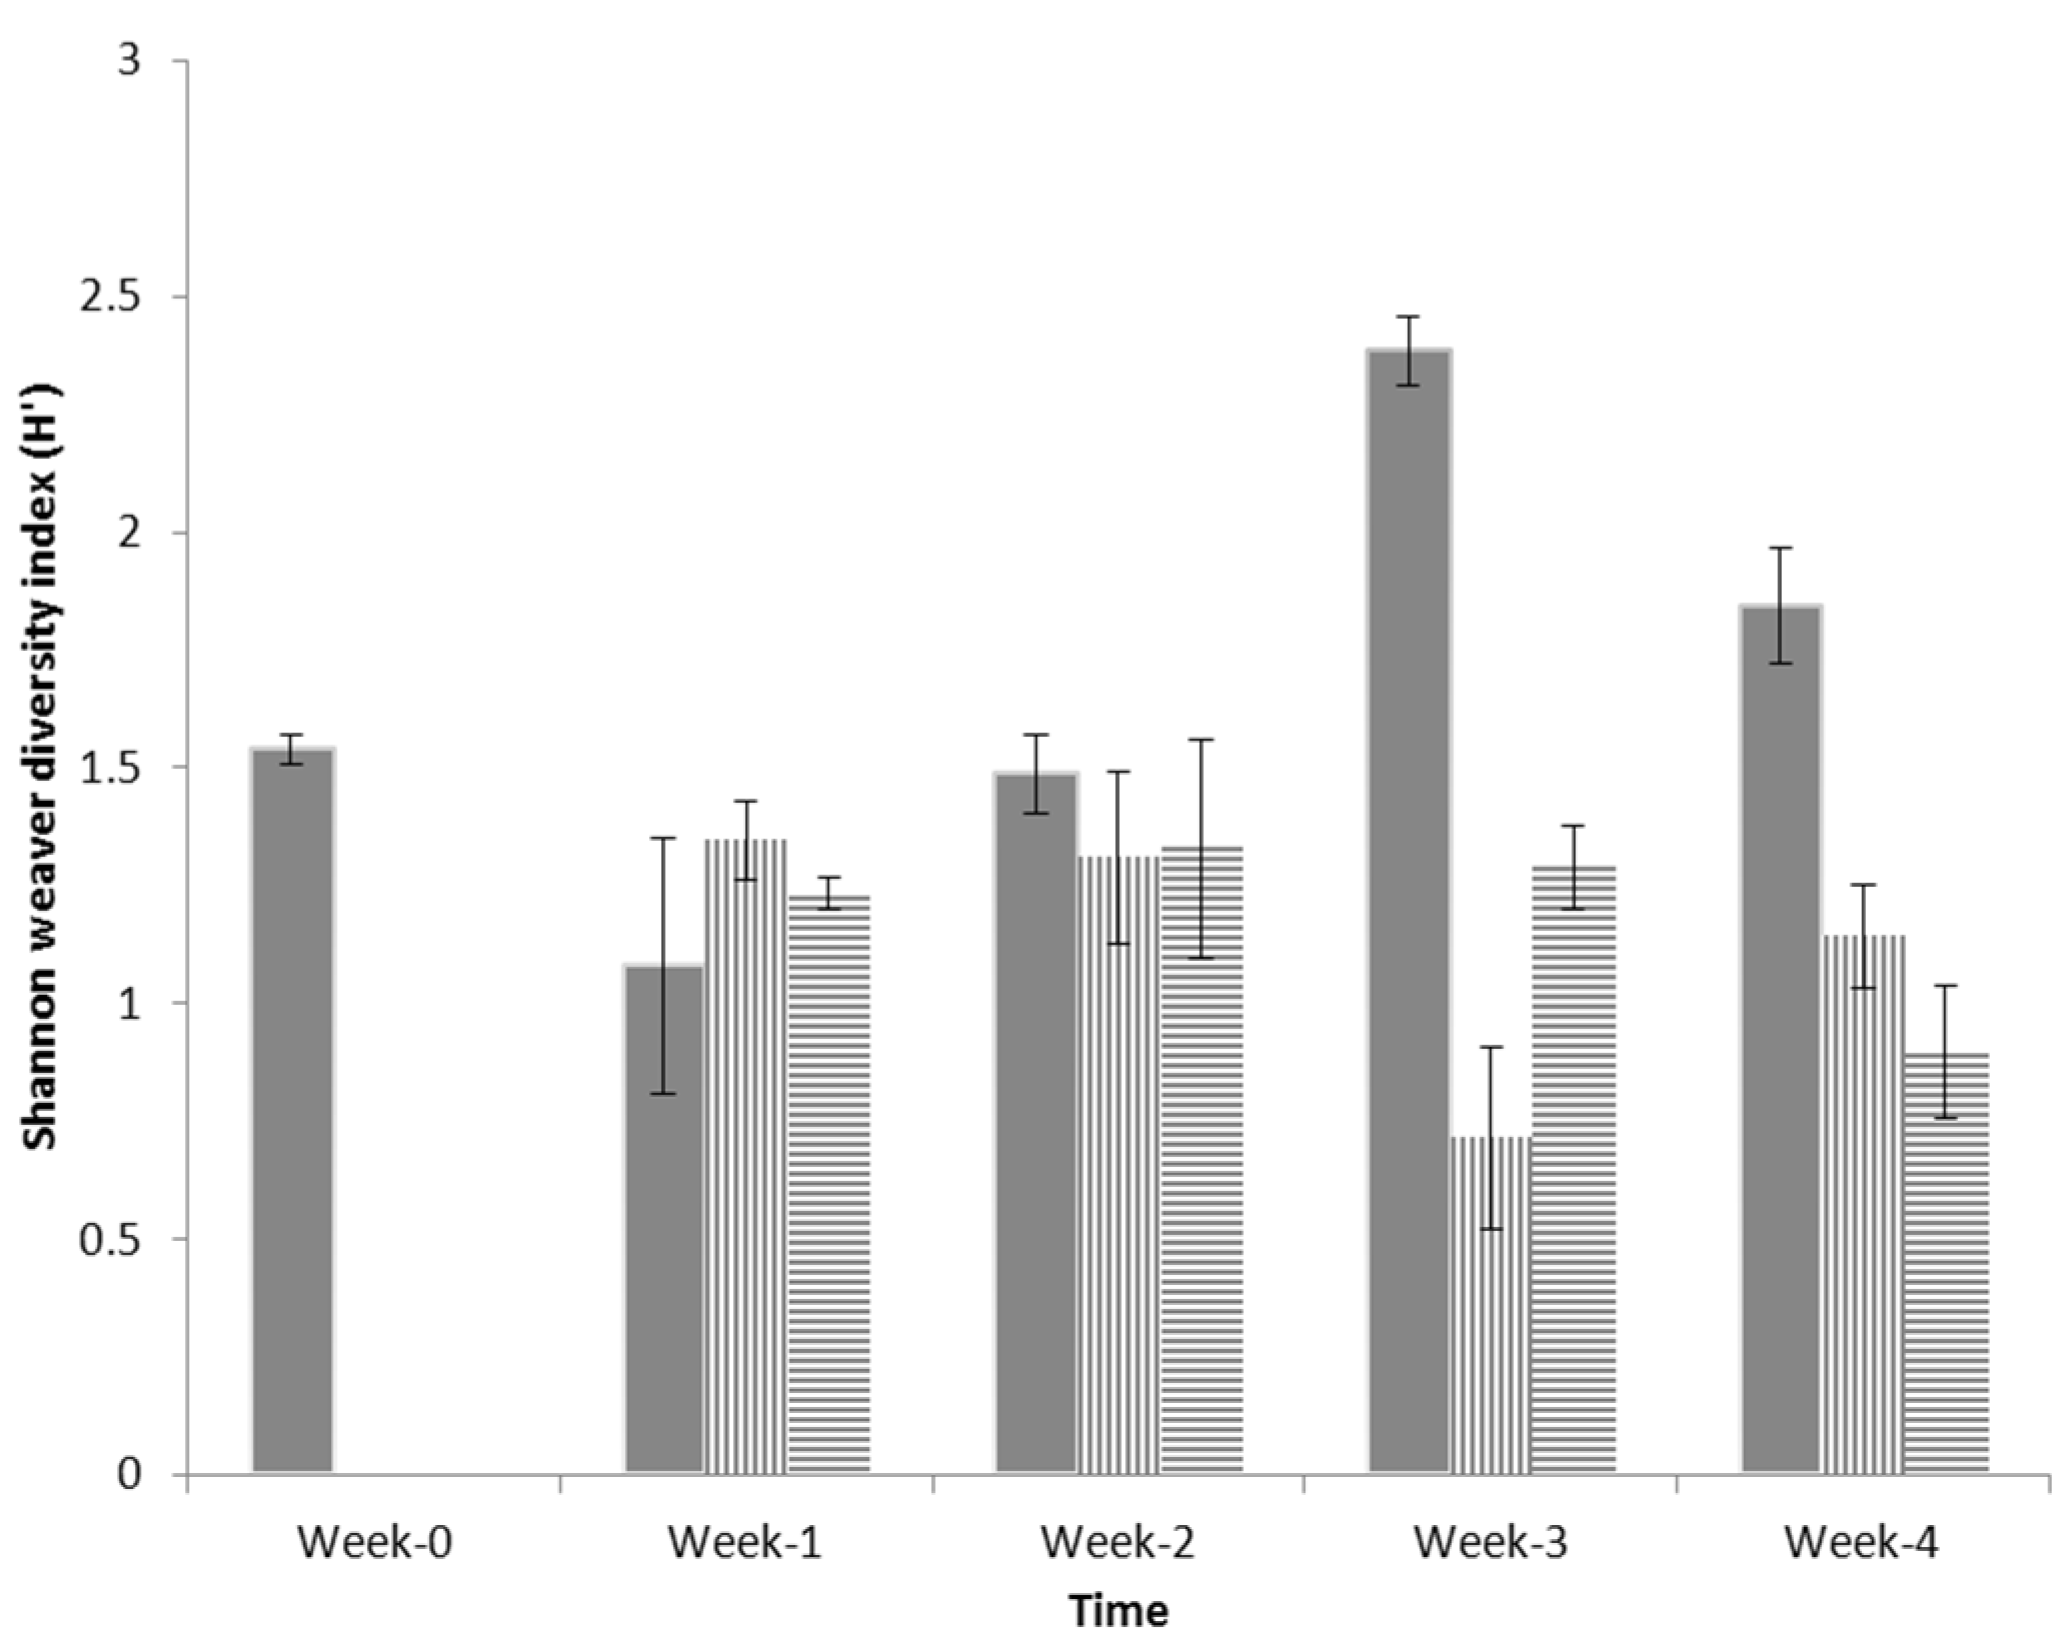
3.2. Shannon Weaver Diversity

Shannon Weaver diversity represents an estimation of species richness [1,29]. Shannon Weaver diversity was calculated for each of the differently treated samples (C, O and S) (Figure 2). Greatest diversity was observed in sample C (seawater + BH medium+ weathered crude oil + consortia), with greatest diversity being observed in the Week 3 sample. Increased diversity is generally an indication of good resilience of a community and generally associated with relatively higher levels of bioremediation [30].

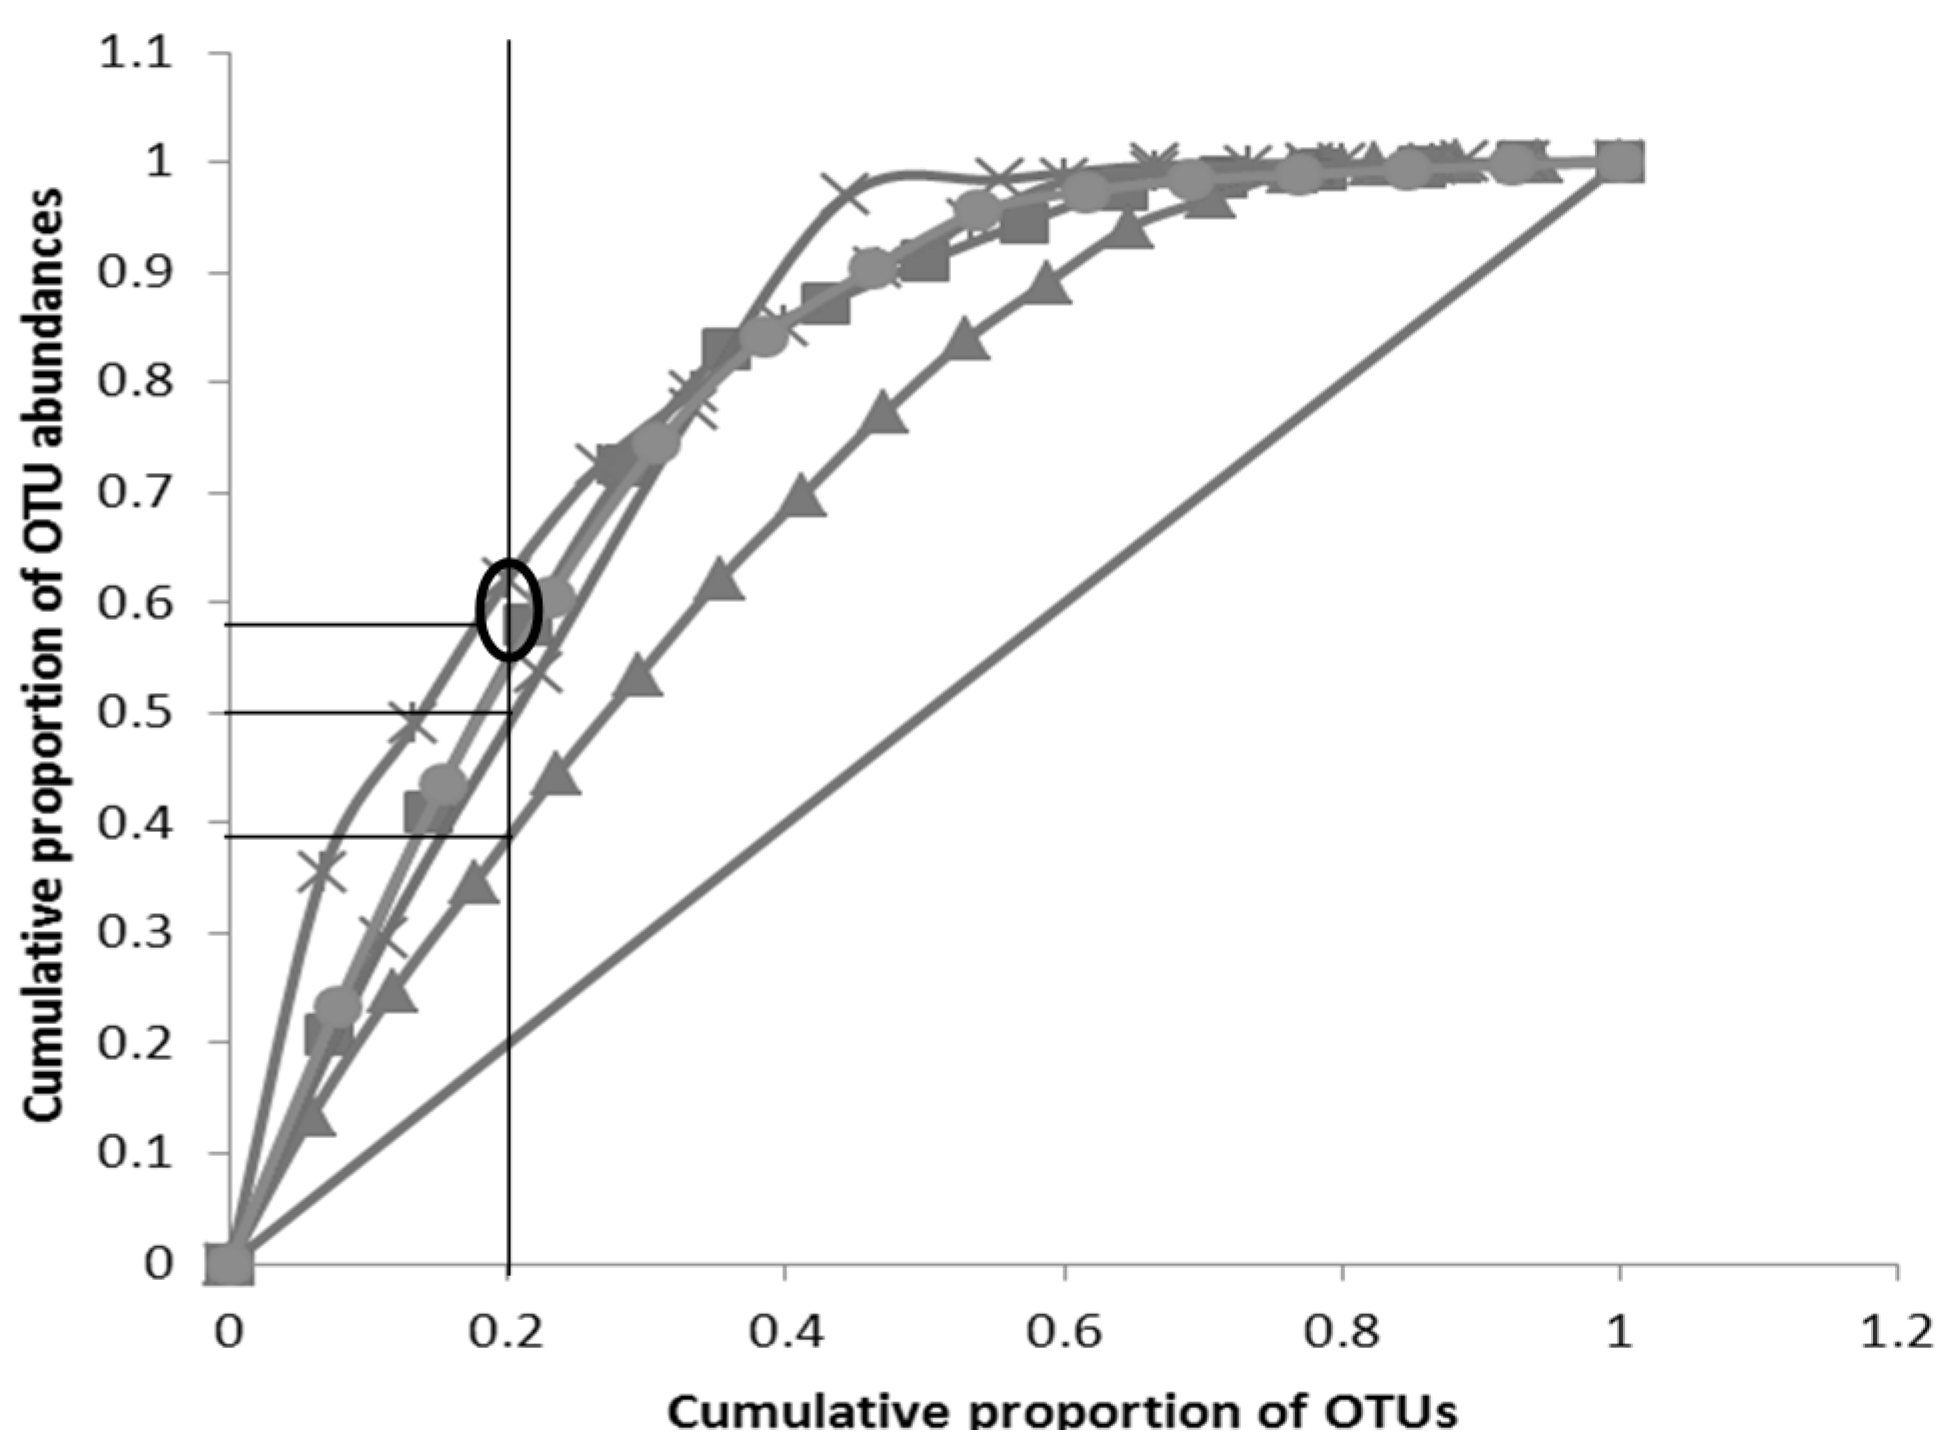
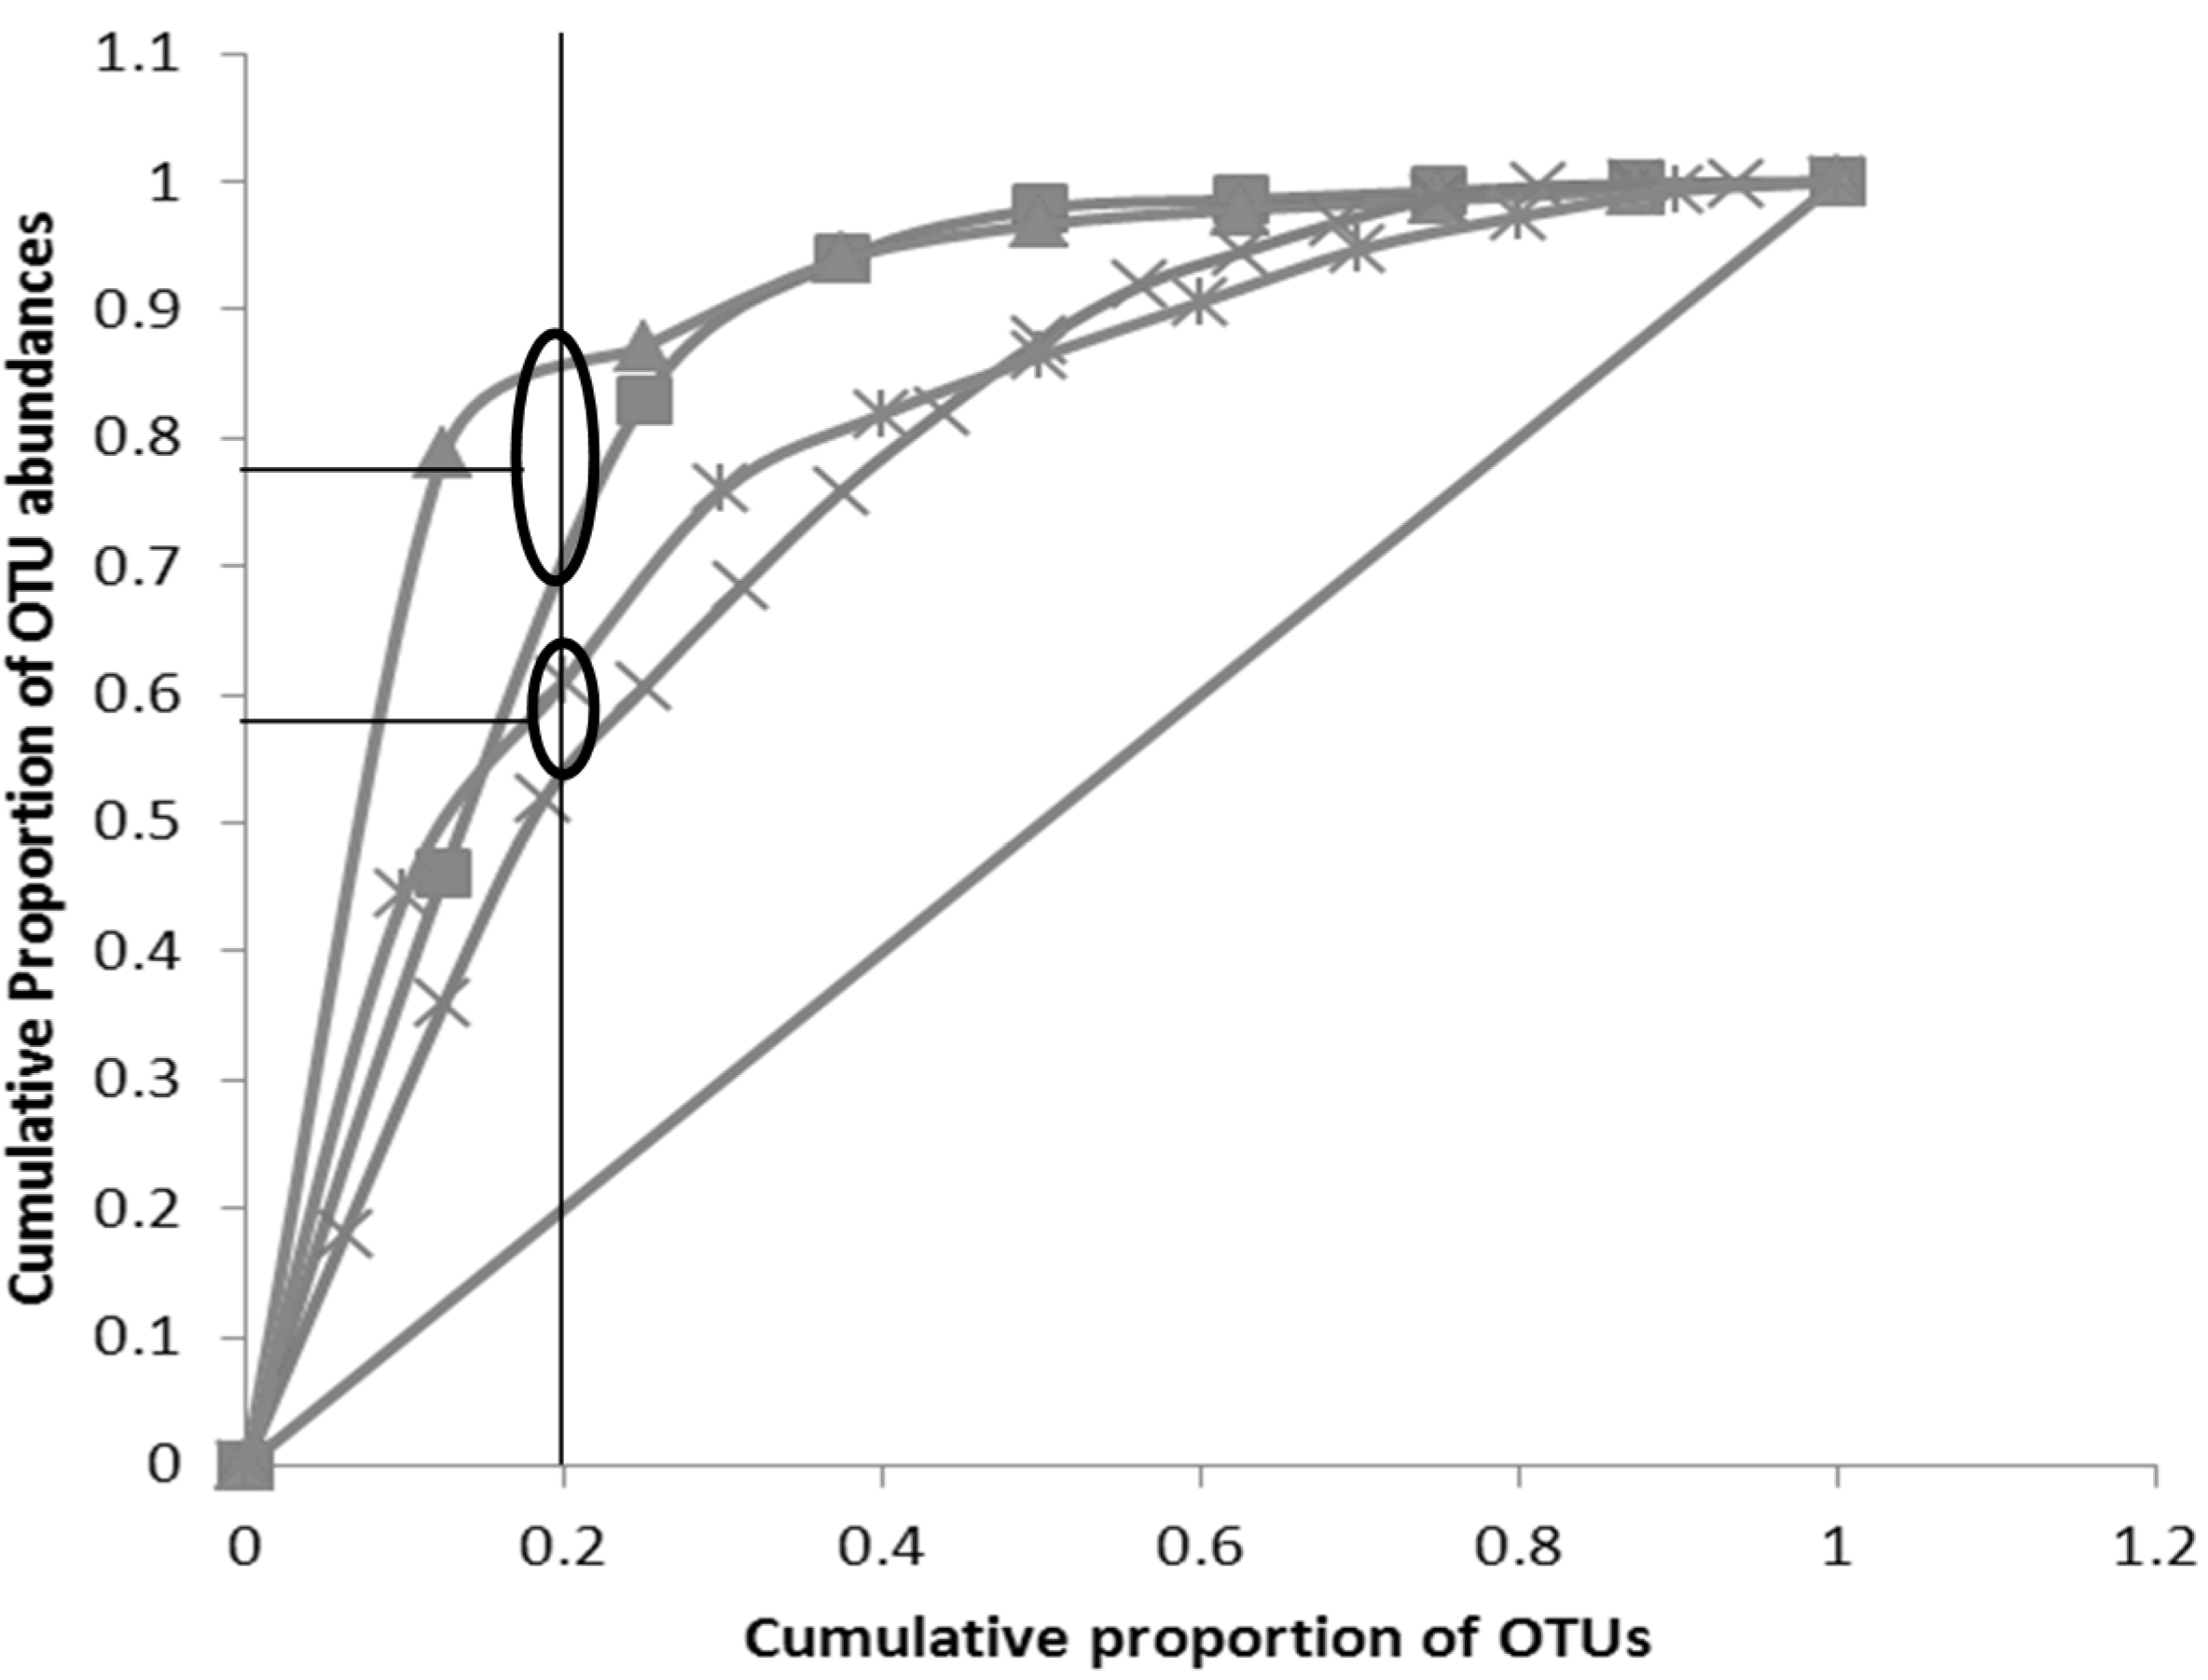
3.3. Pareto-Lorenz Curve

Pareto Lorenz curves represent the functional organisation of community. This organisation is the result of the action of microorganisms that are most fitting to the ongoing environmental-microbiological interactions [28]. Pareto-Lorenz curves were constructed using the band intensities of the three treatments S (seawater + BH medium), O (seawater + BH medium + weathered crude oil), and C (seawater + BH medium + weathered crude oil + consortia) representing Week 0 to Week 4. As a general rule, the more the PL curve deviates from the 45° diagonal (the theoretical perfect evenness line), the less evenness can be observed in the structure of the studied community. The latter means that a smaller fraction of different species is present in dominant numbers. The 25%, 45% and the 80% curves based on the Y-axis projection of their respective intercepts with the 20% X-axis represent low, medium and high functional organisation respectively [26,28].
Figure 2. Diversity of three treatment samples“ Jmse 03 00968 i001” C (seawater + BH medium + weathered crude oil + consortia); “ Jmse 03 00968 i002” O (seawater + BH medium + weathered crude oil); and “ Jmse 03 00968 i003” S (seawater + BH medium) from Week 0 to Week 4. Duplicate data (n = 2) were analysed.
Jmse 03 00968 g002
Communities of treatment C (seawater + BH medium + weathered crude oil + consortia) in Week 2 and Week 3 suggested that the most active species (playing a major role in degradation) were dominant from the PL curve at 50% and 40% (Figure 3) [28]. The remaining Weeks (Week 0, Week 1 and Week 4) of treatment C (seawater + BH medium + weathered crude oil + consortia) represent a specialised community (PL curve around 60%) in which a small number of species were dominant and all others species were present in low numbers [31]. A similar specialised community was also observed in treatment O (Week 1 to Week 4), (seawater + BH medium + weathered crude oil) (Figure 4) and treatment S (seawater + BH medium) (Figure 5). This also explains why treatments O and S formed a cluster (Cluster 3) (Figure 1). There were no PL curves at Week 0 for both treatments (treatment O and treatment S) due to the low number of DNA bands detected (Cluster 1) (Figure 1).
Figure 3. PL curves representing from Week 0 to Week 4 oftreatment C (seawater + BH medium + weathered crude oil + consortia). (“ Jmse 03 00968 i004” Perfect evenness line; “ Jmse 03 00968 i005” C (Week 4); “ Jmse 03 00968 i006” C (Week 3); “ Jmse 03 00968 i007” C (Week 2);“ Jmse 03 00968 i008” C (Week 1);“ Jmse 03 00968 i009” C (Week 0)).Oval represents a grouping of curves (more than one) and horizontal line without oval represents asingle PL curve.
Jmse 03 00968 g003
Figure 4. PL curves representing from Week 1 to Week 4 oftreatment O (seawater + BH medium + weathered crude oil). (“ Jmse 03 00968 i004” Perfect evenness line; “ Jmse 03 00968 i005” O (Week 4); “ Jmse 03 00968 i006” O (Week 3); “ Jmse 03 00968 i007” O (Week 2);“ Jmse 03 00968 i008” O (Week 1)).
Jmse 03 00968 g004
Figure 5. PL curves representing from Week 1 to Week 4 of treatment S (seawater + BH medium). (“ Jmse 03 00968 i004” Perfect evenness line; “ Jmse 03 00968 i005” S (Week 4); “ Jmse 03 00968 i006” S (Week 3);“ Jmse 03 00968 i007” S (Week 2); “ Jmse 03 00968 i008” S (Week 1)).
Jmse 03 00968 g005

3.4. RNA-TGGE Bands

The additional key feature of RNA-TGGE is that it allows to the excision and sequencing of bands from the gel, enabling the identification of members of the active community (Table 1). Sequenced data from TGGE excised bands showed the presence of two species in all the three treatments, namely a Gammaproteobacteria and an uncultured bacterium (Table 1). However, these species represented various identities (accession number) and similarities in each treatment confirming the fact that they are certainly unique in nature (Table 1).
Table 1. Different bacterial species identified from the TGGE gel bands excised in three different treatments (C, O and S), their identity and similarity.
Identified SpeciesTreatmentAccession No.Similarity (%)
Pseudomonas sp. (Gammaproteobacteria)CJF778683.196
Uncultured marine bacteriumCFM211075.193
Uncultured Alcanivorax sp. (Gammaproteobacteria)CJF979266.184
Uncultured bacterium cloneCHQ827507.1100
Uncultured organism cloneCJN528201.188
Uncultured bacterium cloneCHM580751.199
Uncultured bacterium cloneCJN178389.1100
Alcanivoraxborkuumensis (Gammaproteobacteria)CFJ218422.194
Alcanivorax sp. (Gammaproteobacteria)CAB681673.191
Alcanivoracaceae bacterium (Gammaproteobacteria)OHQ537302.197
Uncultured betaproteobacteruimOGQ274246.188
Alcanivorax sp. (Gammaproteobacteria)OHE586882.196
Uncultured bacteriumOEU255846.181
Uncultured bacteriumSDQ861039.191
Alcanivorax sp. (Gammaproteobacteria)SHM171217.195
Alcanivorax sp. (Gammaproteobacteria)SHM171217.198
Marinobactermobilis strain (Gammaproteobacteria)SNR_044456.195
In this present study RNA-TGGE was carried out using universal bacterial primers rather than specific primers, because the site to be remediated contains multiple types of compounds or contaminants [2,32] which is not ideal for the application of specific primers. In this study the contaminant was weathered crude oil, representing a complex mixture of tens of thousands of compounds [31,33,34,35]. However, RNA-TGGE can be readily applied to bioremediation where there are few contaminants through the use of specific gene primers.
Previous researchers have shown that TGGE is well suited for fingerprinting bacterial communities by separating PCR-amplified fragments [36] because it provides a crucial measurement for different habitants, thereby providing a comparative study [15]. In addition, this technique can be coupled with other techniques [13] so, this technique not only useful as a management tool but also can be useful technology in commercial bioremediation.

4. Conclusions

RNA-TGGE was found to be an excellent tool for analysing hydrocarbon-degrading bacterial communities in marine ecosystems representing a simple, reproducible, management tool for commercial bioremediation purposes.

Acknowledgments

This research was supported by the Australia India Strategic Research Fund (BFO20032) and also by the South Australian Premiers Science Research Fund.

Author Contributions

Conceived and designed the experiments: K.K.K., K.L.S. and A.S.B.; Performed the experiments: K.K.K., K.L.S. and P.J.S.; Analysed the data: K.K.K. and E.S.; Wrote the paper: K.K.K., E.S. and A.S.B.

Conflicts of Interest

The authors declare no conflict of interest.

References

  1. Ogino, O.; Koshikawa, H.; Nakahara, T.; Uchiyama, H. Succession of microbial communities during a biostimulation process as evaluated by DGGE and clone library analysis. J. Appl. Microbiol. 2001, 91, 625–635. [Google Scholar] [CrossRef] [PubMed]
  2. Kadali, K.K.; Simons, K.L.; Skuza, P.P.; Moore, R.B.; Ball, A.S. A complementary approach to identifying and assessing the remediation potential of hydrocarbonoclastic bacteria. J. Microbiol. Methods 2012, 88, 348–355. [Google Scholar] [CrossRef] [PubMed]
  3. Roose-Amsaleg, C.L.; Garnier-Sillam, E.; Harry, M. Extraction and purification of microbial DNA from soil and sediment samples. Appl. Soil Ecol. 2001, 18, 47–60. [Google Scholar] [CrossRef]
  4. Widada, J.; Nojiri, H.; Omori, T. Recent developments in molecular techniques for identification and monitoring of Xenobiotic-degrading bacteria and catabolic genes in bioremediation. Appl. Microbiol. Biotechnol. 2002, 60, 45–49. [Google Scholar] [PubMed]
  5. Connon, S.A.; Giovannoni, S.J. High-throughput methods for culturing microorganisms in very-low-nutrient media yield diverse new marine isolates. Appl. Environ. Microbiol. 2002, 68, 3878–3885. [Google Scholar] [CrossRef] [PubMed]
  6. Frias-Lopez, J.; Shi, Y.; Tyson, G.; Coleman, M.L.; Schuster, S.C.; Chisholm, S.W.; Delong, E.F. Microbial community gene expression in ocean surface waters. Proc. Natl. Acad. Sci. USA 2008, 105, 3805–3810. [Google Scholar] [CrossRef] [PubMed]
  7. Muyzer, G.; de Waal, E.C.; Uitterlinden, A.G. Profiling of complex microbial populations by denaturing gradient gel electrophoresis analysis of polymerase chain reaction-amplified genes coding for 16S rRNA. Appl. Environ. Microbiol. 1993, 59, 695–700. [Google Scholar] [PubMed]
  8. Nocker, A.; Burr, M.; Camper, A.K. Genotypic microbial community profiling: A critical technical review. Microb. Ecol. 2007, 54, 276–289. [Google Scholar] [CrossRef] [PubMed]
  9. Muyzer, G. DGGE/TGGE a method for identifying genes from natural ecosystems. Curr. Opin. Microbiol. 1999, 2, 317–322. [Google Scholar] [CrossRef]
  10. Muyzer, G.; Smalla, K. Application of denaturing gradient gel electrophoresis (DGGE) and temperature gradient gel electrophoresis (TGGE) in microbial ecology. Antonie Van Leeuwenhoek 1998, 73, 127–141. [Google Scholar] [CrossRef] [PubMed]
  11. Alvarez, P.J.J.; Illman, W.A. Bioremediation and Natural Attenuation; John Wiley and Sons, Inc.: Hoboken, NJ, USA, 2006. [Google Scholar]
  12. Felske, A.; Akkermans, A.D.L.; de vos, W.M. Quantification of 16S rRNAs in complex bacterial communities by multiple competitive reverse transcription-PCR in temperature gradient gel electrophoresis fingerprints. Appl. Environ. Microbiol. 1998, 64, 4581–4587. [Google Scholar] [PubMed]
  13. Cheung, P.; Kinkle, B.K. Mycobacterium diversity and pyrine mineralization in petroleum-contaminated soils. Appl. Environ. Microbiol. 2001, 67, 2222–2229. [Google Scholar] [CrossRef] [PubMed]
  14. Gomez-Villalba, B.; Calvo, C.; Vilchez, R.; Gonzalez-Lopez, J.; Rodelas, B. TGGE analysis of the diversity of ammonia-oxidizing and denitrifying bacteria in submerged filter biofilms for the treatment of urban wastewater. Appl. Microbiol. Biotechnol. 2006, 72, 393–400. [Google Scholar] [CrossRef] [PubMed]
  15. Beier, S.; Witzel, K.; Marxsen, J. Bacterial community composition in central European running waters examined by temperature gradient gel electrophoresis and sequence analysis of 16S rRNA genes. Appl. Environ. Microbiol. 2008, 74, 188–199. [Google Scholar] [CrossRef] [PubMed]
  16. Kaartokallio, H.; Tuomainen, J.; Kuosa, H.; Kuparinen, J.; Martikainen, P.J.; Servomaa, K. Succession of sea-ice bacterial communities in the Baltic sea fast ice. Polar Biol. 2008, 31, 783–793. [Google Scholar] [CrossRef]
  17. Felske, A.; Wolterink, A.; Lis, R.V.; Akkermans, A.D.L. Phylogeny of the main bacterial 16S rRNA sequences in Drentse A grassland soils (The Netherlands). Appl. Environ. Microbiol. 1998, 64, 871–879. [Google Scholar] [PubMed]
  18. Panas, P.; McMullan, G.; Dooley, J.S.G. RT-TGGE as a guide for the successful isolation of phosphonoacetate degrading bacteria. J. Appl. Microbiol. 2007, 103, 237–244. [Google Scholar] [CrossRef] [PubMed]
  19. Nocker, A.; Camper, A.K. Novel approaches toward preferential detection of viable cells using nucleic acid amplification techniques. FEMS Microbiol. Lett. 2009, 291, 137–142. [Google Scholar] [CrossRef] [PubMed]
  20. Wagner, R. The regulation of ribosomal RNA synthesis and bacterial cell growth. Arch. Microbiol. 1994, 161, 100–109. [Google Scholar] [CrossRef] [PubMed]
  21. Boon, N.; Top, E.M.; Verstraete, W.; Siciliano, S.D. Bioaugmentation as a tool to protect the structure and function of an activated-sludge microbial community against a 3-chloroaniline shock load. Appl. Environ. Microbiol. 2003, 69, 1511–1520. [Google Scholar] [CrossRef] [PubMed]
  22. Bustin, S.A.; Benes, V.; Nolan, T.; Pfaffl, M.W. Quantitative real-time RT-PCR—A perspective. J. Mol. Endocrinol. 2005, 34, 597–601. [Google Scholar] [CrossRef] [PubMed]
  23. Smith, C.J.; Osborn, A.M. Advantages and limitations of quantitative PCR (Q-PCR)-based approaches in microbial ecology. FEMS Microbiol. Ecol. 2009, 67, 6–20. [Google Scholar] [CrossRef] [PubMed]
  24. Zoetendal, E.G.; Akkermans, A.D.L.; de vos, W.M. Temperature gradient gel electrophoresis analysis of 16S rRNA from human fecal samples reveals stable and host-specific communities of active bacteria. Appl. Environ. Microbiol. 1998, 64, 3854–3859. [Google Scholar] [PubMed]
  25. Cappello, S.; Denaro, R.; Genovese, M.; Giuliano, L.; Yakimov, M.M. Predominant growth of Alcanivorax during experiments on “oil spill bioremediation” in mesocosms. Microbiol. Res. 2007, 162, 185–190. [Google Scholar] [CrossRef] [PubMed]
  26. Kadali, K.K.; Simons, K.L.; Sheppard, P.J.; Ball, A.S. Mineralisation of weathered crude oil by a hydrocarbonoclastic consortia in marine mesocosms. Water Air Soil Pollut. 2012, 223, 4283–4295. [Google Scholar] [CrossRef]
  27. Girvan, M.S.; Bullimore, J.; Pretty, J.N.; Osborn, A.M.; Ball, A.S. Soil type is the primary determinant of the composition of the total and active bacterial communities in Arable soils. Appl. Environ. Microbiol. 2003, 69, 1800–1809. [Google Scholar] [CrossRef] [PubMed]
  28. Marzorati, M.; Wittebolle, L.; Boon, N.; Daffonchio, D.; Verstraete, W. How to get more out of molecular fingerprints: Practical tools for microbial ecology. Environ. Microbiol. 2008, 10, 1571–1581. [Google Scholar] [CrossRef] [PubMed]
  29. Ovreas, L. Population and community level approaches for analysing microbial diversity in natural environments. Ecol. Lett. 2000, 3, 236–251. [Google Scholar] [CrossRef]
  30. Romantschuk, M.; Sarand, I.; Petanen, T.; Peltola, R.; Jonsson-Vihanne, M.; Koivula, T.; Yrjala, K.; Haahtela, K. Means to improve the effect of in situ bioremediation of contaminated soil: An overview of novel approaches. Environ. Pollut. 2000, 107, 179–185. [Google Scholar] [CrossRef]
  31. Martinez-Gomez, C.; Vethaak, A.D.; Hylland, K.; Burgeot, T.; Kohler, A.; Lyons, B.P.; Thain, J.; Gubbins, M.J.; Davies, I.M. A guide to toxicity assessment and monitoring effects at lower levels of biological organization following marine oil spill in European waters. ICES J. Mar. Sci. 2010, 67, 1–14. [Google Scholar] [CrossRef]
  32. Head, I.M.; Jones, D.M.; Roling, W.F.M. Marine microorganisms make a meal of oil. Nat. Rev. 2006, 4, 173–182. [Google Scholar] [CrossRef] [PubMed]
  33. Onwurah, I.N.E.; Ogugua, V.N.; Onyike, N.B.; Ochonogor, A.E.; Otitoju, O.F. Crude oil spill in environment, effects and some innovative clean-up biotechnologies. Int. J. Environ. Res. 2007, 1, 307–320. [Google Scholar]
  34. Rojo, F. Degradation of alkanes by bacteria. Environ. Microbiol. 2009, 11, 2477–2490. [Google Scholar] [CrossRef] [PubMed]
  35. Yuste, L.; Corbella, M.E.; Turiegano, M.J.; Karlson, U.; Puyet, A.; Rojo, F. Characterization of bacterial strains able to degrade to grow on high molecular mass residues from crude oil processing. FEMS Microbiol. Ecol. 2000, 32, 69–75. [Google Scholar] [CrossRef] [PubMed]
  36. Heuer, H.; Hartung, K.; Wieland, G.; Kramer, I.; Smalla, K. Polynucleotide probes that target a hypervariable region of 16S rRNA genes to identify bacterial isolates corresponding to bands of community fingerprints. Appl. Environ. Microbiol. 1999, 65, 1045–1049. [Google Scholar] [PubMed]

