Article

Mesoscale Morphological Change, Beach Rotation and Storm Climate Influences along a Macrotidal Embayed Beach

by
Tony Thomas
1,*,
Nelson Rangel-Buitrago
2,
Michael R. Phillips
1,
Giorgio Anfuso
3 and
Allan T. Williams
1,4
1
Coastal and Marine Research Group, University of Wales Trinity Saint David (Swansea), Mount Pleasant, Swansea, Wales SA1 6ED, UK
2
Facultad de Ciencias Básicas, Programa de Física, Grupo de Geología, Geofísica y Procesos Litorales, Km 7 Antigua vía Puerto Colombia, Barranquilla, Atlántico 080020, Colombia
3
Ciencias de la Tierra, Universidad de Cadiz, Puerto Real 11510, Spain
4
CICA NOVA, Nova Universidade de Lisboa, Lisboa 1069-050, Portugal
*
Author to whom correspondence should be addressed.
J. Mar. Sci. Eng. 2015, 3(3), 1006-1026; https://doi.org/10.3390/jmse3031006
Submission received: 29 June 2015 / Accepted: 25 August 2015 / Published: 2 September 2015
(This article belongs to the Special Issue Coastal Morphodynamics)

Abstract

:
Cross-shore profiles and environmental forcing were used to analyse morphological change of a headland bay beach: Tenby, West Wales (51.66 N; −4.71 W) over a mesoscale timeframe (1996–2013). Beach profile variations were attuned with longer term shoreline change identified by previous research showing southern erosion and northern accretion within the subaerial zone and were statistically significant in both sectors although centrally there was little or no significance. Conversely a statistically significant volume loss was shown at all profile locations within the intertidal zone. There were negative phase relationships between volume changes at the beach extremities, indicative of beach rotation and results were statistically significant (p < 0.01) within both subaerial (R2 = 0.59) and intertidal (R2 = 0.70) zones. This was confirmed qualitatively by time-series analysis and further cross correlation analysis showed trend reversal time-lagged associations between sediment exchanges at either end of the beach. Wave height and storm events displayed summer/winter trends which explained longer term one directional rotation at this location. In line with previous regional research, environmental forcing suggests that imposed changes are influenced by variations in southwesterly wind regimes. Winter storms are generated by Atlantic southwesterly winds and cause a south toward north sediment exchange, while southeasterly conditions that cause a trend reversal are generally limited to the summer period when waves are less energetic. Natural and man-made embayed beaches are a common coastal feature and many experience shoreline changes, jeopardising protective and recreational beach functions. In order to facilitate effective and sustainable coastal zone management strategies, an understanding of the morphological variability of these systems is needed. Therefore, this macrotidal research dealing with rotational processes across the entire intertidal has significance for other macrotidal coastlines, especially with predicted climate change and sea level rise scenarios, to inform local, regional and national shoreline risk management strategies.

1. Introduction

Beaches situated in the lee of rocky outcrops or headlands, generally take some form of curvature known as curved, embayed, hooked, pocket and headland-bay beaches [1] and 51% of the world’s coastlines are representative of this morphology [2]. Along these coasts, nearshore wave energy is often high as waves are related to bathymetry and refraction/diffraction patterns [3]. Wave energy is focused on the headlands and dispersed into the bays, so headlands erode while the intervening bays fill up [4]. Shorelines on sand beaches are known to vary over a range of timescales [5], in response to both erosion and rotation events [6]. Severe shoreline movement can trigger the need for coastal mitigation measures especially if private or public dwellings are put at risk [7]. Therefore, understanding beach morphological variability is essential to support coastal risk assessment and help in the decision making process, especially in what concerns the implementation of mitigation measures in response to erosive events reported worldwide [8]. Shoreline rotation phenomenon can be defined as a landward or seaward movement at one end of a beach accompanied by the reverse pattern at the other end [7] and is known to be caused by variations in wave climate such as wave approach direction and energy flux [7,9,10,11,12,13].
Many researchers, have documented seasonal or short-term rotations [9,11,13], others have studied rotation at decadal scales [10,14,15,16]. Thomas et al. [12] provided a historic (Centurial) record of beach rotation, influenced by long term shifts in wind directional patterns that caused shoreline displacement resulting in up-drift erosion, down-drift accretion and subaqueous loss. Morphological responses of embayed beaches to storm and gale forcing have also been studied in the Northern [17,18,19] and Southern Hemispheres by amongst others [10,14]. The underlying causes of wave directional change have also been linked to subtidal mud bank and sandbank migration [20,21,22]. Unlike the macrotidal beach work carried out in this research, most rotation studies utilize variations in the location or volume of the subaerial zone to identify shoreline response; this was because almost all were studied in locations with microtidal or mesotidal ranges see for example [10,20,23,24,25,26,27]. The limited macrotidal research by Stone and Orford [28], Dehouk et al. [23], Maspataud et al. [29] and Thomas et al. [12,13] work within the present area of study also concentrated on subaerial regions. They all highlighted beach rotation despite limited wave exposure.
This paper builds upon Thomas et al. [16] work by analyzing both subaerial and intertidal zones of a macrotidal beach using mesoscale profile responses, manifested by differential longshore sediment translation expressed through rotation and realignment, when compared and contrasted with environmental forcing to analyse cause and effect. Evaluation of results identified changes in coastal processes and led to development of temporal and spatial regression models representing functions of intertidal rotation. While similar responses have been obtained worldwide within the subaerial zone these intertidal relationships have important consequences for embayed beach management strategies.
Figure 1. Locality of the study area: (a) United Kingdom; (b) Bristol Channel; (c) Carmarthen Bay.
Jmse 03 01006 g001

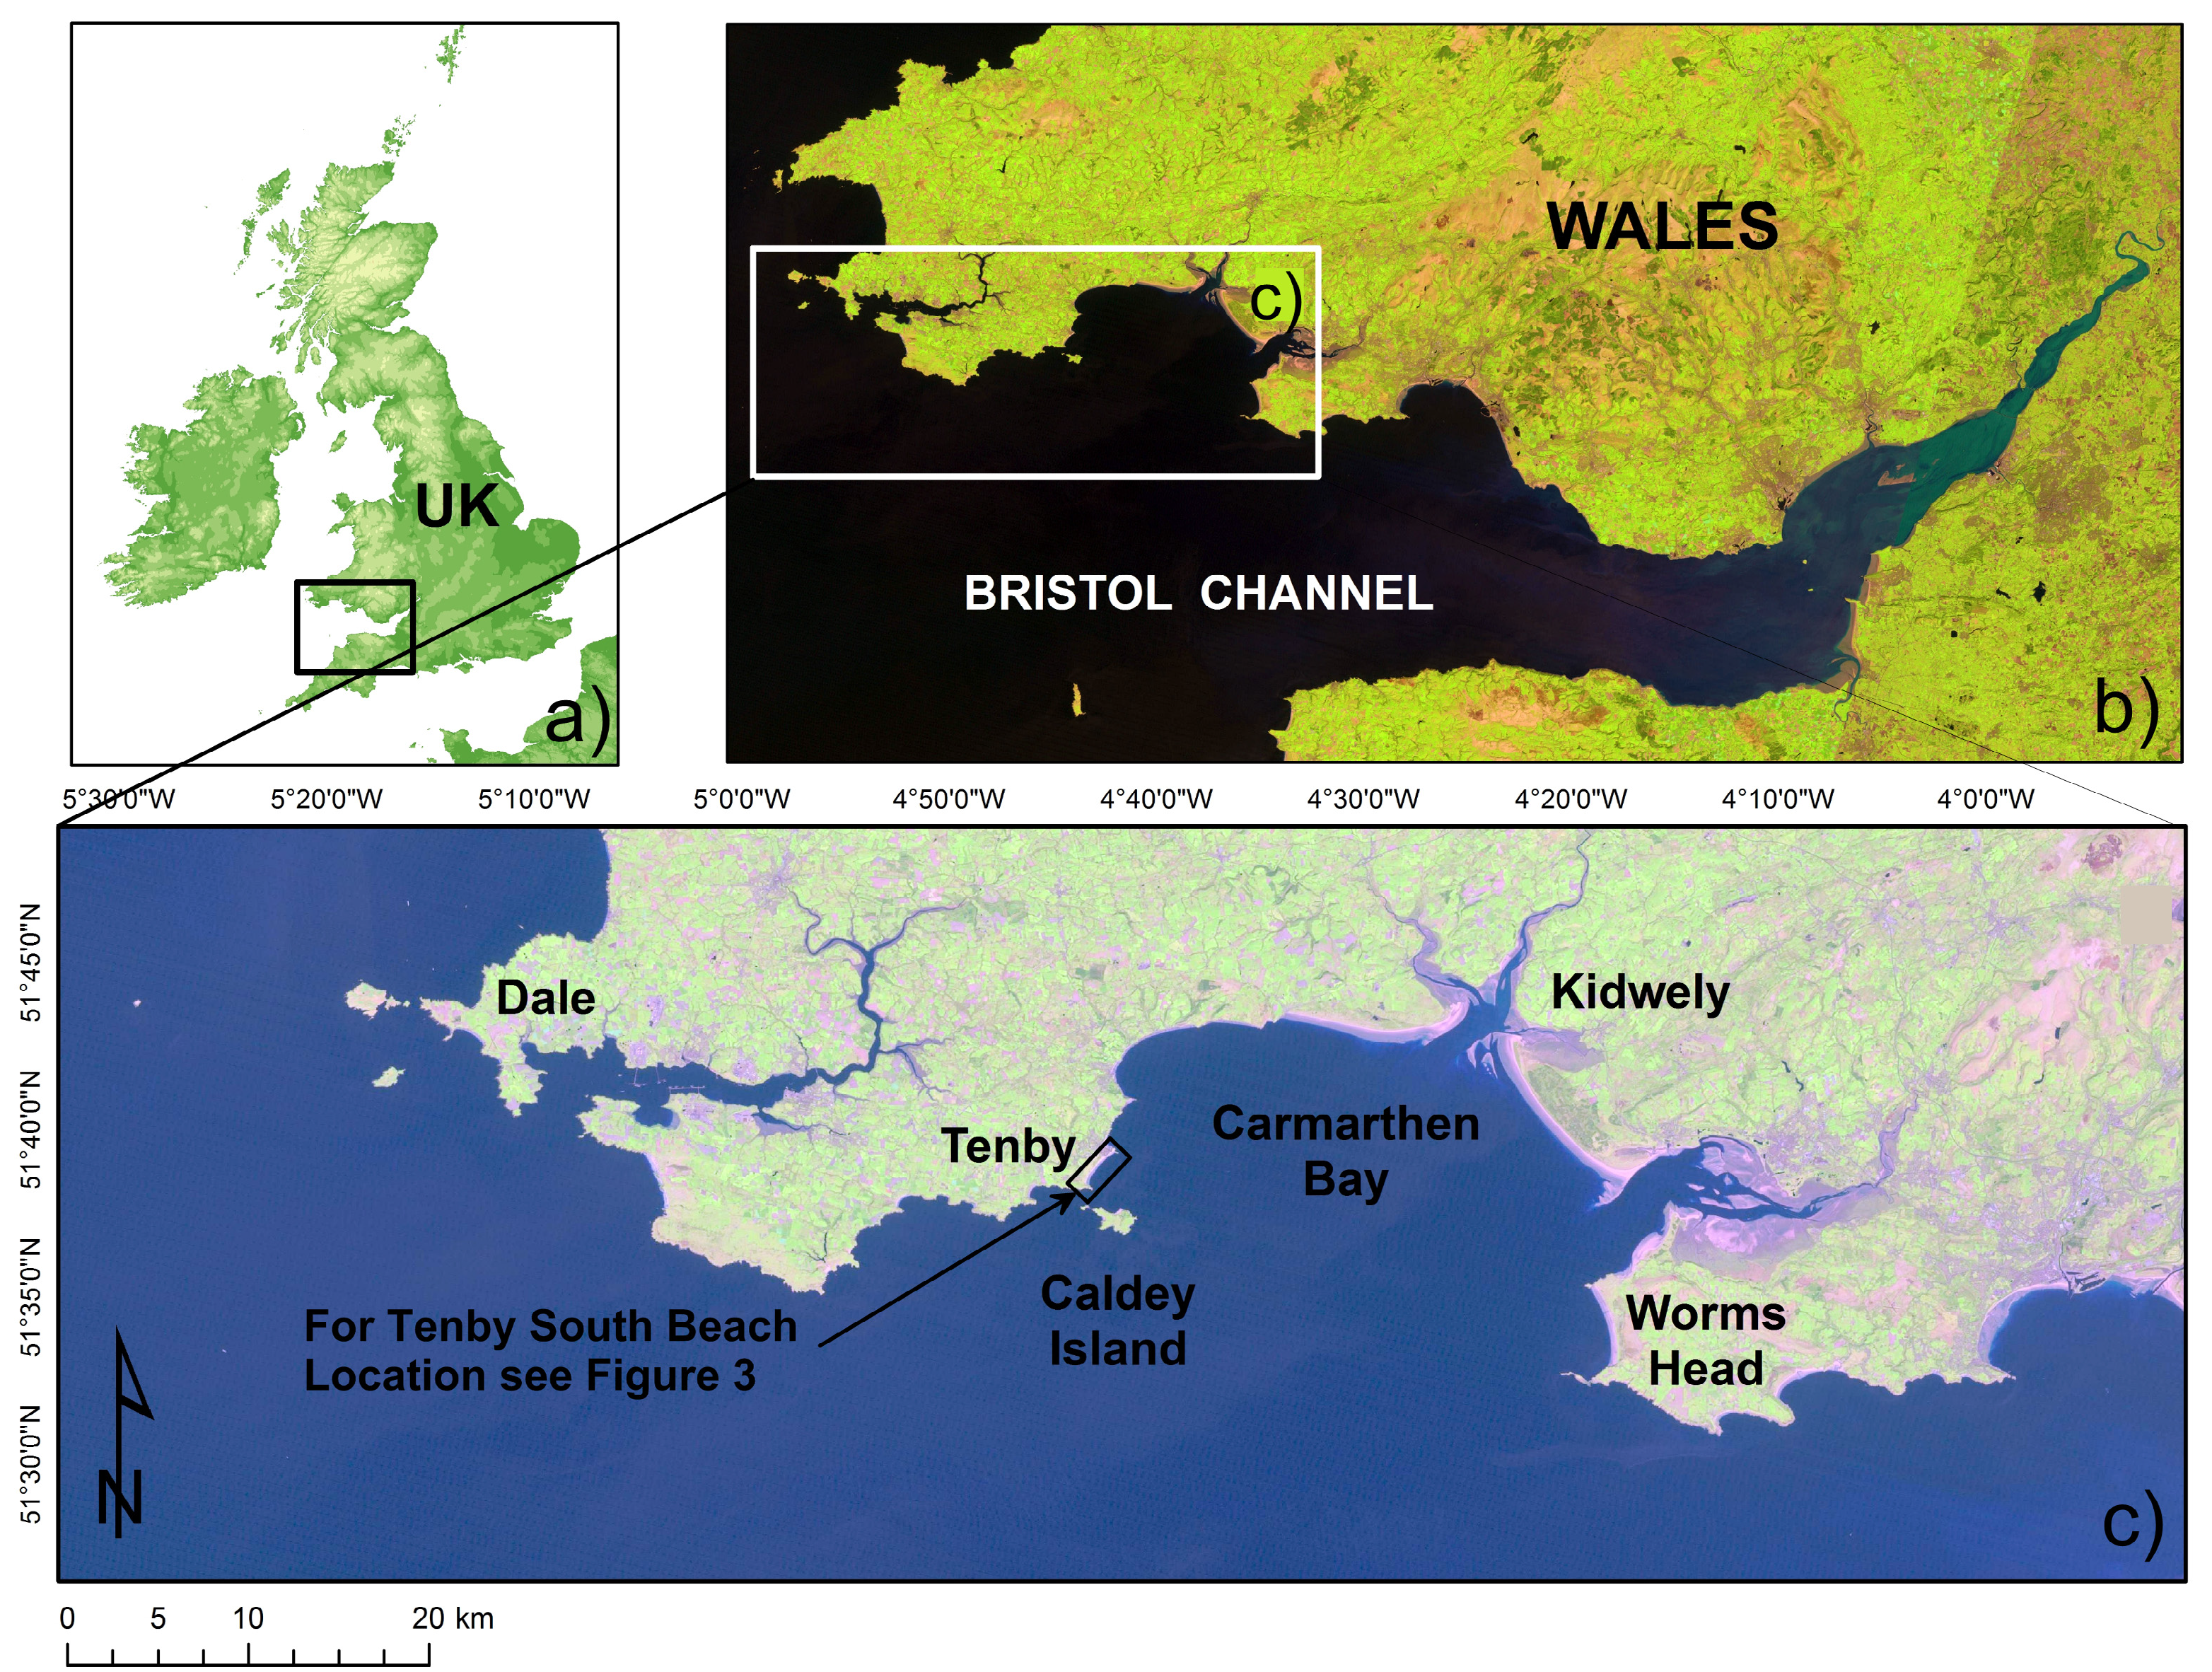
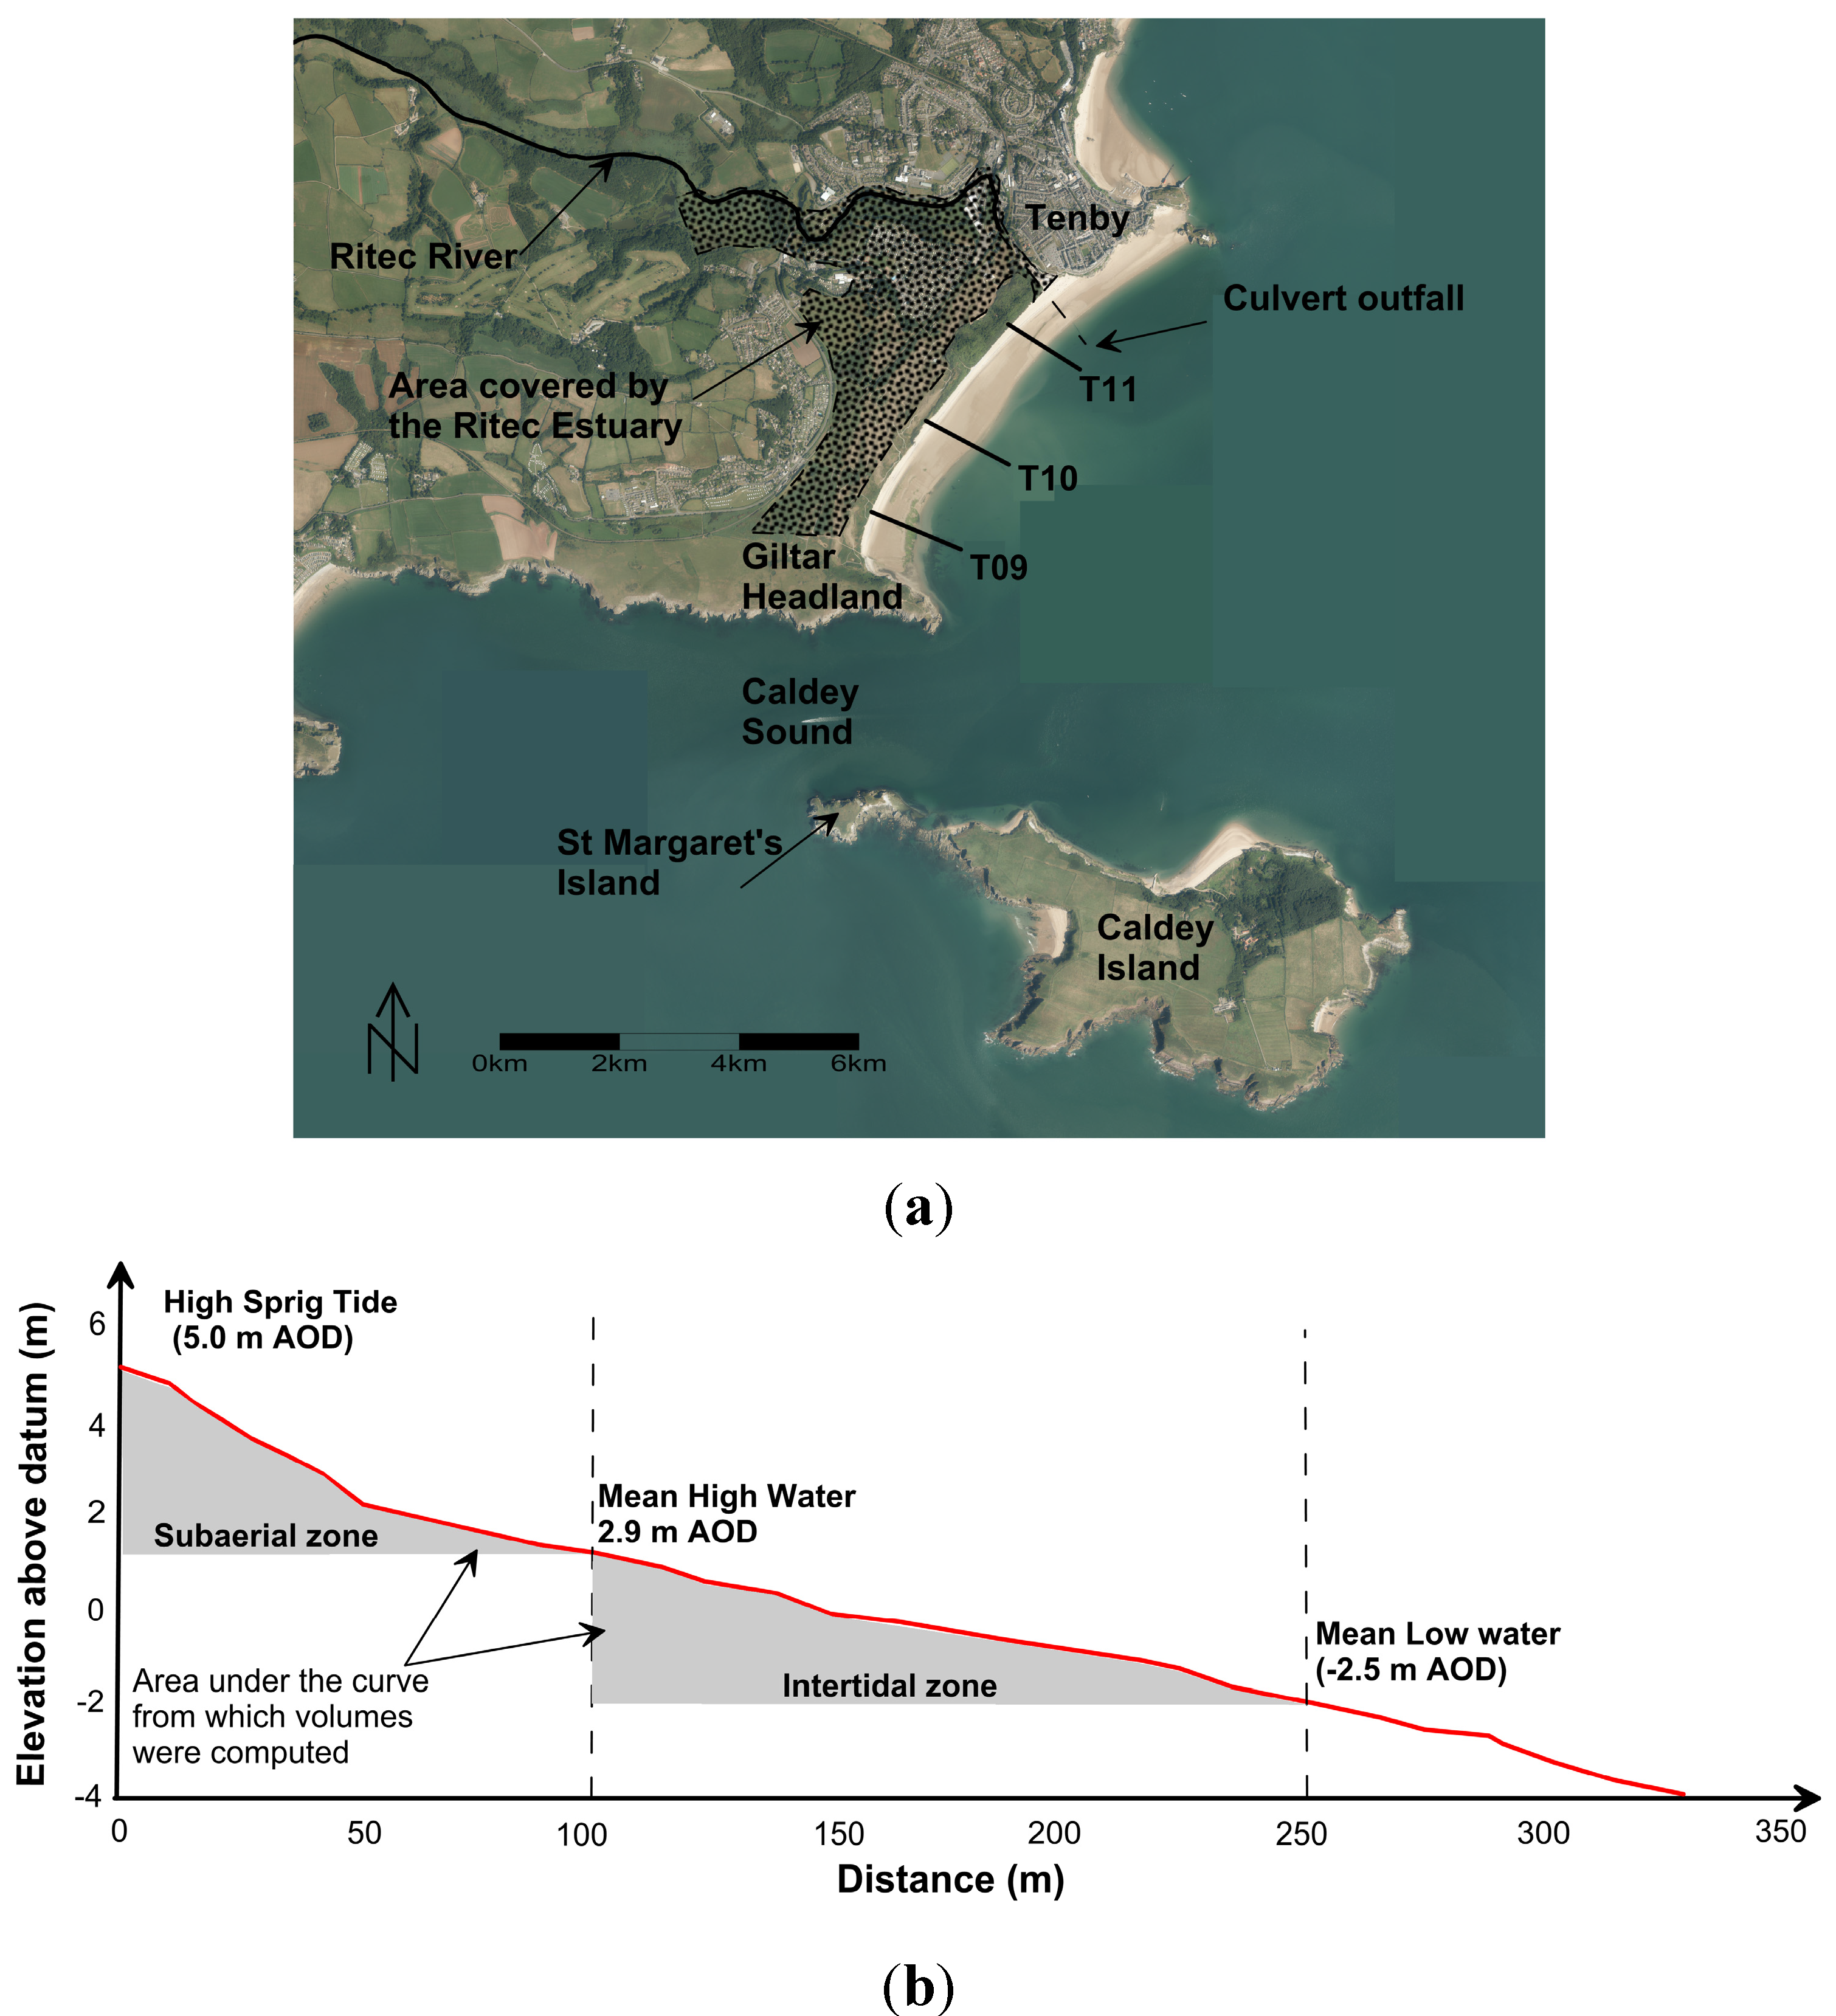
2. Physical Background

The outer Bristol Channel on the west coast of Great Britain constitutes a large body of partially enclosed tidal water [30], with a tidal range of up to 12 m [31] (Figure 1a,b). Carmarthen Bay located on the Channel’s northwestern margin is a relatively large embayment (Figure 1c), formed as a consequence of differential erosion and is mainly characterised by rocky cliffs and small embayments that contain pocket beaches [16,32,33,34,35]. The study area (Figure 2a) is a sub compartment of Carmarthen Bay delineated at its northern/southern ends by two Carboniferous limestone headlands—Tenby and Giltar respectively [36,37]. These two places epitomise a well-developed “honeypot” geared for tourism (Tenby) versus an important uninhabited conservation area (Giltar). The system comprises dunes (920 × 103 m2), a shingle backshore and a wide sand intertidal zone. Sediment loss in the latter is circa 7000 m3·year−1 [38,39] and the dune system follows the classic sequence of erosion in storms/high spring tides, although a dense Ammophila arenaria vegetation cover help retard erosion; the system being replenished when a more constructive wave regime occurs. Mean semi-diurnal tidal range is 7.5 m and predominant waves arrive from the south to west directions, with average height/periods respectively of 1.2 m and 5.2 s, which in high energy conditions can reach 5.5 m and 8.2 s [12]. Wave diffraction occurs due to Caldey and St Margaret’s islands (Figure 2a) influencing a strong south to north longshore drift.
Figure 2. (a) Study area location plan including the topographical location of the representative cross shore profiles (T09–T11) from which beach level and volume change were calculated; and (b) a definition sketch showing the morphological zones from which comparative beach volumes were computed.
Jmse 03 01006 g002

3. Methods

3.1. Beach Profile Monitoring (1996–2013)

Medium term changes, calculated using three profiles spaced at 580 m (Figure 2a), were representative of South (T09), Central (T10) and North (T11) beach sectors. Surveys were carried out during spring (April/May) and when available autumn (October/November), extending from the dune system control point, to low water (approximately 250 m). Profile locations enabled analysis of beach rotation by detailing the relationship between beach extremities.
The profiles were truncated to the high spring tidal level; sectional volumes, i.e., the morphological variables, were then determined directly from the Regional Morphology Analysis Package (RMAP), where volume is calculated by extrapolating the area under the curve for one unit length (m3·m−1) of shoreline [40] (Figure 2b). Two areas were identified for detailed analysis, the sub-aerial (high spring tide mark to the mean high water mark) and the intertidal (high spring tide mark to the mean low water mark) shore zones. Profile data were collected using a total station with an accuracy of ±5 mm + 3 ppm vertically. Profile origins provided control points, referenced directly to the British OS Grid Reference system. Beach profiles were generally surveyed during spring (April) and autumn (October), winter surveys from 1997 to 1999 were not available, and therefore, 22 surveys representing 17 years of data (1996–2013), were presented for analysis. Beach volume change within each morphological zone was used to characterize beach rotation, a methodology utilized by Klein et al. [9] who used sub-aerial beach volume change to similarly characterize rotation processes and Thomas et al. [16] who used both subaerial and intertidal volumes to assess rotation albeit with a much smaller dataset (1999–2007).
Clearly, observed changes in beach morphology cannot solely be related to wave direction and longshore drift [41]. Cross shore processes also induce profile readjustments that are non-rotational responses [42]. Therefore, rotational (related to longshore drift) and non-rotational (related to cut and fill or cross-shore transfer) have to be decoupled or smoothed out of the data for study of rotation phenomenon. To achieve this and assess medium timescale rotation, it was necessary to remove high frequency cut and fill (cross-shore) noise from the volume dataset. A method similar to that developed by Short and Trembanis [14] was implemented. The volume record was transformed into the standard normal form [43], using z = x − x/σ, where, z = normalised value, x = data volume record for each profile, x = average value for that profile, σ = standard deviation. Temporal mean survey volumes were averaged along the beach (representing the cut and fill behaviour). Spatial average values (b) were subtracted from the local normalised volume (a) to reveal a time-series where high frequency behaviour has been removed. Residual volumes were converted into dimensional units using x = (z × σ) + x.

3.2. Wind, Wave and Storm Characterization Data
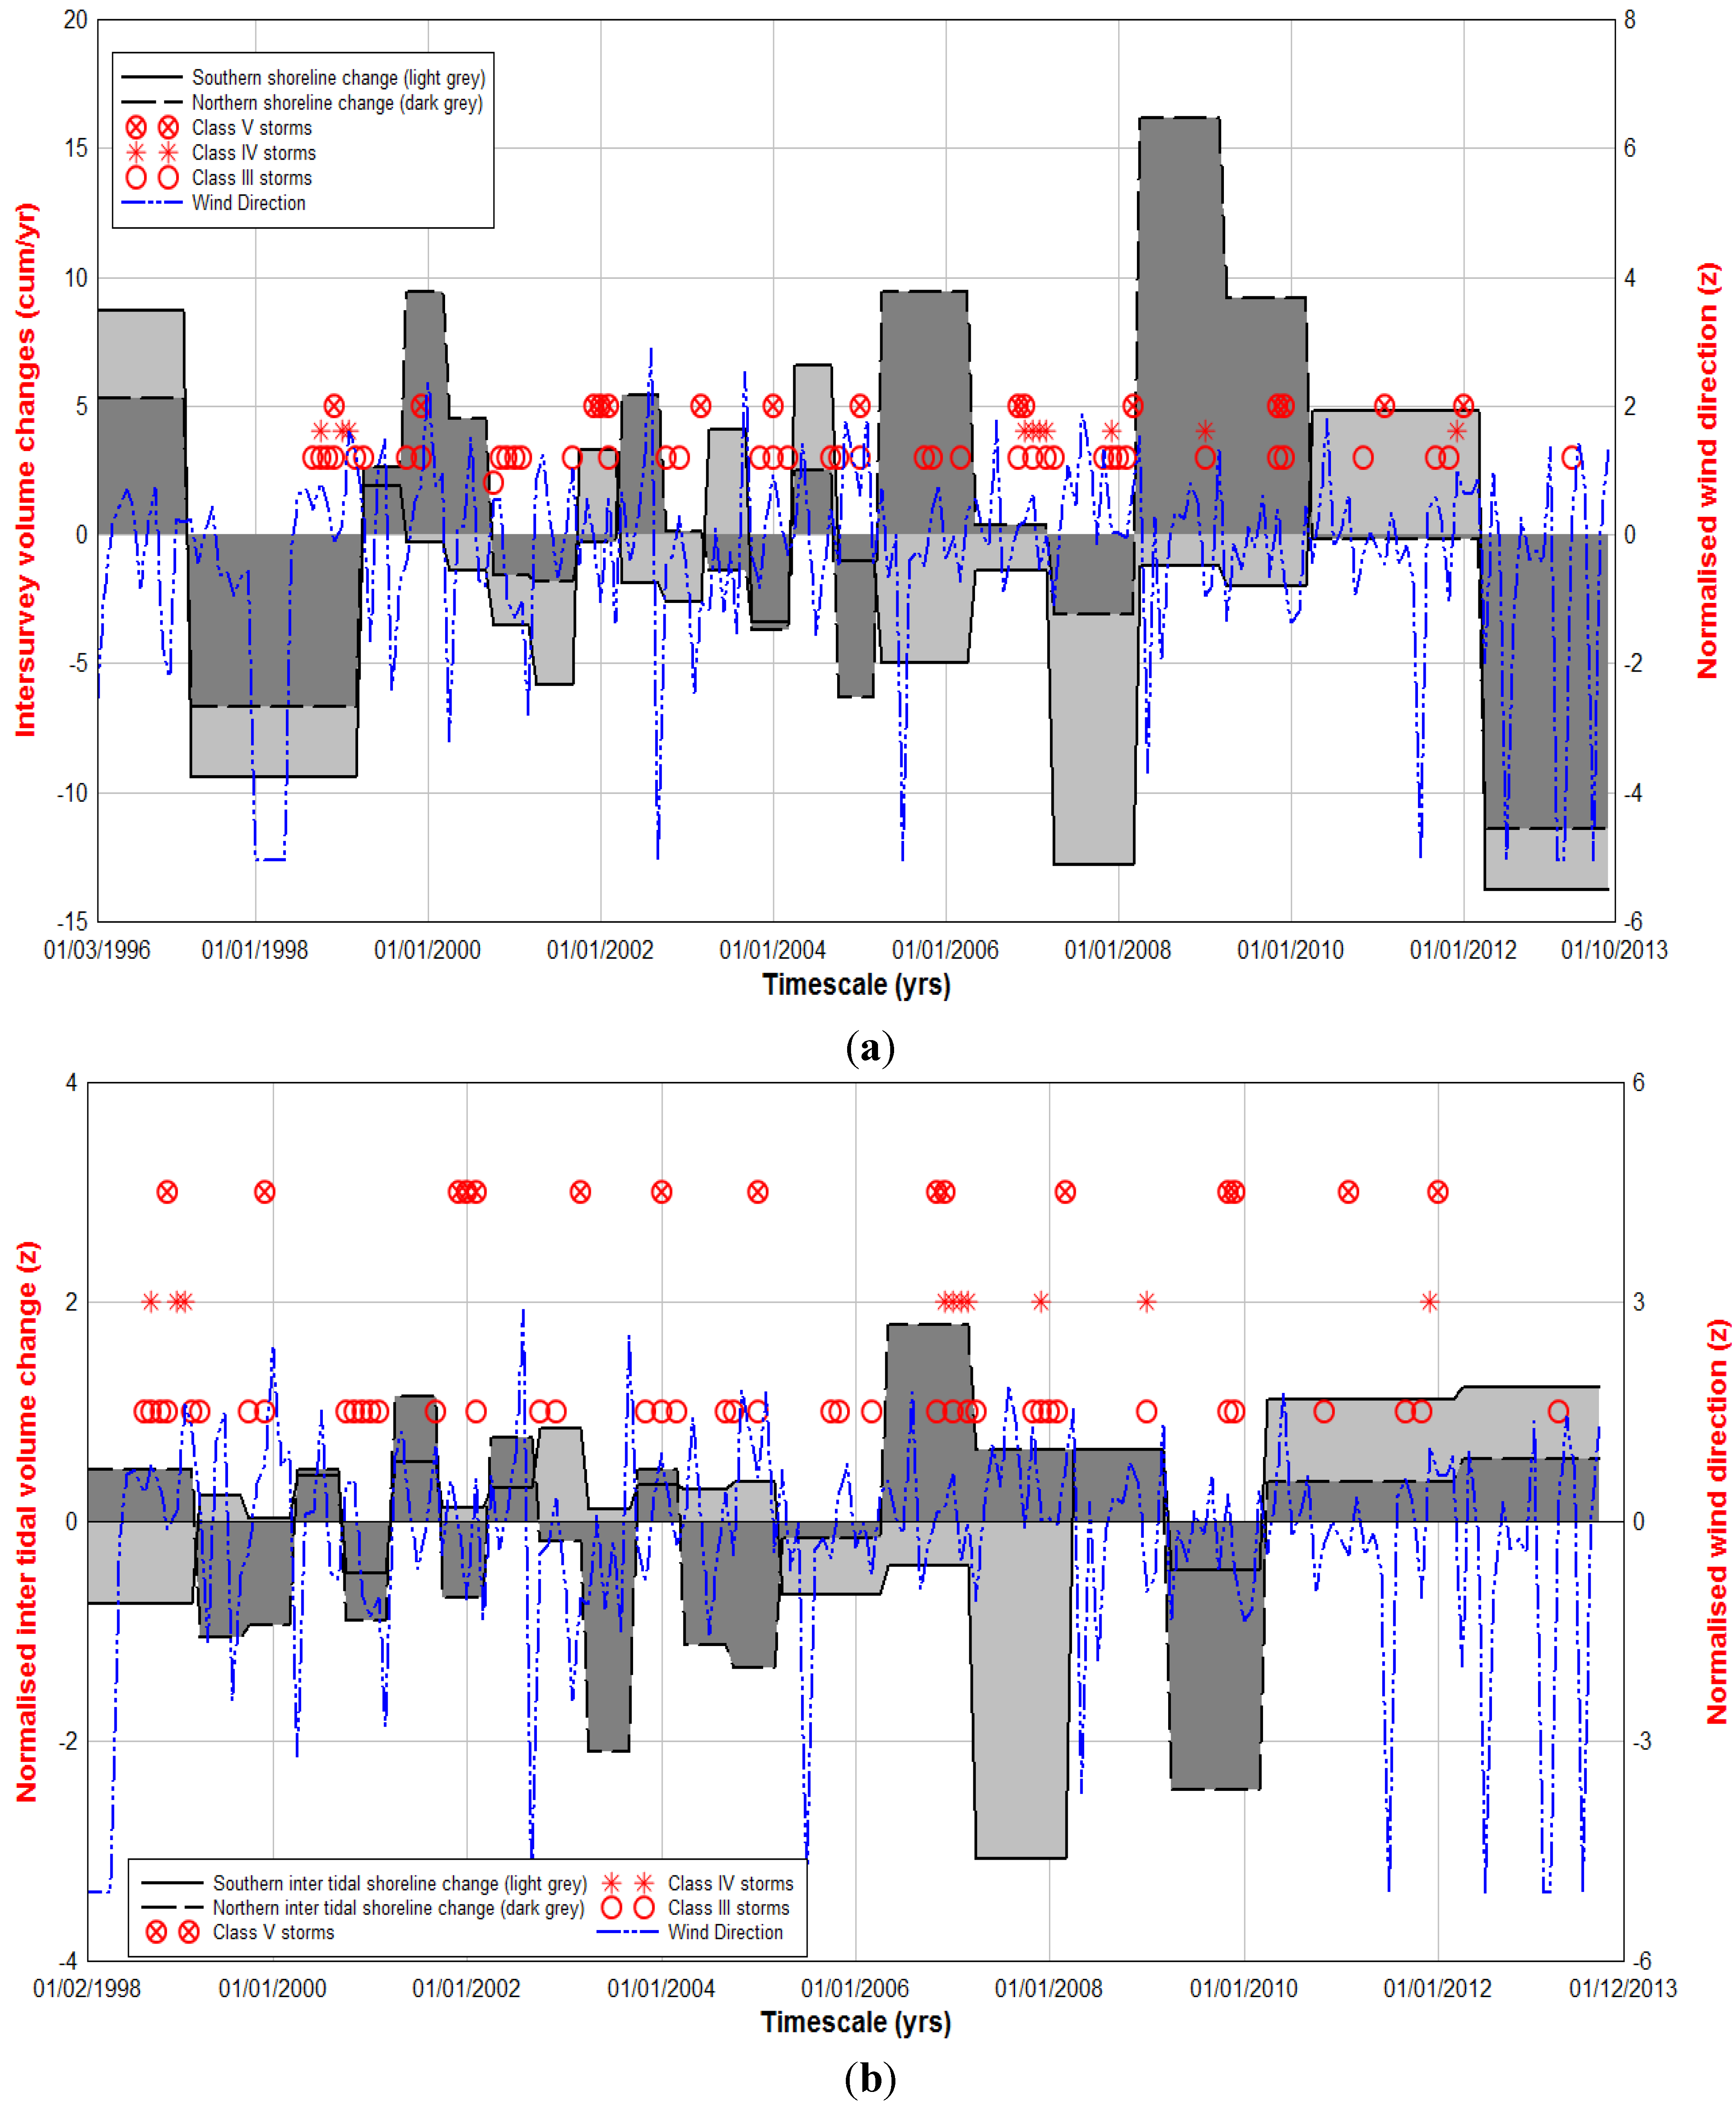
In this research direct comparisons were made between subaerial and intertidal volume change and environmental forcing agents (wind and wave climate) captured by the Turbot Bank wave rider buoy (51.603 N 5.100 W). The buoy owned and maintained by the UK Met Office records wave height, period and direction at 1 h intervals. The 17 year dataset supplied by the Met Office contained 121,452 independent values. In this work, a storm is defined as a climatic event during which the significant wave height (Hs) exceeds a threshold over a minimum during a specific time. Dolan and Davis [44] Storm Power Index was used to classify coastal storms. This index was calculated according to: Hs2 td where, Hs = significant wave height and td = storm duration in hours. A storm wave height represented rare events in Tenby area with only 8% of total amount in the 17 years using the methodology proposed by Dorsch et al. [42]. This value reflects the wave height at which erosion starts to affect nearby areas, according to previous regional research findings [13,45]. The minimum storm duration was set at 12 h, in this way the storm affected the coast at least during a complete tidal cycle and the lapse time between successive storms was set at one day in order to create de-clustered, independent sets of storms [42,46,47]. Once storms were recognised, they were categorised by means of the natural breaks function analysis [48], into five classes from Class I (weak) to Class V (extreme) events.

4. Results

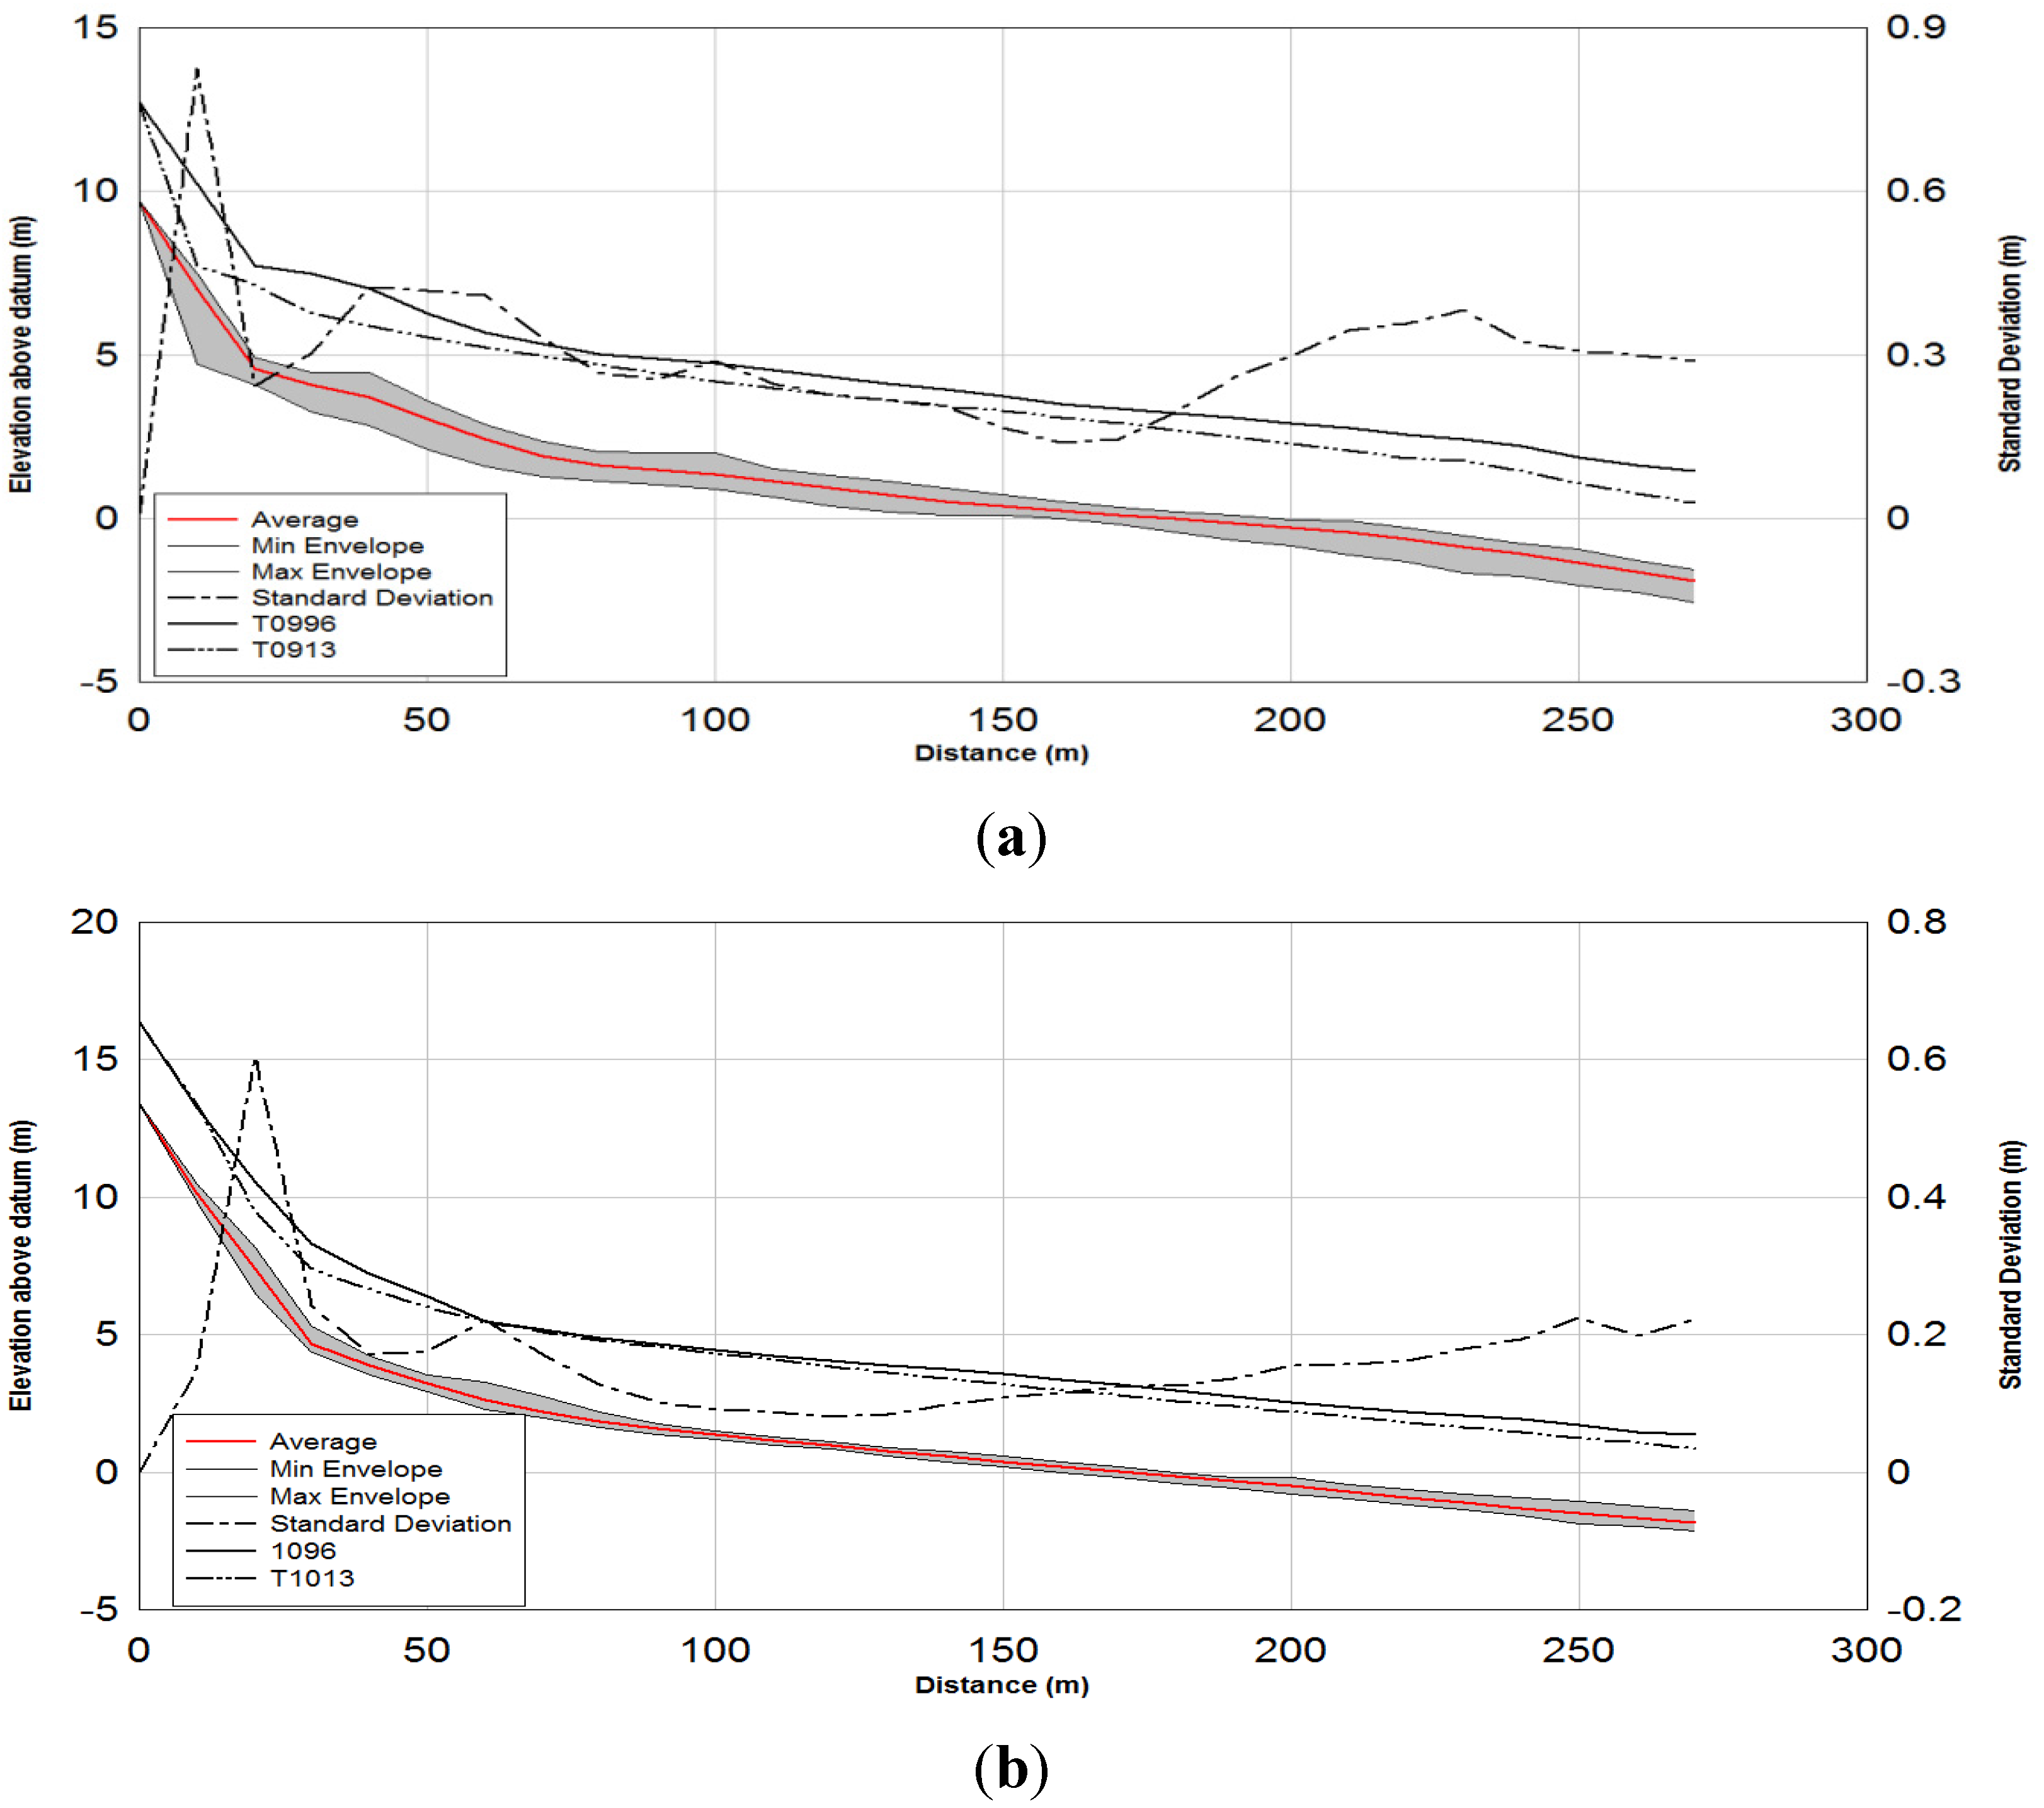
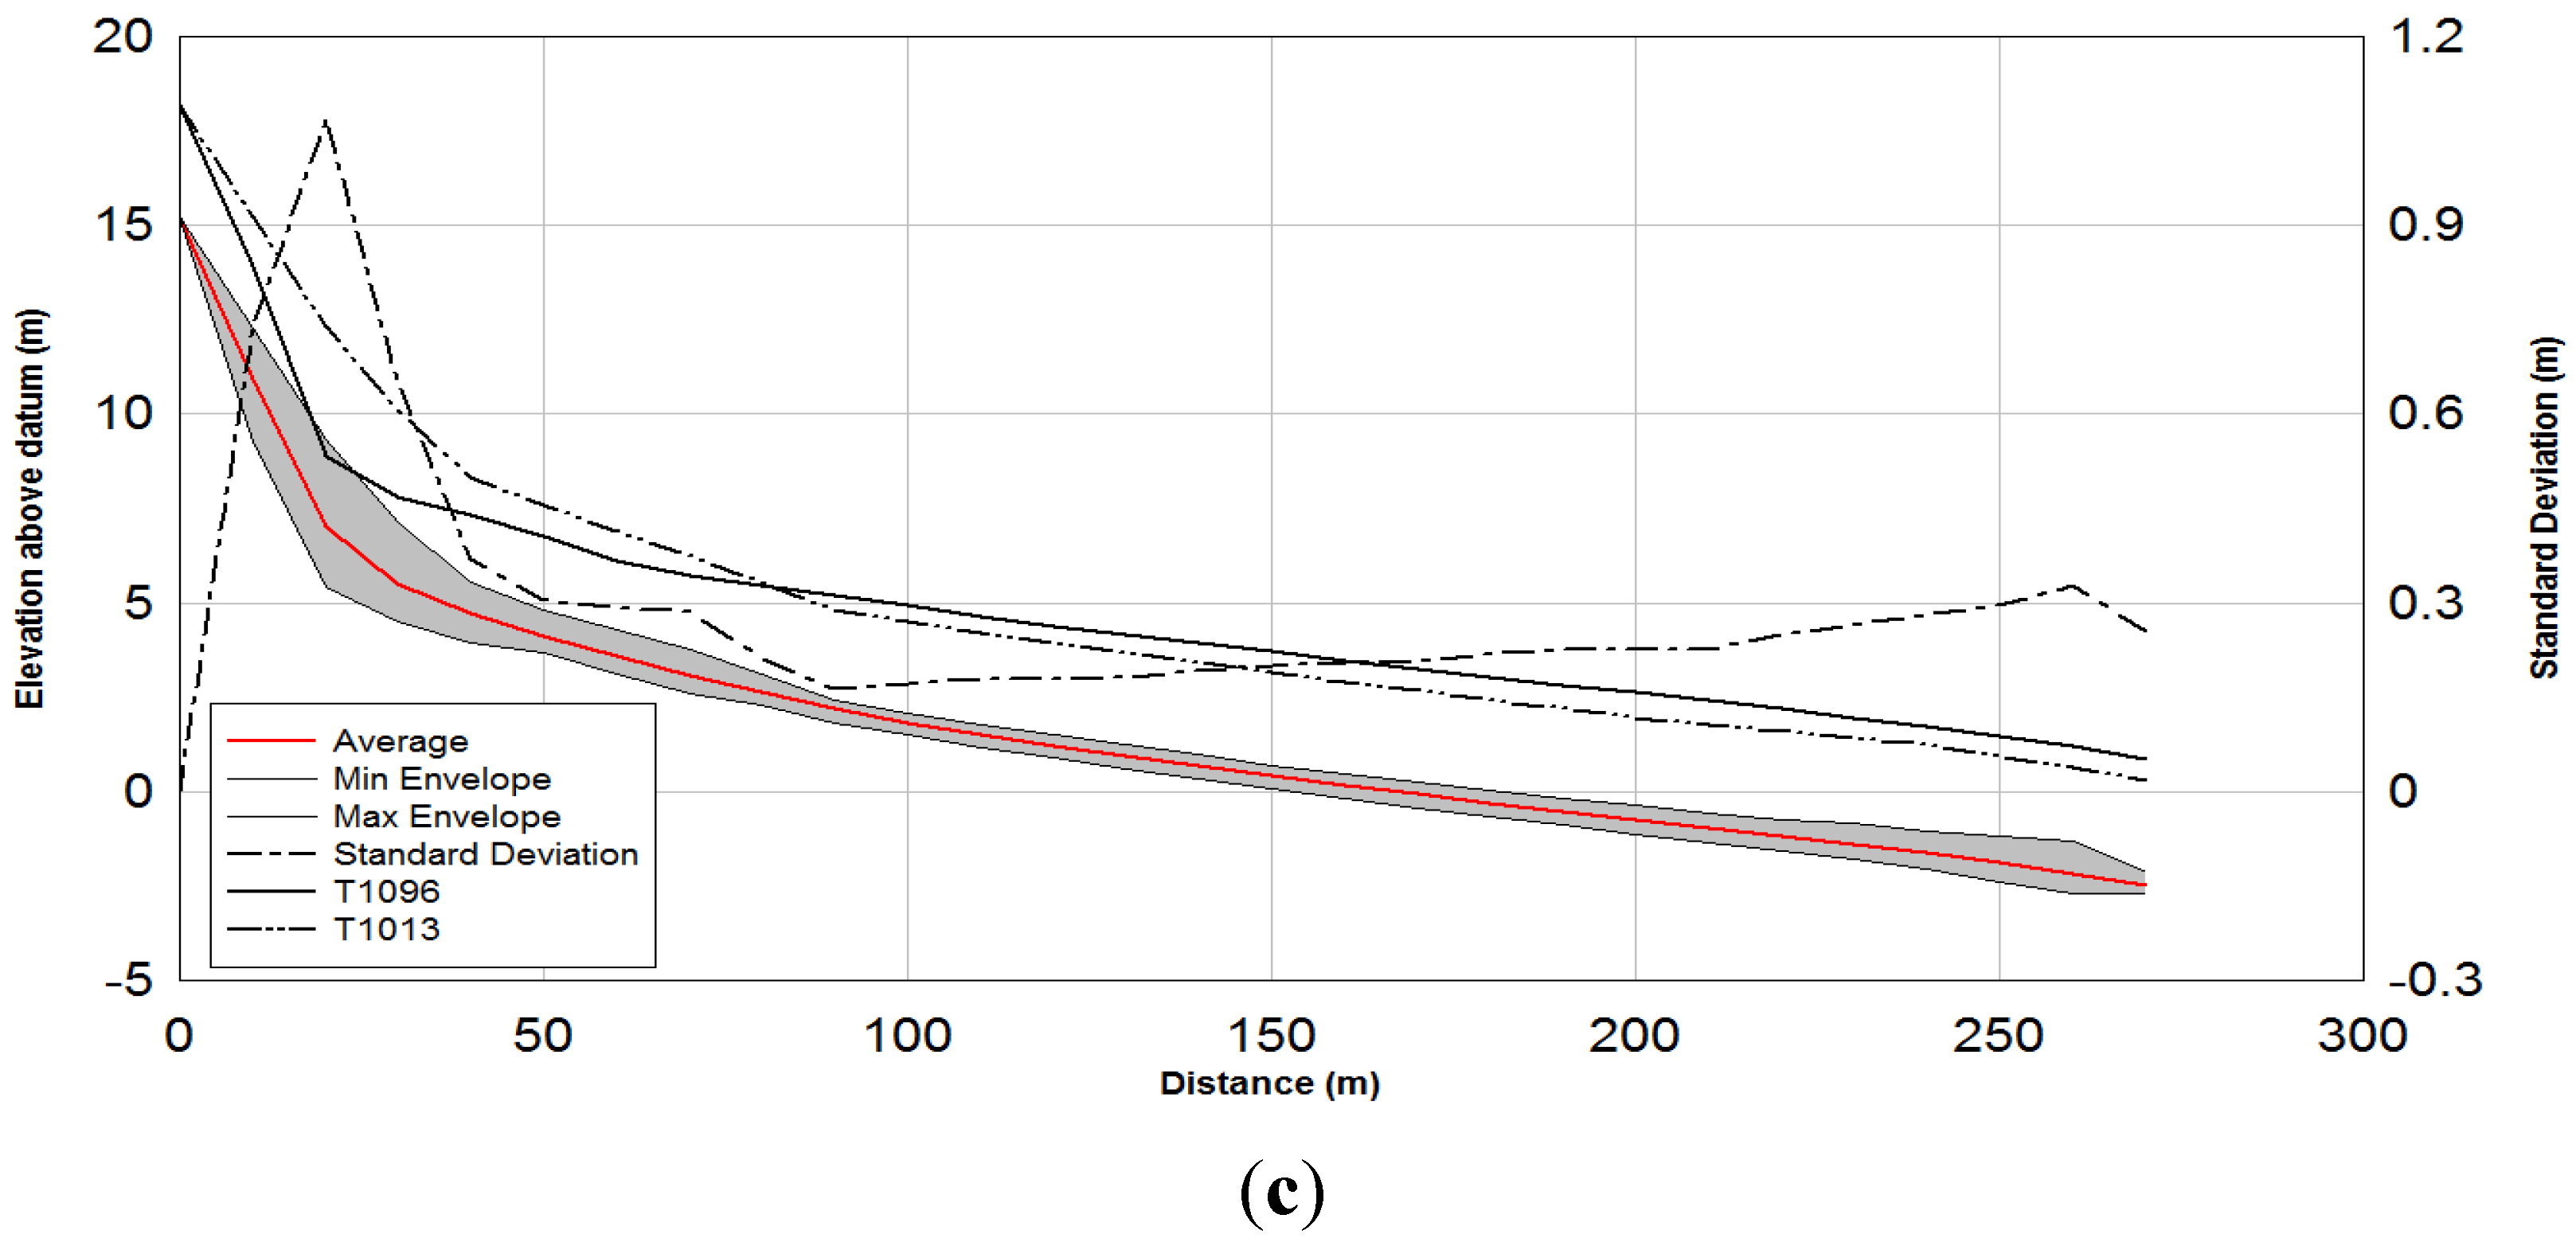
4.1. Beach Level Change (1996–2013)

Figure 3 shows individual cross-shore profile envelopes between 1996 and 2013; all three profiles are concave and indicative of two beach states: A dissipative/intermediate mid to low tidal zone and intermediate/reflective high tidal zone [2]. The greatest variance beach level occurs within the high tidal zone where the standard deviation (σ) is at its maximum value for all three profiles (σ = 0.826 m, 0.605 m and 1.071 m three respectively). The standard deviation is at its minimum value within the mid tidal zone of all profiles (σ = 0.139 m, 0.080 m and 0.163 m respectively). When first and last cross shore profiles are compared, T09 (south) highlights falling beach levels across the entire profile during the 17 year period of assessment (Figure 3a), T10 (central; Figure 3b) highlights erosion in both subaerial and lower intertidal zones and stability in the upper intertidal zone. Whereas, T11 (North; Figure 3c) showed accretion in the sub aerial and upper intertidal zone, contrasted against erosion in the lower intertidal zone, with the point of oscillation near the MSL contour.
Figure 3. Cross shore profile envelopes, and standard deviations for the period 1996–2013, along with the first (1996) and last (2013) cross shore profiles offset by 3 m for clarity: (a) Transect 09; (b) Transect 10; and (c) Transect 11.
Jmse 03 01006 g003aJmse 03 01006 g003b
In order to quantitatively compare differences in beach level between the first (1996) and last (2013) surveys paired t tests were performed and the results presented in Table 1. The calculated t statistic (tcalc) when compared to tabulated t-values (ttab) according to the degrees of freedom (df). Results showed tcalc > ttab indicating that there was a significant difference in beach level at profile locations T09 (south) and T10 (central) at 99% confidence and negative signs for tcalc indicated that beach levels had fallen between 1996 and 2013. Conversely, tcalc < ttab at profile location T11 suggested that there was no significant difference in beach level and the small positive tcalc value indicative of a slight increase in levels.
Table 1. Results of paired t tests—Surveys 1 and 22.
ProfileMeanStd. DeviationStd. Error Mean95% Confidence ttab
LowerUppertcalcdfSig0.050.01
T090.6770.4370.0830.507580.84640−8.199270.0002.0522.771
T100.3380.2580.0490.237790.43771−6.933270.0002.0522.771
T110.0001.0000.189−0.387660.387890.001271.0002.0522.771

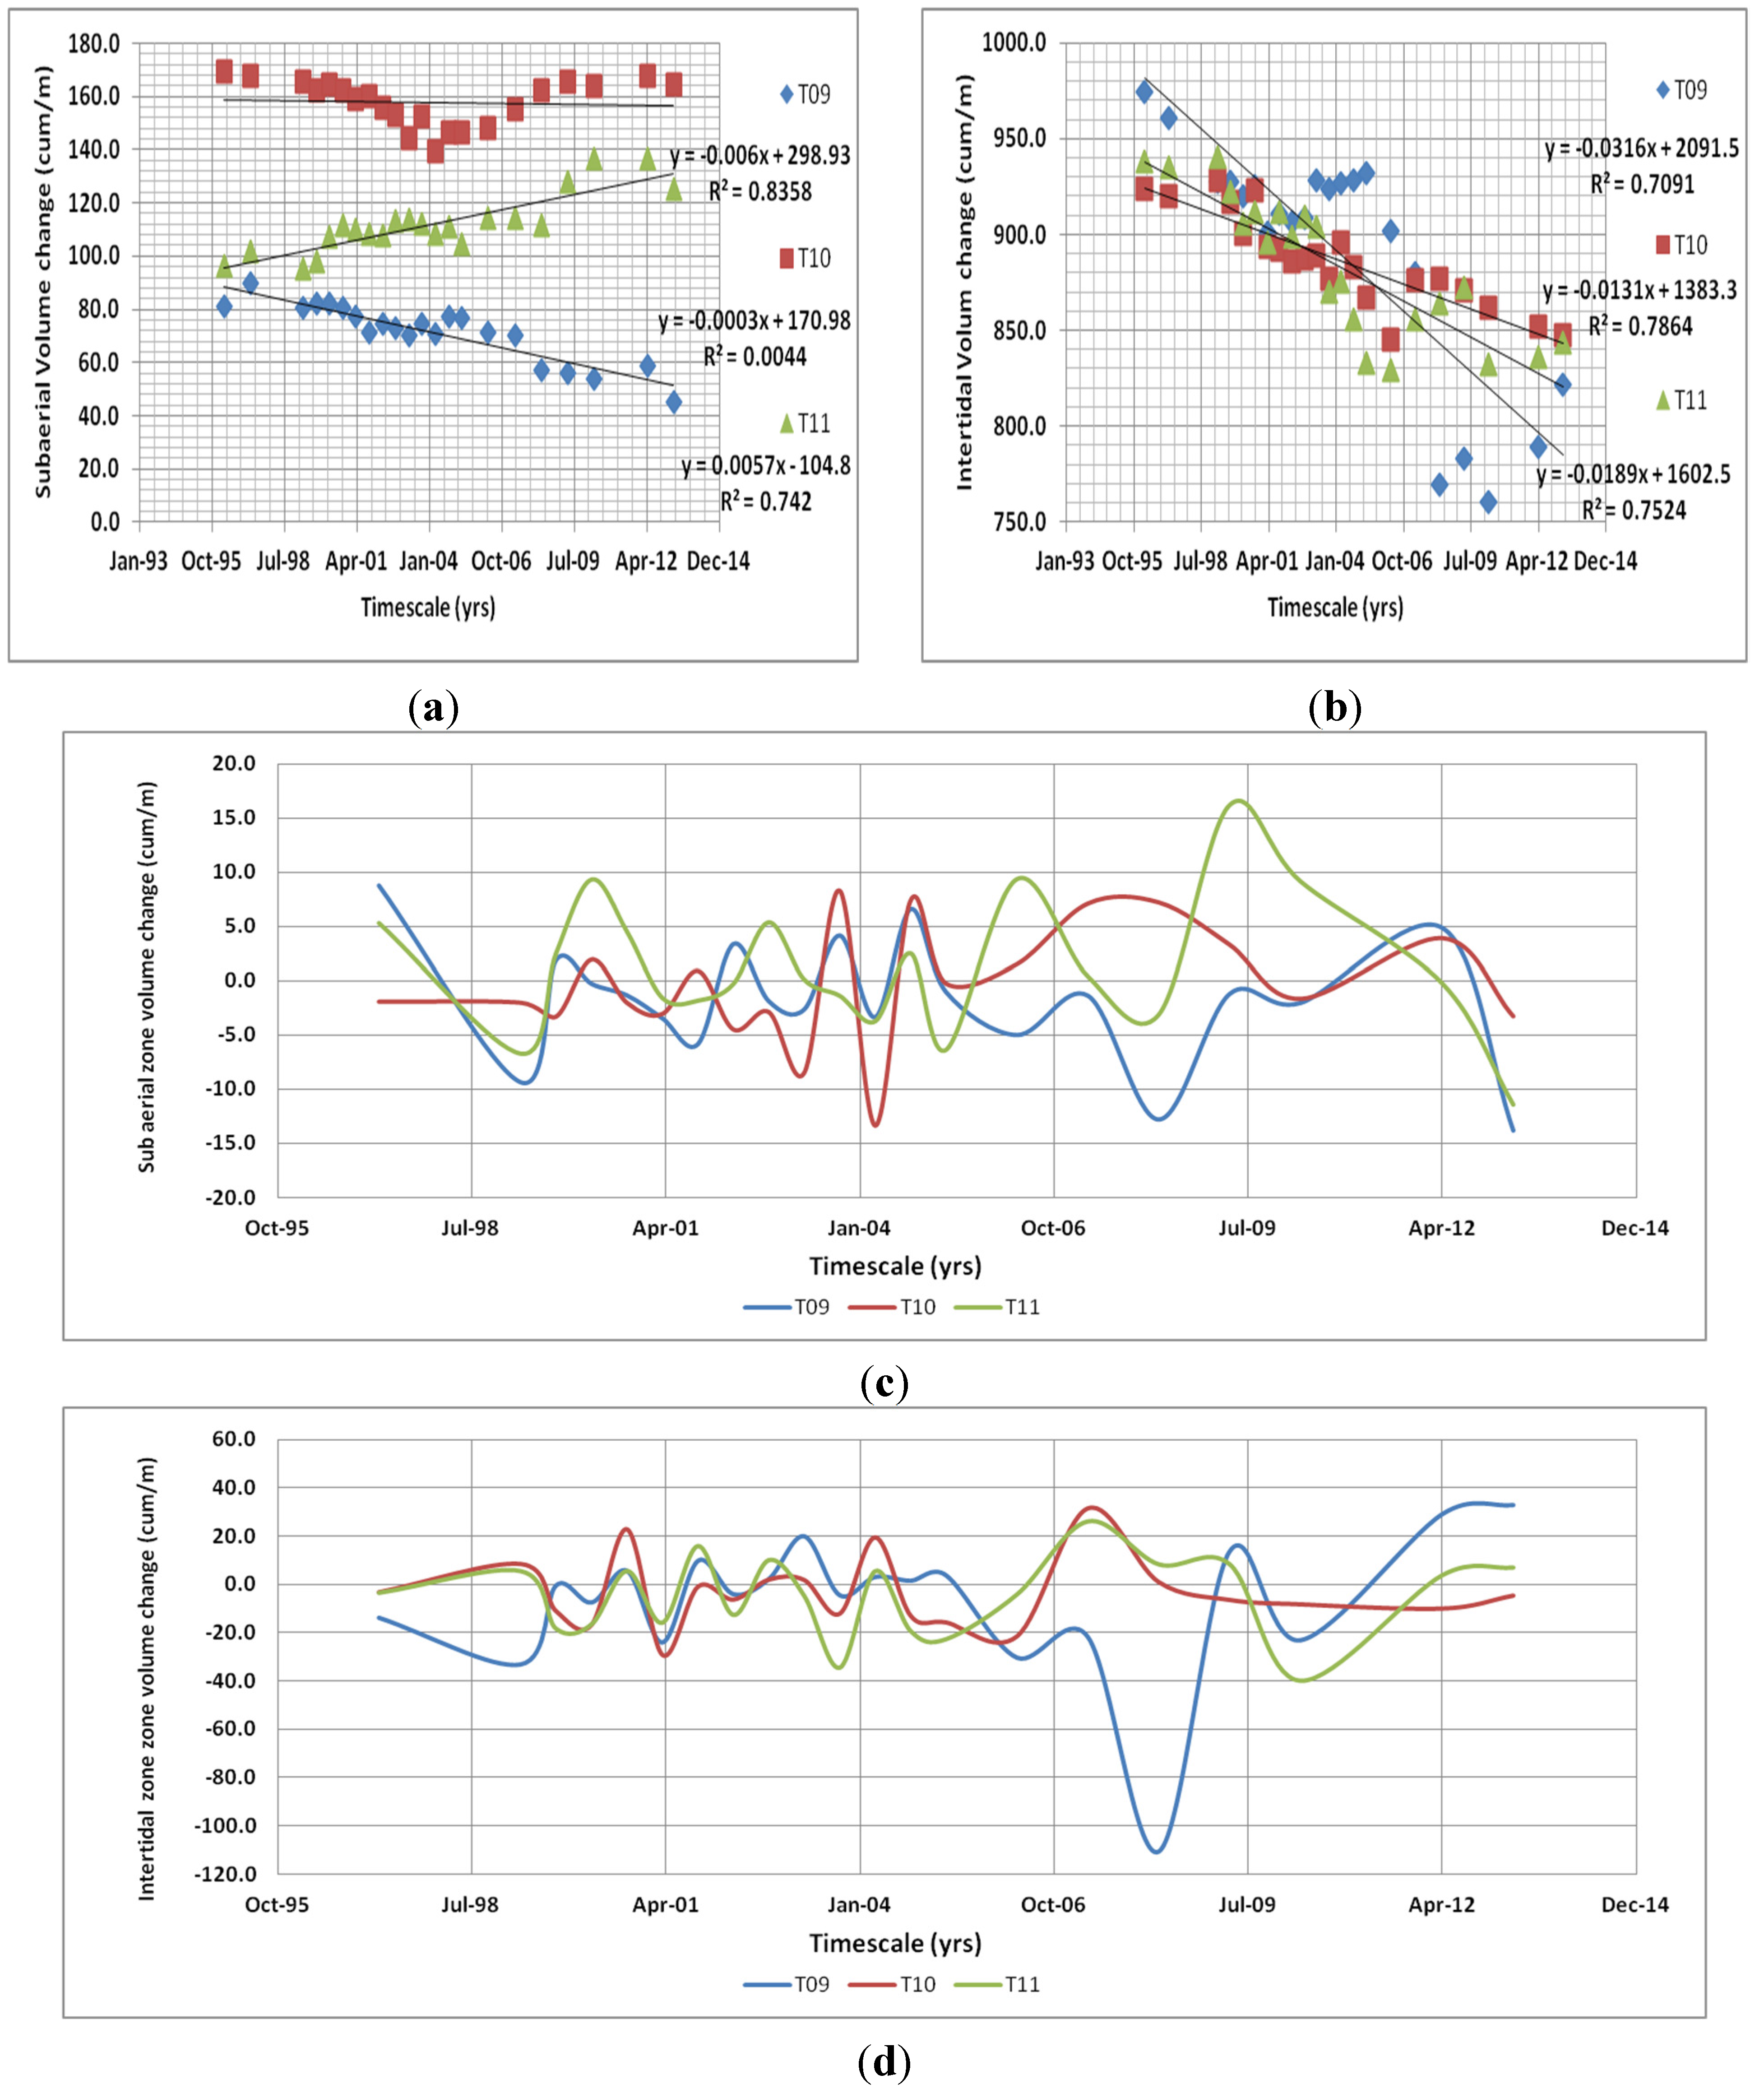
4.2. Beach Volumes (1996–2013)

Table 2: Produced directly from the RMAP programme show the volumes (m3·m−1) and inter-survey volumes for both subaerial and intertidal zones and data used to produce Figure 4. Subaerial volumes showed similar trends to the historic data i.e., erosion in the south (T09) and accretion in the north (T10), regression models showed that a significant relationship existed between volume change and time, with R2 values that explained 84% and 74% of data variation (y = −0.006x + 298.93 and y = 0.0057x − 104.84 respectively; Figure 4a). The historic central sector variability is also confirmed by a regression model that explained almost none of the data variation, suggesting that there was no relationship between central volume variation and time (y = −0.003x + 170.98). However, results are influenced by the location of the profile (i.e., within the region of rotation). All profiles showed similar erosion trends and a significant relationship between volume change and time within the intertidal zone and R2 values that explained 71% (T09), 79% (T10) and 75% (T11) data variation (y = −0.0316x + 2091.5, y = −0.0189x + 1602.5 and y = −0.0189x + 1602.5 respectively; Figure 4b).
Figure 4. Analyses of beach volume trends between 1996 and 2013: (a) temporal subaerial volume change; and (b) temporal intertidal volume change. Graphical representations depicting temporal inter-survey volume change between 1996 and 2013: (c) subaerial zone; and (d) intertidal zone.
Jmse 03 01006 g004
Table 2. Subaerial and intertidal volume change between 1996 and 2013.
TimescaleSubaerial Zone Volumes (m3·m−1)Subaerial Zone Inter-Survey Volumes (m3·m−1)Intertidal Zone Volumes (m3·m−1)Intertidal Zone Inter-Survey Volumes (m3·m−1)
onoffT09T10T11T09T10T11T09T10T11T09T10T11
Apr-9681.0169.596.5 974.6923.5938.4
Apr-96Apr-9789.7167.5101.88.7−1.95.3960.8920.1935.0−13.8−3.4−3.4
Apr-97Apr-9980.3165.595.1−9.4−2.0−6.7927.6928.3940.6−33.28.35.6
Apr-99Oct-9982.2162.297.71.9−3.32.6927.1917.1922.2−0.5−11.3−18.4
Oct-99Apr-0081.9164.2107.0−0.32.09.4919.6900.1905.7−7.5−16.9−16.5
Apr-00Oct-0080.6162.1111.5−1.4−2.04.5925.1922.7911.35.522.65.6
Oct-00Apr-0177.1159.1110.0−3.5−3.1−1.6901.0893.3895.4−24.1−29.4−15.9
Apr-01Oct-0171.3160.0108.2−5.80.9−1.8910.7892.2911.59.7−1.116.1
Oct-01Apr-0274.6155.5107.93.3−4.5−0.3906.6885.7898.9−4.1−6.5−12.7
Apr-02Oct-0272.7152.6113.3−1.9−2.95.4908.7887.5909.02.11.810.2
Oct-02Apr-0370.1144.1113.4−2.6−8.50.1928.6889.1904.419.91.6−4.7
Apr-03Oct-0374.2152.4112.14.18.3−1.4924.0876.8869.8−4.6−12.4−34.6
Oct-03Apr-0470.8139.0108.4−3.4−13.4−3.7927.0896.1875.43.019.35.6
Apr-04Oct-0477.4146.5110.96.67.42.5928.4882.8856.01.4−3.3−19.4
Oct-04Apr-0576.3146.2104.6−1.0−0.3−6.3932.1866.9833.23.7−15.9−22.7
Apr-05Apr-0671.3147.8114.0−5.01.59.4901.8845.1829.1−30.4−21.7−4.1
Apr-06Apr-0770.0154.9114.4−1.47.10.4880.0876.4855.4−21.831.326.3
Apr-07Apr-0857.2162.1111.3−12.87.2−3.1769.5877.1863.8−110.50.78.4
Apr-08Apr-0956.0165.5127.5−1.23.316.2783.1870.5872.313.6−6.68.5
Apr-09Apr-1053.9163.8136.7−2.0−1.79.2760.0862.0832.3−23.1−8.5−40.0
Apr-10Apr-1258.7167.7136.54.83.9−0.2789.0851.8836.229.0−10.23.9
Apr-12Apr-1344.9164.4125.1−13.8−3.3−11.4821.7847.0843.332.7−4.97.1
Negative values = erosion and positive values = accretion.
The inter-survey volume variation within the subaerial zone is represented graphically in Figure 4c, the beach volumes fluctuated between erosion and accretion on an almost annual basis at all profile locations. The southern and northern volume changes tended to be out of phase suggesting that when the southern sector erodes the northern sector follows similar erosion trends up to one year later and vice versa, with southern volumes fluctuating mostly below zero (erosion) and the northern volumes well above (accretion). Centrally, volumes fluctuated below zero between 1996 and 2005, and well above zero up until 2010, thereafter, all profile volumes dip well below zero. The inter-survey volume variation within the intertidal zone is also represented graphically in Figure 4d. Similar to the subaerial zone, volumes also fluctuated just above and below zero at all profile locations but tended to be in phase with one another up until 2005. Thereafter the southern sector eroded and central/northern sectors accreted, before all sector accreted towards the end of the assessed period. The accretive episode coincided with the erosion shown in the subaerial zone during the same period and concurs with Thomas et al.’s [49] work at Pendine, west Wales, where evidence showed that during storms and gales that coincide with the high spring tidal range the subaerial zone erodes, deposits sediment within the intertidal zone, from where longshore drift from south towards north erodes the intertidal zone until a similar event occurs reversing the trend.
Figure 5. Analyses of transformed beach subaerial volume trends 1996–2013: (a) between south and north beach extremities; (b) between southern and central zones; (c) between northern and central zones; (d) cross-correlation results between south and north beach extremities; and (e) a graphical representation depicting temporal inter-survey volume change.
Jmse 03 01006 g005

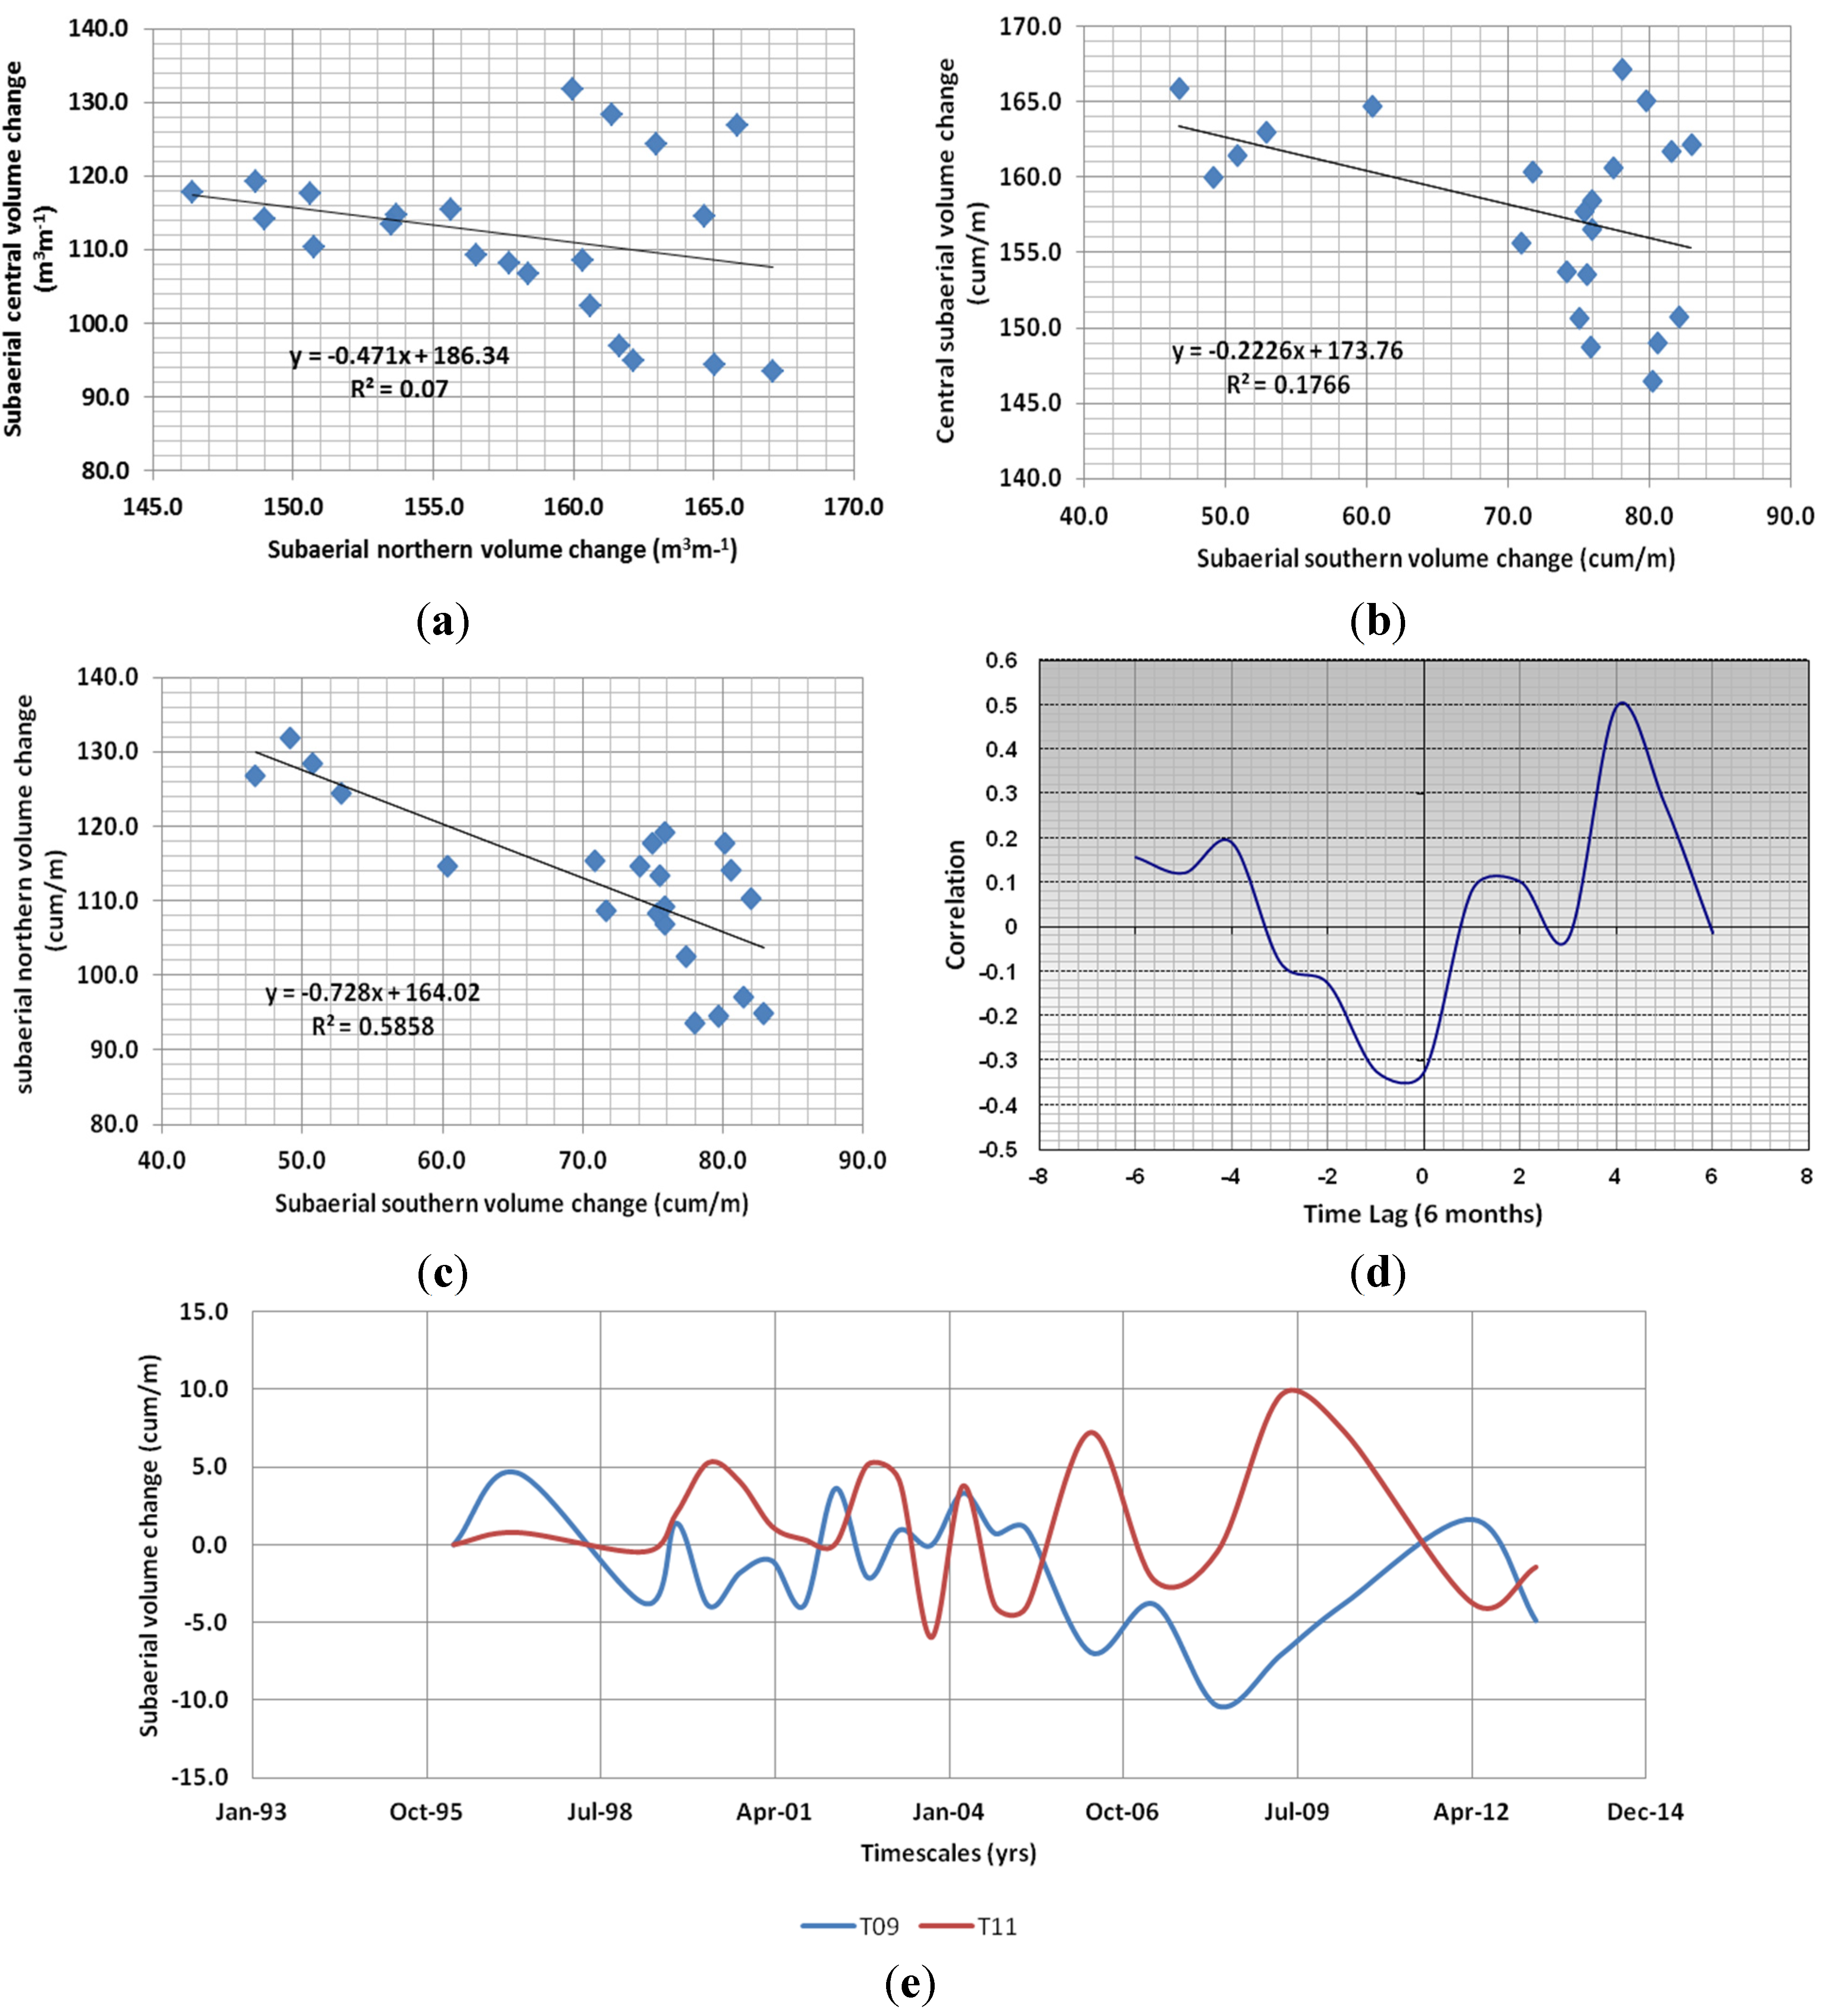
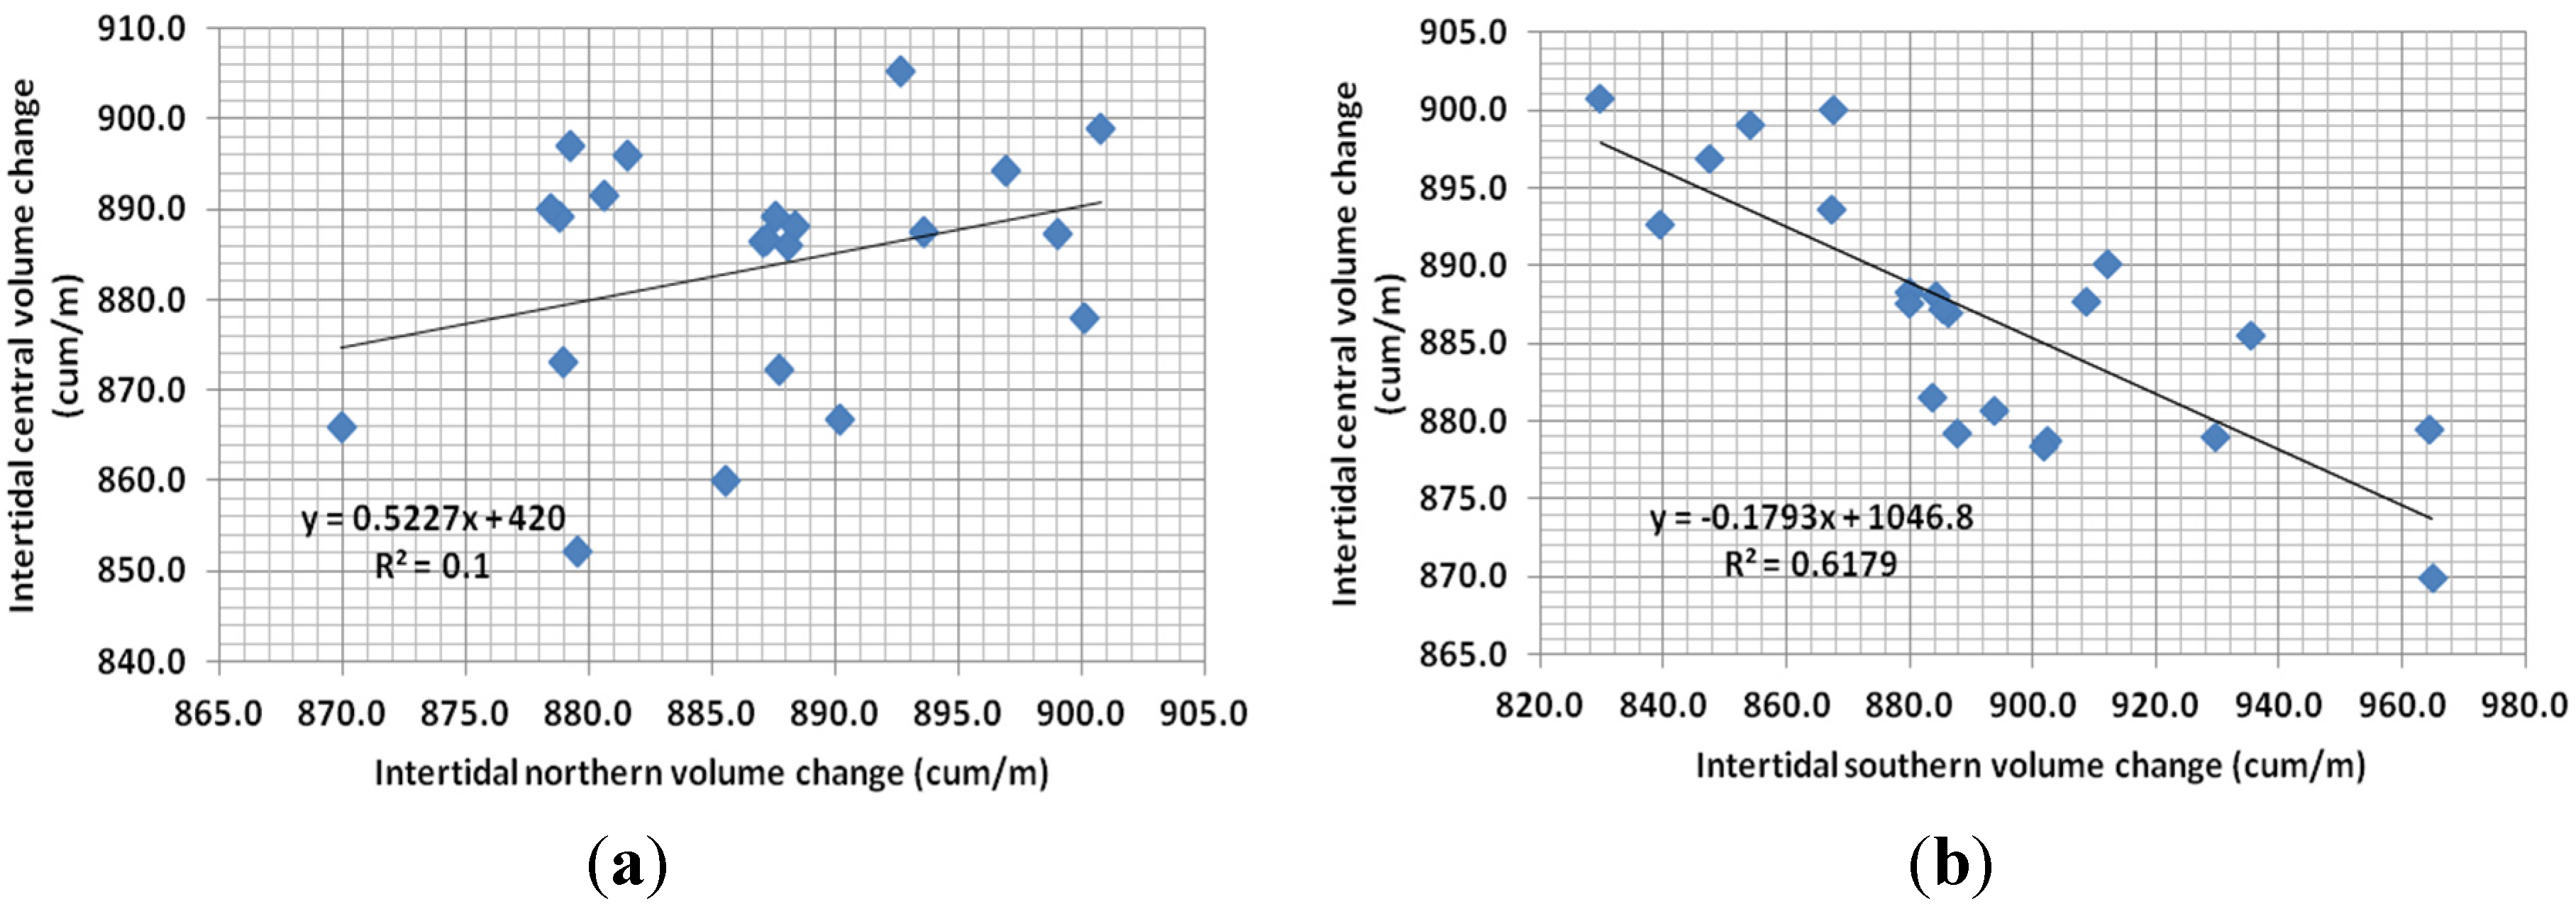
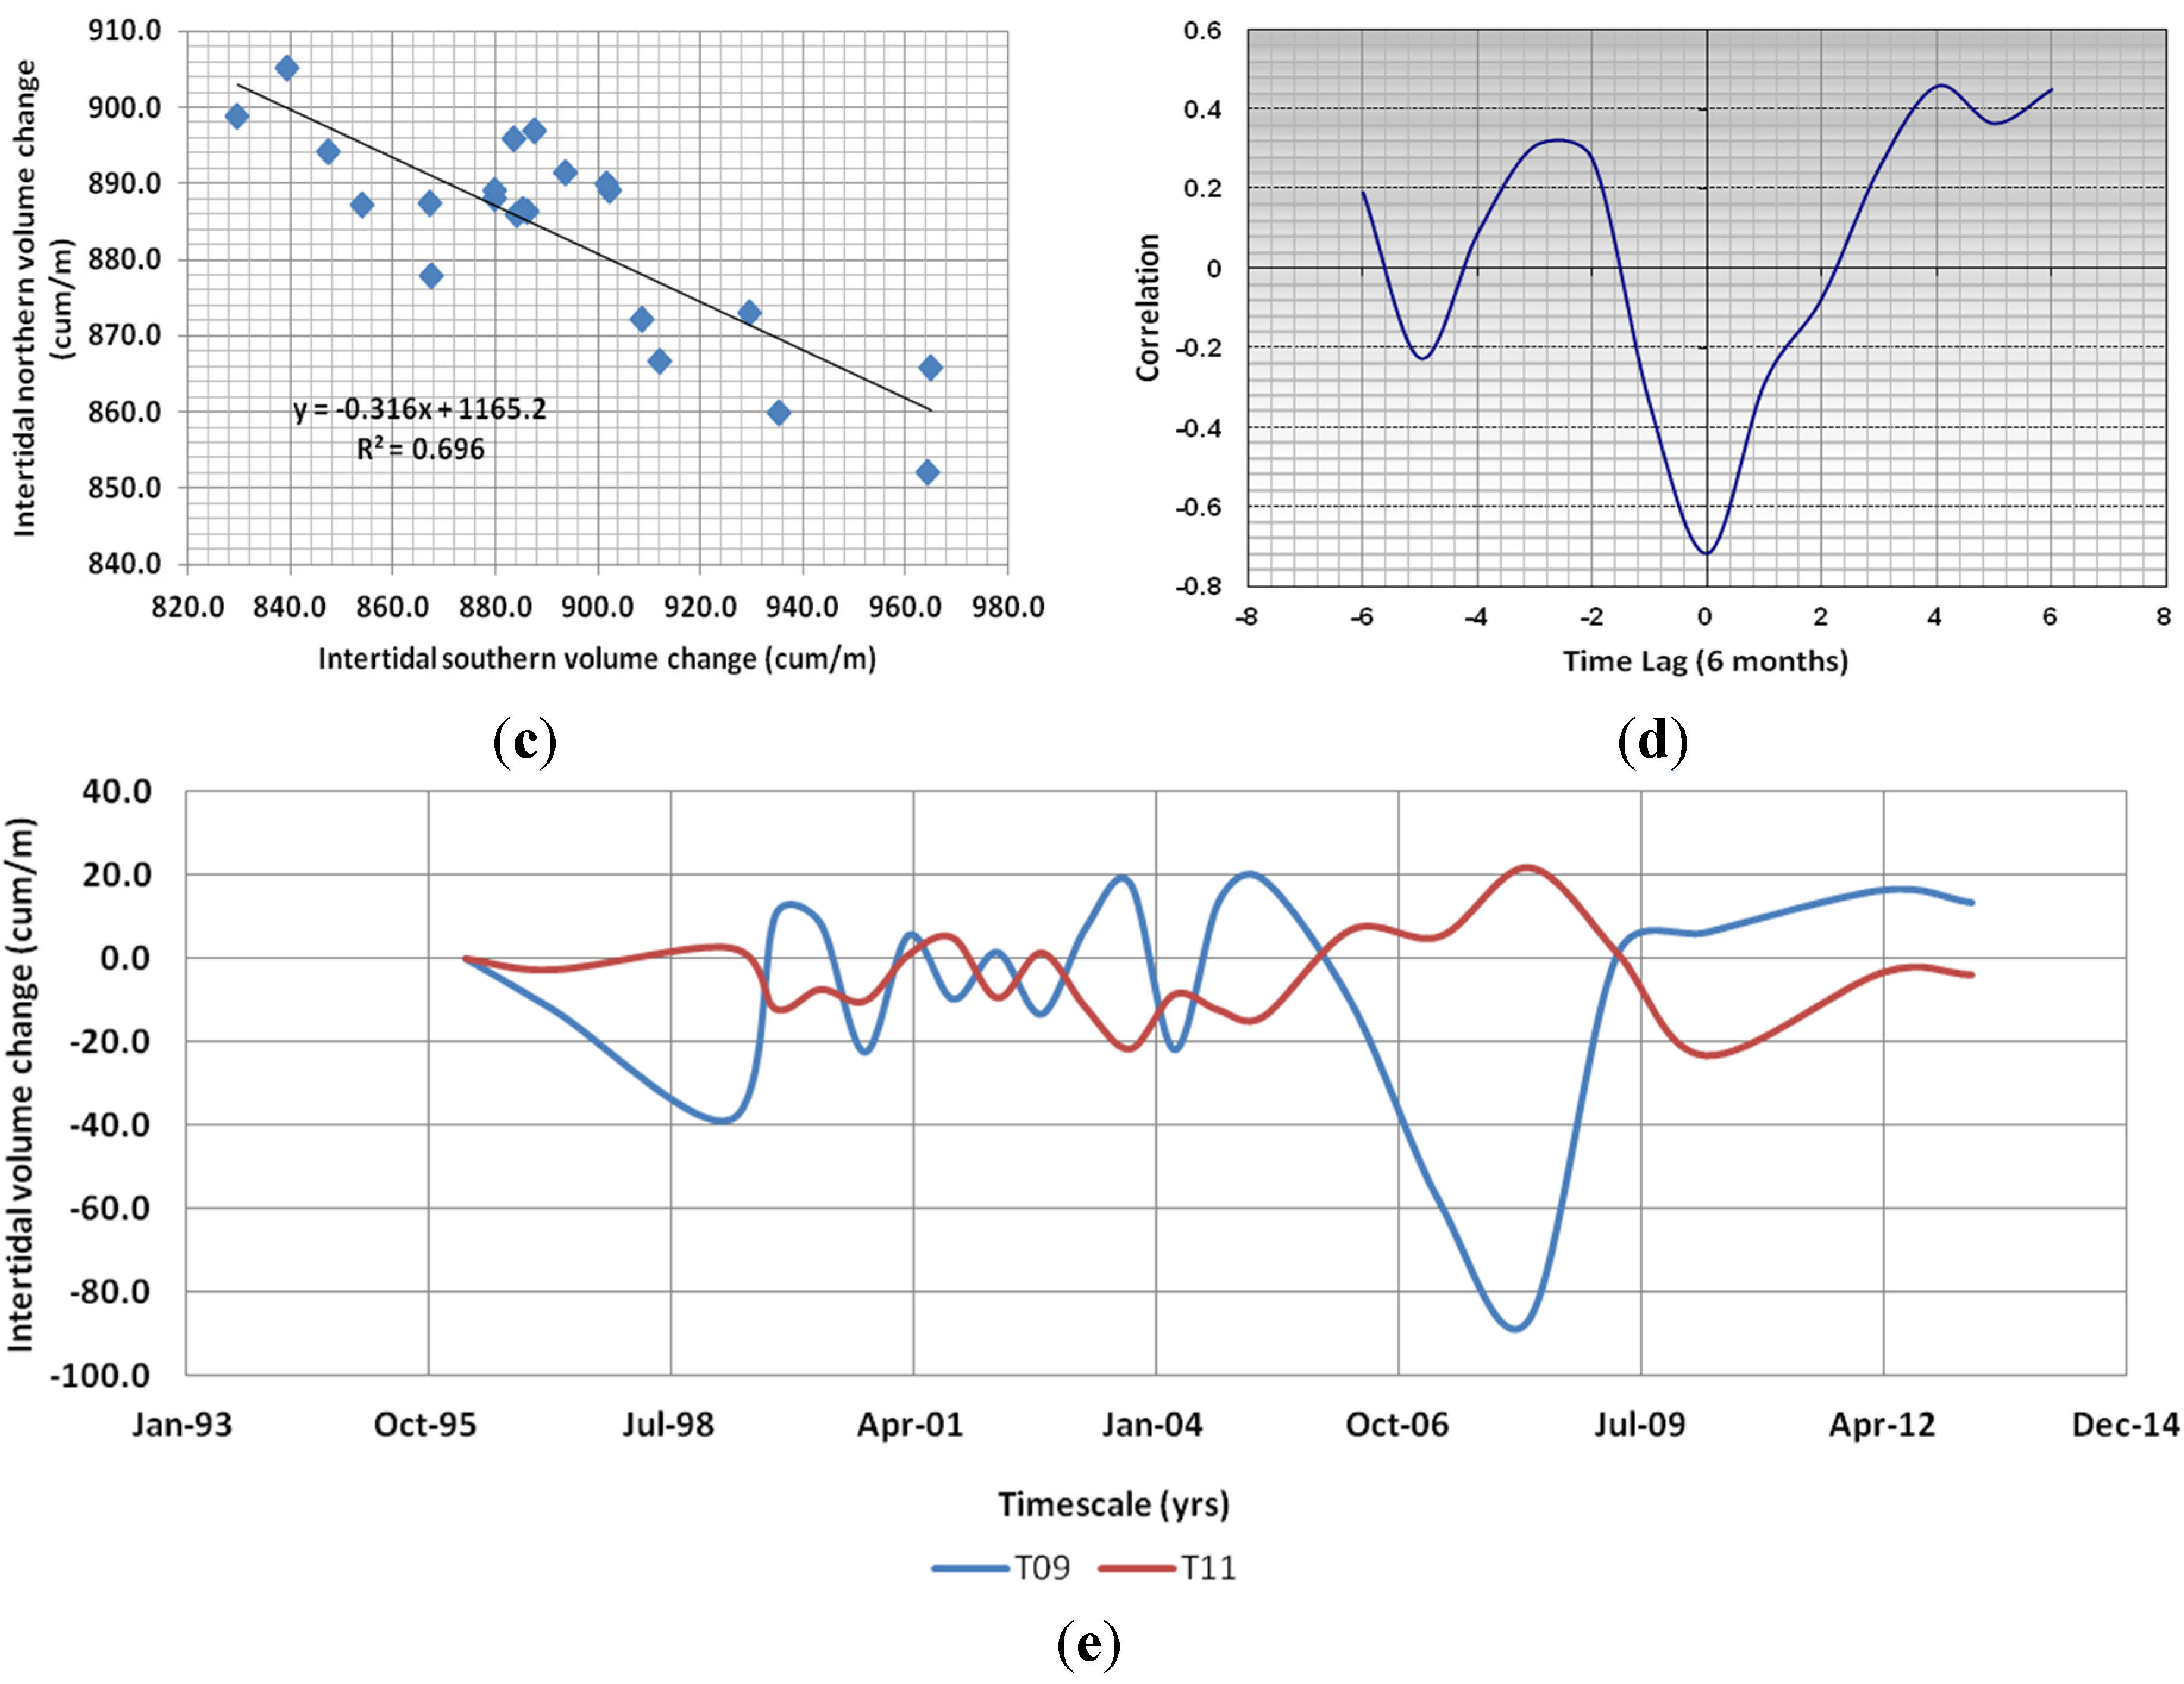
4.3. Beach Rotation (1996–2013)

The cross shore signal was removed from subaerial and intertidal volumes (Table 2) using the routine described by [14] and Figure 5 and Figure 6 produced. Within the subaerial zone negligible negative relationships existed between the central and northern/southern sectors with R2 values that explained almost none of the data variation (y = −0.171x + 186.34 and y = −0.226x + 173.76 respectively, Figure 5a,b). However, it is the significant relationship (R2 = 59%) that existed between profiles T09 (extreme south) and T11 (extreme north) that is of most interest, as this indicates a negative phase relationship between accretion/erosion patterns between southern and northern ends of the beach (i.e., beach rotation). This was given by the regression equation y = −0.728x + 164.02 (Figure 5c). To investigate stronger potential correlations between south and north beach extremities, time lagged cross-correlations of volume changes between profiles T09 and T11 were calculated and represented in Figure 5d. Results show no improvement in correlation but a reversal in trend at a two time lags (in the positive direction), which indicates that southerly volume variations lag behind northern variations by one year. When a reversal in trend occurs (in the negative direction), northern variations lag behind southern change by four time lags (i.e., two years). The volume changes at the beach extremities are represented graphically in Figure 5e and highlight three rotational periods in 2001, 2004 and 2012 respectively. These results show that even though there is limited exposure to waves within the subaerial zone of this macrotidal beach, rotational response can still be detected.
Within the intertidal zone a negligible positive relationship existed between the central and northern sectors and once again the R2 value explained almost none of the data variation (y = 0.5227x + 420; R2 = 10%; Figure 6a) indicating that when variations took place in the northern sector similar changes also occurred centrally. In contrast, a high negative relationship existed between southern and central sectors indicating that when changes occur in the southern sector the opposite would be true in the central sector (y = 0.1793x + 1046.8, R2 = 62%; Figure 6b). However, it is the significant relationship (R2 = 70%) that existed between profiles T09 (extreme south) and T11 (extreme north) that is of most interest, as this indicates a negative phase relationship between accretion/erosion patterns between southern and northern ends of the beach (i.e., intertidal beach rotation). This was given by the regression equation y = −0.316x + 1165.2 (Figure 6c). To investigate stronger potential correlations between south and north beach extremities, time lagged cross-correlations of volume changes between profiles T09 and T11 were calculated and represented graphically (Figure 6d). Results show no improvement in correlation but a reversal in trend at a four time lags (in the positive direction), indicating that southerly volume variations lag behind northern variations by two years. When a reversal in trend occurs (in the negative direction), northern variations lag behind southern change by three time lags (i.e., 18 months). The volume changes at the beach extremities are represented graphically in Figure 6e and highlight an almost cyclical rotational behavioural pattern throughout the assessed period. These results show that rotation phenomena are not exclusive to subaerial sectors of macrotidal beaches.
Figure 6. Analyses of transformed beach intertidal volume trends 1996–2013: (a) between south and north beach extremities; (b) between southern and central zones; (c) between northern and central zones; (d) cross-correlation results between south and north beach extremities; and (e) a graphical representation depicting temporal inter-survey volume change.
Jmse 03 01006 g006aJmse 03 01006 g006b

4.4. Wave Climate and Storms (1996–2013)

Data showed clear cyclic patterns when monthly average significant wave height (Hs) was assessed. Waves were usually low (Hs < 1.4 m) in May–August period (late spring to summer), reaching minimum values in July (Hs = 1.24). During the winter season, waves rapidly increased in height, reaching peak values (Hs = 2.4 m) in December–January.
Regression analysis showed that both monthly and annually averaged wave heights decreased throughout the period of assessment (−0.001 m·year−1 and −0.02 m·year−1 respectively). However, low recorded values of Pearson coefficient revealed that these trends are not statistically significant (p > 0.05). Similar results were obtained using the Mann-Kendall trend test and the Wilcoxon rank-sum test are in common use in similar studies [50,51,52]. This data evidenced quasi-periodic 4 year behavioural patterns in the recurrence of high wave height values. A spectral analysis of time series of extreme waves, based on the Fourier transformation [4] indicated a cyclic trend of 3 years.
In total 267 storm events were recorded during the period of assessment. Classes I (weak) and II (moderate) accounted for, respectively, 47% and 26% of records. These values were similar to [44,47,53,54,55] studies carried out in USA and Spain. Class III (significant), constituted 18% of the record and Classes IV (severe) and V (extreme) accounted for 4% and 6% respectively (Table 3).
Associated average wave height and storm duration values presented important variations (Table 2) and average wave period ranged from 8 (Class I) to 9.3 s (Class V). Storm power values were larger than Dolan and Davis (1992) [44] because of the major threshold of storm wave height selected in this study and longer storm durations. Variability patterns of storm duration and Storm Power Index were very similar to that found for the number of storms. This is because the stormy season (winter period) presented a greater number of storms and their overall duration resulted in elevated storm power.
Table 3. Storm classification statistics.
ClassRangeFrequencyWave Height (Avg)Period (Avg)Duration (Avg)Storm Power (Avg)
N%
I<600125474.78.016.7373.2
II601–123669265.58.630.2875.3
III1237–202248186.59.142.21679.3
IV2023–35291046.89.163.12753.7
V>35291567.09.396.54719.7

4.5. Environmental Forcing and Morphological Change (1998–2013)

Storm conditions and subaerial volume changes were compared and presented graphically in Figure 7a. During months where there is increased storm activity either at the start or end of the period both southern and northern shores (1999 and 2008 respectively) erode and when there are reductions in storm activity; the southern shore erodes and northern accretes (2000–2002, 2006–2007 and 2009–2010 respectively). With the exception of winter 2010 to summer 2012, it appears that southern shores are only stable or accretive during periods when there is no storm activity. The most significant gains in the northern sector occur when the wind is south-southwest (i.e., weakly above zero) for example, winter 2008 to summer 2010. The only anomaly is the significant erosion took place in both sectors towards the end of the assessment period, although the wind direction may have been an influence that was mostly emanating from the south east. The intertidal zone behaved differently under storm conditions (Figure 7a), probably influenced by sediment inputs across shore. Increasing storm occurrence mostly led to southern erosion and northern accretion, easterly orientated winds resulted in accretion in both sectors and periods with little or no storm occurrences resulted in a northern loss, probably as a result of onshore sediment movement. No real trends appeared in the data and the system appears to react independently of storm events and while they undoubtedly have a major influence in this sediment-limited environment they may act to trigger major configuration changes and trend reversals and then subsequent storms even from a similar direction will trigger a reversal in trend that does not appear to be induced by external forcing this phenomenon was also highlighted by Cooper [18] in similar studies on the Irish coastline.
Figure 7. Graphical representations comparing normalised wind direction. Storm occurrence (class III, IV and V; 1996–2013) with: (a) subaerial volumes change; and (b) intertidal volume change.
Jmse 03 01006 g007

5. Discussion

The study has examined available information on storm characterization, wave models and beach level and volume change over a 17-year period to establish if beach rotation and morphology changes, identified by Thomas et al. [16], continued at South Beach, Tenby, West Wales. Statistical tests suggest that there was significant beach level losses in both southern (T09) and central (T10) sectors (p < 0.01) and increasing beach levels in the northern sector (T11) albeit statistically insignificant (p > 0.05).
What is also of interest is that there are significant changes taking place (in terms of the beach level standard deviation) at the terminus of each beach profile suggesting that active beach profile extends into the subtidal zone. This is important for this particular littoral as sediment may be lost around the down drift headland and may explain the reason for continued beach level losses.
When temporal beach volume variations were examined within the subaerial zone, results agreed with the centurial trends found by Thomas et al. [12], southern (T09) and central (T10) erosion and northerly (T11) accretion (R2 = 84%. 1% and 79% respectively). Statistically there was very little correlation within the central region suggesting that changes are cyclic and overall stability showing a loss of <0.3 m3·year−1. With statistical significance all three assessed sectors eroded within the intertidal zone during the 17 year period of assessment (R2 = 71% (T09). 79% (T10) and 75% (T11)). This temporal trend of lowering beach level can be associated with a sediment deficiency from an offshore or up-drift location and/or changes to near-shore bathymetry. The macrotidal nature of the locality may also be an influence with the subaerial zone only affected during high tidal conditions.
When the cross shore component was removed from the data, negative phase relationships existed between south/north sectors within both assessed zones. This indicates that when one sector erodes the other accretes and vice versa i.e., beach rotation (subaerial R2 = 59%. Intertidal R2 = 70%); there was also negative correlations between south/north and central beach sectors (i.e., non-rotational) within the subaerial zone but with almost no statistical significance and once again the limited exposure to waves in this zone has influence. These results are not surprising given that the beach pivot point or region of rotation may not occur at the profile position but this contradicts Thomas et al. [16] findings, showing the profile position was closer to the beaches pivot point. There was a positive correlation between south and central sectors that suggested that when changes took place in the south similar changes took place in the central region and in the south the opposite would be true due to a negative relationship. Even though there was no improvement when cross-correlations were calculated, there was a trend reversal at a one year time lag in the subaerial zone and two years in the intertidal zone, confirmed in both cases by time-series analyses.
However, it is the intertidal results that are of most interest, this showed that with statistical significance that a clear pattern of rotation existed. This was surprising as the intertidal zone is circa 250 m wide. The centurial work [12] showed an almost consistent trend of beach rotation, eroding in the south and accreting in the north. They also showed that when the dune system eroded in the south the sediment was deposited within the intertidal zone and while some feedback was probable, most of the sediment moved alongshore, contributing to the northern sediment budget, with the overburden lost around the down drift headland (Tenby).
Figure 8. (a) A graphical illustration of the effects of southwesterly and southeasterly wave regimes have on Tenby South Sands; (b) a simplified conceptual model of wave propagation to nearshore based on waves from a south-westerly direction; and (c) a simplified conceptual model of wave propagation from a southeasterly direction.
Jmse 03 01006 g008
Significant wave heights show clear cyclic patterns and these were attuned to the wave direction, where southwesterly winds dominate the winter climate with increased wave height. During summer there is a slight change toward east (from southwest) and lower wave heights. This is significant as feedback from north toward south has been shown to be reliant on easterly orientated waves that are sub-dominant in this region [13,16], which explains longer term beach rotation in one direction (southern erosion an northern accretion). Figure 8 was reproduced from Thomas [16] shows graphically (Figure 7a) the expected sediment movement along the bay when exposed to both dominant southwesterly waves and sub-dominant southeasterly waves and wave propagation is shown conceptually for both wave directions in Figure 8b and Figure 8c respectively. In total, 267 storms occurred during the period of assessment and subsequent analysis highlighted both seasonal (summer/winter) and medium (3 yearly) cyclic behaviour. Twenty-eight percent of storms were classed between class III (severe) and V (extreme) and these are mainly generated by southwesterly wind regimes that cause south to north sediment movement. Southeasterly winds that produced counter drift generally occur during summer but with less intensity, explaining the longer term trends of south erosion and north accretion (i.e., one directional rotation).
There was no quantitative correlation between storms and volume changes and qualitative assessment showed that the beach system is probably event driven. The shoreline reaction to a storm event or series of events may trigger either erosion or accretion that continues until another similar event triggers a reversal in trend. Again this would explain the longer term evolution of this embayment were the predominant environmental forcing is generated by Atlantic swell waves. Similar behaviour should be exhibited at other worldwide coastal locations and it is suggested that this work is repeated to establish specific responses; this would enable suitable coastal management policies to be developed in order to underpin intervention or no active intervention strategies and enable more effective use of limited resources.

6. Conclusions

Cross-shore profiles and environmental forcing were used to analyse morphological change of a headland bay beach: Tenby, West Wales (51.66 N; −4.71 W) over a mesoscale timeframe (1996–2013). Statistical tests showed that southern and central profile losses were significant and northern gains were insignificant when assessed across the entire profile. Beach volume variations were attuned with historic research within the subaerial zone given by statistically significant loss on southern shores and gain on northern shores, with the central region showing an insignificant loss. Volume loss was shown at all profile locations within the intertidal zone possibly influenced by sediment deficiencies either up drift or offshore. Beach rotation within both zones was established by statistically significant negative phase relationships at the beach extremities but not within the central region of rotation. Cross-correlations highlighted trend reversals suggesting that southern/northern sediment exchange lagged one another by up to two years. Qualitatively, time series analysis confirmed this rotational trend. There was little correlation between volume variation and storm occurrence, suggesting the system is event driven.
Wave height and storm events exhibited summer/winter cyclic trends that provided an explanation for longer term evolution at this location (i.e., one directional rotation). In line with previous regional research, environmental forcing suggests that changes are influenced by variations in southwesterly wind regimes. Winter storms are more often than not generated by Atlantic southwesterly winds which cause both energetic waves and a south toward north sediment exchange. Southeasterly conditions that result in a trend reversal are generally limited to the summer period, where waves are fetch-limited and less energetic. Natural and man-made embayment beaches are common coastal features and many experience shoreline change jeopardising protective and recreational beach functions. In order to facilitate an effective and sustainable coastal zone management strategy, an understanding of the morphological variability of these systems is needed. Therefore, this macrotidal study’s results have global implications, especially in response to predicted sea level rise and climate change scenarios, and should be repeated elsewhere to inform the development of appropriate shoreline management strategies.

Acknowledgments

The authors would like to thank Welsh Assembly Government Aerial Photographs Unit, Welsh Government, Crown Offices, Cathays Park, Cardiff, Wales. CF10 3NQ for aerial photographs used in the research. The authors would like to thank the anonymous reviewers for their constructive comments and suggests that were very much appreciated and improved the content of this paper.

Author Contributions

Conceived and designed the experiments: TT NRB. Performed the experiments: TT NRB. Analyzed and checked data: TT NRB GA MRP AW. Wrote the paper: TT NRB GA MRP AW

Conflicts of Interest

The authors declare no conflict of interest.

References

  1. Ojeda, E.; Guillen, J. Shoreline Dynamics and beach rotation of artificial embayed beaches. Mar. Geol. 2008, 253, 51–62. [Google Scholar] [CrossRef]
  2. Short, A.D.; Masselink, G. Embayed and structurally controlled beaches. In Handbook of Beach and Shoreface Morphodynamics; Short, A.D., Ed.; John Wiley and Sons Ltd.: Chichester, UK, 1999; pp. 230–250. [Google Scholar]
  3. Benedet, L.; Klein, A.H.F.; Hsu, J.R.C. Practical insights and applicability of empirical bay shape equations. In Coastal Engineering Conference; American Society of Civil Engineers: Reston, VA, USA, 2004; pp. 2181–2193. [Google Scholar]
  4. Boashash, B. Theory of quadratic TFDs. In TIme-Frequency Signal Analysis and Processing: A Comprehensive Reference; Boashash, B., Ed.; Elsevier Ltd.: Oxford, UK, 2003; pp. 59–81. [Google Scholar]
  5. Carter, R.W.G. Coastal Environments: An Introduction to the Physical, Ecological and Cultural Systems of Coastlines; Academic Press: London, UK, 1988; p. 617. [Google Scholar]
  6. Harley, M.D.; Turner, I.L.; Short, A.D.; Ranasinghe, R. A reevaluation of coastal embayment rotation: The dominance of cross-shore versus alongshore sediment transport processes, Collaroy-Narrabeen Beach southeast Australia. J. Geophys. Res. 2011, 116. [Google Scholar] [CrossRef]
  7. Bryan, K.R.; Foster, R.; MacDonald, I. Beach rotation at two adjacent headland-enclosed beaches. J. Coast. Res. 2013, 118, 2095–2100. [Google Scholar]
  8. Silva, A.N.; Taborda, R.; Antunes, C.; Catalão, J.; Duarte, J. Understanding the coastal variability at Norte beach, Portugal. J. Coast. Res. 2013, 118, 2173–2178. [Google Scholar]
  9. Klein, A.H.F.; Benedet Filho, L.; Schumacher, D.H. Short-term beach rotation processes in distinct headland bay systems. J. Coast. Res. 2002, 18, 442–458. [Google Scholar]
  10. Ranasinghe, R.; McLoughlan, R.; Short, A.; Symonds, G. The southern oscillation index, wave climate and beach rotation. Mar. Geol. 2004, 204, 273–287. [Google Scholar] [CrossRef]
  11. Ruiz de Alegria-Arzaburu, A.; Masselink, G. Storm response and beach rotation on a gravel beach, Slapton Sands, UK. Mar. Geol. 2010, 278, 77–99. [Google Scholar] [CrossRef]
  12. Thomas, T.; Phillips, M.R.; Williams, A.T. Mesoscale evolution of a headland bay: Beach rotation Process. Geomorphology 2010, 123, 129–141. [Google Scholar] [CrossRef]
  13. Thomas, T.; Phillips, M.R.; Williams, A.T.; Jenkins, R.E. Short-term beach rotation, wave climate and the North Atlantic Oscillation (NAO). Prog. Phys. Geogr. 2011, 35, 333–352. [Google Scholar] [CrossRef]
  14. Short, A.D.; Trembanis, A.C. Decadal scale patterns of beach oscillation and rotation: Narabeen Beach, Australia—Time Series PCA and Wavelet Analysis. J. Coast. Res. 2004, 20, 523–532. [Google Scholar] [CrossRef]
  15. Short, A.D.; Trembanis, A.C.; Turner, I.L. Beach Oscillation, Rotation and the southern Oscillation, Narabeen Beach, Australia. Coast. Eng. 2000, 2439–2452. [Google Scholar] [CrossRef]
  16. Thomas, T.; Phillips, M.R.; Williams, A.T.; Jenkins, R.E. Medium timescale beach rotation: Gale climate and offshore island influences. Geomorphology 2011, 135, 97–107. [Google Scholar] [CrossRef]
  17. Cooper, J.A.G.; Jackson, D.W.T. Geomorphological and dynamic constraints on mesoscale coastal response to storms, Western Ireland. In Coastal Sediments ’07: Proceedings 6th International Symposium on Coastal Engineering and Science of Coastal Sediment Processes; American Society of Civil Engineers: Reston, VA, USA, 2003; pp. 3015–3024. [Google Scholar]
  18. Cooper, J.A.G. Temperate coasts. In Applied Sedimentology; Perry, C.M., Taylor, K., Eds.; Blackwell Publishing: Oxford, UK, 2007; pp. 263–301. [Google Scholar]
  19. O’Connor, M.O.; Cooper, J.A.G.; Jackson, D.W.T. Morphological behaviour of headland-embayment and inlet-associated beaches, Northwest Ireland. J. Coast. Res. 2007, 59, 626–630. [Google Scholar]
  20. Anthony, E.J.; Dolique, F. The influence of Amazon-derived mud banks on the morphology of sandy headland-bound beach in Cayenne, French Guiana: A short to long-term perspective. Mar. Geol. 2004, 208, 249–264. [Google Scholar] [CrossRef]
  21. Anthony, E.J.; Gardel, A.; Dolique, F.; Guiral, D. Short-term changes in the planshape of a sandy beach in response to sheltering by a near shore mud bank, Cayenne, French Guiana. Earth Surf. Processes Landf. 2002, 27, 857–866. [Google Scholar] [CrossRef]
  22. Thomas, T.; Phillips, M.R.; Williams, A.T.; Jenkins, R.E. A multi-century record of linked nearshore and coastal change. Earth Surf. Processes Landf. 2011, 36, 995–1006. [Google Scholar] [CrossRef]
  23. Dehouck, A.; Dupuis, H.; Senechal, N. Pocket beach hydrodynamics: The example of four macrotidal beaches, Brittany, France. Mar. Geol. 2000, 266, 1–17. [Google Scholar] [CrossRef]
  24. Dolique, F.; Anthony, E.J. Short-term profile changes of sandy pocket beaches affected by amazon-derived mud, Cayenne, French Guiana. J. Coast. Res. 2005, 21, 1195–1202. [Google Scholar] [CrossRef]
  25. Pinto, C.A.; Tabord, T.; Andrade, C.; Teixeira, S. Seasonal and mesoscale variations at an embayed beach (Armacao De Pera, Portugal). J. Coast. Res. 2009, SI56, 118–122. [Google Scholar]
  26. Loureiro, C.; Ferreira, O.; Cooper, J.A.G. Contrasting morphological behaviour at embayed beaches in southern Portugal. J. Coast. Res. 2009, SI56, 83–87. [Google Scholar]
  27. Sedrati, M.; Anthony, E.J. A brief overview of plan-shape disequilibrium in embayed beaches: Tangier Bay (Morocco). Mediterranee 2007, 108, 125–130. Available online: http://mediteranee.revues.org/index190.html?file=1 (accessed on 21 September 2009). [Google Scholar] [CrossRef]
  28. Stone, G.W.; Orford, J.D. Storms and their significance in coastal morpho-sedimentary dynamics. Mar. Geol. 2004, 210, 1–5. [Google Scholar] [CrossRef]
  29. Maspataud, A.; Ruz, M.H.; Hequette, A. Spatial variability in post-storm beach recovery along a macrotidal barred beach, southern North Sea. J. Coast. Res. 2009, 1, 88–92. [Google Scholar]
  30. Uncles, R.J. Physical properties and processes in the Bristol Channel and Severn Estuary. Mar. Pollut. Bull. 2010, 61, 5–20. [Google Scholar] [CrossRef] [PubMed]
  31. Phillips, M.R.; Crisp, S. Sea level trends and NAO influences: The Bristol channel/Severn estuary. Glob. Planet. Change 2010, 73, 211–218. [Google Scholar] [CrossRef]
  32. Lavernock Point to St Ann’s Head SMP2. Available online: http://www.southwalescoast.org/contents.asp?id=55#SMP2MainDocument (accessed on 20 June 2011).
  33. Toghill, P. The Geology of Britain: An Introduction; Crowhill Press Ltd.: Wiltshire, UK, 2000; p. 192. [Google Scholar]
  34. Hunter, A.; Easterbrook, G. The Geological History of the British Isles; The Alden Group: Oxford, UK, 2004; p. 143. [Google Scholar]
  35. Mackie, A.S.Y.; James, J.W.C.; Rees, E.I.S.; Darbyshire, T.; Philpot, S.L.; Mortimer, K.; Jenkins, G.O. The Outer Bristol Channel Marine Habitat Study. 2002. Available online: http://www.marlin.ac.uk/obc/pdfs/report/chapter%202.pdf (accessed on 12 December 2010).
  36. Owen, T.R. Geology Explained in South Wales; David & Charles Publishers: Newton Abbott, UK, 1973; p. 177. [Google Scholar]
  37. Hillier, R.D.; Williams, B.P.J. The alluvial OLD Red Sandstone: Fluvial Basins. In The Geology of England and Wales; Brenchley, P.J., Rawson, P.F., Eds.; The Geological Society: London, UK, 2006; pp. 155–172. [Google Scholar]
  38. Duvivier, P. South Beach, Tenby; Posford Duvivier: Peterborough, UK, 1998; p. 19. [Google Scholar]
  39. Gibbard, B. Tenby South Beach Erosion: Review of Wind/Wave Data, Beach Monitoring and Modelling; Royal Haskoning: Peterborough, UK, 2005; p. 39. [Google Scholar]
  40. Morang, A.; Batten, B.K.; Connell, K.J.; Tanner, W.; Larson, M.; Kraus, N.C. Regional Morphology Analysis Package (RMAP), Version 3: Users Guide and Tutorial; Coastal and Hydraulics Engineering Technical Note ERDC/CHL CHETN-XIV-9. U.S. Army Corps of Engineers: Washington, DC, USA, 2009. Available online: http://chl.erdc.usace.army.mil/chetn/ (accessed on 6 June 2010).
  41. Taveira-Pinto, C.A.; Taborda, R.; Andrade, C.; Teixeira, S.B. Seasonal and Mesoscale variations at an Embayed Beach (Armacao De Pera, Portugal). J. Coast. Res. 2009, 25, 118–122. [Google Scholar]
  42. Dorsch, W.; Newland, T.; Tassone, D.; Tymons, S.; Walker, D. A statistical approach to modeling the temporal patterns of ocean storms. J. Coast. Res. 2008, 24, 1430–1438. [Google Scholar] [CrossRef]
  43. Davis, J.C. Statistics and Data Analysis in Geology, 3rd ed.; Wiley and Sons: Chichester, UK, 2002; p. 638. [Google Scholar]
  44. Dolan, R.; Davis, R.E. An intensity scale for Atlantic coast northeast storms. J. Coast. Res. 1992, 8, 352–364. [Google Scholar]
  45. Thomas, T.; Lynch, S.K.; Phillips, M.R.; Williams, A.T. Long-term evolution of a sand spit, physical forcing and links to coastal flooding. Appl. Geogr. 2014, 53, 187–201. [Google Scholar] [CrossRef]
  46. Morton, I.; Bowers, J.; Mould, G. Estimating return period wave heights and winds speeds using a seasonal point process model. Coast. Eng. 1997, 26, 251–270. [Google Scholar] [CrossRef]
  47. Rangel, N.; Anfuso, G. Winter wave climate, storms and regional cycles: The SW Spanish Atlantic coast. Int. J. Climatol. 2013, 33, 2142–2156. [Google Scholar] [CrossRef]
  48. Jenks, G.F.; Caspal, F.C. Error on choropletic maps: Definition, measurement, reduction. Ann. Assoc. Am. Geogr. 1971, 61, 217–244. [Google Scholar] [CrossRef]
  49. Thomas, T.; Phillips, M.R.; Williams, A.T.; Jenkins, R.E. Rotation on two adjacent open coast macrotidal beaches. Appl. Geogr. 2012, 35, 363–376. [Google Scholar] [CrossRef]
  50. Carter, D.J.T.; Draper, L. Has the north-east Atlantic become rougher? Nature 1988, 332, 494. [Google Scholar] [CrossRef]
  51. Bacon, S.; Carter, D.J.T. A connection between mean wave height and atmospheric pressure gradient in the North Atlantic. International. J. Climatol. 1993, 13, 423–436. [Google Scholar] [CrossRef]
  52. Allan, J.C.; Komar, P.D. Are ocean wave heights increasing in the eastern North Pacific? EOS 2000, 47, 561–567. [Google Scholar] [CrossRef]
  53. Moritz, H.; Moritz, H. Evaluating extreme storm power and potential implications to coastal infrastructure damage, Oregon Coast USA. In Proceedings of the 9th International Workshop on Wave Hindcasting and Forecasting, Victoria, BC, Canada, 24–29 September 2006.
  54. Mendoza, E.T.; Jimenez, J.A. Coastal storm classification on the Catalan littoral (NW Mediterranean). Ing. Hidrául. Méx. 2008, 23, 23–34. [Google Scholar]
  55. Rangel-Buitrago, N.; Anfuso, G. Coastal storm characterization and morphological impacts on sandy coasts. Earth Surf. Processes Landf. 2011, 36, 1997–2010. [Google Scholar] [CrossRef]

