Article

Study on Wear Characteristics of a Guide Vane Centrifugal Pump Based on CFD–DEM

1
Research Center of Fluid Machinery Engineering and Technology, Jiangsu University, Zhenjiang 212013, China
2
Wenling Fluid Machinery Technology Institute of Jiangsu University, Wenling 317500, China
*
Author to whom correspondence should be addressed.
J. Mar. Sci. Eng. 2024, 12(4), 593; https://doi.org/10.3390/jmse12040593
Submission received: 7 March 2024 / Revised: 27 March 2024 / Accepted: 28 March 2024 / Published: 29 March 2024
(This article belongs to the Special Issue Advances in Marine Applications of Computational Fluid Dynamics)

Abstract

:
Guide vane submersible centrifugal pumps are a kind of submersible pump, and the fluid inside the pump is often mixed with gravel and other impurities during operation, affecting the pump’s operating efficiency and life expectancy. However, past studies on solid–liquid two-phase flow (STF) and wear characteristics in guided vane centrifugal pumps have been limited to the particle trajectory and wear region distribution. These studies have lacked research on the effect of particles on the fluid flow and the specific amount of wear on the overflow components. Additionally, most of them have used the DPM discrete-phase model, which does not consider the particle–particle and particle–wall interactions. This paper is based on the CFD–DEM method, combined with the Archard wear model. A solid–liquid two-phase flow simulation is carried out for pumps with different particle sizes and particle shapes to analyze the particle movement inside the pump, the wear distribution and average wear amount of the overflow components, and the effect of particles on the turbulent kinetic energy of the fluid. The results show that the particles mainly collide with the leading and trailing edges of the impeller blades and the leading edge of the guide vane blades and form a buildup at the trailing edge of the concave surface of the guide vane blades, resulting in the wear being mainly distributed in these regions. With an increase in particle size and a decrease in sphericity, the average wear on the overflow components increases. The change of particle size directly affects the resistance of the fluid and the structure of the flow field, which has a large impact on the fluid flow pattern and generates large turbulent kinetic energy fluctuations. The shape of the particles only changes the structure of the local flow field, which has a small impact on the fluid flow pattern.

1. Introduction

Submersible-guided vane centrifugal pumps are widely applied in energy extraction and emergency drainage in mountainous areas because of their large flow rate and small size. In recent years, research on the optimization and internal flow characteristics of guide vane centrifugal pumps has been relatively mature. Cao et al. [1] took a guide vane centrifugal pump as the research object, optimized it through the response surface method, and studied the internal energy loss characteristics of the pump. Chen et al. [2] studied the effect of the radial position of a guide vane on submersible pumps and found that the radial position of the guide vane will have a large impact on the hydraulic performance of the pump, and the appropriate radial position of the guide vane possesses a stronger energy conversion capability and a smaller energy loss. However, solid particles, such as sand, gravel, and other solid particles, in the conveying medium collide with the pump’s overflow parts when the pump is running, causing wear and tear of the overflow parts and affecting the pump’s performance and life. Therefore, the internal solid–liquid two-phase flow (STF) of the guide vane centrifugal submersible pump and the wear and tear of the overflow parts cannot be ignored. Cao and Zhang et al. [3] conducted an analysis of solid–liquid two-phase flow and wear characteristics inside multi-stage guide vane centrifugal pumps based on the DPM model and SST k-ω turbulence model. It was found that the wear area mainly concentrated on the leading edge and working surface of the impeller blades, with the first-stage impeller and guide vane experiencing the most significant wear. As the flow rate increased, the degree of wear on the flow components gradually deepened. Zhang et al. [4] studied the internal STF and wear characteristics of a two-stage guide vane centrifugal pump based on the DPM model and RNG k-ε turbulence model. It was found that with the increase of particle concentration, both the head and efficiency of the pump decreased. The leading edge of the impeller blades and the trailing edge of the guide vanes were identified as the main areas where wear occurred.
The interactions of particle–particle, particle–fluid, and particle–wall are widely taken into account during the simulation of STF. Currently, there are two main methods for two-phase flow simulation, the Eulerian–Eulerian Method and the Eulerian–Lagrangian method.
In the Eulerian–Eulerian method, each phase is described as a continuous medium whose motion and properties are described by macroscopic fields within a local macroscopic coordinate system. It is applicable in cases where the particle concentration is high and the particles have a significant effect relative to the fluid, in which the volume fraction of the particles is high and the interaction between the particles and the fluid is strong. Relatively typical models are the mixture uniform-flow model [5] and the two-fluid model [6].
In the Eulerian–Lagrangian method, the fluid phase is described by the Eulerian method, and the particle phase is described by the Lagrangian method. The particles are viewed as discrete granular entities; each particle has its state of motion and is not seen as a continuous fluid medium. This approach is suitable for cases where the particle concentration is low and the interaction between the particles and the fluid is small. It is more fitting for describing the individual motion of the particles in the fluid and can be applied more accurately in modeling the interaction between the particles and the fluid, which is more appropriate for the practical situation in this paper. The typical methods are the discrete element method (DEM) and discrete phase model (DPM). The motion of each particle and the collision process between particles by either the hard-sphere model or the soft-sphere model (usually the soft-sphere model is used) have been taken into account in the DEM model compared to the DPM model. The DEM model was first proposed by American scholars Cundall et al. [7,8] in 1971. With the improvement of computer technology, the complexity and computational scale of the DEM model have increased, enabling it to handle larger and more realistic particle systems and gradually being applied in fields such as mining, civil engineering, and biomedical engineering. M. Afkhami et al. [9] used the CFD–DEM coupling method (CDCM) to study particle motion under turbulence in a pipeline and found that high-intensity turbulence enhances particle–particle interactions. Fries et al. [10] simulated the particle distribution pattern inside three kinds of fluidized bed granulators in detail based on CFD–DEM and selected the granulator that meets the product requirements based on the evaluation criteria, such as particle velocity, collision frequency, etc. Deb et al. [11] investigated the interaction between jets and the flow characteristics in a fluidized bed with multiple jets based on the CDCM, and the DEM calculation results show that 2D simulation can well model the jet tendency of the jets, while the specific bubble motion requires full-size 3D simulation. Wang and Shirazi [12] developed a wear prediction model for predicting the wear of 90-degree elbows and bends based on the CFD–DEM model, and derived the effect of the bend radius on the wear of the long radius bends. Zhang et al. [13] calculated the motion and wear of large particles inside the bent pipe using an improved CFD–DEM model and compared it with the classical experiments conducted by Vlasak et al. [14]. It was found that the maximum error between the two was within 20%. Varga [15] used the CDCM to investigate the wear situation inside a section of the feed pipe, and found that the simulation results of the severely worn areas were generally consistent with the experimental results. In recent years, the coupled CFD–DEM approach has been used to study the flow of particles in complex flow fields in pumps. Su et al. [16] investigated the motion characteristics of coarse particles in deep-sea mining pumps by the CDCM and SST k-ω turbulence model. The article studied the motion law of particles inside the pump. Wang et al. [17] investigated the motion law of particles with different particle sizes in slurry pumps by the CDCM and RNG k-ε turbulence model. It was discovered that when the particle size was small, the particles had less effect on the pump’s hydraulics, and the particle velocity increases with the increase of particle size, obviously strengthening the vortex phenomenon inside the guide vane. Tang et al. [18,19] investigated the effect of particles with different sphericity on the wear characteristics of centrifugal pumps by the CDCM and RNG k-ε turbulence model. It was found that the wear rate steadily increases with the increase of sphericity, and the volute has always been the main occurrence area of the wear. Zhao et al. [20] modified the lift-off force in the CFD–DEM model and studied the wear of centrifugal pump hydraulic components by particle materiality parameters and the particle motion law based on the E/CRC wear model and RNG k-ε turbulence model. Liu et al. [21] investigated the effect of the change of impeller blade wrap angle on the wear characteristics of the centrifugal pump based on the CFD–DEM algorithm and RNG k-ε turbulence model. It was found that the wall wear is most serious when the blade wrap angle is 110°. In conclusion, the accuracy of the CDCM in solving the STF problems inside pumps is proven. The SST k-ω model and RNG k-ε model are turbulence models commonly used in the study of solid–liquid two-phase flow inside pumps. Although researchers have begun to apply the CDCM to pump studies, research on STF inside guide vane centrifugal pumps based on the CDCM remains limited. The STF flow studies of guide vane centrifugal pumps still mostly use the DPM discrete phase model, which cannot take into account the collision effects of particle–particle and particle–wall. In the previous CFD–DEM coupling method for pump research, researchers have only focused on the particle trajectory and wear region distribution; these studies lack examination of particle impact on fluid flow and specific wear analysis. To investigate the solid–liquid two-phase flow characteristics and wear characteristics inside the guide vane centrifugal pump, this paper takes the existing centrifugal pump as the object and, based on the CFD–DEM coupling method, the Archard wear model, and the particle motion law inside the pump, the turbulent kinetic energy characteristics of the fluid, the wear distribution of the overflow parts, and the average wear amount are investigated. The variation of the characteristics above is further investigated with particle size and particle shape as variables. This paper contributes to the research on STF and wear characteristics of guided vane centrifugal pumps.

2. Computational Model and Numerical Method

2.1. Physical Model

The subject of this paper is the WQ200-28-22 guided vane centrifugal pump (Jining Antai Mining Equipment Manufacturing Co., Ltd., Jining City, China), with design flow Qd = 200 m3/h, design head Hd = 28 m, design speed n = 3000 r/min, and specific speed ns = 55. The main components include the following: submersible motor, centrifugal impeller, spatial guide vane, etc., as shown in Figure 1. The primary hydraulic dimensions are presented in Table 1.

2.2. Computational Region and Grid Division

The simulated water body portion of the research object of this paper was simplified into five parts, as shown in Figure 2a. Mesh generation is a critical step in numerical simulation, and a high-quality mesh can improve the precision and accuracy, as well as the computational efficiency of the numerical simulation. In this paper, the structured mesh is used for meshing, and the boundary layer mesh is encrypted appropriately, with the mesh quality reaching more than 0.31. The mesh division is shown in Figure 2b.
The number of grids has an impact on the simulation results. The results of the grid-independence validation are shown in Table 2. After the number of grids reaches 4.1 million, the changes in head and efficiency are relatively small. Considering the accuracy of the calculations and the burden brought by the number of grids for the numerical calculations, the number of simulation grids of 4.1 million was chosen in this paper, of which the number of inlet pipes, impellers, chambers, guide vanes, and outlet tubes are 222912, 1261033, 107823, 1828758, and 683027, respectively. The average y-plus of the impeller blade is 43.74, and the average y-plus of the guide vane blade is 33.92.

2.3. Calculation Methods and Boundary Conditions

The STF simulation in this paper is based on the software Fluent19 and EDEM2020 for numerical calculation, and due to the limited space for content, only the design flow rate is considered in the simulation analysis of the STF, i.e., the rated flow rate of Qd = 200 m3/h. The SST k-ω turbulence model is adopted. The impeller rotation speed is set to 3000 r/min, and the rest of the computational domain is set as the stationary domain. The inlet and outlet boundary conditions are respectively set as the pressure inlet and mass flow outlet. The particle and wall material property settings in EDEM [12] are shown in Table 3, and a 1% concentration of particles is set to the inlet, i.e., 2 m3/h. The rotational speed of the blades is added to its front and rear covers, and the rotational direction, rotational speeds, and rotational velocities are kept the same as those in Fluent. The Hertz–Mindlin (no slip) model is selected for both interparticle contact calculations and particle–wall contact, and the Archard wear model is used. The non-constant time step in Fluent is set to 5 × 10⁻⁵ s, the total number of steps is 5600, and the convergence accuracy is set to 10−4. The time step in EDEM needs to be smaller than that of Fluent and satisfies the multiplier relationship. In this paper, the time step in EDEM is set to 5 × 10⁻⁶.

2.4. STF Control Equations

Based on Euler’s algorithm, the continuity equation of the liquid phase is as follows:
t α ρ f + α ρ f u = 0
The liquid-phase momentum conservation equation is as follows:
ρ f t α u + α ρ f u u = α P + α μ u + ( u ) T 2 3 u I + ρ f g + F
where u, t, P, and g are the fluid density, fluid velocity vector, time, pressure, and gravitational acceleration, respectively. α is the volume fraction of the fluid phase. In this paper, the simulations adopt the Euler–Lagrange method, so the effect of the particle volume fraction is neglected. α = 1 can be defined, and F denotes the effect of other additional forces.
Based on the Euler–Lagrange method, the EDEM20 software is applied to solve the kinematic law of the granular phase in the pump based on the DEM model, which can describe the relationship between the microscopic and macroscopic properties of the granular matter by taking into account the shapes and properties of individual particles, as well as the forces acting on them. It has been regarded as one of the most promising methods for the study of non-spherical granular systems in recent decades [22]. Since the particle volume fraction in the simulation of this paper is 1%, which is a dilute STF, the solid particle solution equation is thus expressed as follows:
m p d u p d t = F drag   + F g + F v m + F p + F lift + F b + F c
I p d Ω p   d t = T c + T f
mp is the mass of the particle, Ip is the rotational inertia of the particle, Ωp is the angular velocity of the particle, Fc is the particle–particle and particle–wall contact force, Fdrag is the trailing force of the fluid acting on the particle, Flift is the lifting force of the fluid acting on the particle, Fp is the pressure gradient force, Fvm is the virtual mass force, Fg is the gravity force of the particle itself, Fb is the buoyancy force exerted on the particle, Tc is the contact torque, and Tf is the torque caused by the fluid.

2.5. Wear Model

The Archard wear model proposed by Archard [23] in 2004 is used in this paper. This model is used to describe the wear behavior of solid material interactions between friction surfaces, especially during sliding, rolling, grinding, etc. This model is widely used in engineering to quantify the wear rate [24,25]. The basic Archard’s model of wear assumption is that wear is caused by the relative motion that occurs between tiny particles or projections on the contact surfaces, which break up or are stripped off during contact, leading to material loss. The semi-empirical expression for this is as follows:
V o l = K H d n s F n d s
Vol is the wear amount expressed as volume loss (mm3), K is the wear constant, Hdns is the hardness value of the material surface (N∙mm−2), ds is the sliding distance (mm), Fn is the point load (N), and the value [26] of K H d n s   is 1 × 10⁻¹³.
In EDEM, the amount of wear is expressed by the depth (mm), as follows:
d e p t h = V o l / A
where A is the contact area between the particle and the wall surface (mm2).

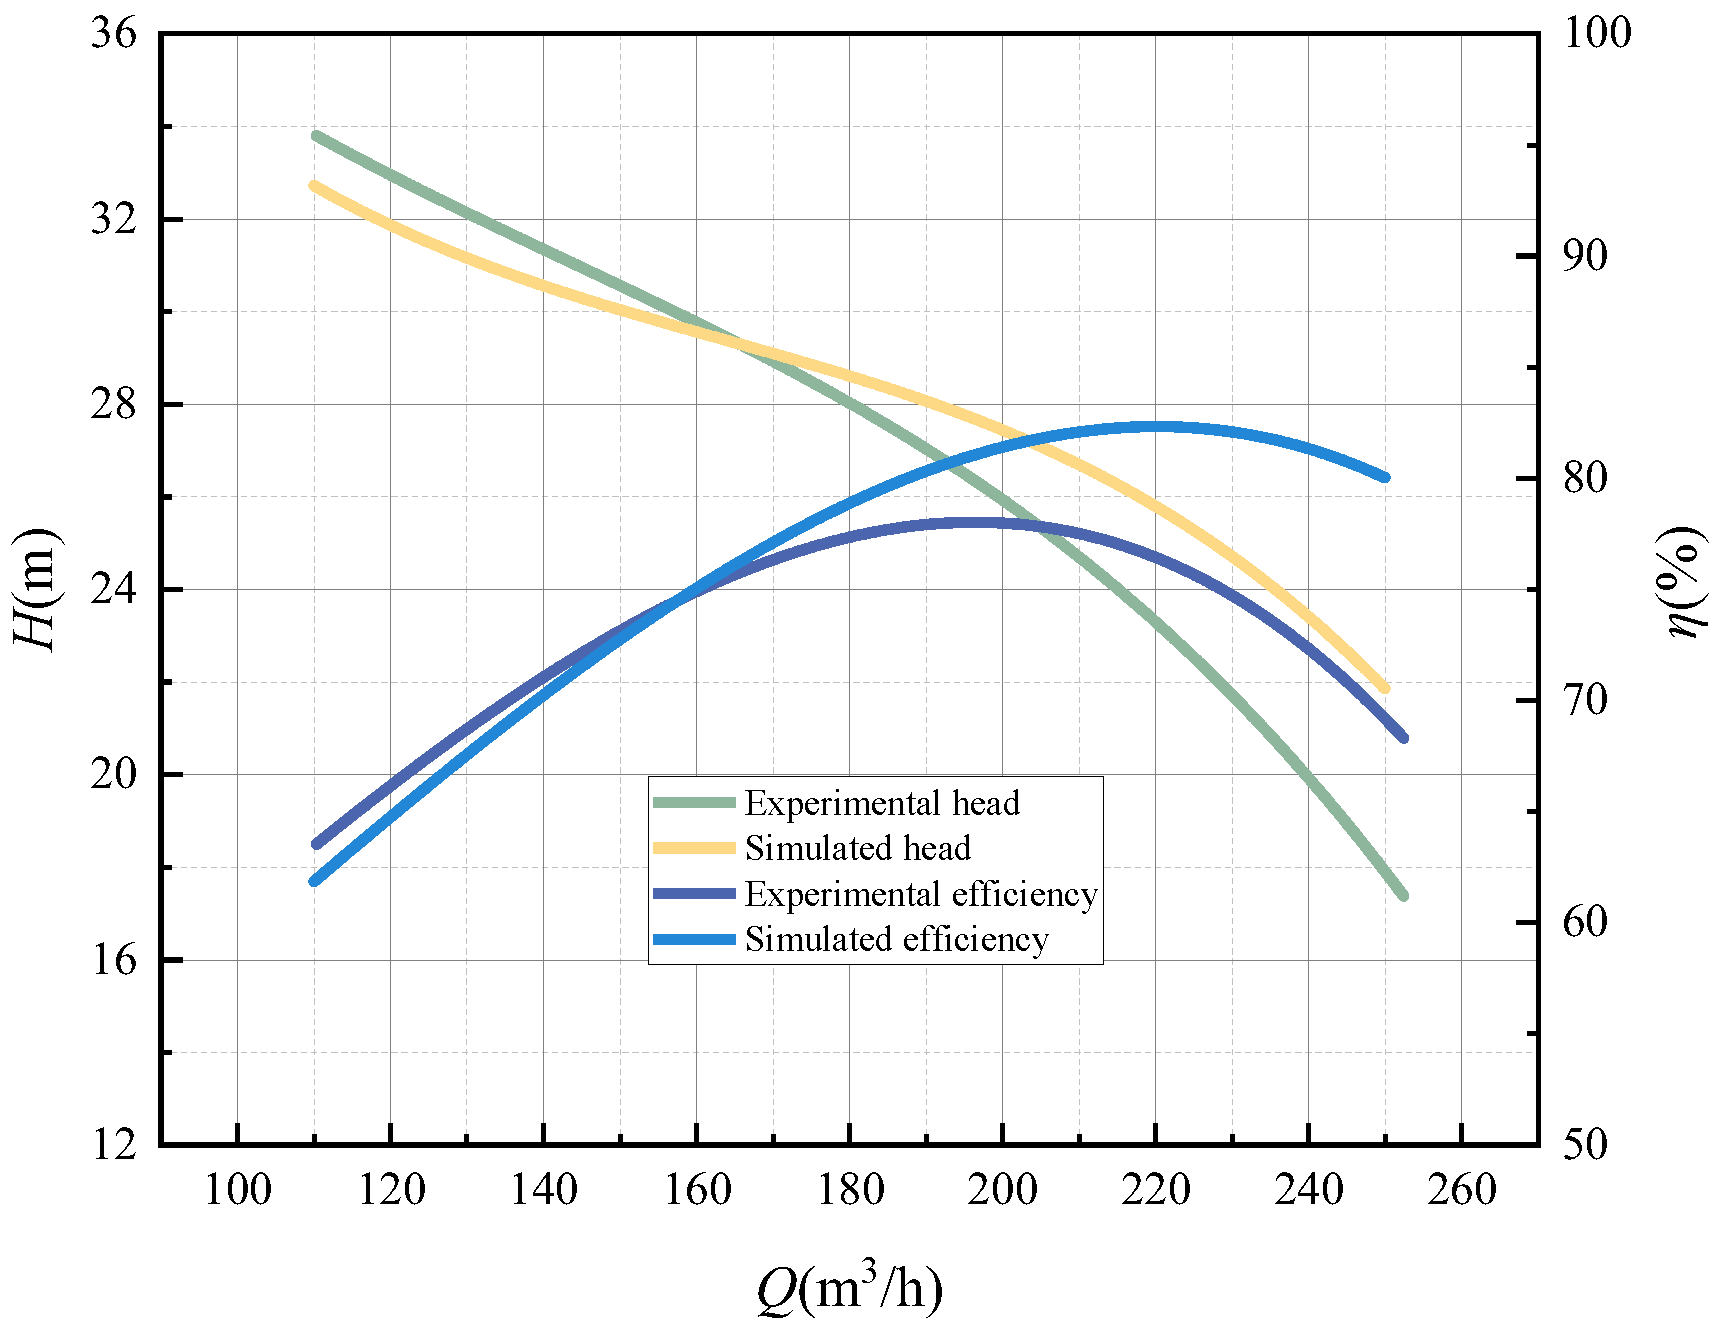
2.6. Comparison of External Properties and Test Results

The tested performance of the pump is carried out. Figure 3 shows that the head error between the simulated and experimental data under the rated operating conditions is about 1.24 m, and the efficiency error is around 3.2%, which are all within the acceptable range of error. More details and analysis of the experiment can be found in the article published by Cao et al. [1].

3. Analysis of Calculation Results
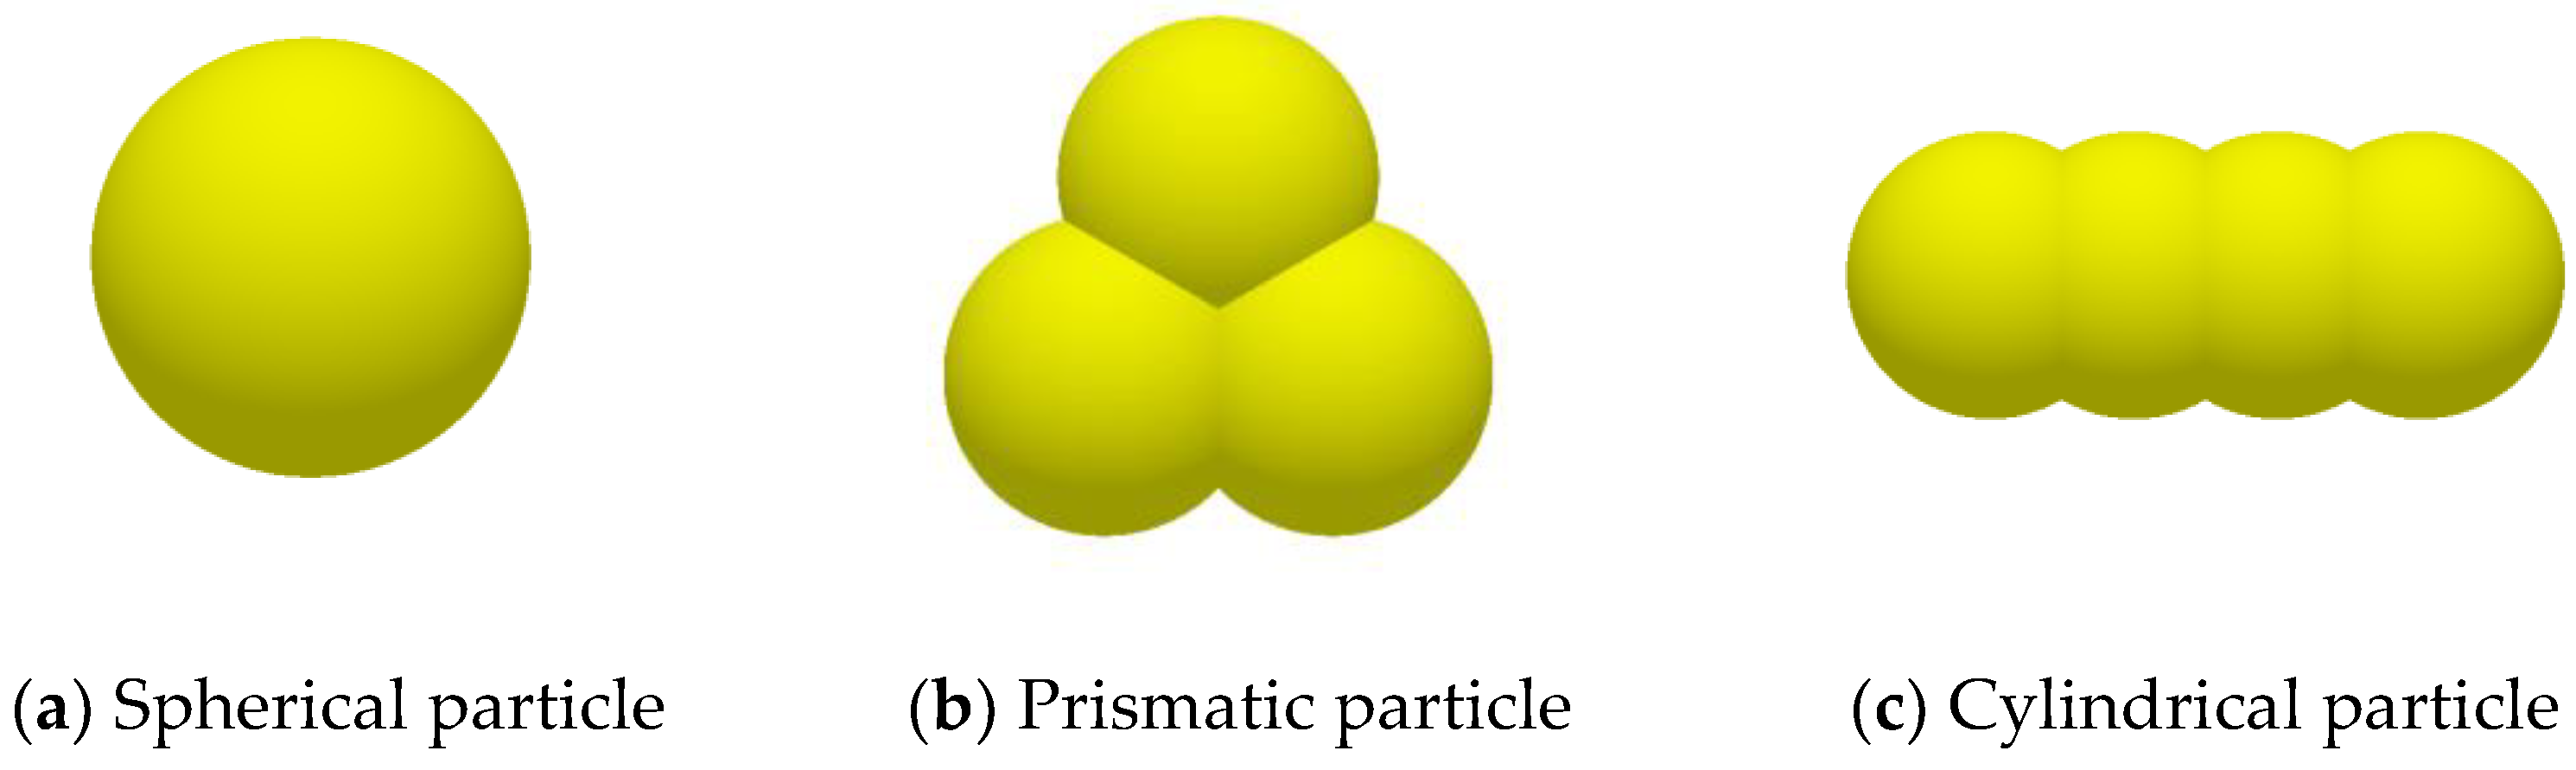
3.1. Particle Model

The numerical simulation of STF is carried out in this paper using the diameter of the spherical particles and the shape of the particles as variables, respectively. In the first case, the particles are spherical particles with diameters of 2 mm, 3 mm, and 4 mm, and in the second case, the particle shapes are spherical, prismatic, and cylindrical according to the built-in material library of the EDEM with the equivalent diameter of 3 mm, respectively. The particle shapes are shown in Figure 4. Particle differences are mainly distinguished by sphericity. The formula is Sp = Ri/Rc, in which Ri is the maximum radius of the inner circle and Rc is the minimum radius of the outer circle. The sphericities of the particles are 1, 0.65, and 0.20.

3.2. Analysis of Simulation Results with Different Particle Sizes

3.2.1. Particle Distribution inside the Pump

Figure 5 indicates the particle distribution of different particle sizes inside the overflow component at 0.28 s, and the particles are colored with velocity. Figure 5a presents the distribution of particles sized 2 mm, the number of which is relatively high, and these particles enter the flow channel after collision with the impeller blade leading edge. In the impeller channel, a tremendous number of particles moving at high speed are suspended in a band-like distribution. Most particles collide with the leading edge of the convex surface of the guide vane blades when entering the guide vane from the cavity, and under the joint action of the reaction force of the wall and the trailing force of the liquid, the particles gather at the concave surfaces and concentrate on the outer edge of the rear half section of the concave surface. The velocity of these particles is generally low. Figure 5b illustrates the distribution of particles sized 3 mm. The particle motion law is similar to that of particles sized 2 mm. Band-like distribution of the particles in the impeller channel still exists, while the reduction in the number of particles leads to the shortening of the particle accumulation band in the guide vane channel. Figure 5c shows the distribution of particles sized 4 mm. As the size becomes larger, the particles in the impeller channel show a certain degree of randomness instead of regular band distribution. In the guide vane flow channel, under the effect of inertia, particles collide with the leading edge of the guide vane blades, forming a shorter accumulation on the concave surfaces. Compared to other conditions, the speed of large-size particles is slower.

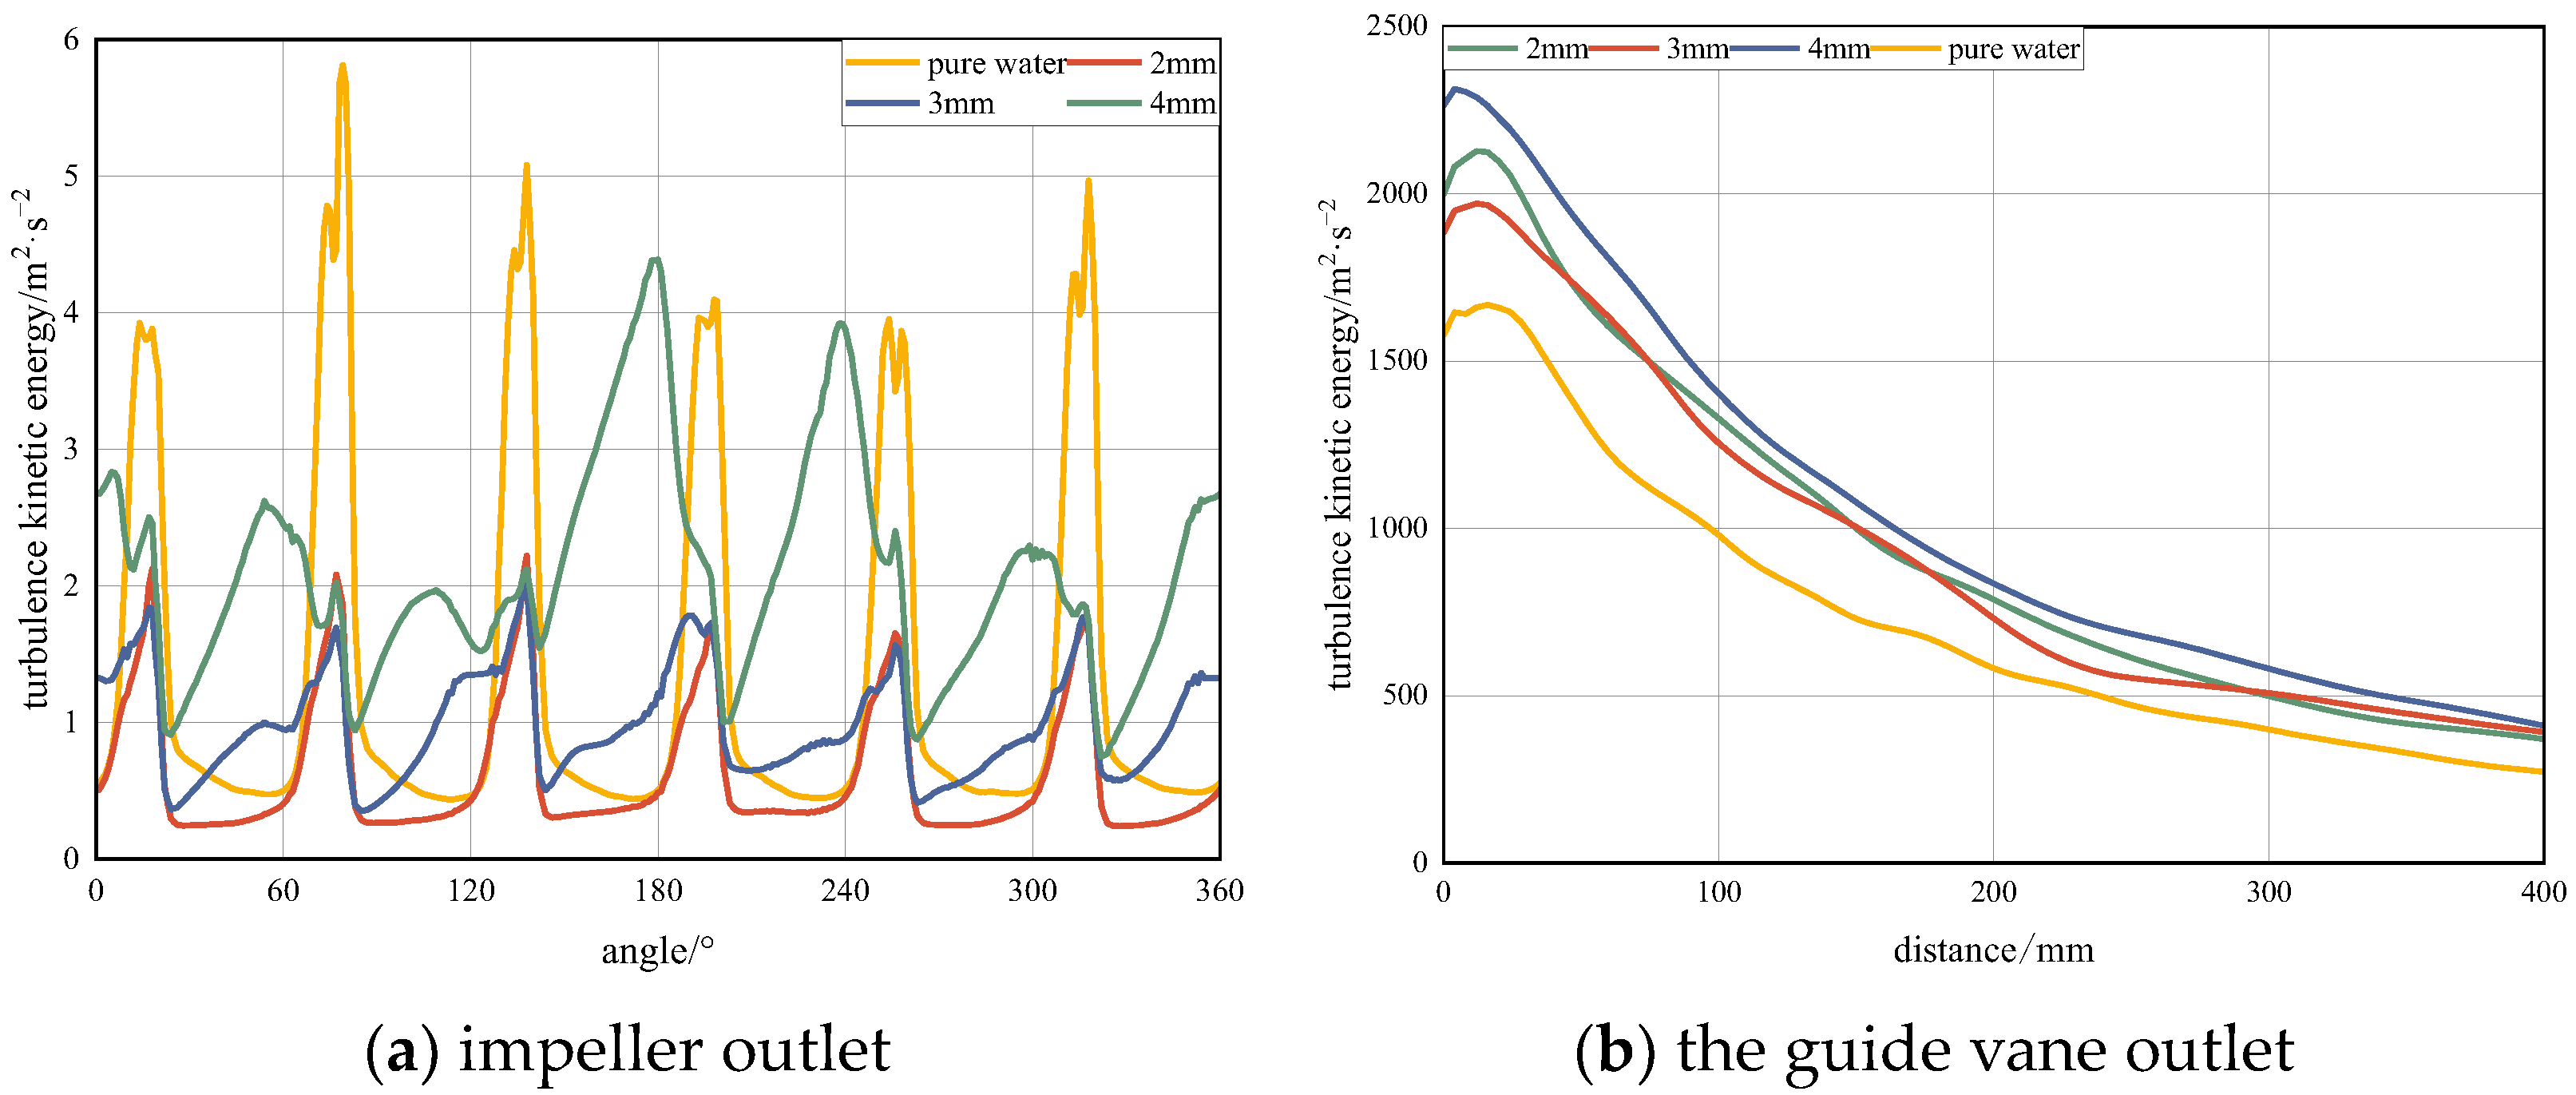
3.2.2. Analysis of Fluid Flow Characteristics in the Pump

Figure 6 shows the pressure distribution and streamline in the main flow passage parts of the guide vane centrifugal pump under the condition of pure water and STF. After analysis, the fluid flow characteristics in the pump under different particle media conditions are similar, with 4 mm spherical particles having the greatest influence on the fluid flow characteristics, so this paper only compares the flow characteristics of the fluid in the pump under clear water conditions and 4 mm spherical particles conditions. The pressure distributions are similar under two kinds of fluids. The pressure rises gradually from the impeller inlet to the guide vane outlet, and the fluid of pure water shows relatively high pressure. This is because solid particles have higher density, resulting in higher gravitational potential energy and velocity energy. The addition of particles to the internal fluid has little influence on the rotating impeller. The fluid flow state changes mainly exist in the cavity part and guide vane outlet. A small vortex forms near the inner part of the cavity and is strengthened by the addition of particles, and the vortex almost diffuses to the outer part of the cavity. There is a slight reflux at the outlet of the guide vane when the fluid is pure water, but under the STF condition, the movement of particles will cause disturbances in the surrounding fluid velocity field and agitate nearby fluid structures. As a result, backflow at the outlet of the guide vanes is intensified and vortices are formed. The internal fluid flow within the guide vanes also becomes more turbulent.

3.2.3. Wear Distribution of Overflow Parts

Figure 7 shows the amount of wear of the blades in the impeller of the guide vane centrifugal pump with various particle sizes at 0.28 s. Figure 7a shows that the blade pressure sides have been worn over a large area, and the distribution of the wear area is regular, which is consistent with the distribution of particles in the flow channel described above. The front edge of the blade pressure sides is the main region of particle collision; however, there are no high-wear areas, which indicates that small particles have less inertia and therefore have a smaller impact on wall surface wear. Figure 7b shows that the wear region formed by particles 3 mm in size on the blade pressure sides also presents a band-like distribution. As the number of particles 3 mm in size decreases compared with that of particles 2 mm in size, the width of the serious wear region decreases. Figure 7c shows that the wear area is randomly distributed on the blade pressure sides, which is due to the further reduction in the number of particles 4 mm in size. At the impeller inlet, the particles collide with the leading edge of the blades, resulting in the abrasion area on the blade suction sides and concentrated in the vicinity of the leading edge of the blades and the front cover plate, and the high abrasion area is enlarged with the increase of the particle size. This phenomenon arises from the fact that larger particles tend to possess greater inertia and kinetic energy, along with experiencing higher frictional forces against the wall surface.
The amount of wear of the blades in the guide vane under different particle sizes at 0.28 s is demonstrated in Figure 8. It can be noticed that the wear area of the blade’s convex surface amplifies with the increase of particle size. Combined with the analysis of particle movement law above, it can be concluded that a larger particle has greater mass and stronger inertia, so it has a stronger collision with the guide vane blade leading edge, resulting in more serious wear. On the concave surface of the guide vane blade, the wear area concentrates in the accumulation zone mentioned above. A small particle has smaller inertia, and it can be more easily affected by liquid drag force distribution at the outer edge of the concave surface. Therefore, the outer edge of the concave surface of the wear area in Figure 8a is a narrow strip. As the particle size increases, particle inertia strengthens, the area contacted by particles increases, the wear area under large particle size further enlarges, and the wear further deepens. From the wear regions of Figure 8b,c, it can be seen that there is a certain limit to the expansion of the wear region, indicating that the main factor affecting particle movement is still the drag force of the fluid. Large particles are also limited in their motion trajectory by fluid drag.

3.2.4. Average Wear of Overflow Components

Figure 9 illustrates the change in the average wear of impeller blades and guide vane blades with time for different particle sizes. Figure 9a shows the variation in the average wear of impeller blades, which indicates that the increase in particle size leads to an increase in the average wear of impeller blades. The average wear of impeller blades from 2 mm particles rises at a fixed rate with time, which is consistent with the regular banding in the middle of the impeller channel of the 2 mm particle distribution in Section 3.2.1. As the particle size grows, the number of particles reduces, and it is illustrated that the high wear region on the blade pressure sides with a particle size of 4 mm shows significant randomness in Section 3.2.3, therefore the growth rate of the average wear under particle size of 4 mm changes relatively. Figure 9b shows the variations in the average wear of the guide vane blade, and the thumbnail shows the changes in the average wear as the particle size is 2 mm and 3 mm. The average wear under these two conditions rises at a fixed rate with a small difference. Under the condition of particle size of 4 mm, the accumulation zone begins to form at the trailing edge of the blade around 0.2 s. At this point, the velocity of large particles decreases, and there is significant friction between them and the wall surface, leading to severe wear in this area. Consequently, the rate of increase in average wear gradually rises.

3.2.5. Analysis of Fluid Energy Loss Characteristics

The addition of particles will affect the fluid flow in the pump. To further analyze the influence of different particles on the fluid energy loss characteristics, the change of turbulent kinetic energy with an angle at the position of Span = 0.5 of the impeller outlet and the change of total turbulent kinetic energy with distance at 0–400 mm of the outlet of guide vane are all selected for analysis. Figure 10 shows the specific analysis position.
Figure 11a depicts the circumferential variation of turbulent kinetic energy at 0.28 s for different particle media at a span of 0.5 from the impeller outlet. It can be seen that the variation of turbulent kinetic energy presents obvious periodicity under the condition of pure water or STF with particle sizes of 2 mm and 3 mm, the period number corresponds to the number of blades, and the maximum amplitude appears at the angle of the blade trailing edge. Compared with the STF, the amplitude of turbulent kinetic energy near the blade trailing edge is higher in pure water flow, which is due to the supplement of fluid from the impeller outlet to the blade trailing edge, forming a blade wake vortex, while the addition of solid particles fills the blade trailing edge region to a certain extent, reducing the vortex at the blade trailing edge. With the increase in particle size, the number of particles decreases, the distribution of particles gradually presents randomness, and the turbulent kinetic energy increases and presents irregular distribution. Although there are still wave crests at the trailing edge of the impeller under STF with a particle size of 4 mm, the larger amplitude mainly appears near the impeller channel, which indicates that the large particles will seriously disturb the fluid movement near the impeller outlet.
Figure 11b suggests the change of turbulence kinetic energy with a distance of the exit of the guide vane at 0.28 s. The turbulence kinetic energy peaks are close to the exit of the guide vane under the condition of pure water or STF with a particle size of 2 mm, 3 mm, and 4 mm, indicating that the fluid near the exit of the guide vane backflow. The total turbulent kinetic energy of the fluid under pure water is the smallest. With the addition of particles, the concave surface of the guide vane would form a particle accumulation zone, which reduces the guiding effect of the guide vane, and the turbulence kinetic energy of the fluid rises as a result. The difference in the turbulence kinetic energy under particle sizes of 2 mm and 3 mm is small, and the turbulence kinetic energy under particle size of 4 mm is larger, which indicates that particles with excessively large diameters disrupt the flow field structure near the particles, enhancing the turbulence intensity of the fluid.

3.3. Analysis of Simulation Results under Different Shapes of Particles

3.3.1. Particle Distribution inside the Pump

Figure 12 indicates the particle distribution of different sizes in the flow passage part at 0.28 s; the particles are colored according to velocity. The distribution law of prismatic particles and cylindrical particles is close to that of 3 mm spherical particles, but there are still differences due to the change of shape. The pile-up zone of prismatic particles at the concave surface of the guide vane is shorter, and the pile-up zone of cylindrical particles is closer to the wall of the guide vane due to its slender shape. In the impeller channel, as the sphericity of particles decreases, the irregularity of particle shapes increases, resulting in a widening of the particle distribution band.

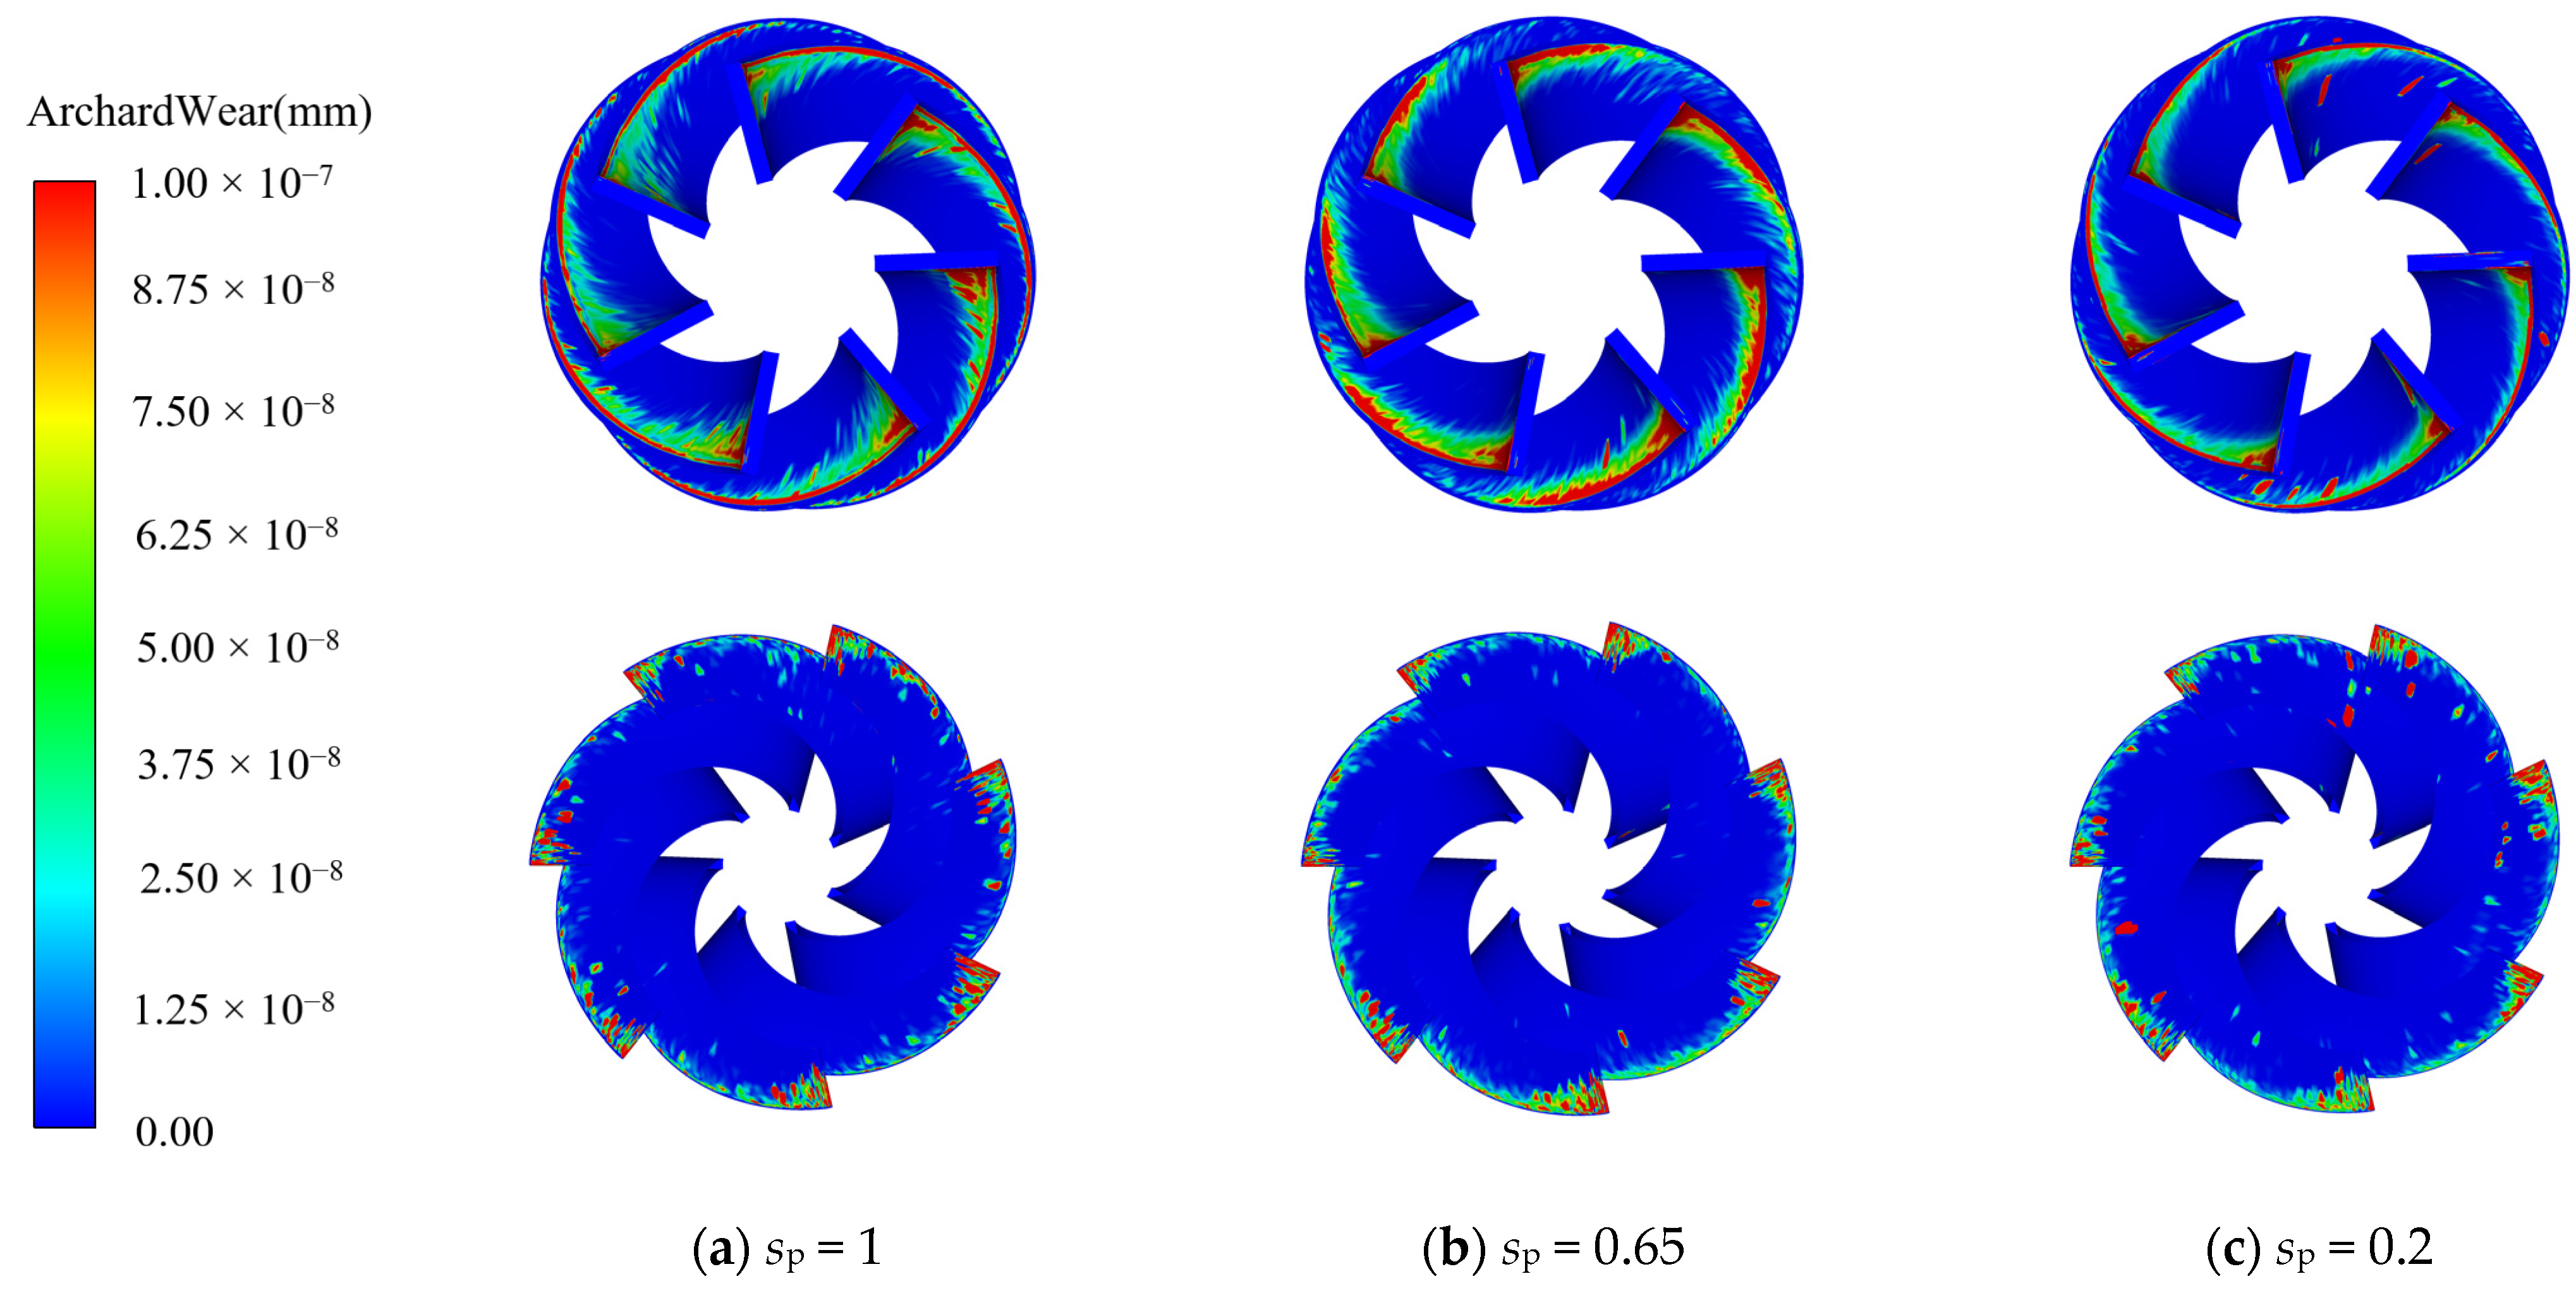
3.3.2. Wear Distribution of Overflow Parts

The wear of the impeller blades of the submersible pump from different shapes of particles at 0.28 s is shown in Figure 13. At the pressure sides of the blade, the high wear area mainly concentrates at the trailing edge of the blades, demonstrating that the trailing edge of the blades is the main part where particles collide with the pressure sides of the blade. Figure 13b,c show that with the decrease of sphericity, the area of high wear gradually expands and a randomly distributed high wear area appears, suggesting that the change of shape leads to irregular movement of particles and deepens the wear degree of the blade surface. This is because particles with lower sphericity have a larger contact area with the wall, and irregular particles collide with the wall, resulting in local stress concentration. At the suction sides of the blade, the high-wear regions of the three particles concentrate near the blade’s leading edge, and the high-wear region is larger under the cylindrical particle condition. There is also a small high-wear area in the middle of the suction sides of the blade, which is often caused by collision with particles at a high speed, and it presents the characteristics of a small area and large randomness due to the bending of the blade. The particles of the three shapes all follow the fluid movement, and the velocity is close to the fluid velocity. Non-spherical particles produce a higher wear area in the suction sides of the blade than spherical particles due to their irregular shape.
Figure 14 illustrates the wear distribution of guide vane blades from different particle shapes at 0.28 s. On the concave surface of blades, Figure 14b shows that the wear at the trailing edge of blades from prismatic particles deepens further than that of spherical particles. As mentioned above, the cylindrical particles distribute closer to the guide vane wall, so the wear band at the concave surface of the guide vane becomes extremely narrow in Figure 14c, and a strip of high-wear area appears in the middle of the concave surface of the blade due to the random distribution of columnar particles. On the blade’s convex surface, the wear area still concentrates on the leading edge of the blade. However, due to the irregular shape of particles, extremely small particles are prone to irregular motion trajectories, resulting in scattered wear areas on other areas of the blade’s convex surface.

3.3.3. Average Wear of Overflow Components

Figure 15 demonstrates the change of average wear of flow passage parts with time from different particle shapes. The order of average wear is cylindrical particle > prismatic particle > spherical particle, impeller blade > guide vane blade. On the one hand, it shows that particles with lower sphericity are more likely to wear wall surfaces, and on the other hand, particle velocity is also an important factor affecting wear. Compared with the two kinds of particles with higher sphericity, the average wear rate of the guide vane blade under cylindrical particles increases continuously, which is due to the gradual accumulation of particles at the concave surface of the guide vane. Particles with lower sphericity will form more complex structures when they accumulate, which increases the friction between particles and the wall surface, thus leading to greater wear.

3.3.4. Analysis of Fluid Energy Loss Characteristics

Figure 16a shows the turbulent kinetic energy change at the impeller outlet at 0.28 s, and Figure 16b shows the turbulent energy change at the guide vane outlet at 0.28 s; the analysis position is the same as shown in Figure 10. Particles entering the impeller reduce the eddies at the trailing edge of the blade at the impeller exit. The turbulent kinetic energy changes from three kinds of particles are similar, which makes clear that the particle shape has little effect on the flow state at the impeller exit. Based on the analysis in Section 3.2.5, it can be concluded that an increase in particle size will occupy a larger space, leading to significant changes in the fluid flow path and velocity distribution, making it easier to disrupt the structure of fluid flow. The change in particle shape only locally changes the flow direction of the fluid near the particle and has a relatively small impact on the fluid flow state. The turbulent kinetic energy peaks of prismatic and cylindrical particles are higher at the exit of the guide vane, which indicates that the accumulation zone will enhance the backflow at the outlet. The curve changes of the three particles are consistent after 50 mm from the outlet of the guide vane.

4. Conclusions

This article details STF simulations of a guide vane centrifugal pump using the CDCM and Archard wear model. In Fluent, the SST k-ω turbulence model is selected, with the inlet boundary condition set as the pressure inlet with a reference pressure of 1 atm. The outlet boundary is set as the mass flow outlet, with a mass flow rate of 55 kg/s. In EDEM, the inlet is set with a particle concentration of 1%, equivalent to 2 m3/h. The physical parameters of the particles and pump body materials can be found in Table 3. The analysis covered the motion patterns, wear distribution, and the variation of average wear with time of particles inside the pump from different particle sizes and shapes, leading to the following conclusions:
  • Particle collisions inside the impeller mainly appear at the leading edge of the suction sides and the trailing edge of the pressure sides of the blade. The particles will be distributed in the middle of the flow passage in a band. The more particles there are, the wider the distribution bandwidth. The particles inside the guide vane mainly collide with the convex leading edge of the blade and accumulate in the concave area of the blade. The particles mainly affect the fluid flow in the cavity and the exit of the guide vane and intensify the turbulence in the two regions.
  • The wear on the impeller blade is mainly concentrated in the area where the front and rear edges of the blade collide with the particles, while a part of the wear distribution lies in the middle of the suction sides of the blade. The wear on the guide vane blade is mainly accumulated at the front edge of the blade and the concave surface of the blade.
  • Large particles have greater inertia and kinetic energy. Particles with low sphericity have a large contact area with the wall and are prone to local stress concentration when colliding with the wall. Therefore, with the decrease in particle sphericity and the increase in particle size, the area of wear within the flow passage increases, and the degree of wear deepens. The wear degree of the impeller blades is much greater than that of the guide vane blades, as the impeller is a rotating component. The wear amount at the guide vanes varies significantly under conditions of large particles and low-sphericity particles. This is mainly due to the slow movement of large particles in the accumulation zone and the structural changes in the accumulation zone caused by low-sphericity particles.
  • The addition of particles would abate the trailing edge vortex at the impeller outlet. Large particles can damage the surrounding fluid flow structure, increase the turbulent kinetic energy at the impeller outlet and guide vane outlet, and make the fluid flow more turbulent. The change in particle shape only affects the local fluid structure near the particles, with a relatively small impact on fluid turbulence. Only the backflow at the exit of the guide vanes is affected by particles with lower sphericity.

Author Contributions

Conceptualization, W.C.; methodology, W.C. and H.W.; software, H.W. and J.T.; formal analysis, H.W.; writing—original draft preparation, H.W.; writing—review and editing, W.C. and J.T.; supervision, W.C.; investigation (performing the experiments), W.C. and H.W. All the authors have read and agreed to the published version of the manuscript. All authors have read and agreed to the published version of the manuscript.

Funding

This work was supported by the Jiangsu Provincial Key Research and Development Program (Grant No. BE2020330, Research on Key Technologies of Intelligent and Efficient Agricultural Irrigation Variable Frequency Lift Pumps).

Institutional Review Board Statement

Not applicable.

Informed Consent Statement

Not applicable.

Data Availability Statement

Data are contained within the article.

Conflicts of Interest

The authors declare no conflicts of interest.

References

  1. Cao, W.; Wang, H.; Yang, X.; Leng, X. Optimization of Guide Vane Centrifugal Pumps Based on Response Surface Methodology and Study of Internal Flow Characteristics. J. Mar. Sci. Eng. 2023, 11, 1917. [Google Scholar] [CrossRef]
  2. Xiaorui, C.; Xuelian, Z.; Boru, L.; He, L. Influence of radial position of guide vane on submersible well pump performance. J. Drain. Irrig. Mach. Eng. 2019, 37, 848–854. [Google Scholar]
  3. Cao, W.; Zhang, Y.; Mao, J.; Cheng, Y.; Zhang, L. Solid-liquid two-phase flow and wear characteristics of high-speed multi-stage deep-well pumps. J. Drain. Irrig. Mach. Eng. 2023, 41, 433–439. [Google Scholar]
  4. Yongxue, Z.; Jiayu, S.; Ziwei, Q.; Zhiyi, Y. Study on Erosion and Wear of Submersible Pumps for Geothermal Wells. J. Drain. Irrig. Mach. Eng. 2023, 09, 1–7. [Google Scholar]
  5. Manninen, M.; Taivassalo, V.; Kallio, S. On the Mixture Model for Multiphase Flow; Technical Research Centre of Finland: Espoo, Finland, 1996. [Google Scholar]
  6. Gidaspow, D. Multiphase Flow and Fluidization: Continuum and Kinetic Theory Descriptions; Academic Press: Cambridge, MA, USA, 1994. [Google Scholar]
  7. Cundall, P.A.; Strack, O.D. A discrete numerical model for granular assemblies. Geotechnique 1979, 29, 47–65. [Google Scholar] [CrossRef]
  8. Lorig, L.J.; Brady, B.H.G.; Cundall, P.A. Hybrid distinct element-boundary element analysis of jointed rock. Int. J. Rock Mech. Min. Sci. Geomech. Abstr. 1986, 23, 303–312. [Google Scholar] [CrossRef]
  9. Afkhami, M.; Hassanpour, A.; Fairweather, M.; Njobuenwu, D.O. Fully coupled LES-DEM of particle interaction and agglomeration in a turbulent channel flow. Comput. Chem. Eng. 2015, 78, 24–38. [Google Scholar] [CrossRef]
  10. Fries, L.; Antonyuk, S.; Heinrich, S.; Dopfer, D.; Palzer, S. Collision dynamics in fluidised bed granulators: A DEM-CFD study. Chem. Eng. Sci. 2013, 86, 108–123. [Google Scholar] [CrossRef]
  11. Deb, S.; Tafti, D.K. Two and three dimensional modeling of fluidized bed with multiple jets in a DEM–CFD framework. Particuology 2014, 16, 19–28. [Google Scholar] [CrossRef]
  12. Wang, J.; Shirazi, S.A. A CFD Based Correlation for Erosion Factor for Long-Radius Elbows and Bends. J. Energy Resour. Technol. 2003, 125, 26–34. [Google Scholar] [CrossRef]
  13. Zhang, Y.-H.; Wang, X.-J.; Zhang, X.-Z.; Saad, M.; Zhao, R.-J. Numerical Investigation of the Impacts of Large Particles on the Turbulent Flow and Surface Wear in Series-Connected Bends. J. Mar. Sci. Eng. 2024, 12, 164. [Google Scholar] [CrossRef]
  14. Vlasak, P.; Chara, Z.; Konfrst, J.; Krupička, J. Experimental investigation of coarse particle conveying in pipes. EPJ Web Conf. 2015, 92, 02111. [Google Scholar] [CrossRef]
  15. Varga, M.; Goniva, C.; Adam, K.; Badisch, E. Combined experimental and numerical approach for wear prediction in feed pipes. Tribol. Int. 2013, 65, 200–206. [Google Scholar] [CrossRef]
  16. Su, X.; Tang, Z.; Li, Y.; Zhu, Z.; Mianowicz, K.; Balaz, P. Research of Particle Motion in a Two-Stage Slurry Transport Pump for Deep-Ocean Mining by the CFD-DEM Method. Energies 2020, 13, 6711. [Google Scholar] [CrossRef]
  17. Wang, R.; Guan, Y.; Jin, X.; Tang, Z.; Zhu, Z.; Su, X. Impact of Particle Sizes on Flow Characteristics of Slurry Pump for Deep-Sea Mining. Shock Vib. 2021, 2021, 6684944. [Google Scholar] [CrossRef]
  18. Tang, C.; Yang, Y.-C.; Liu, P.-Z.; Kim, Y.-J. Prediction of Abrasive and Impact Wear Due to Multi-Shaped Particles in a Centrifugal Pump via CFD-DEM Coupling Method. Energies 2021, 14, 2391. [Google Scholar] [CrossRef]
  19. Tang, C.; Kim, Y.-J. CFD-DEM Simulation for the Distribution and Motion Feature of Solid Particles in Single-Channel Pump. Energies 2020, 13, 4988. [Google Scholar] [CrossRef]
  20. Zhao, R.-J.; Zhao, Y.-L.; Zhang, D.-S.; Li, Y.; Geng, L.-L. Numerical Investigation of the Characteristics of Erosion in a Centrifugal Pump for Transporting Dilute Particle-Laden Flows. J. Mar. Sci. Eng. 2021, 9, 961. [Google Scholar] [CrossRef]
  21. Dong, L.; Kai, H.; Zijian, N.; Song, Y.; Baojian, Y. Effects of blade wrap angle on hydraulic performance and erosion characteristics of centrifugal pump. J. Drain. Irrig. Mach. Eng. 2022, 40, 973–980. [Google Scholar]
  22. Zhong, W.; Yu, A.; Liu, X.; Tong, Z.; Zhang, H. DEM/CFD-DEM Modelling of Non-spherical Particulate Systems: Theoretical Developments and Applications. Powder Technol. 2016, 302, 108–152. [Google Scholar] [CrossRef]
  23. Archard, J.F. Contact and Rubbing of Flat Surfaces. J. Appl. Phys. 1953, 24, 981–988. [Google Scholar] [CrossRef]
  24. Flores, P. Modeling and simulation of wear in revolute clearance joints in multibody systems. Mech. Mach. Theory 2009, 44, 1211–1222. [Google Scholar] [CrossRef]
  25. Enblom, R.; Berg, M. Simulation of railway wheel profile development due to wear—Influence of disc braking and contact environment. Wear 2005, 258, 1055–1063. [Google Scholar] [CrossRef]
  26. Chen, G.; Schott, D.L.; Lodewijks, G. Sensitivity analysis of DEM prediction for sliding wear by single iron ore particle. Eng. Comput. 2017, 34, 2031–2053. [Google Scholar] [CrossRef]
Figure 1. Structure of the pump.
Jmse 12 00593 g001
Figure 2. Simulation domain and grid division of the water body.
Jmse 12 00593 g002aJmse 12 00593 g002b
Figure 3. Comparison of external characteristic curves.
Jmse 12 00593 g003
Figure 4. Particle shape.
Jmse 12 00593 g004
Figure 5. Distribution patterns of particles with different particle sizes.
Jmse 12 00593 g005
Figure 6. Streamline and pressure distribution on the intermediate shaft surface.
Jmse 12 00593 g006
Figure 7. Wear distribution on impeller blades of different particle sizes.
Jmse 12 00593 g007
Figure 8. Wear distribution on guide vane of different particle sizes.
Jmse 12 00593 g008
Figure 9. Average wear of blades from different particle sizes.
Jmse 12 00593 g009
Figure 10. Analysis position of the change of turbulent kinetic energy.
Jmse 12 00593 g010
Figure 11. Changes of turbulent kinetic energy from different particle sizes.
Jmse 12 00593 g011
Figure 12. Particle distribution patterns of different shapes of particles.
Jmse 12 00593 g012
Figure 13. Wear of impeller blades from different shapes of particles.
Jmse 12 00593 g013
Figure 14. Wear of guide vane blades from different shapes of particles.
Jmse 12 00593 g014
Figure 15. Average wear of blades from different-shaped particles.
Jmse 12 00593 g015
Figure 16. Changes of turbulent kinetic energy from different-shaped particles.
Jmse 12 00593 g016
Table 1. Main geometric parameters of guide vane centrifugal pump.
Impeller Guide Vane
Inlet diameterDj (mm)120Inlet widthb3 (mm)28.83
Outlet diameterD2 (mm)167Outlet diameterD4 (mm)150
Outlet widthb2 (mm)32Hub diameterDh1 (mm)60
Hub diameterDh (mm)46Axial lengthL (mm)136.6
Number of bladesZ16Number of bladesZ27
Table 2. Verification of mesh independence.
Serial NumberGrid NumberHead (m)Efficiency (%)
1231610226.828180.74
2273690426.827980.80
3321472427.023980.98
4410355327.212781.24
5481930327.253581.41
Table 3. Material properties and contact parameters.
ParametersParticleWall
Density (kg/m3)25007700
Poisson’s ratio0.360.282
Shear modulus (Pa)1 × 1081 × 1010
Particle-particle/wall collision recovery coefficient0.280.59
Particle-particle/wall static friction coefficient0.490.67
Particle-particle/wall rolling friction coefficient0.240.13
Disclaimer/Publisher’s Note: The statements, opinions and data contained in all publications are solely those of the individual author(s) and contributor(s) and not of MDPI and/or the editor(s). MDPI and/or the editor(s) disclaim responsibility for any injury to people or property resulting from any ideas, methods, instructions or products referred to in the content.

