Article

Analyses of the Suction Anchor–Sandy Soil Interactions under Slidable Pulling Action Using DEM-FEM Coupling Method: The Interface Friction Effect

1
Key Laboratory of Rock Mechanics and Geohazards of Zhejiang Province, Shaoxing University, Shaoxing 312000, China
2
Department of Civil and Environmental Engineering, The Hong Kong Polytechnic University, Hung Hom, Kowloon, Hong Kong, China
3
Jinghe New City of Xixian New Area Real Estate Development Co., Ltd., Xi’an 713700, China
*
Author to whom correspondence should be addressed.
J. Mar. Sci. Eng. 2024, 12(4), 535; https://doi.org/10.3390/jmse12040535
Submission received: 1 March 2024 / Revised: 21 March 2024 / Accepted: 22 March 2024 / Published: 24 March 2024
(This article belongs to the Special Issue Advance in Marine Geotechnical Engineering)

Abstract

:
The microscale mechanisms underlying the suction anchor–sandy soil interaction under slidable pulling actions of mooring lines remain poorly understood. This technical note addresses this knowledge gap by investigating the suction anchor–sandy soil interaction from micro to macro, with a particular emphasis on the effect of interface friction. The discrete element method (DEM) was utilized to simulate the sandy soil, while the finite element method (FEM) was employed to model the suction anchors. The peak pulling forces in numerical simulations were verified by centrifuge test results. The research findings highlight the significant influence of interface friction on the pulling force–displacement curves, as it affects the patterns of suction anchor–sandy soil interactions. Furthermore, clear relationships were established between the magnitude of interface friction, rotation angle, and pullout displacement of suction anchors. By examining the macro-to-micro behaviors of suction anchor–sandy soil interactions, this study concludes with a comprehensive understanding of failure patterns and their key characteristics under different interface friction conditions. The findings proved that the interface friction not only influences the anti-pullout capacity but also changes the failure patterns of suction anchor–soil interactions in marine engineering.

1. Introduction

With the rapid development in marine engineering, suction anchor foundations have gained increasing popularity for anchoring floating buildings and structures in the sea [1,2]. These anchor foundations, consisting of cylinder suction anchors and mooring line systems, are commonly connected to floating buildings and structures using the mooring lines that are attached to the annular pad eyes [3,4], as displayed in Figure 1a,b. Throughout the lifespan of floating buildings and structures, the suction anchor and the surrounding soil experience significant pulling forces from mooring lines to ensure engineering safety [5,6]. Therefore, comprehending suction anchor–soil interactions is essential for the design of suction anchor foundations in marine engineering.
Suction anchor–soil interactions in marine engineering have garnered significant attention in previous studies. Researchers have carried out a sequence of experimental tests to examine the anti-pullout capacity of suction anchors and explore the correlation between pulling forces and the displacement of suction anchors in granular soil [7,8]. Experiment test results have demonstrated that various factors, including pulling directions of mooring lines, towing positions, and soil properties, affect the anti-pullout capacity of the suction anchors, while interface friction between suction anchors and surrounding soils plays a critical role in determining the behavior of interactions between suction anchors and soil [9,10]. Nevertheless, prior studies on suction anchor–soil interactions primarily focused on evaluating the resistance to pullout and the displacements of suction anchors. As a result, the microscale mechanisms of suction anchor–soil interactions under different interface friction conditions remained poorly understood.
Moreover, previous numerical studies have usually simplified the pulling actions of mooring lines on pad eyes as a constant force or fixed pulling movements [11,12], overlooking the contact sliding behaviors between hangers (tail end of mooring lines) and pad eyes, as well as the variations in force (Figure 1c). Because variable soil resistances influence the hanger sliding within pad eyes, the movement direction of the hanger cannot be predetermined and is usually in a substantial deviation from the intended pulling direction (as depicted in Figure 1c). Consequently, assuming a constant load or displacement instead of contact action between hangers and pad eyes (structure–structure interaction) is improper. Although continuous numerical methods including the finite element method (FEM) are capable of simulating the deformation of suction anchors and structure–structure interactions, these methods fall short in terms of accurately simulating large soil deformation and failure (see Figure 1d) [13,14]. Consequently, the discrete element method (DEM) is popular among many researchers, as it can analyze sandy soil behavior on a microscale and model significant soil deformations [15,16]. However, modeling the contact behaviors between hangers and suction anchors poses challenges for existing discrete element method (DEM) approaches in structure–structure interaction simulation [14]. Hence, harnessing the strengths of both DEM and FEM could offer valuable insights into the interactions between suction anchors and sandy soils under pulling action from mooring lines. To date, there have been no studies that have utilized a DEM-FEM simulation to examine the influence of interface friction on suction anchor–soil interactions under slidable pulling actions.
This technical note endeavors to investigate the underlying mechanism of the interaction between suction anchors and sandy soil under slidable pulling action from micro to macro, considering various interface friction conditions. The study initiates by analyzing pulling force–displacement curves under different interface friction conditions. Subsequently, a comprehensive analysis is carried out to evaluate the displacement features of suction anchors and soil behaviors at the particle scale. Lastly, the patterns of interaction between suction anchors and soil under varying interface friction conditions are summarized. The results of this study offer a reference for designing the suction anchor foundations used in marine engineering.

2. Numerical Research on Suction Anchor–Soil Interaction

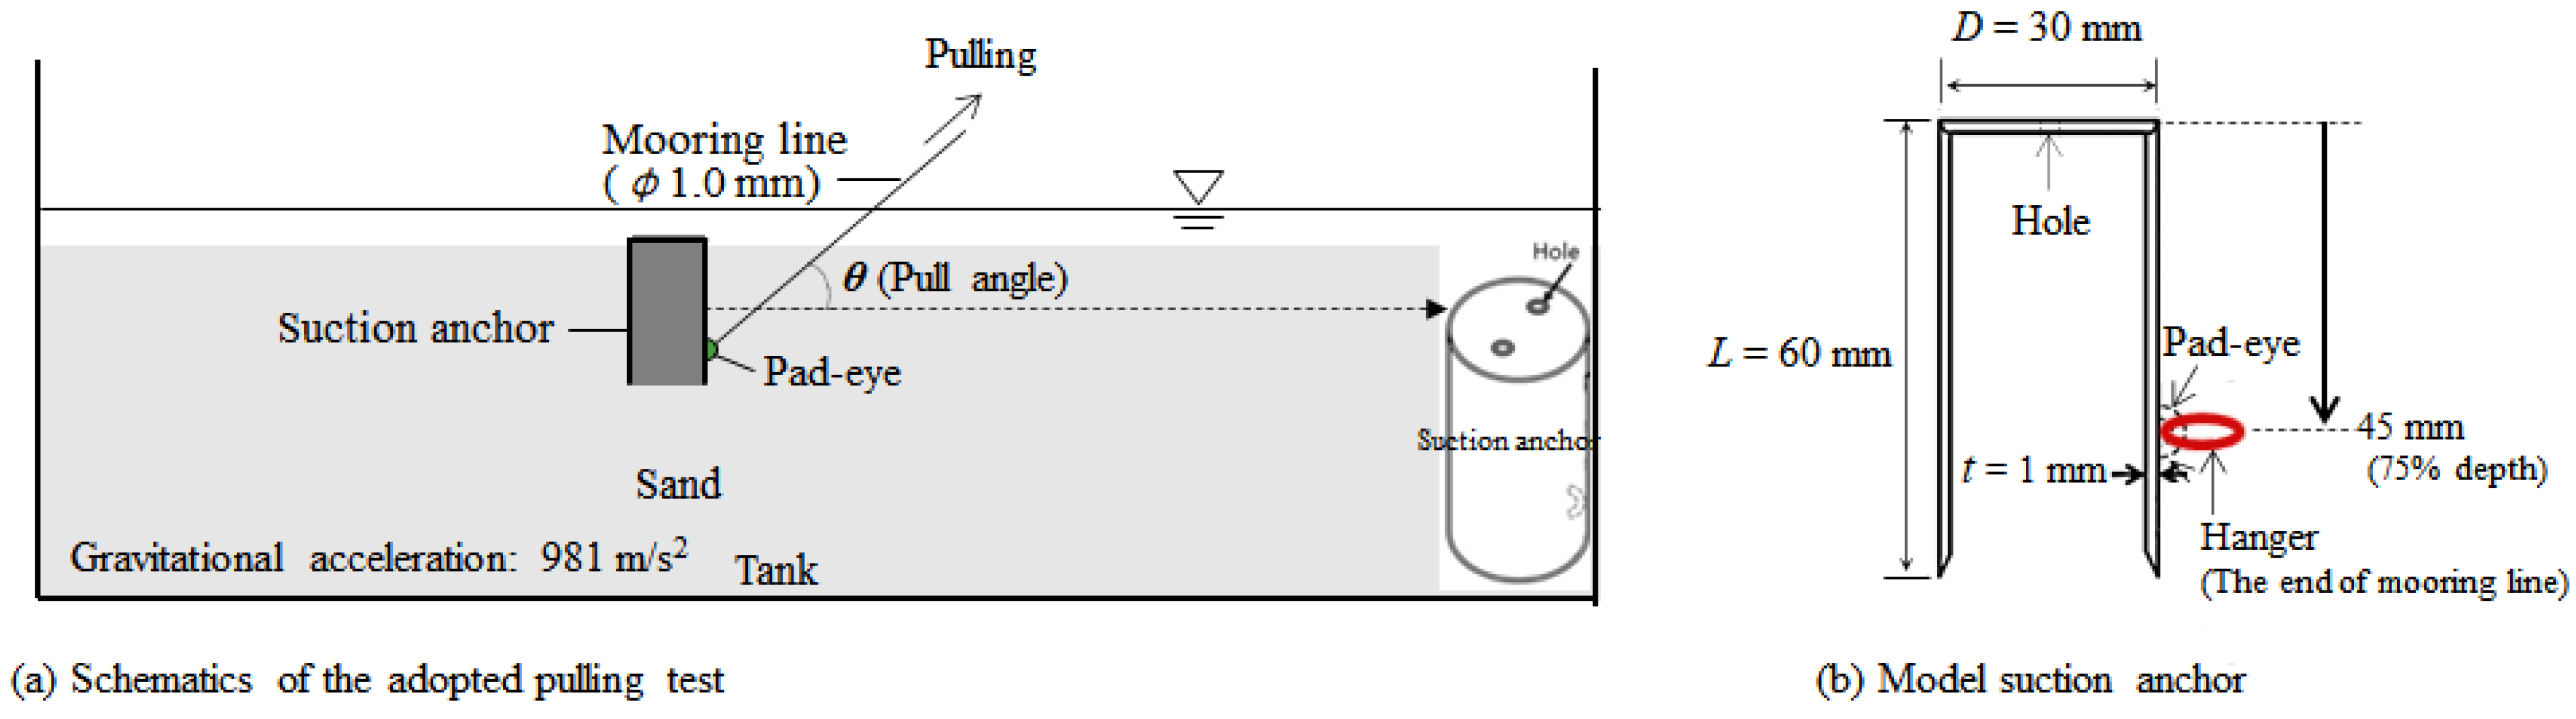
2.1. The Centrifuge Model Tests

This study utilized the centrifuge tests carried out by Bang et al. [17] to investigate the anti-pullout capacity of model suction anchors under slidable pulling actions from mooring lines. The centrifuge tests were conducted in a tank. The foundation soil was a type of sandy soil. The specific gravity of the soil was 2.62, while the grain size was 0.1~1.0 mm. An actuator was utilized to generate the pulling action on mooring lines in the experimental tests. The model suction anchors, as shown in Figure 2b, were constructed using a smooth steel tube. The model suction anchor had an underwater weight of 40.3 g. Pulling actions during the tests were applied on the pad eye at a depth of h = −45 mm (75% depth), which is approximately the location with the highest anti-pullout capacity [14,18,19]. The tests were carried out at the gravitational acceleration of 100 g (981 m/m2). Note that the model of the suction anchor (shown in Figure 2) under the gravitational acceleration of 100 g corresponds to a suction anchor with a diameter of 3.0 m and a length of 6.0 m in prototype dimensions. To prevent the suction anchor from experiencing obvious excess pore water pressure, two air holes (refer to Figure 2a) were drilled at the top. It should be emphasized that the model tests were conducted using sandy soil that was easy for the dissipation of excess pore water pressure. Similar to prior studies [20,21], excess pore water pressure was not taken into account in the experimental tests. Further information regarding the specific details can be found in the study by Bang et al. [17].

2.2. The Numerical Model in DEM-FEM Simulations

In this study, coupled DEM-FEM simulations were employed. The size of the model suction and the pulling position in the simulations were the same as that in the experimental tests carried out by Bang et al. [17]. DEM simulations are well suited for sandy soil, while FEM is commonly used for modeling solid structures [22,23]. Following the approach of previous studies [14,18,19], a DEM-FEM coupling method was adopted in this research. Balls in DEM were utilized to simulate the sandy soil, while meshes in FEM were employed to create the suction anchors. The deformation of the suction anchors in the centrifuge tests was small relative to the displacement, satisfying the criteria for employing the one-way transient coupled DEM-FEM simulations [24,25]. Similar to previous investigations [14,19,26], the one-way transient coupling method was employed in simulations. This method encompasses the analysis of boundary data, specifically particle contact forces on the structure’s surfaces in the DEM simulation; then, these forces are integrated into the FEM simulation as boundary conditions at each step, without any feedback from the FEM part to the DEM part. In the computing process, the initial geometry of the suction anchor was shared between the DEM and FEM components. Firstly, the DEM part collected particle contact forces on the suction anchor’s boundary, which consisted of facet elements. These loads were then transformed into vertex forces on each boundary element. Subsequently, the forces exerted on vertices were utilized for conducting transient structure analysis within the FEM component. Consistent with prior research [14,19], the buoyant unit weight of the grains (as indicated by the density of grains in Table 1) was employed to take the underwater state of sandy soil into consideration.
Like prior investigations [14,19], the DEM-FEM simulations utilized a symmetry-based modeling method to decrease computational expenses [27,28]. A frictionless container was employed to contain 1/2 foundation soil and 1/2 the suction anchor, as depicted in Figure 3a, capitalizing on the axisymmetric characteristics in experimental tests. Additionally, a coarse-grained model [16,29,30] was implemented in this study to ensure the same macroscopic soil properties throughout different regions while selectively increasing the grain size in certain regions to decrease the simulation time. The computational model consisted of 3 different zones: Zone 1, which encompassed a small-grain region around the suction anchor, and two larger grain zones, Zone 2 and Zone 3, surrounding Zone 1, as shown in Figure 3a. In Zone 1, the grain diameters were 2~2.8 mm, with a median diameter (d50) of 2.4 mm. The ratio of the suction anchor diameter to d50 was 12.5, which was deemed sufficient to disregard grain-scale effects [31,32]. To prevent the migration of grains from the small-grain zones into the neighboring large-grain zones, enlargement factors were applied. Consequently, in comparison to the grains in Zone 1, those in Zones 2 and 3 were amplified by amplification coefficients of 1.6 and 2.56, respectively, which was similar to previous studies [14,33]. When the pulling action was applied to the suction anchors, the particle movement primarily occurred in Zone, which confirmed the rational design of the numerical model’s zoning approach. Consistent with previous DEM simulations [14,19] conducted on the same tests, the simulated sandy soil had a porosity of 0.37 in this study. Similar to prior research [14,19,34], the Hertzian spring dashpot model and the linear spring Coulomb limit model were utilized to compute the normal particle contact behaviors and the tangential particle contact behaviors, respectively. To account for the influence of grain angularity on grain contact behavior, the linear spring rolling limit model, as offered by Wensrich and Katterfeld [15] was employed.
In line with previous numerical simulations [19,25], finite element meshes were employed to construct suction anchors with triangular geometry, composed of 7837 vertices. The physical properties of the suction anchors were set with steel properties. As shown in Figure 3b, to replicate the pulling behavior observed in the centrifuge tests, where the hanger pulls the suction anchor (as shown in Figure 2), the pulling motion of the confined roller inside the pad eye was controlled during simulations. Consistent with the experiments, the pulling action in simulations was controlled by pulling velocity at a rate of 2 mm/s, which was in line with previous research [14,19]. Moreover, this pulling velocity matched the velocity of the movement of floating structures, as indicated by prior numerical studies [35,36]. The pull angle (θ) was maintained at a constant 45° angle, consistent with that in experimental tests. In line with previous simulations [14,19] based on the tests of Bang et al. [17], Young’s modulus (E) values for the grains and suction anchors were determined as 1.0 × 10⁶ kN/m2 and 2 × 10¹¹ kN/m2, respectively.
Numerical parameters were calibrated using the peak pulling forces (refer to Figure 4) at various anchoring positions (h = 5%~95% depths) that were gained from the centrifuge tests, in line with previous DEM research on soil–structure interactions [14,37]. The calibration with forces provides a comprehensive representation of the soil–structure interaction intensity on a physical level, reflecting the action and properties of structures, along with the soil properties, as demonstrated in previous DEM-based studies [14,38,39]. The major numerical parameters utilized in DEM-FEM simulations are presented in Table 1. In the adopted tests, model suction anchors were built with smooth steel tubes, which led to a low interface friction value (f = 0.35) for the anchor surfaces in numerical simulations. After calibrating numerical parameters, a subsequent investigation was conducted to explore the impact of interface friction on suction anchor–soil interactions. Both a low interface friction condition (f = 0.35) and a high interface friction condition (f = 0.55) were considered in the simulations. Note that it is a common practice in numerical studies to conduct extension studies using validated parameters, which can save significant amounts of time and resources compared to directly conducting experimental tests [13,25]. However, it is important to emphasize that the most ideal approach is to accompany numerical analysis with corresponding experimental tests whenever sufficient time, test conditions, and funding are available.
It should be noted that many parameters, including grain size, grain shape, void ratio, and grain size distribution, usually have some variations between simulations and experiment tests in most DEM-based research [40,41]. Consequently, the specific numerical value derived from these investigations based on DEM may differ to a certain extent from the values in experiments. Consequently, instead of aiming for exact numerical value agreement, the primary focus should be on providing micromechanical mechanisms and the trend in soil behaviors.

3. Results and Analyses

The design of suction anchors often benefits from the data inferred from pulling force–displacement (P-S) curves [42,43]. Figure 5 depicts the evolution of the pulling force (T) observed in simulations under different interface friction conditions. Obviously, the pulling force in Group 2 was much larger than that in Group 1 because of the increased intensity of suction anchor–soil interactions resulting from higher interface friction. As the pulling distance increased, the pulling force first grew fast and then stabilized without peaks under the low interface friction (f = 0.35). However, under the condition of f = 0.55, as the pulling distance increased, the pulling force first grew fast and then obviously reduced, leading to an emergence of evident peaks in pulling forces. The discrepancy in the shapes of curves was in fact associated with the difference in patterns of suction anchor–soil interactions, which will be discussed in subsequent sections.
Comprehending the movement of suction anchors and soil particle behaviors is essential for accurately understanding the mechanism of suction anchor–sandy soil interactions [44]. Figure 6 illustrates the movement of suction anchors and the behavior of soil particles at the particle scale. The displacement of suction anchors was greatly different under different interface friction conditions: A large pullout displacement and small rotation angle of the suction anchor were observed under the low interface friction of f = 0.35, while a small pullout displacement and a relatively large rotation angle were found under the condition of f = 0.55. Due to the large anchor rotation angle, the soil deformation (upheaval) on two sides of the suction anchors was much larger under higher interface friction, as shown in Figure 6b. The pullout displacements demonstrated that higher interface friction between the suction anchor and soil is useful for enhancing the anti-pullout capacity in suction anchor foundations.
The rotational velocity of grains serves as a valuable indicator of soil shear behavior [14]. As shown in Figure 6a, under the low interface friction of f = 0.35, strong particle rotation was only distributed around the suction anchor–soil interface, indicating the existence of strong interface shear behaviors between the suction anchor and soil. In contrast, under the condition of f = 0.55, an additional banded particle rotation area and a corresponding sliding block above it were observed on the pulling side (Figure 6b), indicating a typical internal soil shear failure under high interface friction. According to previous studies [14,19], the shearing out to the soil surface of shear bands typically results in a significant reduction in pulling forces (corresponding to soil resistances). This phenomenon can effectively explain the emergence of prominent peaks in pulling force–displacement curves under high interface friction.

4. Discussion

4.1. The Interface Friction Effect on Failure Patterns of Anchor–Soil Interactions

This section focuses on exploring the influence of interface friction on the failure patterns of suction anchor–soil interactions. The trajectories and translation velocities of grains play a crucial role in comprehensively understanding the soil failure behavior in the vicinity of structures [14]. Figure 7 shows the trajectories and translation velocities of grains under varying interface friction conditions in simulations. Under the low interface friction of f = 0.35, a short particle trajectory was only observed in limited areas, which corresponds to weak soil movement and relatively small soil disturbance areas during suction anchor–sandy soil interactions. Under the condition of f = 0.55, the particle trajectory was much longer and widely distributed, with a relatively flat bottom boundary on the pulling side. The flat boundary corresponding to the bottom of the shear band indicated a relatively bulk movement on the left pulling side, which can be attributed to shear failure within the soil. Moreover, violent rotation was observed in the core soil, which corresponds to the huge rotation angle of suction anchors during suction anchor–sandy soil interactions.
The definitive failure patterns of suction anchor–soil interactions under different interface friction conditions are presented in Figure 8, based on the aforementioned micro-to-macro analyses. Similar to previous studies [14,19,25], the numerical simulations were conducted with a 3D model, while the failure modes of suction anchor–soil interactions (results in Figure 8) were determined in 2D format. The decision to use 2D diagrammatic representations is justified by the following reasons: Firstly, 2D representations make it easier for readers to discern the interaction modes between suction anchors and sandy soil compared to 3D views. Secondly, the loading direction (pulling direction) considered in this study is confined to the 2D vertical plane. Previous studies [14,19] have demonstrated that the most significant deformations and stresses occur within this vertical plane. Under low interface friction conditions, suction anchor–soil interactions exhibit a representative interface shear failure pattern. In such scenarios, suction anchor–soil interactions are distinguished by significant pullout displacements, small rotation angles of suction anchors, and small soil deformation. Under high interface friction conditions, suction anchor–soil interactions exhibit a representative internal soil shear failure pattern. They are distinguished by relatively small pullout displacements, large rotation angles of suction anchors, and large soil deformation around the anchors (obvious soil upheaval). To summarize, the failure pattern of suction anchor–sandy soil interactions is notably influenced by changes in interface friction. Disregarding the impact of interface friction will result in misjudgments regarding the deformation of sandy soil and the anti-pullout capacity of suction anchors, potentially compromising the safety of floating structures in marine engineering.

4.2. The Limitations of the Study and Future Research Directions

In the DEM-FEM coupled numerical study, the influence of fluid (water) in the experimental tests was simplified rather than directly modeled, taking into account well-drained conditions. Additionally, although the parameters in the DEM-based simulation were calibrated using experimental tests, real-world validation was not conducted for the analysis results of the interface friction effect on suction anchor–sandy soil interactions in the numerical study. For future studies, it is recommended to perform additional experimental tests to further validate the findings, provided that the test conditions allow for it. Furthermore, it is essential to highlight that, in this study, the mooring line was installed solely at the 75% depth position, with pull forces applied along a vertical plane. Therefore, further investigation into the interface friction effect is warranted for suction anchors moored at various depths or subjected to horizontal pull forces.

5. Conclusions

This technical note presents a series of DEM-FEM simulations aimed at examining the influence of interface friction on suction anchor–soil interactions under the slidable pulling actions of mooring lines, from micro to macro. The key findings can be outlined in the following points:
(1)
Interface friction significantly influenced the shapes of pulling force–displacement curves of suction anchors due to its effect on the pattern of suction anchor–soil interactions. Under low interface friction conditions, the pulling forces increased with pulling distance first and then tended to be stable, which corresponded to the stable interface slide during suction anchor–soil interactions. However, under high interface friction conditions, a distinct peak pulling force emerged with an increase in pulling distance, corresponding to internal soil shear failure.
(2)
The interface friction alters the movement of suction anchors and the surrounding soil deformation. Low interface friction leads to large pullout displacements and small rotation angles of suction anchors due to the weak impede effect on the pullout behaviors of suction anchors. In contrast, high interface friction leads to stronger suction anchor–sandy soil interaction forces, which impede the pullout of suction anchors and further result in obvious anchor rotation, larger soil deformations, and the emergence of an additional banded particle rotation area within the soil.
(3)
The conclusion on the effect of interface friction on the failure patterns of suction anchor–sandy soil interactions was drawn after the analyses of macro-to-particle-scale soil behaviors. Under high interface friction, longer particle trajectories and wider soil disturbance areas corresponded well to the much larger rotation angle of suction anchors and huge soil deformation. Finally, the characteristics of the two definitive soil failure patterns, namely the interface shear failure and internal soil shear failure during suction anchor–soil interactions, were identified.
In summary, this technical note proves the effectiveness of three-dimensional DEM-FEM coupling methods in modeling suction anchor–soil interaction behaviors under the slidable pulling actions of mooring lines. The findings highlight the notable influence of interface friction on the intensity of suction anchor–soil interactions along with the failure pattern. This investigation provides valuable knowledge for analyzing the behaviors of suction anchor foundations in marine engineering.

Author Contributions

Conceptualization, Methodology, writing—original draft preparation and writing—review and editing, Y.P.; writing—review and editing, formal analysis, software, validation, resources and supervision, funding acquisition, project administration, B.L.; writing—review and editing, formal analysis, data curation, investigation, funding acquisition, project administration, G.W. and Q.W. All authors have read and agreed to the published version of the manuscript.

Funding

This work has been funded by the Natural Science Foundation of Zhejiang Province (LTGS23E040001), Shaoxing Science and Technology Plan Project (No. 2022A13003), China Postdoctoral Science Foundation (2023M732689), and National Natural Science Foundation of Zhejiang Province (No. LQ24D020012).

Institutional Review Board Statement

Not applicable.

Informed Consent Statement

Not applicable.

Data Availability Statement

The data presented in this study are available upon request from the corresponding author.

Conflicts of Interest

Author Quan Wang was employed by the Jinghe New City of Xixian New Area Real Estate Development Co. Ltd. The remaining authors declare that the research was conducted in the absence of any commercial or financial relationships that could be construed as a potential conflict of interest.

References

  1. Fu, D.; Zhou, Z.; Yan, Y.; Pradhan, D.L.; Hennig, J. A method to predict the torsional resistance of suction caisson with anti-rotation fins in clay. Mar. Struct. 2021, 75, 102866. [Google Scholar] [CrossRef]
  2. Wang, Y.; Zhang, S.; Ren, Y.; Xu, H.; Ren, B.; Zhang, Y.; Gaunt, P. Site investigation and soil parameters for offshore suction bucket design: A case study of Houhu wind turbine. Ocean Eng. 2022, 255, 111458. [Google Scholar] [CrossRef]
  3. Wang, X.; Yang, X.; Zeng, X. Seismic centrifuge modelling of suction bucket foundation for offshore wind turbine. Renew. Energy 2017, 114, 1013–1022. [Google Scholar] [CrossRef]
  4. Yang, Y.; Bao, J.; Yang, H.; Pang, Z.; Wang, Y. Microscopic analysis of the influence of soil properties on the suction bucket installation in sand based on the CFD-DEM model. Comput. Geotech. 2023, 156, 105249. [Google Scholar] [CrossRef]
  5. Lai, H.; Gu, X.; Tu, W.; Lin, Y.; Xiao, J. Effects of soil small strain nonlinearity on dynamic impedance of horizontally loaded suction caisson for offshore wind turbines. Soil Dyn. Earthq. Eng. 2023, 165, 107731. [Google Scholar] [CrossRef]
  6. Huang, Z.; Shi, L.; Cai, Y. Suction contribution to uplift capacity of suction buckets under serviceability conditions. Ocean Eng. 2023, 283, 115041. [Google Scholar] [CrossRef]
  7. Ueda, K.; Uzuoka, R.; Iai, S.; Okamura, T. Centrifuge model tests and effective stress analyses of offshore wind turbine systems with a suction bucket foundation subject to seismic load. Soils Found. 2020, 60, 1546–1569. [Google Scholar] [CrossRef]
  8. Houlsby, G.; Kelly, R.; Huxtable, J.; Byrne, B. Field trials of suction caissons in sand for offshore wind turbine foundations. Géotechnique 2006, 56, 3–10. [Google Scholar] [CrossRef]
  9. Zhang, P.; Li, J.; Le, C.; Ding, H. Seismic responses of two bucket foundations for offshore wind turbines based on shaking table tests. Renew. Energy 2022, 187, 1100–1117. [Google Scholar] [CrossRef]
  10. Peng, Y.; Tan, Y.; Qu, L. Micromechanical analysis of the suction bucket-granular soil interactions under the pull action of anchor lines: Embedded length effect. Ocean Eng. 2024, 291, 116443. [Google Scholar] [CrossRef]
  11. Cheng, X.; Cheng, W.; Wang, P.; El Naggar, M.H.; Zhang, J.; Liu, Z. Response of offshore wind turbine tripod suction bucket foundation to seismic and environmental loading. Ocean Eng. 2022, 257, 111708. [Google Scholar] [CrossRef]
  12. Tu, W.; He, Y.; Liu, L.; Liu, Z.; Zhang, X.; Ke, W. Time Domain Nonlinear Dynamic Response Analysis of Offshore Wind Turbines on Gravity Base Foundation under Wind and Wave Loads. J. Mar. Sci. Eng. 2022, 10, 1628. [Google Scholar] [CrossRef]
  13. Ahmed, S.S.; Hawlader, B.C. Numerical analysis of inclined uplift capacity of suction caisson in sand. Int. J. Offshore Polar Eng. 2015, 25, 145–155. [Google Scholar] [CrossRef]
  14. Peng, Y.; Yin, Z.-Y. Micromechanical analysis of suction pile-granular soil interaction under inclined pulling load: Effect of pulling angle. Ocean Eng. 2023, 270, 113615. [Google Scholar] [CrossRef]
  15. Wensrich, C.M.; Katterfeld, A. Rolling friction as a technique for modelling particle shape in DEM. Powder Technol. 2012, 217, 409–417. [Google Scholar] [CrossRef]
  16. Peng, Y.; Yin, Z.-Y.; Ding, X. Analysis of particle corner-breakage effect on pile penetration in coral sand: Model tests and DEM simulations. Can. Geotech. J. 2023, 60, 749–765. [Google Scholar] [CrossRef]
  17. Bang, S.; Jones, K.; Kim, K.; Kim, Y.; Cho, Y. Inclined loading capacity of suction piles in sand. Ocean Eng. 2011, 38, 915–924. [Google Scholar] [CrossRef]
  18. Xu, Q.; Ye, J. An adaptively coupled DEM–FEM algorithm for geometrical large deformation analysis of member structures. Comput. Part. Mech. 2020, 7, 947–959. [Google Scholar] [CrossRef]
  19. Peng, Y.; Yin, Z.-Y. Micromechanical analysis of suction pile-granular soil interaction under inclined pulling load of mooring line: Mooring depth effect. Mar. Struct. 2023, 92, 103499. [Google Scholar] [CrossRef]
  20. Bang, S.; Leahy, J.C.; Cho, Y.; Kwon, O. Horizontal bearing capacity of suction piles in sand. Transp. Res. Rec. 2006, 1975, 21–27. [Google Scholar] [CrossRef]
  21. Kim, Y.; Kim, K.; Cho, Y.; Bang, S. Centrifuge Model Tests on Suction Pile Pullout Loading Capacity in Sand; CRC Press: Boca Raton, FL, USA, 2010. [Google Scholar]
  22. Liu, F.; Yi, J.; Cheng, P.; Yao, K. Numerical simulation of set-up around shaft of XCC pile in clay. Geomech. Eng. 2020, 21, 489–501. [Google Scholar]
  23. Qu, L.; Yang, C.; Ding, X.; Kouroussis, G.; Zheng, C. A continuum-based model on axial pile-head dynamic impedance in inhomogeneous soil. Acta Geotech. 2021, 16, 3339–3353. [Google Scholar] [CrossRef]
  24. Kešner, A.; Chotěborský, R.; Linda, M.; Hromasová, M.; Katinas, E.; Sutanto, H. Stress distribution on a soil tillage machine frame segment with a chisel shank simulated using discrete element and finite element methods and validate by experiment. Biosyst. Eng. 2021, 209, 125–138. [Google Scholar] [CrossRef]
  25. Peng, Y.; Yin, Z.-Y. Micromechanical analysis of suction bucket-granular soil interaction under eccentric pulling action of mooring lines: Effect of horizontal pulling angle. Ocean Eng. 2023, 284, 115217. [Google Scholar] [CrossRef]
  26. Dratt, M.; Katterfeld, A. Coupling of FEM and DEM simulations to consider dynamic deformations under particle load. Granul. Matter 2017, 19, 49. [Google Scholar] [CrossRef]
  27. Bernhardt, M.L.; Biscontin, G. Experimental validation study of 3D direct simple shear DEM simulations. Soils Found. 2016, 56, 336–347. [Google Scholar] [CrossRef]
  28. Zheng, Z.; Zang, M.; Chen, S.; Zhao, C. An improved 3D DEM-FEM contact detection algorithm for the interaction simulations between particles and structures. Powder Technol. 2017, 305, 308–322. [Google Scholar] [CrossRef]
  29. Chan, E.L.; Washino, K. Coarse grain model for DEM simulation of dense and dynamic particle flow with liquid bridge forces. Chem. Eng. Res. Des. 2018, 132, 1060–1069. [Google Scholar] [CrossRef]
  30. Ahlman, B. Coarse-Graining Fields in Particle-Based Soil Models. Master’s Thesis, Umeå University: 2020.
  31. Kotrocz, K.; Mouazen, A.M.; Kerényi, G. Numerical simulation of soil–cone penetrometer interaction using discrete element method. Comput. Electron. Agric. 2016, 125, 63–73. [Google Scholar] [CrossRef]
  32. Fu, Z.; Chen, S.; Liu, S. Discrete Element Simulations of Shallow Plate-Load Tests. Int. J. Geomech. 2016, 16, 04015077. [Google Scholar] [CrossRef]
  33. Falagush, O.; McDowell, G.R.; Yu, H.-S.; de Bono, J.P. Discrete element modelling and cavity expansion analysis of cone penetration testing. Granul. Matter 2015, 17, 483–495. [Google Scholar] [CrossRef]
  34. Antypov, D.; Elliott, J. On an analytical solution for the damped Hertzian spring. Europhys. Lett. 2011, 94, 50004. [Google Scholar] [CrossRef]
  35. Diaz, B.D.; Rasulo, M.; Aubeny, C.P.; Fontana, C.M.; Arwade, S.R.; DeGroot, D.J.; Landon, M. Multiline anchors for floating offshore wind towers. In Proceedings of the OCEANS 2016 MTS/IEEE Monterey, Monterey, CA, USA, 19–23 September 2016; pp. 1–9. [Google Scholar]
  36. Hung, L.C.; Lee, S.; Tran, N.X.; Kim, S.-R. Experimental investigation of the vertical pullout cyclic response of bucket foundations in sand. Appl. Ocean Res. 2017, 68, 325–335. [Google Scholar] [CrossRef]
  37. Khanal, M.; Elmouttie, M.; Poulsen, B.; Olsson, A.; Adhikary, D. Effect of loading rate on sand pile failure: 2D DEM simulation. Geotech. Geol. Eng. 2017, 35, 889–896. [Google Scholar] [CrossRef]
  38. Mondal, S.; Disfani, M.; Narsilio, G.A. Battered minipiles in fine-grained soils: Soil-structure interaction. Comput. Geotech. 2022, 147, 104762. [Google Scholar] [CrossRef]
  39. Brunelli, A.; De Silva, F.; Piro, A.; Parisi, F.; Sica, S.; Silvestri, F.; Cattari, S. Numerical simulation of the seismic response and soil–structure interaction for a monitored masonry school building damaged by the 2016 Central Italy earthquake. Bull. Earthq. Eng. 2021, 19, 1181–1211. [Google Scholar] [CrossRef]
  40. Qu, T.; Wang, M.; Feng, Y. Applicability of discrete element method with spherical and clumped particles for constitutive study of granular materials. J. Rock Mech. Geotech. Eng. 2022, 14, 240–251. [Google Scholar] [CrossRef]
  41. Du, L.; Liu, X.; Han, Y.; Deng, Z. Generation of irregular particle packing with prescribed statistical distribution, spatial arrangement, and volume fraction. J. Rock Mech. Geotech. Eng. 2022, 15, 375–394. [Google Scholar] [CrossRef]
  42. Arany, L.; Bhattacharya, S. Simplified load estimation and sizing of suction anchors for spar buoy type floating offshore wind turbines. Ocean Eng. 2018, 159, 348–357. [Google Scholar] [CrossRef]
  43. Wang, X.; Zeng, X.; Li, J.; Yang, X.; Wang, H. A review on recent advancements of substructures for offshore wind turbines. Energy Convers. Manag. 2018, 158, 103–119. [Google Scholar] [CrossRef]
  44. Byrne, B.; Houlsby, G.; Martin, C.; Fish, P. Suction caisson foundations for offshore wind turbines. Wind Eng. 2002, 26, 145–155. [Google Scholar] [CrossRef]
Figure 1. The interactions among mooring lines, suction anchors, and granular soil.
Jmse 12 00535 g001
Figure 2. Experimental anti-pullout tests for suction anchors in granular soil (modified from Bang et al. [17]).
Jmse 12 00535 g002
Figure 3. The DEM-FEM model of suction anchor–granular soil interaction in simulations.
Jmse 12 00535 g003
Figure 4. Comparison of peak pulling forces in centrifuge tests and numerical simulations under different pull angles [17].
Jmse 12 00535 g004
Figure 5. Pulling force–displacement curves under different interface friction conditions.
Jmse 12 00535 g005
Figure 6. Comparative analysis of displacements of suction anchors and the surrounding grain rotation velocity distributions under different interface friction conditions (S = 70 cm; θ = 55°): (a) f = 0.35, and (b) f = 0.55.
Jmse 12 00535 g006
Figure 7. Comparison of trajectories and translation velocities of grains under different interface friction conditions in simulations (S = 0~70 cm; θ = 55°): (a) f = 0.35, and (b) f = 0.55.
Jmse 12 00535 g007
Figure 8. Diagrammatic representations of failure modes for suction anchor–sandy soil interactions under different interface friction conditions: (a) small interface friction, and (b) Large interface friction.
Jmse 12 00535 g008
Table 1. Main numerical parameters for modeling suction anchor–soil interactions.
ParametersValueUnit
Grains
Density (ρ)1650 kg/m3
Elasticity modulus (E)1.0 × 10⁶N/m2
Friction coefficient (f)0.5\
Restitution coefficient0.30\
Rolling resistance (RR)0.20\
Timestep5.0 × 10−5s
Poisson ratio (υ)0.30\
Acceleration of gravity (g)981m/s2
Suction anchor
Elasticity modulus (E)2.0 × 10¹¹N/m2
Friction coefficient (f)0.35, 0.55\
Restitution coefficient0.80\
Poisson ratio (υ)0.30\
Roller
Elasticity modulus (E)2.0 × 10¹¹N/m2
Friction coefficient (f)0.0\
Restitution coefficient0.8\
Poisson ratio (υ)0.3\
Disclaimer/Publisher’s Note: The statements, opinions and data contained in all publications are solely those of the individual author(s) and contributor(s) and not of MDPI and/or the editor(s). MDPI and/or the editor(s) disclaim responsibility for any injury to people or property resulting from any ideas, methods, instructions or products referred to in the content.

