Article

The Carbonate System of Penzhina Bay and the Shelikhov Gulf in the Sea of Okhotsk during Extreme Tides in Summer

1
Il’ichev Pacific Oceanological Institute, Far Eastern Branch, Russian Academy of Sciences, Vladivostok 690041, Russia
2
Russian Federal Research Institute of Fisheries and Oceanography, Moskow 105187, Russia
3
State Key Laboratory of Estuarine and Coastal Research (SKLEC), East China Normal University (ECNU), Shanghai 200241, China
*
Author to whom correspondence should be addressed.
J. Mar. Sci. Eng. 2024, 12(3), 517; https://doi.org/10.3390/jmse12030517
Submission received: 3 February 2024 / Revised: 7 March 2024 / Accepted: 13 March 2024 / Published: 21 March 2024
(This article belongs to the Section Chemical Oceanography)

Abstract

:
Understanding the factors that control carbonate systems is an important goal due to the complex interactions between the hydrophysical and chemical–biological conditions in coastal basins. The results of this paper present the state of the carbonate system in Penzhina Bay and its adjacent waters—the Shelikhov Gulf—in July 2023, during spring tides with 13 m height. The area we studied included the length of the largest river in the region, the Penzhina River, from the peak of its summer flood to its boundary with the Shelikhov Gulf (the Sea of Okhotsk). This unique dynamic basin, with a length of about 800 km, was studied over 17 days. During this period, the entire water column of Penzhina Bay, down to a depth of about 60 m, and the surface water layer of the Shelikhov Gulf were undersaturated in terms of CO2, with low levels relative to those of the atmosphere. To explain this observation, the dissolved oxygen, nutrients in mineral and organic forms, humic substances, chlorophyll a, and photic zone thickness are presented for the entire basin under study, together with its hydrological data. The results of daily observations of the carbonate system at fixed anchorage stations characterize two contrasting regions of Penzhina Bay: one that was more exposed to continental runoff, which had salinity levels in the range of 8.0–21.3 psu during one tidal cycle; the second had smaller variations in salinity in the range of 31.6–32.9 psu during one tidal cycle. This study emphasizes the importance of biological processes and continental runoff on the variability of the carbonate system parameters and CO2 fluxes at a water/atmosphere boundary with extreme tidal conditions in this ecosystem that is barely affected by human activities.

1. Introduction

The carbon (C) cycle in coastal basins represents the most important biogeochemical cycle [1], in which fluxes of C interact with the river–sea, water/atmosphere, shelf–ocean, and water–bottom continuums [2,3]. These basins absorb approximately 10–20% of the CO2 absorbed by the world’s oceans [4,5].
The partial pressure of carbon dioxide (pCO2) is an important indicator used in C cycle studies, along with the other parameters of the carbonate system (pH, total alkalinity (TA), and dissolved inorganic carbon (DIC) DIC = [ C O 2 ] + [ HC O 3 ] + [ C O 3 2 ] ) [6]. Changes in the carbonate system parameters can be caused by five main processes: the heating/cooling of water, the advection of water with different chemical compositions, the production/destruction of organic matter (OM), CO2 exchange at the water/atmosphere boundary, and the precipitation/dissolution of calcium carbonate [6,7,8]. CO2 exchange occurs continuously at the water/atmosphere boundary, but it is hard to measure the flux of CO2 (FCO2) across this boundary directly and accurately, which is why the value of the pCO2 in the water is a key parameter when studying FCO2 [9]. In estuaries, the pCO2 is often higher than atmospheric equilibrium pressure, which was approximately 418 μatm in 2023 (https://gml.noaa.gov/ccgg/trends/ (accessed on 5 December 2023)). Due to this, rivers and estuaries may be major sources of CO2 in the atmosphere [4,10,11]. Simultaneously, CO2 is absorbed in estuaries due to intensive photosynthesis; OM’s production intensity is, in turn, determined by the influx of nutrients in the water—principally by inorganic nitrogen and phosphorus ( NO 2 + NO 3   + NH 4 +   = DIN, PO 4 3 (DIP)), as well as silicate (DSi)—and improved by favorable conditions: sufficient photosynthetically active radiation (PAR), suitable salinity and water temperature, and the vertical stability of the water layer [12]. Depending on the TA of river water, its runoff can either decrease (a dissolution effect) or increase the TA in the estuary (a source effect), the latter of which is significantly less common, thus changing its buffer capacity and the response of the carbonate system to the production/destruction balance of OM [6,7,8]. Therefore, continental shelves have higher spatial and temporal variability in terms of pCO2 and FCO2 than the open ocean due to their complex physical and biogeochemical dynamics [13].
CO2 fluxes at the water/air boundary can be measured directly [14] or calculated on the basis of measurements of the pCO2 in the water and a given gas transfer rate [15]. Calculations of the FCO2 can be subject to large uncertainties due to the difficulty in accurately estimating this gas transfer rate (for example, see the discussion in [16]). Daily and tidal oscillations of the pCO2 in the water of fast-moving coastal ecosystems can also add some uncertainty to estimates of the FCO2 in the air and water due to a large set of controlling factors [14,17,18].
Examples of comprehensive studies of the carbon dynamics in estuaries include papers on European estuaries (which can be found in [19]). Recently, in connection with an increasing flux of nutrients within the runoff of many rivers on Asian shores, for example, papers [20,21,22], the carbonate system of coastal waters under anthropogenic eutrophication has been widely discussed [23,24,25,26,27]. Significant daily oscillations of the carbonate system parameters can be caused by tidal water dynamics and, consequently, by the disturbance of bottom sediments and changes in PAR, and, as a result, by variations in the metabolism of phytoplankton [14,19,28]. Tides control the exchange of interstitial waters, thus affecting their pH and fluxes of nutrients and C [29]. Porewater exchange due to tides plays an important role in the transfer of C and nutrients in mangrove and salt marsh ecosystems [30,31,32,33]. Tidal flushing from tidal marshes can supply the water with nutrients and stimulate primary production [34]. However, discussion of the impact of water dynamics on the carbonate system and the controlling factors in hypertidal estuaries [35] is limited. Some studies have focused on areas with high-intensity tidal dynamics in the Gulf of Maine [36,37] and specific locations therein.
For Penzhina Bay, research is limited due to severe navigation problems and hydro-meteorological conditions because it is one of the most dynamic basins in the world’s oceans, with tidal heights of up to 13.9 m (difference in height between high tide and low tide) [38]. It is located at a subpolar latitude. Despite a significantly lower salinity in summer, daily tidal variations cause strong mixing and a vertical homogeneity of the temperature and salinity of the water at the head of Penzhina Bay [39,40]. This basin is ideal for studying the natural variations of carbonate system parameters and understanding how they act as controlling factors in a hypertidal estuary.
This study presents the first data on the carbonate system of the waters in Penzhina Bay and the adjacent waters of the Sea of Okhotsk—the Shelikhov Gulf. The main objectives of this study are (1) obtaining basic values for the carbonate system parameters (pH, DIC, TA, pCO2) in a water body with unique physico-geographical conditions in the period after the peak of its summer flood and (2) determining their relationships with the main controlling factors at play: their connection with the continental runoff, extreme tides, OM production/destruction balance, and the main sources of nutrients. The freshwater endmembers of the main river in the area under study, the Penzhina River, have also been determined.

2. Materials and Methods

2.1. Object

Penzhina Bay and the Shelikhov Gulf are located in the northern part of the Sea of Okhotsk (Figure 1). The climate of the area under study is extremely continental, with very cold, long winters and short, dry summers. Its average annual precipitation is in the range of 300–400 mm. The peculiarity of the climate in this area is its very large number of annual air temperature fluctuations. The coldest month is December, with an average monthly air temperature at the head of Penzhina Bay of about minus 23 °C. The absolute minimum temperature the air reaches here is minus 52.6 °C. The warmest month of the year is July, when the average monthly air temperature reaches 14 °C, while the air warms up to 19 °C on average in the daytime. Permafrost is widespread in the region, and its thickness reaches tens of meters near the coast of Penzhina Bay (references to primary sources are in [39]).
The bathymetry in Figure 1 shows the central canyon that cuts into Shelikhov Gulf at its marine boundary. This canyon has one channel along the central part of Penzhina Bay and a branch to the western part of the Shelikhov Gulf.
During our cruise on 3–18 July 2023, the height of the spring tides reached 13 m (Figure 2). At the same time, the study was planned so that water sampling at the head of Penzhina Bay and in the Penzhina River was carried out during low tides to avoid unnecessary risks to the vessel. Further daily observations during the period from 13–14 July and from 16–17 July at St. 1 and St. 2, respectively, were also carried out, revealing a large level of fluctuations (Figure 2).
The relatively large Penzhina River flows into Penzhina Bay at its north-east end; this is the second largest river to enter the Sea of Okhotsk after the Amur River [38]. The ice-free period of the river usually lasts from the last days of May to the middle of October. The Penzhina River is mainly fed by snow (up to 65%) and rain (up to 25%). Its catchment area is 73,500 km2, and its average annual discharge is 682 m3/s. Spring flooding starts in the middle of May, reaches its peak in the first half of June, and ends at the end of July. The river’s flow during its flooding period, averaged over the long term, is 6644 m3/s, but in some years, it can reach approximately 10,000 m3/s (Figure 3). The floods are followed by a high discharge period in July and September that is caused by rainfall floods. The average discharge over a long-term period for these months is 365 m3/s. The river’s minimum discharge is observed in March each year when its average flow is 22.3 m3/s. The second most important river in the area is the Talovka River. Its catchment area is 24,100 km2; its average annual discharge is 230 m3/s. At its flooding peak, this is usually 2074 m3/s; its minimum discharge in the summer–fall period is 141 m3/s (references to primary sources are in [39]).
The basins of the rivers under study are natural objects; the human population is estimated to be in the hundreds, but the population of brown bears is estimated to be in the thousands.

2.2. Field Work, Hydrological Surveys, and Water Sampling

The results of the cruise in 2023, conducted after the peak of the high-water conditions in spring–summer, are presented. Samples of water from the bay and gulf were taken from aboard the R/V Akademik Oparin, and samples from the Penzhina River were collected onboard a speedboat.
A six-position water sampler SBE ECO—55 with 4 L sample bottles, complete with a hydrologic profiler SBE 19 PLUS (Sea-Bird Scientific, Bellevue, Washington, DC, USA), with pressure, temperature, conductivity, chlorophyll a (Chl a), turbidity, and PAR sensors, was used to carry out profiling and water sampling. Based on the data from the PAR sensor, the photic zone thickness was determined. On the speedboat, 5 L Niskin bottles were used for water sampling, and a profiler RBR Maestro (RBR Ltd., Ottawa, ON, Canada), with the same set of sensors as on the SBE 19 PLUS, was used for profiling. Water samples were collected from the surface (0.5–1.5 m depth) and bottom (1.0–2.0 m from the bottom) water layers.
The following characteristics were measured: salinity, temperature, pH, TA, DIP, DSi, DIN, the total mineral and organic forms of nitrogen and phosphorus (Ntot = DIN + Norg; Ptot= DIP + Porg), and humic substances (HSs). On the day of sampling, the pH, TA, salinity, and concentration of nutrients in their mineral form were determined. Samples for Ntot, Ptot, and HS were frozen at –20 °C and stored on the vessel until the end of the cruise. Their analysis was then carried out over approximately two weeks in the hydrochemistry laboratory of the Pacific Oceanological Institute, Far Eastern Branch of the Russian Academy of Sciences.

2.3. Laboratory Analysis

pH was determined via the potentiometric method using the Pitzer scale [41] and converted, using the total hydrogen ion concentration scale, to the pHin situ [42]. The precision of the pH measurements was about ±0.004 pH units. Direct colorimetric titration with hydrochloric acid in an open cell, according to Bruevich’s method, was applied to determine the TA [41,43]. TA measurements were performed with a precision of ±3 µmol/kg. The pCO2 and pH in situ were calculated from the measured pH and TA [6]. Salinity was measured using an Autosal 8400B salinity meter (Guildline Instruments, Smiths Falls, ON, Canada) with an accuracy of 0.002. The concentration of NH 4 + was determined using the indophenols method. The concentrations of NO 2 ,   NO 3 , DSi, and DIP were measured using standard colorimetric methods [44]. The detection limit was 0.01 μmol/L for the DIP and DIN and 0.02 μmol/L for the DSi. A “Skalar San++” analyzer (Skalar, Breda, The Netherlands) was used to determine the Ntot and Ptot. The Chl a concentration was determined using the impulse fluorometer PHYTO-PAM-II MODULAR Version (Walz, Effeltrich, Germany). The HSs’ concentration was determined via the spectrophotometric method using a Shimadzu UV-3600 (Shimadzu, Kyoto, Japan). Dissolved oxygen (DO) samples were analyzed using the Winkler titration method with a Brinkman Dosimat burette and photometric end-point detection, providing accuracy to the measurements of 0.5 to 1%. The value of the apparent oxygen utilization (AOU) was calculated based on the DO:
AOU = DOequilibrium − DOmeasured

2.4. Calculation of the FCO2 at the Water/Atmosphere Boundary

The FCO2 (F), μmol of CO2 m−2 day−1, at the water/atmosphere boundary was calculated according to [15]:
F = k K0 (pCO2 (water) − pCO2 (air))
where k—the transfer rate of CO2 cm h−1, K0—solubility of CO2 at a certain temperature and salinity in mol kg−1 atm−1 [45], pCO2(water)—the value calculated based on the measured pH and TA in the water samples [41], pCO2(air)—418 µatm, the value that we have adopted for this region in 2023 (https://gml.noaa.gov/ccgg/trends/ (accessed on 5 December 2023)). There is a set of empirical equations used to calculate k, the use of which can cause the calculated F to differ by more than double its value at a wind speed of 3.4 m/s (see, for example, the estimates in [16]). We recorded the wind speed (U) using a shipboard weather station and calculated k based on the empirical function proposed in [15] and used in recent publications to calculate F in similar climatic conditions in the Bering Sea [46,47]:
k = 0.251 U2(Sc/660)−1/2
where U—the wind speed (m/s); Sc—the Schmidt number for CO2, calculated based on the equation adopted from [46]:
Sc = 2116.8 − 136.25 t + 4.7353 t2 − 0.092307 t3 + 0.0007555 t4
where t—the temperature, in °C, measured in the surface water layer at the moment of water sampling.
The accepted Schmidt number for seawater—660—was used in our calculations.

2.5. Software

The software used for the statistical analyses was MS Excel 2019. The spatial distribution maps were developed using the program Surfer 20 (Golden Software LLC, Golden, CO, USA).

3. Results

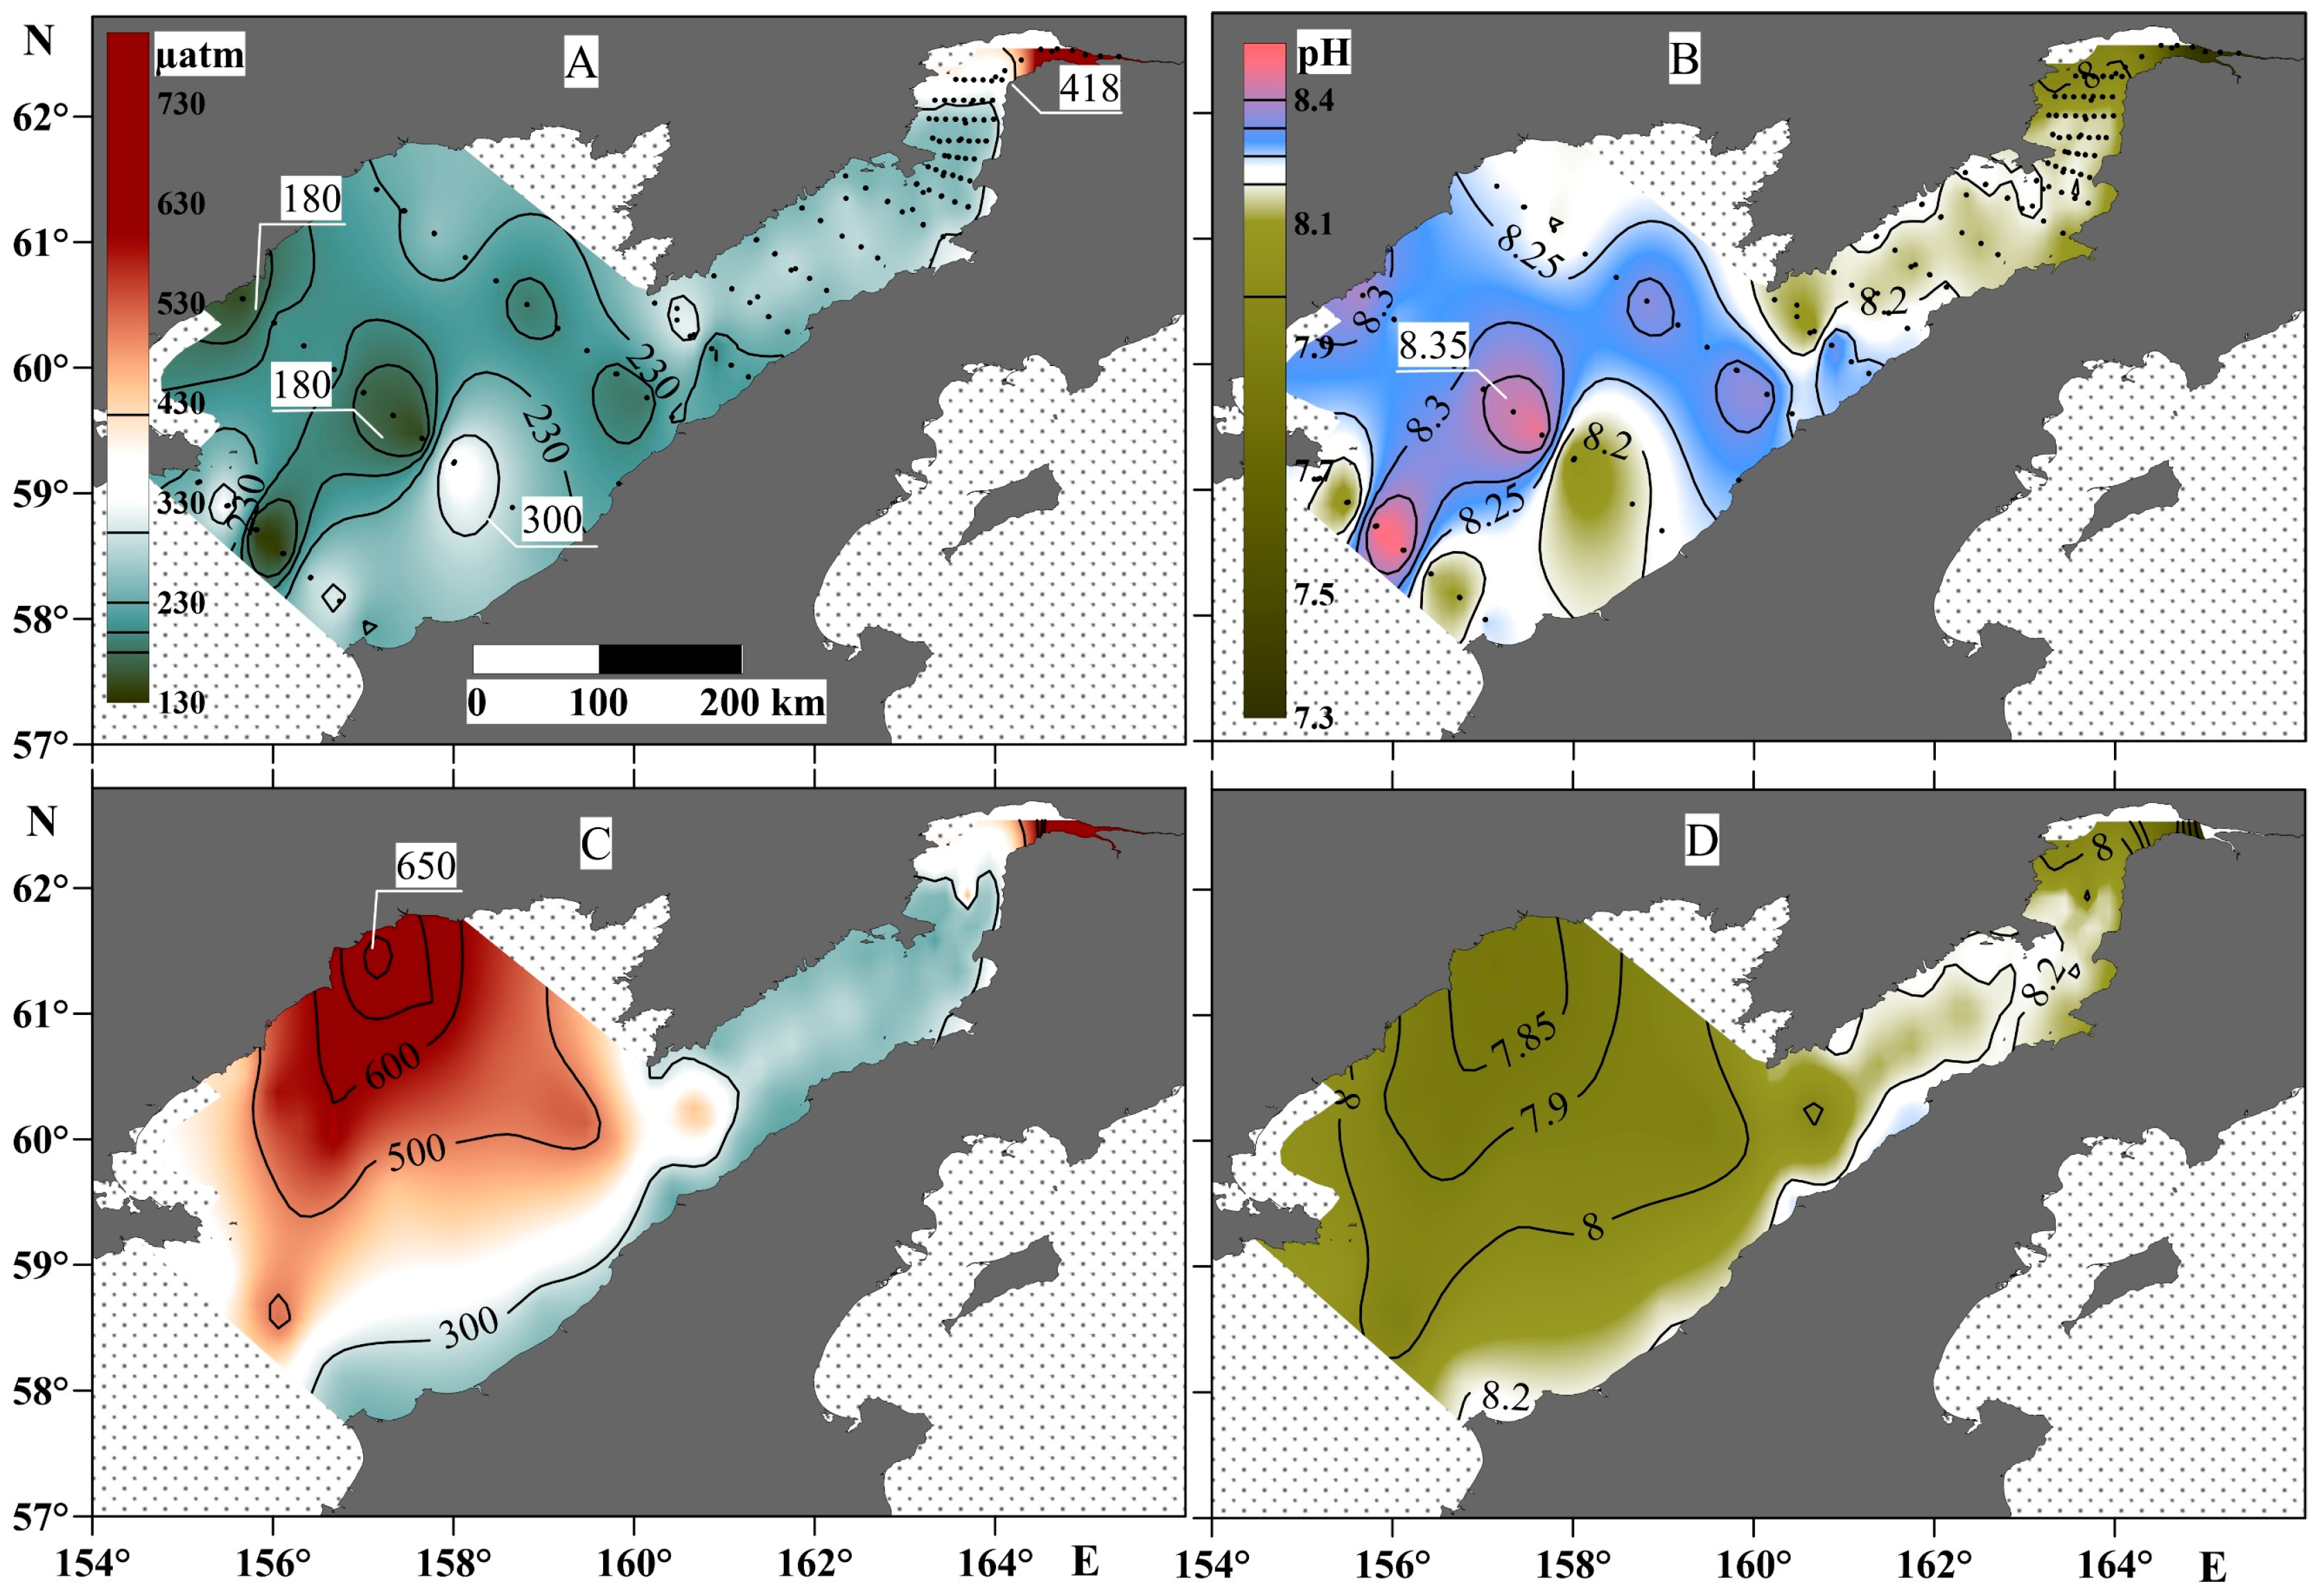
3.1. The Spatial Variability of Salinity and Temperature

There are two specific features to the spatial distribution of temperature and salinity in Penzhina Bay (Figure 4). The water column was almost homogenous in temperature and salinity from the surface to the bottom. In particular, Figure 4 shows that a water temperature of 6 °C was observed throughout the water column in the bay area, and the distribution contour of the 31.5 psu line was almost the same for the surface and bottom water layers, up to a depth of about 50 m. The salinity distribution shows that the effect of the continental runoff is observed over a distance of more than 200 km from the mouth line of the Penzhina River during the period under study. The part of the basin most affected by the river runoff also had an increased water temperature, as far as the river water was relatively warm—about 14 °C. The water column of the Shelikhov Gulf had a more striking vertical distribution of temperature and salinity, especially in its western part. This part was less susceptible to longitudinal tidal currents. The temperature here was about 15 °C with a salinity of 31.5 psu on the surface, but –1.5 °C with a salinity of 33.35 psu at the bottom water layer, a maximum for the area. At the same time, in the central part of the gulf, which is also the deepest as there is a canyon with depths of up to 270 m at the bay mouth, the temperature was in the range of 0–2 °C at a salinity of 33–33.2 psu. This contrast with the hydrological picture obtained in the western part of the Shelikhov Gulf is apparently a consequence of winter processes, during which a cold bottom water layer is formed as a result of convection [48].

3.2. Spatial Variability of the Carbonate System Parameters

The contrast of these hydrological characteristics also affected the distribution of the parameters of the carbonate water system throughout the study area (Figure 5). In particular, the water column in Penzhina Bay was homogenous and undersaturated with CO2 relative to the atmosphere, with a pCO2 value in the range of 230–300 µatm across almost all of the basin. The exception was the part of the basin most affected by the river runoff at the head of the bay, where the pCO2 values of the water were higher than those of the atmosphere for about 50 km from the mouth section of the Penzhina River, which was also evident throughout the water column, from surface to bottom (Figure 5). The pCO2 value in the water column of the western part of the Shelikhov Gulf had the greatest contrast, as did that in the central part of the gulf, with a minimum value at the surface of about 180 µatm and a maximum value in negative-temperature waters of about 650 µatm. The pH value almost mirrored the distribution of the pCO2, and the highest pH value of 8.35 was recorded in the surface water layer of the central part of the Shelikhov Gulf above the canyon, where a clear decrease in the pCO2 was observed, and vice versa—a decrease in pH to 7.85 was observed in the area with the highest pCO2 value.
The TA and DIC values (Figure 6) mainly correspond to the salinity distribution. In particular, the lowest TA and DIC values were observed at the head of Penzhina Bay and in the western part of the Shelikhov Gulf. The TA and DIC values were highest in the surface water layer of the central part of the gulf—2.25 and 2.1 mmol/kg, respectively. However, the maximum TA and DIC values in the bottom layer shifted towards the western part of the Shelikhov Gulf (Figure 6), i.e., to the area with the largest pCO2 values.

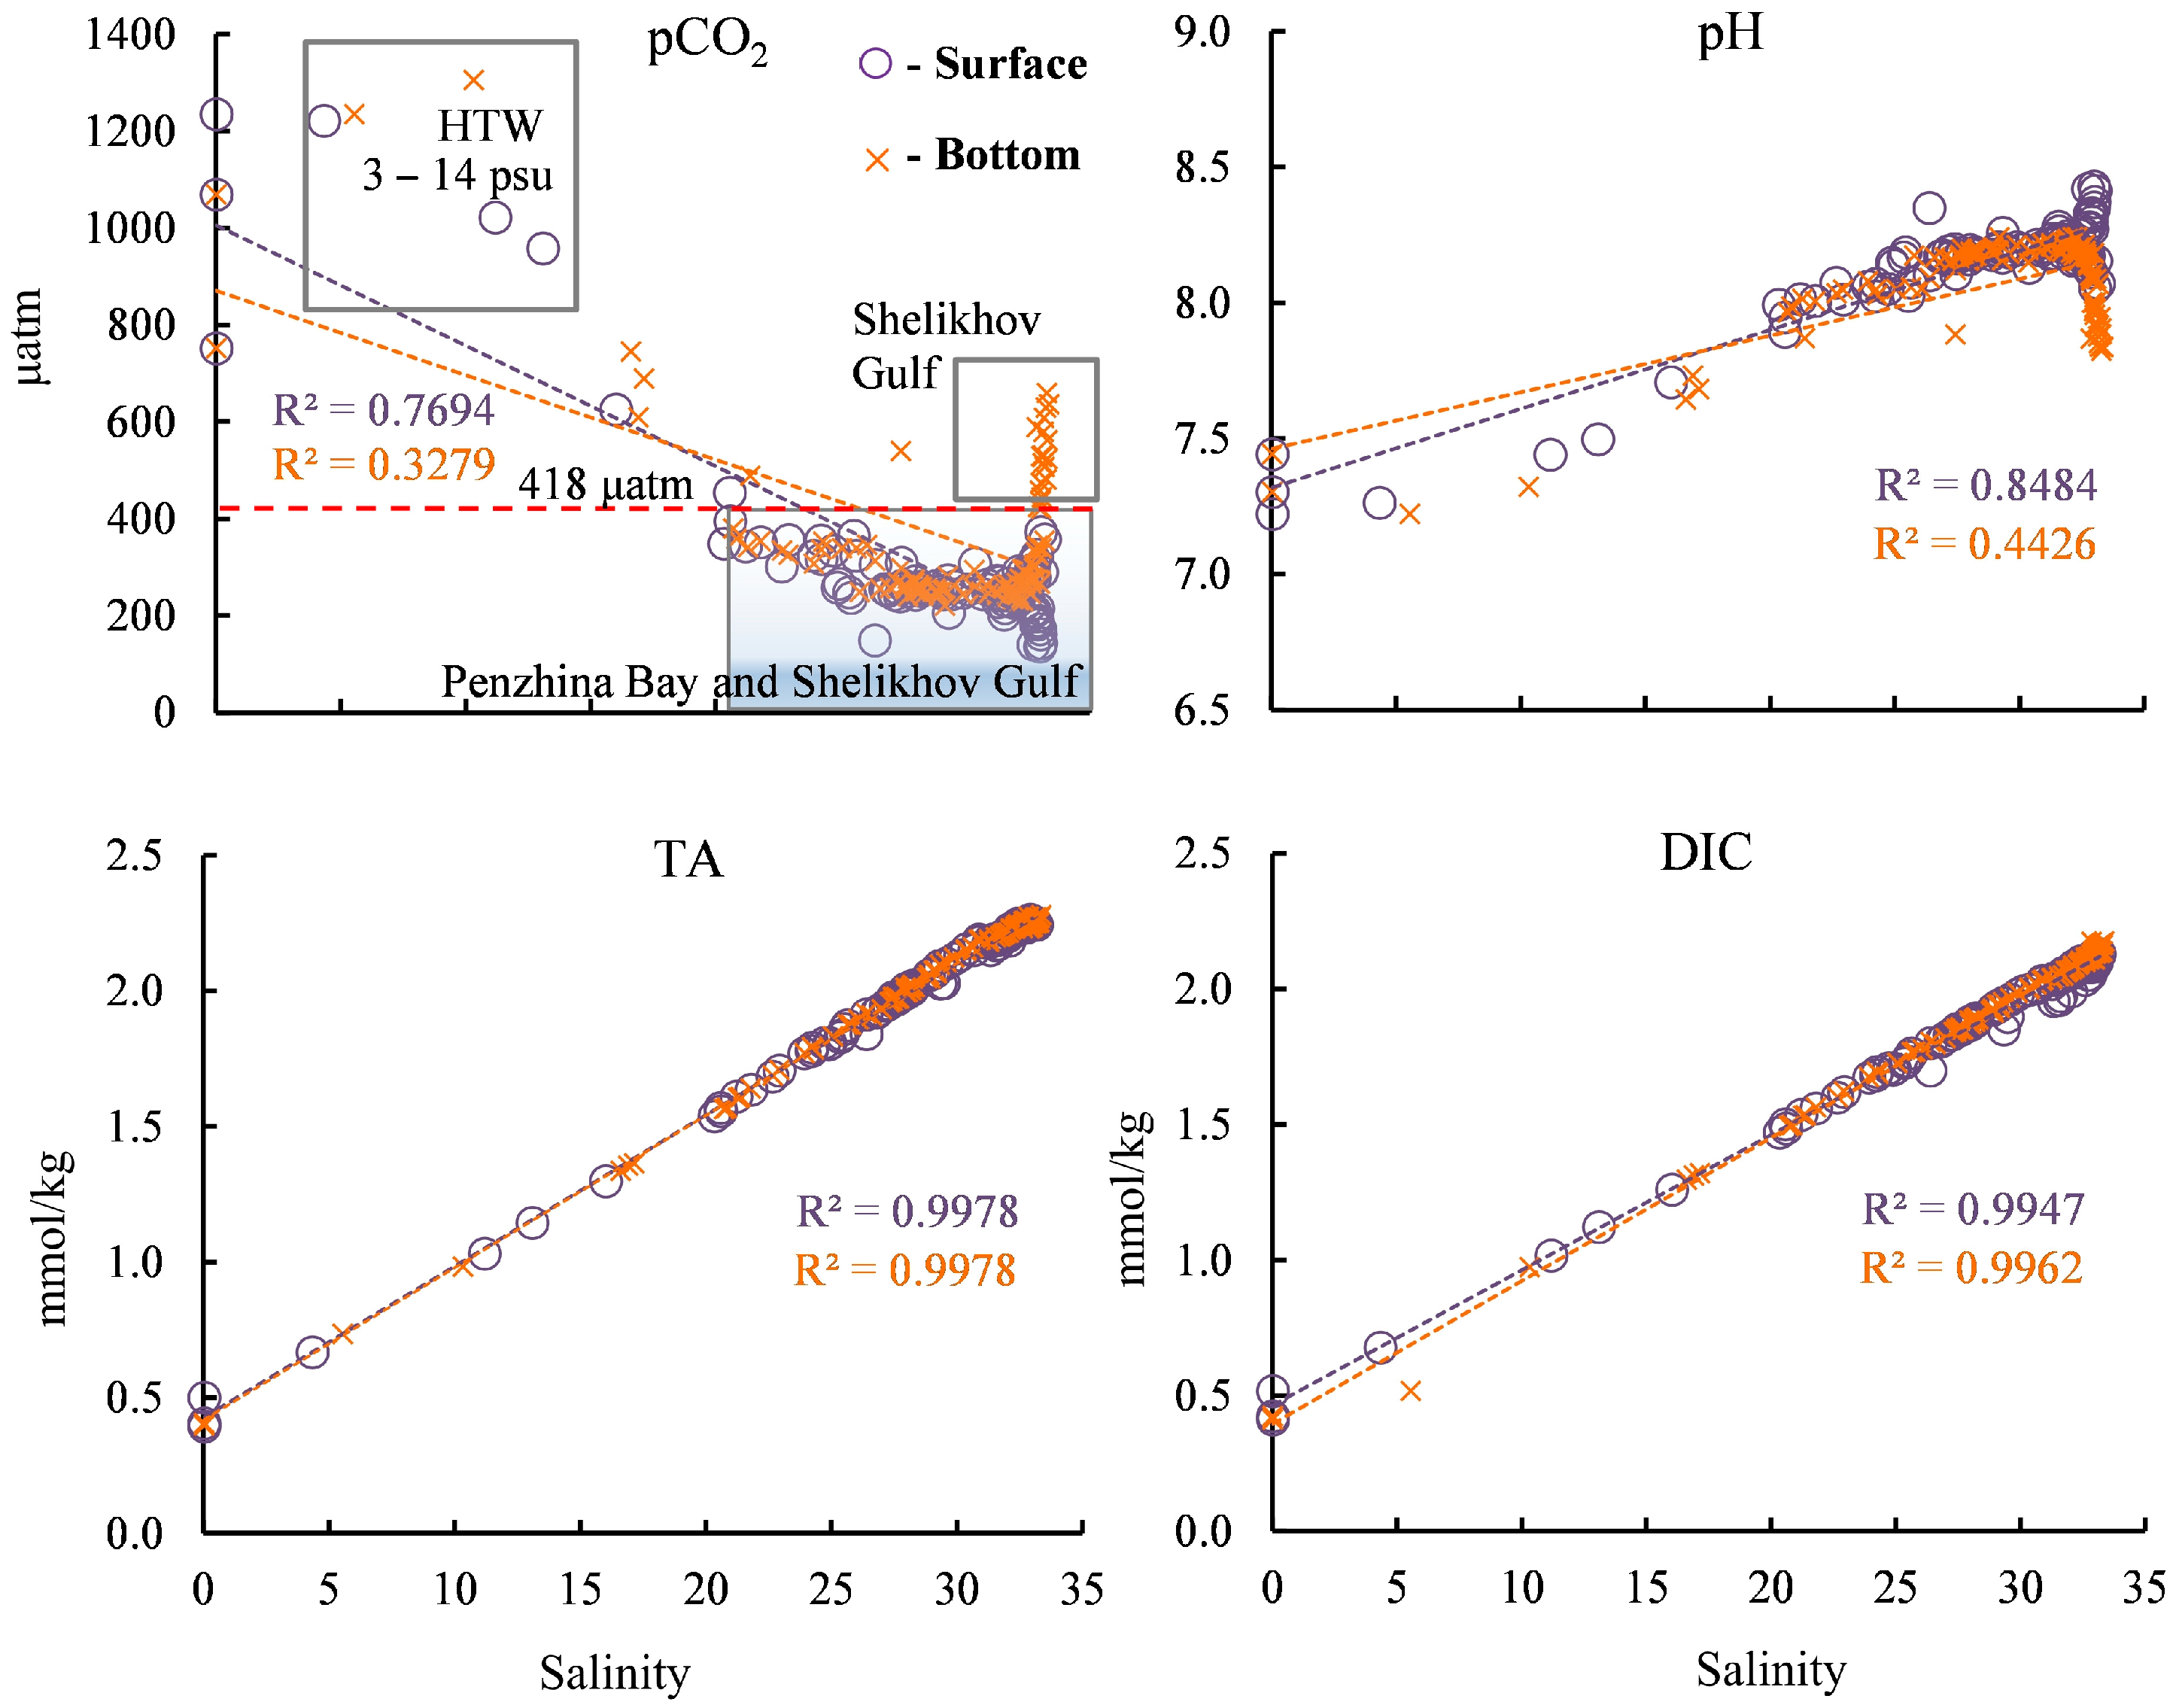
3.3. Variability of the Carbonate System Parameters by Salinity

The highest pCO2 value—1305 µatm—was obtained at a salinity of 10.3 psu in high turbidity water (HTW) (with a salinity range of 3–14 psu (Figure 7)). Beyond a salinity value of 22 psu, the pCO2 value is below its equilibrium value with the atmosphere of 418 µatm, and, in this case, the water absorbs atmospheric CO2.
In general, the pH values presented throughout the salinity range of the study area (Figure 7) mirror the pCO2 values in a manner similar to that observed in their spatial distributions (Figure 5). The pH value in the river water was 7.3–7.5, and then, with the increase in salinity in the bay, this value mainly increased in the surface and bottom water layers, except for a decrease in the bottom waters of the Shelikhov Gulf. The highest pH value, 8.5, was obtained for the waters with the highest salinity in the surface water layer of the Shelikhov Gulf (Figure 7).
The dependence of DIC on water salinity generally echoes the dependence of the TA on salinity (Figure 7). The variability of DIC differs from the variability of TA in several ways for surface layers with a salinity exceeding 25 psu, and these are explained by their production processes.

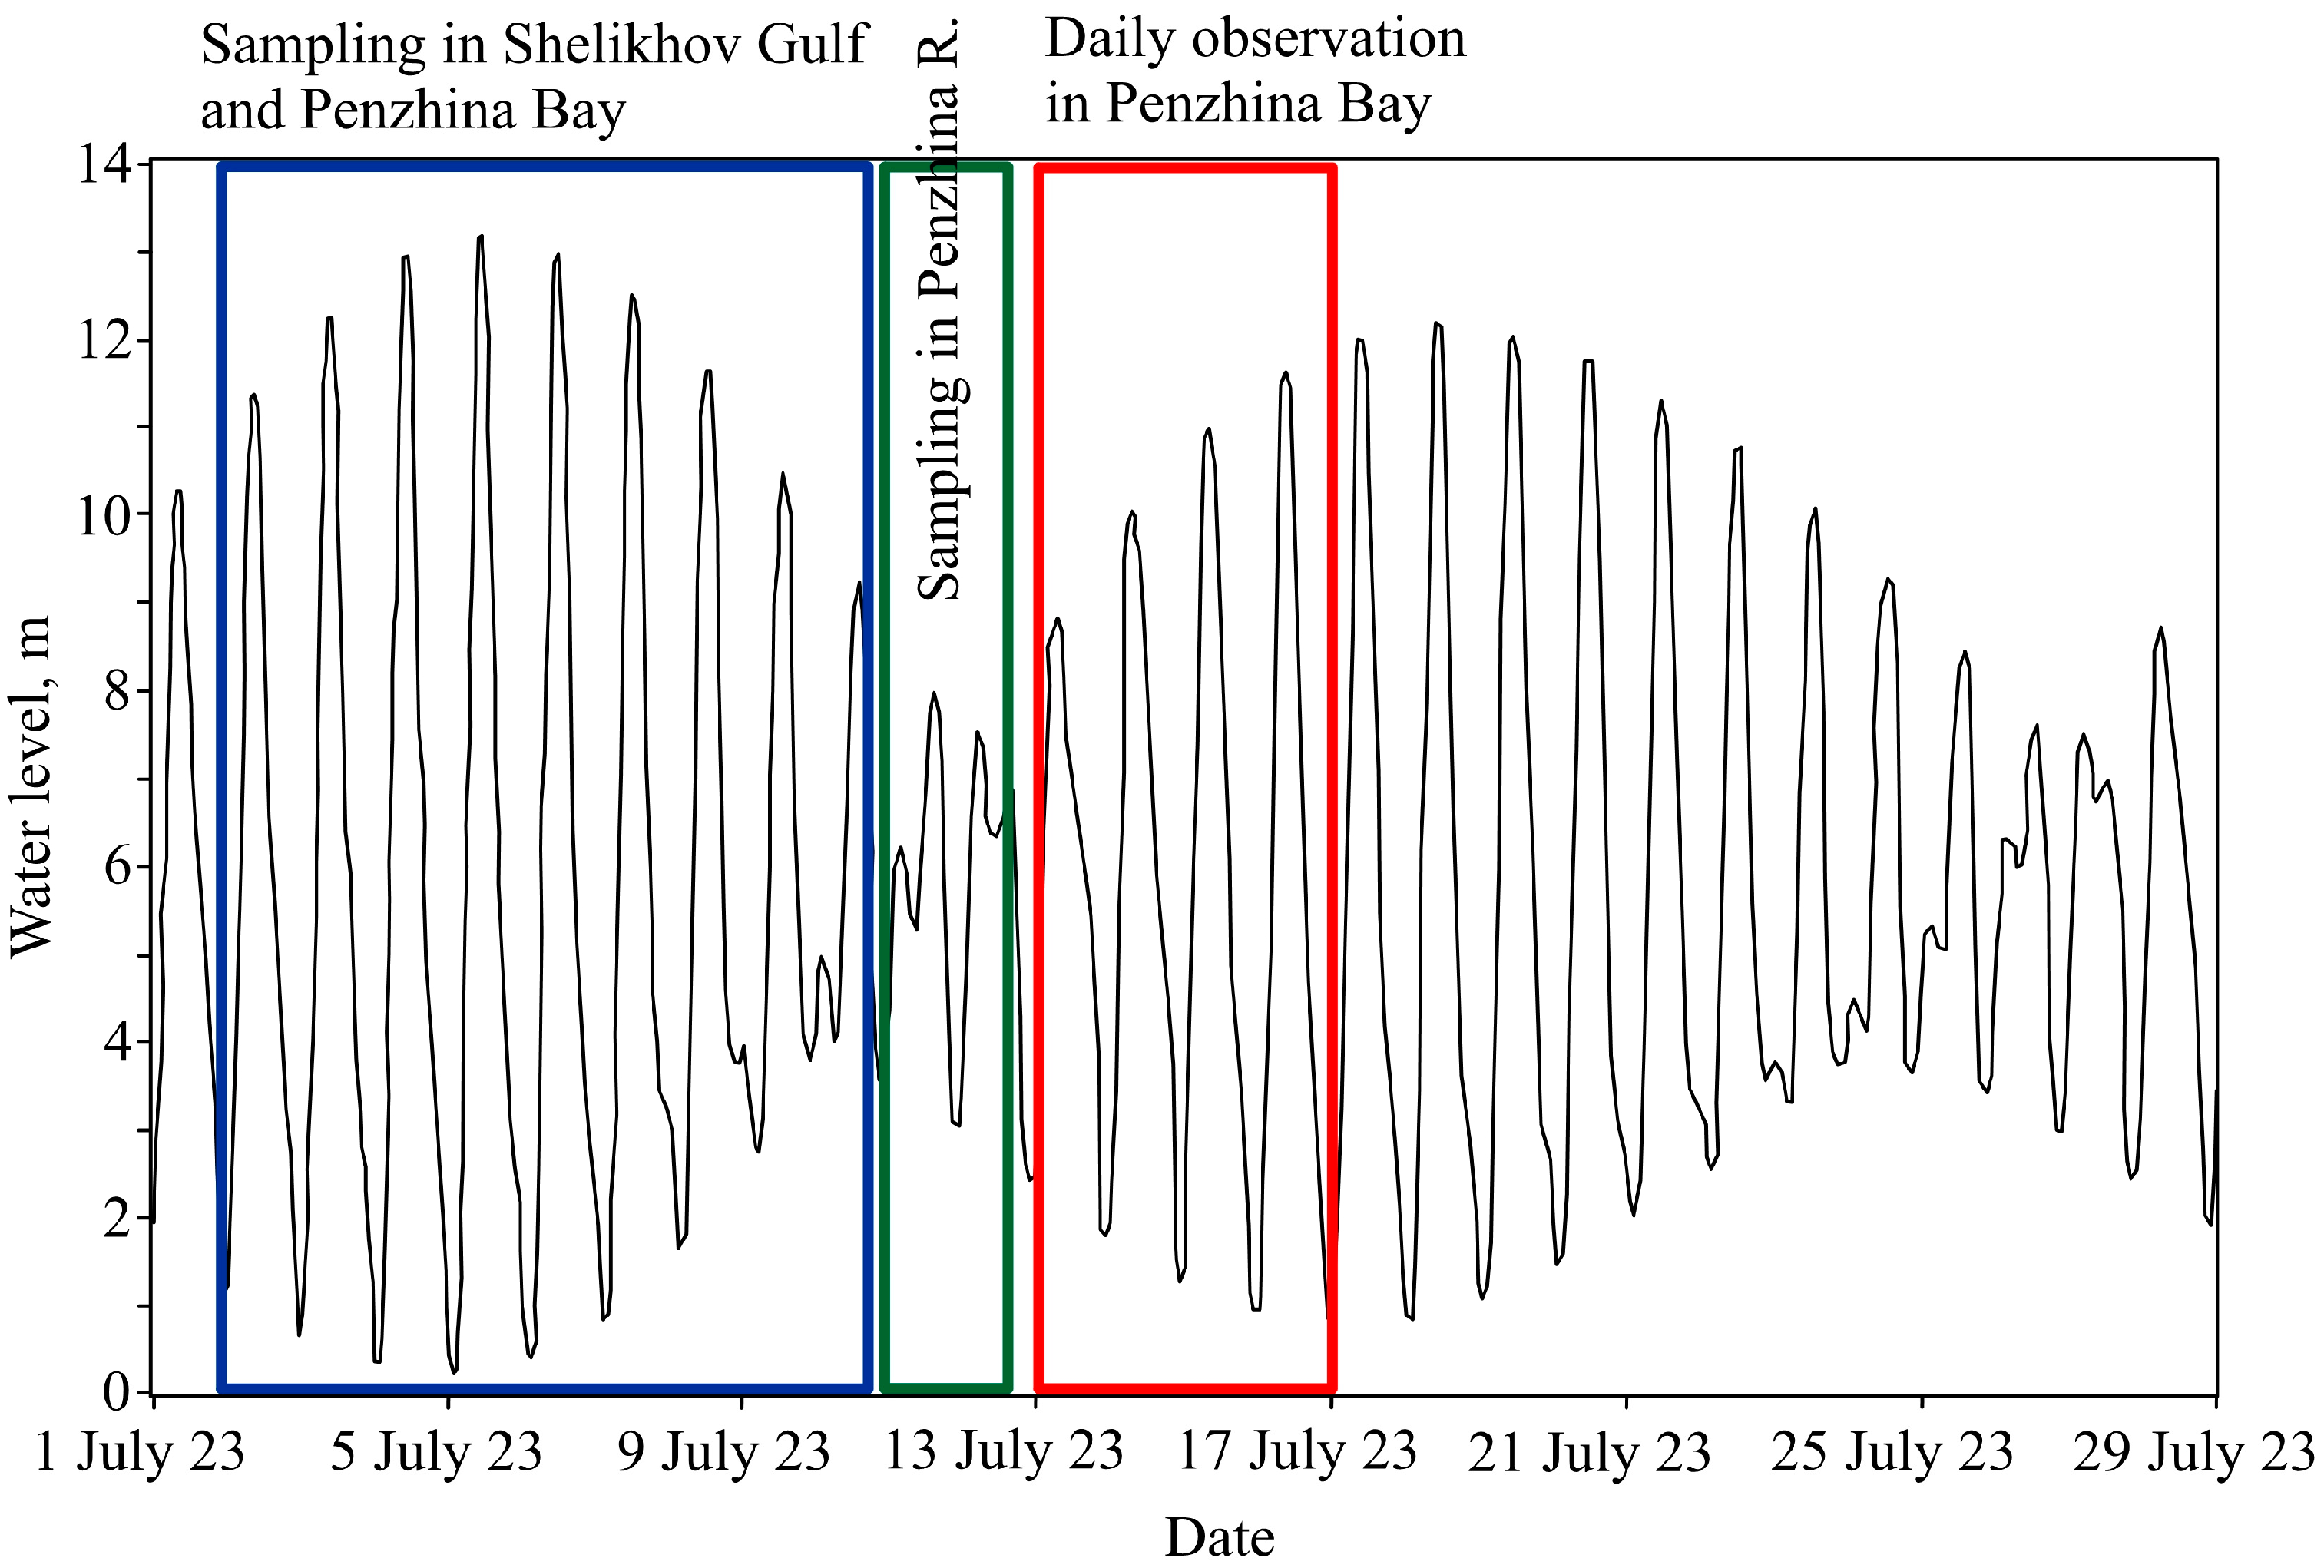
3.4. Daily Variability in Salinity, Temperature, and Carbonate System Parameters

The daily variability in the data obtained at anchored stations St. 1 and St. 2 forms two contrasting areas (Figure 8): St. 1, with a depth of 6–13.5 m per day during measurements, corresponded to a tidal height of about 7.5 m; St. 2, with a depth of 32–40.5 m per day during measurements, corresponded to a tidal height of about 8.5 m. At the top of Penzhina Bay (near St. 1), the influence of the advection of desalinated waters on the diurnal range corresponds to the period of daily tidal waves. This variability is caused by the accumulation of fresh water from the runoff flow of the Penzhina and Talovka Rivers. In particular, during the high-tide phase and the times of high water (Figure 8), a quasi-homogenous structure of the waters, in terms of salinity, temperature, pCO2, and pH, was formed. During the low-tide phase, the surface water layer showed lower salinity, an increase in temperature, and, as a consequence, a more significant increase in its pCO2 and a decrease in its pH compared to the bottom water layer. At periods of low water, the water structure, in terms of its hydrological characteristics and carbonate system parameters, also became quasi-homogenous. Near St. 2, despite the relatively deep water, the water structure was quasi-homogenous practically throughout the entire period of daily observations (Figure 8). However, at periods of low water, for several hours, lower salinity and increased temperature were observed in the surface water layer. This change was not significantly observed in the variation of the pCO2 and pH, even when considering that the scale for St. 2 is significantly larger than the scale for St. 1 (Figure 8).

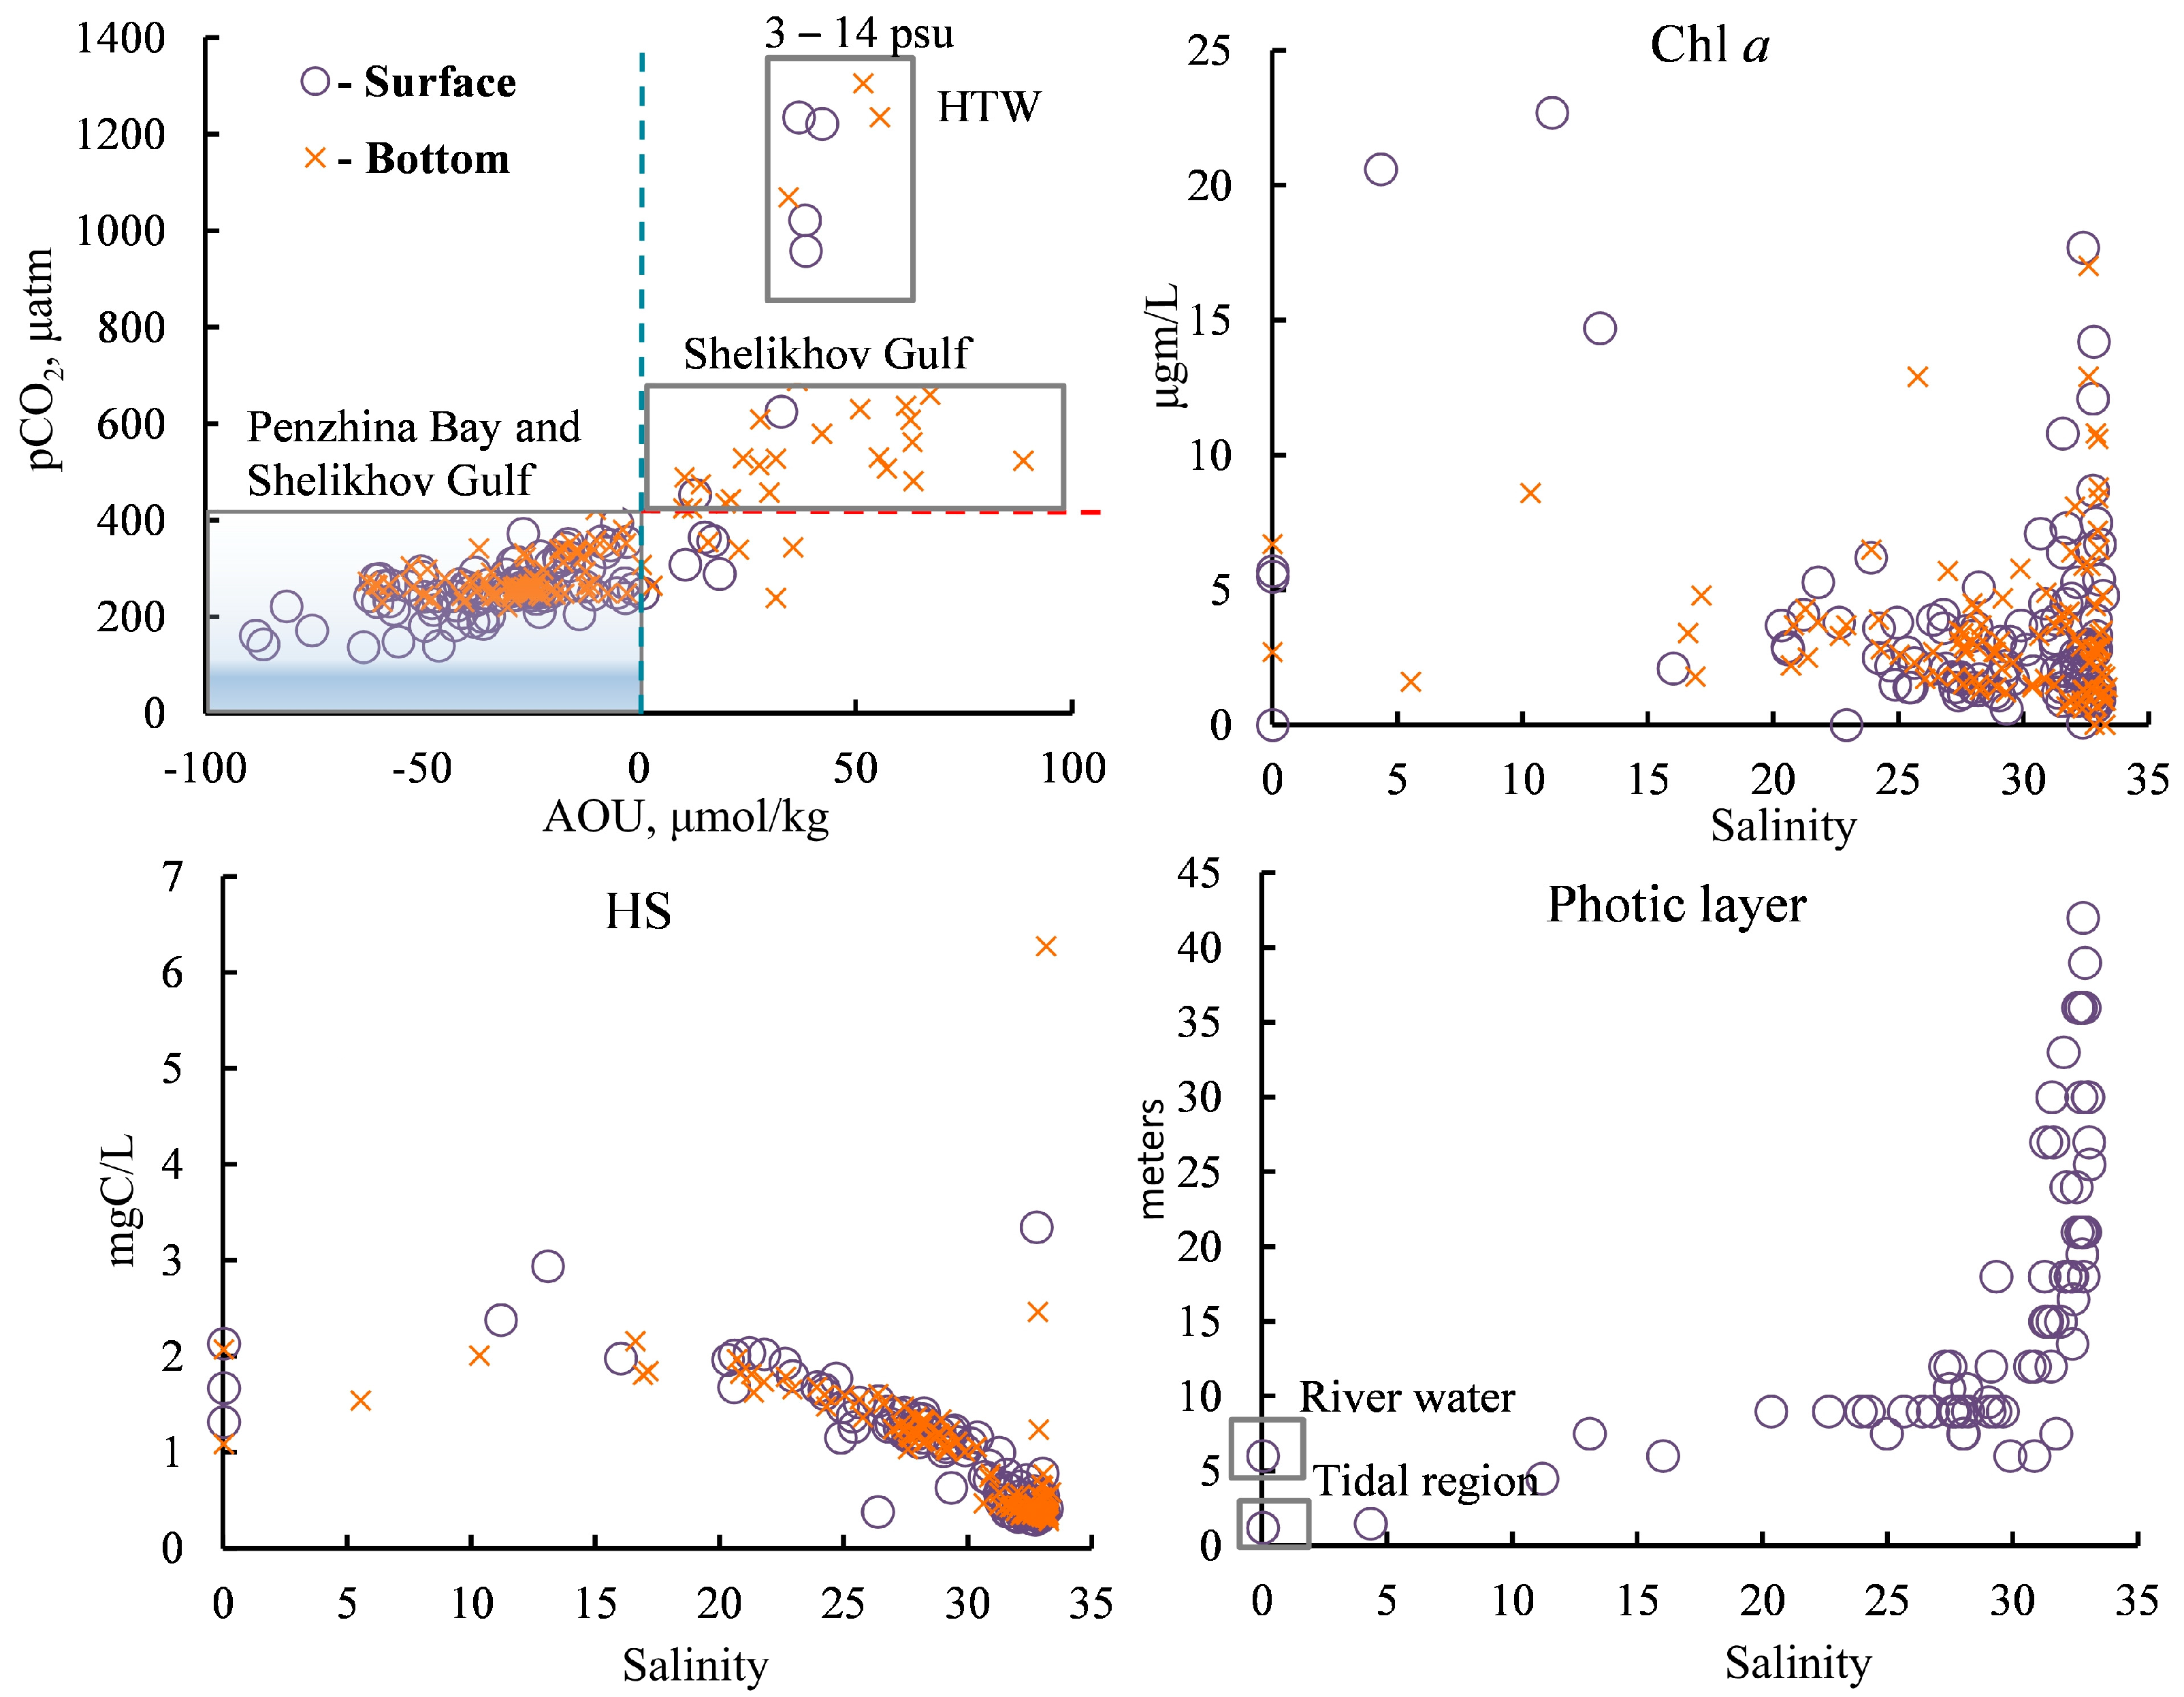
3.5. Distribution of Nutrients as a Factor for Primary Production Intensification and an Accompanying Response of the Carbonate System

In this study, low concentrations of DIN, DIP, Ntot, and Ptot in Penzhina Bay, as well as a significant increase in these in the bottom water layer, were obtained, especially in the Shelikhov Gulf (Figure 9). The main source of DSi was continental runoff (Figure 9). An increase in the DIN and DIP was observed in the tidal effects zone of the river waters, as well as in HTW. The Ptot concentration was also increased in the fresh water in the tidal effects zone, but it was at a minimum in the river far from the sea, where the tides had little effect. This indicates that tidal marshes are an important source of mineral and organic forms of nutrients for Penzhina Bay.
The N/P ratio in coastal waters is used to determine the potential diversity of species in their microalgae [49]. Most N/P mole ratio markers falling in the salinity range of 20–30 psu have a value of less than 6, whereas the N/P ratio increases significantly in the surface and bottom water layers at a salinity of more than 31 psu (Figure 9). The N/P ratio increased significantly in HTW but also, in several cases, fragmentarily in the bottom layers of Penzhina Bay and less frequently in its surface layers. The decrease in DSi concentration relative to the line of conservative mixing (Figure 9) indicates that the growth of diatomic microalgae can be limited.
During the period under study, the DIN and DIP are supplied to the photic zone due to tidal mixing and to Penzhina Bay from the deep part of the Shelikhov Gulf. The main source of DSi is the continental runoff of the largest river in the region, the Penzhina River.

4. Discussion

This discussion focuses on the most significant physical, chemical, and biological processes that determine the parameters of the carbonate system in the region under study. The need to understand the role of this shelf in the global balance of C within the context of global changes in atmospheric CO2 (https://gml.noaa.gov/ccgg/trends/ (accessed on 5 December 2023)) leads to the need to estimate the FCO2 in water/atmosphere systems and to identify the main controlling factors of this flux.

4.1. Tidal Effects

The similarity in the vertical distributions of the hydrological characteristics and parameters of the carbonate system in Penzhina Bay (Figure 4, Figure 5, Figure 6 and Figure 7) indicates that physical mixing is the main control process at work. High tidal energy is known to contribute to the resuspension of bottom sediments and the additional supply of nutrients from bottom sediments to the water column, which stimulates the rate of phytoplankton production [19]. On the other hand, the turbidity of water increases during such an event, which determines the light conditions in the water column and thus affects the state of phytoplankton and the direction of their production/destruction processes [50]. In estuaries with intensive tidal mixing, increased turbidity can lead to ecosystem phenomena such as hypoxia [51]. Bank erosion, as a result of dynamic processes, leads to increased turbidity in the estuaries of the Penzhina and Talovka Rivers [39,40]. In addition, the high rate of erosion may be the result of the melting of permafrost that exists on their shores (Section 2.1). The suspended solids in permafrost contain organic compounds and clay minerals, the main natural adsorbents for forming flocculi in the sorption system of the marginal filter [52]. Sorption/desorption processes additionally contribute to the formation of extreme turbidity [53,54]. It is likely that, in the mouth sections of the Penzhina and Talovka Rivers, both processes—physical disturbance and sorption/desorption—complement each other, with cyclic changes in salinity occurring due to tides. Thus, turbidity anomalies are formed during certain tidal phases at the head of Penzhina Bay.
For the Shelikhov Gulf, tidal mixing was observed in the deep central part above the canyon (Figure 1). Tidal mixing leads to the intensification of phytoplankton’s primary production in the surface water layer and to an accompanying response of the carbonate system parameters. Tidal mixing is widely discussed by the authors of [55] and the references listed in that paper, including in the context of its effect on the intensity of the primary production in the Sea of Okhotsk [56]. As can be seen from our results (Figure 4, Figure 5, Figure 6 and Figure 7), tidal mixing results in a quasi-homogenous structure of the waters in terms of their hydrological and hydro-chemical characteristics throughout Penzhina Bay.

4.2. Response of the Carbonate System to the Production/Destruction Balance of OM

The relationship between the pCO2 and AOU (Figure 10) shows that the CO2 content of these waters is mainly controlled by their OM production/destruction balance, while the TA and DIC mainly describe the conservative mixing of river and sea waters (Figure 7). Production dominates over destruction in the surface layer of the entire basin under study as there is a strong undersaturation of CO2 and negative AOU values. In Penzhina Bay, tidal mixing results in a quasi-homogenous structure down to the bottom of the bay, and, in this case, the magnitude of the characteristics under study is almost identical throughout the water column.
The photic zone thickness decreased at salinities of less than 20 psu, and, as a result, the destruction rate of OM exceeded its production rate in this part of the basin. In this case, primary production is limited by the PAR conditions, and water is a source of CO2, whereas the photic zone thickness increased sharply for waters with a salinity of more than 27 psu (Figure 10) and was comparable to the depth of the basin. In addition to the decrease in turbidity, the key factor for the high PAR in this part of the basin was probably the beginning of a period with PAR present for almost 24 h a day, which is typical for subpolar latitudes in July.
In general, the dominance of the destruction of OM on the surface of Penzhina Bay and in the deep waters of the Shelikhov Gulf was accompanied by an increase in AOU, pCO2, HSs, and nutrients and a decrease in the pHin situ, while the dominance of primary production led to the opposite picture in the main part of the Penzhina Bay basin, where there was the salinity of more than 22 psu, and in the surface waters of the Shelikhov Gulf (Figure 5,Figure 7,Figure 9 and Figure 10).

4.3. CO2 flux in the Water/Atmosphere System and the Potential Effect of Wind Conditions on its Intensity

As stated above, the high variability of the carbonate system parameters and, as a consequence, the FCO2 at the water/atmosphere boundary are caused by the complexity of the interactions between physical, chemical, and biological factors. In this case, estimates for the entire basin will be inadequate if it is treated as a fixed body. In this study, to obtain a general idea of the fluctuations of CO2 at the water/atmosphere boundary, our calculations were performed for typical minimal and maximal wind speeds, 3 and 12 m/s, respectively, and for actual wind speeds (Figure 11). The actual wind speeds varied greatly during the day and sometimes during the period of the station’s operation: within an hour. The use of the global atmospheric pCO2 value makes it possible to exclude the local noise also associated with the wind variability near coasts, leading to errors in the local estimates of fluxes or requiring additional simulation studies of the atmosphere in the region. In this study, the highest FCO2 value coincides spatially with the area of the lowest pCO2 value in the Shelikhov Gulf, which was mainly controlled by the intensity of photosynthesis. At the same time, despite a slightly lower FCO2 value in the main part of the Penzhina Bay basin, the entire water column of this water body is undersaturated with CO2 relative to the atmosphere. Consequently, the increase in mixing intensity will contribute to an increase in the FCO2, as mixing will prevent the establishment of an equilibrium as a result of gas exchange at the water/atmosphere boundary. Tidal mixing in the Shelikhov Gulf may sometimes change the value of its FCO2, since its deep waters were significantly oversaturated with CO2 relative to the atmosphere.
In many cases, it has been reported that the FCO2 increases significantly with increasing wind [16,46,47] since wind speed is one of the key factors in these estimates [15]. Since U2 is the main variable in the calculations of the FCO2, slight changes in wind speed will result in significant variations of the FCO2, which are also determined by the pCO2 value of the surface water layer. It is to be expected that, throughout oceanographic studies that take weeks and sometimes months, environmental conditions and especially wind speeds will vary from station to station. In turn, the pCO2 is mainly controlled by vertical mixing and the intensity of primary production, while the FCO2 depends on the wind. Figure 11 shows that the actual FCO2 calculated from measured wind speeds at specific locations can increase from 100 to 250 mmol m−2 day−1 over distances of less than 50 km. This result highlights the need for caution in the use of wind speed models in FCO2 estimates in cases of a shortage of observations made on vessels.

4.4. Comparison with Other Coastal Areas and Estuaries

The basin discussed in this paper differs from anthropogenically loaded areas, for example, shallow subtropical estuaries [19], heavily polluted European estuaries [57]. Asian estuaries with rapid industrial development at the catchment areas of eutrophic rivers [20,21,22,25,26,27], estuaries in the Russian Far East [23,24], and the heavily polluted estuaries of India [16,28,58]. As a rule, the central issue of these basins is the discussion of their carbonate systems under conditions of ecosystem instability due to anthropogenic eutrophication and, as a consequence, the high pCO2 levels of their bottom waters and often surface waters. Estuaries located near highly industrialized areas have increased loads of organic carbon and nutrients and are considered to be permanently or seasonally heterotrophic ecosystems that supply CO2 to the atmosphere. However, large river plumes, including the plumes of anthropogenically loaded rivers, often become CO2 sinks, even many hundreds of kilometers away from the river mouth [59]. The examples of previously studied river estuaries able to absorb pCO2 in their plumes are the Yangtze River [60], the Pearl River Estuary [25], Chesapeake Bay [26], the Gulf of Anadyr [47], the Kara Sea, under the influence of the Ob River and the Yenisei River [61], and the estuary of the Amur River [62]. In such basins, only the surface water layer is usually undersaturated with CO2, while the magnitude of the pCO2 increases significantly with the depth of the water column. A fundamental feature of Penzhina Bay is a water column that is homogenous in depth all the way down and undersaturated with CO2 across almost its entire length, except for a small part at the mouth of the Penzhina River. As its depth increases, the bottom waters at depths greater than 60 m become supersaturated with CO2 relative to the atmosphere.
A high intensity of primary production and the accompanying response of the carbonate system of the waters in subpolar regions is also noted for the Bering Sea [46,63,64]. For Penzhina Bay, located at a subpolar latitude, lighting conditions are a key factor in the high intensity of primary production in summer, as these latitudes begin to be affected by the “polar day” in July. In this case, the around-the-clock presence of PAR is accompanied by the intensification of primary production if there is a sufficient supply of nutrients [65].
Another feature of the region under study is that upwelling is accompanied by an undersaturation of CO2 despite the additional CO2 in the deep waters in the Shelikhov Gulf. This is consistent with the recent results in [37,66], which reported that the upwelling of waters rich in DIC and nutrients will lead to carbon transfer to the upper layer, while associated humic substances promote phytoplankton growth, which increases the biological uptake of CO2. This process is also accompanied by changes in the structure of phytoplankton communities [36], which can also indirectly influence the carbonate system through the intensity of their OM production/destruction balance.
The increase in the DIN concentration at the top of Penzhina Bay is also probably related to the supply of nutrients from tidal marshes, as this also occurs in many salt marshes [30,31,32,33]. However, understanding the contribution of different sources to the water’s nutrients requires additional research, which we plan to carry out in the future.
Much more research is needed on seasonal and diurnal ranges to understand the common features and differences in the carbon chemistry of the Sea of Okhotsk’s estuaries, as well as the magnitude of their contribution to the global balance of C, since the seasonal influence of natural factors such as runoff, ice melting, the influence of tidal mixing, atmospheric additions due to volcanoes, and salmon homing remains unclear, especially on the scale of interannual variability. Therefore, the authors of this paper believe that the unique basins of the Sea of Okhotsk will continue to attract scientific attention in the coming years in terms of the natural factors governing their carbon chemistry.

5. Conclusions

In this study, we report on measurements obtained for a basin with extreme tides—Penzhina Bay and the Shelikhov Gulf—after passing the peak of its spring–summer flooding and establishing its maximum intra-annual water temperature. The results represent the state of an ecosystem that is barely affected by human activities. As a result of this study, the following conclusions were made:
  • The dominance of primary production is accompanied by CO2 undersaturation relative to the atmosphere throughout the water column of Penzhina Bay, except for a small part at its head, down to a depth of about 60 m, with a water salinity of less than 22 psu. As a consequence, the water in the main part of the basin absorbs CO2 from the atmosphere, while its water is a source of CO2 for the atmosphere. This distribution is observed regardless of the time of day, as solar illumination persists for almost 24 h a day at this latitude at this time of year.
  • In the Shelikhov Gulf, in the area above the central canyon, influenced by tidal mixing, the lowest pCO2 values were found for the entire region under study, which are associated with the dominance of primary production despite the supply of additional CO2 from the deep waters in this area.
  • The TA and DIC depend almost strictly on salinity, with correlation coefficients higher than 0.99, while the pH value almost mirrors this with its dependence on the pCO2 and is determined by a combination of factors: the balance of the production/destruction of organic matter and the buffer capacity of the water, which is determined by its alkalinity.

Supplementary Materials

The following supporting information can be downloaded at: https://www.mdpi.com/article/10.3390/jmse12030517/s1, Figure S1: Dependence of the AOU on salinity.

Author Contributions

P.S.: Writing—Original draft, Conceptualization, Methodology, Formal Analysis, Investigation, and Funding Acquisition. K.B.: Formal Analysis, Investigation, and Conceptualization. Y.B.: Methodology, Formal Analysis, and Investigation. S.G.: Investigation and Conceptualization. A.K.: Methodology, Formal Analysis, and Investigation. S.S.: Methodology, Formal analysis, and Investigation. O.U.: Methodology, Formal Analysis, and Investigation. P.T. (Petr Tishchenko): Methodology, Formal Analysis, Investigation, and Review and Editing. M.S.: Methodology, Formal Analysis, and Investigation. E.S.: Methodology, Formal Analysis, and Investigation. P.T. (Pavel Tishchenko): Review and Editing, Investigation, Conceptualization, and Supervision. J.Z.: Investigation and Conceptualization. All authors have read and agreed to the published version of the manuscript.

Funding

This work was supported by the Russian Science Foundation (Project No. 23-77-10001 at Ilichev Pacific Oceanological Institute, Far Eastern Branch Russian Academy of Sciences (Reg. No. 121021500052-9)).

Institutional Review Board Statement

Not applicable.

Informed Consent Statement

Informed consent was obtained from all subjects involved in the study.

Data Availability Statement

Data are contained within the article.

Acknowledgments

The support of the scientific group and crew of R/V Akademik Oparin was greatly appreciated.

Conflicts of Interest

The authors declare no conflicts of interest.

References

  1. Gruber, N. Ocean biogeochemistry: Carbon at the coastal interface. Nature 2015, 517, 148–149. [Google Scholar] [CrossRef]
  2. Gao, Y.; Jia, J.; Lu, Y.; Sun, K.; Wang, J.; Wang, S. Carbon transportation, transformation, and sedimentation processes at the land-river-estuary continuum. Fundam. Res. 2022; in press. [Google Scholar] [CrossRef]
  3. Battin, T.J.; Lauerwald, R.; Bernhardt, E.S.; Bertuzzo, E.; Gener, L.G.; Hall, R.O., Jr.; Hotchkiss, E.R.; Maavara, T.; Pavelsky, T.M.; Ran, L.; et al. River ecosystem metabolism and carbon biogeochemistry in a changing world. Nature 2023, 613, 449–459. [Google Scholar] [CrossRef]
  4. Laruelle, G.G.; Dürr, H.H.; Slomp, C.P.; Borges, A.V. Evaluation of sinks and sources of CO2 in the global coastal ocean using a spatially explicit typology of estuaries and continental shelves. Geophys. Res. Lett. 2010, 37, L15607. [Google Scholar] [CrossRef]
  5. Wanninkhof, R.; Park, G.-H.; Takahashi, T.; Sweeney, C.; Feely, R.; Nojiri, Y.; Gruber, N.; Doney, S.C.; McKinley, G.A.; Lenton, A.; et al. Global ocean carbon uptake: Magnitude, variability and trends. Biogeosci. Discuss. 2012, 10, 10961–11012. Available online: https://bg.copernicus.org/preprints/9/10961/2012/bgd-9-10961-2012.pdf (accessed on 1 March 2024). [CrossRef]
  6. Dickson, A.G.; Sabine, C.L.; Christian, J.R. (Eds.) Guide to Best Practices for Ocean CO2 Measurements; PICES Special Publication 3; PICES: Sidney, BC, Canada, 2007; p. 191. Available online: http://hdl.handle.net/11329/249 (accessed on 5 December 2023).
  7. Smith, S.V.; Hollibaugh, J.T. Coastal metabolism and the oceanic organic carbon balance. Rev. Geophys. 1993, 31, 75–89. [Google Scholar] [CrossRef]
  8. Millero, F.G.; Hiscock, W.T.; Huang, F.; Roche, M.; Zhang, J.Z. Seasonal variation of the carbonate system in Florida Bay. Bull. Mar. Sci. 2001, 68, 101–123. [Google Scholar]
  9. Chen, C.-T.A.; Huang, T.-H.; Chen, Y.-C.; Bai, Y.; He, X.; Kang, Y. Air-sea exchanges of CO2 in the world's coastal seas. Biogeosciences 2013, 10, 6509–6544. [Google Scholar] [CrossRef]
  10. Borges, A.V. Do we have enough pieces of the jigsaw to integrate CO2 fluxes in the coastal ocean? Estuaries 2005, 28, 3–27. [Google Scholar] [CrossRef]
  11. Cai, W.J. Estuarine and coastal ocean carbon paradox: CO2 sinks or sites of terrestrial carbon incineration? Annu. Rev. Mar. Sci. 2011, 3, 123–145. [Google Scholar] [CrossRef] [PubMed]
  12. Margalef, R. Life-forms of phytoplankton as survival alternatives in an unstable environment. Oceanol. Acta 1978, 1, 493–509. Available online: https://archimer.ifremer.fr/doc/00123/23403/21230.pdf (accessed on 1 March 2024).
  13. Bauer, J.E.; Cai, W.J.; Raymond, P.A.; Bianchi, T.S.; Hopkinson, C.S.; Regnier, P.A. The changing carbon cycle of the coastal ocean. Nature 2013, 504, 61–70. [Google Scholar] [CrossRef]
  14. Polsenaere, P.; Delille, B.; Poirier, D.; Charbonnier, C.; Deborde, J.; Mouret, A.; Abril, G. Seasonal, Diurnal, and Tidal Variations of Dissolved Inorganic Carbon and pCO2 in Surface Waters of a Temperate Coastal Lagoon (Arcachon, SW France). Est. Coasts 2023, 46, 128–148. [Google Scholar] [CrossRef]
  15. Wanninkhof, R. Relationship between wind speed and gas exchange over the ocean revisited. Limnol. Oceanogr. Methods. 2014, 12, 351–362. [Google Scholar] [CrossRef]
  16. Akhtar, S.; Equeenuddin, S.M.; Bastia, F. Distribution of pCO2 and air-sea CO2 flux in Devi estuary, eastern India. Appl. Geochem. 2021, 131, 105003. [Google Scholar] [CrossRef]
  17. Li, Y.; Yang, H.; Zhang, L.; Yang, X.; Zang, H.; Fan, W.; Wang, G. The spatiotemporal variation and control mechanism of surface pCO2 in winter in Jiaozhou Bay, China. Cont. Shef Res. 2020, 206, 104208. [Google Scholar] [CrossRef]
  18. Yang, B.; Zhang, Z.; Xie, Z.; Chen, B.; Zheng, H.; Liao, B.; Zhou, J.; Xiao, B. Seasonal Controls of Seawater CO2 Systems in Subtropical Coral Reefs: A Case Study from the Eastern Coast of Shenzhen, China. Water 2023, 15, 4124. [Google Scholar] [CrossRef]
  19. Yates, K.K.; Dufore, C.; Smiley, N.; Jackson, C.; Halley, R.B. Diurnal variation of oxygen and carbonate system parameters in Tampa Bay and Florida Bay. Mar. Chem. 2007, 104, 110–124. [Google Scholar] [CrossRef]
  20. Zhang, J.; Du, Y.N.; Zhang, G.S.; Chang, Y.; Zhou, Y.C.; Zhang, Z.F.; Wu, Y.; Chen, J.W.; Zhang, A.Y.; Zhu, Z.Y.; et al. Increases in the seaward river flux of nutrients driven by human migration and land-use changes in the tide-influenced delta. Sci. Total Environ. 2021, 761, 144501. [Google Scholar] [CrossRef] [PubMed]
  21. Zhang, S.; Zhang, H. Anthropogenic impact on long-term riverine CODMn, BOD, and nutrient flux variation in the Pearl River Delta. Sci. Total Environ. 2023, 859, 160197. [Google Scholar] [CrossRef]
  22. Wu, W.; Zhai, F.; Liu, Z.; Liu, C.; Gu, Y.; Li, P. The spatial and seasonal variability of nutrient status in the seaward rivers of China shaped by the human activities. Ecol. Indic. 2023, 157, 111223. [Google Scholar] [CrossRef]
  23. Tishchenko, P.Y.; Tishchenko, P.P.; Lobanov, V.B.; Mikhaylik, T.A.; Sergeev, A.F.; Semkin, P.Y.; Shvetsova, M.G. Impact of the transboundary Razdolnaya and Tumannaya Rivers on deoxygenation of the Peter the Great Bay (Sea of Japan). Estuar. Coast. Shelf Sci. 2020, 239, 106731. [Google Scholar] [CrossRef]
  24. Tishchenko, P.Y.; Mikhaylik, T.A.; Pavlova, G.Y.; Barabanshchikov, Y.A.; Semkin, P.Y. Seasonal Variations in the Carbonate System of the Razdolnaya River. Water Res. 2023, 50, 96–108. [Google Scholar] [CrossRef]
  25. Chen, B.; Tan, E.; Zou, W.; Han, L.-L.; Tian, L.; Kao, S.-J. The external/internal sources and sinks of greenhouse gases (CO2, CH4, N2O) in the Pearl River Estuary and adjacent coastal waters in summer. Water Res. 2023, 249, 120913. [Google Scholar] [CrossRef]
  26. Shen, C.; Testa, J.M.; Li, M.; Chen, B.; Cai, W.-J. Interannual variability of air-water CO2 flux in a large eutrophic estuary. Water Res. 2023, 244, 120523. [Google Scholar] [CrossRef] [PubMed]
  27. Guo, X.; Su, J.; Guo, L.; Liu, Z.; Yang, W.; Li, Y.; Yao, Z.; Wang, L.; Dai, M. Coupling of Carbon and Oxygen in the Pearl River Plume in Summer: Upwelling, Hypoxia, Reoxygenation and Enhanced Acidification. J. Geoph. Res. Oceans. 2023, 128, e2022JC019326. [Google Scholar] [CrossRef]
  28. Sarma, V.V.S.S. Role of inter-annual variability in the magnitude of river discharge on CO2 fluxes in the Godavari tidal river zone, India. Estuar. Coast. Shelf Sci. 2023, 290, 108393. [Google Scholar] [CrossRef]
  29. Santos, I.R.; Maher, D.T.; Larkin, R.; Webb, J.R.; Sanders, C.J. Carbon outwelling and outgassing vs. burial in an estuarine tidal creek surrounded by mangrove and saltmarsh wetlands. Limnol. Oceanogr. 2019, 64, 996–1013. [Google Scholar] [CrossRef]
  30. Xiao, K.; Wu, J.P.; Li, H.L.; Hong, Y.G.; Wilson, A.M.; Jiao, J.J.; Shananan, M. Nitrogen fate in a subtropical mangrove swamp: Potential association with seawater-groundwater exchange. Sci. Total Environ. 2018, 635, 586–597. [Google Scholar] [CrossRef] [PubMed]
  31. Tamborski, J.J.; Eagle, M.; Kurylyk, B.L.; Kroeger, K.D.; Wang, Z.A.; Henderson, P.; Charette, M.A. Pore water exchange-driven inorganic carbon export from intertidal salt marshes. Limnol. Oceanogr. 2021, 66, 1774–1792. [Google Scholar] [CrossRef]
  32. Wang, F.; Xiao, K.; Santos, I.R.; Lu, Z.; Tamborski, J.; Wang, Y.; Yan, R.; Chen, N. Porewater exchange drives nutrient cycling and export in a mangrove-salt marsh ecotone. J. Hydrol. 2022, 606, 127401. [Google Scholar] [CrossRef]
  33. Alongi, D.M. Lateral Export and Sources of Subsurface Dissolved Carbon and Alkalinity in Mangroves: Revising the Blue Carbon Budget. J. Mar. Sci. Eng. 2022, 10, 1916. [Google Scholar] [CrossRef]
  34. Krause, J.R.; Gannon, M.E.; Oczkowski, A.J.; Schwartz, M.J.; Champlin, L.K.; Steinmann, D.; Maxwell-Doyle, M.; Pirl, E.; Allen, V.; Burke, E.W. Tidal Flushing Rather Than Non-Point Source Nitrogen Pollution Drives Nutrient Dynamics in A Putatively Eutrophic Estuary. Water 2023, 15, 15. [Google Scholar] [CrossRef]
  35. Mikhailov, V.N.; Gorin, S.L. New definitions, regionalization, and typification of river mouth areas and estuaries as their parts. Watar Res. 2012, 39, 247–260. [Google Scholar] [CrossRef]
  36. Townsend, D.W.; McGillicuddy, D.J.; Thomas, M.A.; Rebuck, N.D. Nutrients and water masses in the Gulf of Maine–Georges Bank region: Variability and importance to blooms of the toxic dinoflagellate Alexandrium fundyense. Deep Sea Res. Part II Top. Stud. Oceanogr. 2014, 103, 238–263. [Google Scholar] [CrossRef] [PubMed]
  37. Switzer, M.E.; Townsend, D.W.; Pettigrew, N.R. The effects of source water masses and internal recycling on concentrations of dissolved inorganic nutrients in the Gulf of Maine. Cont. Shelf Res. 2020, 204, 104157. [Google Scholar] [CrossRef]
  38. Locia of the Sea of Okhotsk. No. 2. In Northern Part of the Sea; Publishing House of the UNGS of the USSR Navy: Leningrad, Russia, 1960; p. 200. (In Russian)
  39. Gorin, S.L.; Koval, M.V.; Sazonov, A.A.; Terskii, P.N. Modern hydrological regime of the lower stream of the Penzhina River and the first data on hydrological processes in its estuaries according to the expedition of 2014. Issled. Vodn. Biol. Resur. Kamchat. Sev.-Zap. Chasti Tikhogo Okeana 2015, 37, 33–52. [Google Scholar]
  40. Koval, M.V.; Gorin, S.L.; Romanenko, F.A.; Lepskaya, E.V.; Polyakova, A.A.; Galyamov, R.A.; Esin, E.V. Environmental conditions and biological community of the Penzhina and Talovka hypertidal estuary (northwest Kamchatka) in the ice-free season. Oceanology 2017, 57, 539–551. [Google Scholar] [CrossRef]
  41. Tishchenko, P.; Zhang, J.; Pavlova, G.; Tishchenko, P.; Sagalaev, S.; Shvetsova, M. Revisiting the Carbonate Chemistry of the Sea of Japan (East Sea): From Water Column to Sediment. J. Mar. Sci. Eng. 2022, 10, 438. [Google Scholar] [CrossRef]
  42. Dickson, A.G. pH scales and proton-transfer reactions in saline media such as sea water. Geochim. Cosmochim. Acta 1984, 48, 2299–2308. [Google Scholar] [CrossRef]
  43. Pavlova, G.Y.; Tishchenko, P.Y.; Volkova, T.I.; Dickson, A.; Wallmann, K. Intercalibration of Bruevich’s method to determine the total alkalinity in seawater. Oceanology 2008, 48, 438–443. [Google Scholar] [CrossRef]
  44. Grasshoff, K.; Ehrhard, M.; Kremling, K. Methods of Seawater Analysis; Verlag Chemie: Weinheim, Germany, 1983; p. 419. Available online: https://scholar.google.com/scholar_lookup?title=Methods+of+Seawater+Analysis&author=Grasshoff,+K.&author=Ehrhard,+M.&author=Kremling,+K.&publication_year=1983 (accessed on 5 December 2023).
  45. Weiss, R.F. Carbon dioxide in water and seawater: The solubility of a non-ideal gas. Mar. Chem. 1974, 2, 203–215. [Google Scholar] [CrossRef]
  46. Sun, H.; Gao, Z.; Qi, D.; Chen, B.S.; Chen, L.; Cai, W.-J. Surface seawater partial pressure of CO2 variability and air-sea CO2 fluxes in the Bering Sea in July 2010. Cont. Shelf Res. 2020, 193, 104031. [Google Scholar] [CrossRef]
  47. Pipko, I.I.; Pugach, S.P.; Luchin, V.A.; Francis, O.P.; Savelieva, N.I.; Charkin, A.N.; Dudarev, O.V.; Semiletov, I.P. Surface CO2 system dynamics in the Gulf of Anadyr during the open water season. Cont. Shelf Res. 2021, 217, 104371. [Google Scholar] [CrossRef]
  48. Moroshkin, K.V. Water Masses of the Sea of Okhotsk; Nauka: Moscow, Russia, 1966. (In Russian) [Google Scholar]
  49. Shen, A.; Liu, H.; Xin, Q.; Hu, Q.; Wang, X.; Chen, J. Responses of Marine Diatom–Dinoflagellate Interspecific Competition to Different Phosphorus Sources. J. Mar. Sci. Eng. 2022, 10, 1972. [Google Scholar] [CrossRef]
  50. Jia, C.; Wang, L.; Zhang, Y.; Lin, M.; Wan, Y.; Zhou, X.; Jing, C.; Guo, X. Diel Variation in Phytoplankton Biomass Driven by Hydrological Factors at Three Coastal Monitoring Buoy Stations in the Taiwan Strait. J. Mar. Sci. Eng. 2023, 11, 2252. [Google Scholar] [CrossRef]
  51. Hayami, Y.; Wada, M.; Umezawa, Y.; Fujii, N.; Nakamura, A.; Mori, F. Hypoxic water mass in the highly turbid well-mixed macrotidal Rokkaku River Estuary, Ariake Sea, Japan. Estuar. Coast. Shelf Sci. 2019, 219, 210–222. [Google Scholar] [CrossRef]
  52. Lisitzin, A.P. The Continental-Ocean Boundary as a Marginal Filter in the World Oceans; Gray, J.S., Ambrose, W., Szaniawska, A., Eds.; Biogeochemical Cycling and Sediment Ecology; NATO ASI Series; Springer: Dordrecht, The Netherlands, 1999; Volume 59. [Google Scholar] [CrossRef]
  53. Millward, G.E.; Liu, Y.P. Modelling metal desorption kinetics in estuaries. Sci. Total Environ. 2003, 314, 613–623. [Google Scholar] [CrossRef] [PubMed]
  54. Wang, S.; Vogt, R.D.; Carstensen, J.; Lin, Y.; Feng, J.; Lu, X. Riverine flux of dissolved phosphorus to the coastal sea may be overestimated, especially in estuaries of gated rivers: Implications of phosphorus adsorption/desorption on suspended sediments. Chemosphere 2022, 287, 132206. [Google Scholar] [CrossRef]
  55. Xu, Y.; Liu, X.; Zhou, F.; Chen, X.; Ye, R.; Chen, D. Tide-Induced Upwelling and Its Three-Dimensional Balance of the Vertical Component of Vorticity in the Wider Area of the Bohai Strait. J. Mar. Sci. Eng. 2023, 11, 1839. [Google Scholar] [CrossRef]
  56. Shuntov, V.P. Biology of the Far Eastern Seas; TINRO Center: Vladivostok, Russia, 2001; Volume 1, p. 580. (In Russian) [Google Scholar]
  57. Frankignoulle, M.; Bourge, I.; Wollast, R. Atmospheric CO2 fluxes in a highly polluted estuary (the Scheldt). Limnol. Oceanogr. 1996, 41, 365–369. Available online: https://orbi.uliege.be/bitstream/2268/246249/1/lo.1996.41.2.0365.pdf (accessed on 1 March 2024). [CrossRef]
  58. Pattanayak, A.A.; Swain, S.; Behera, R.R.; Sharma, S.D.; Panda, C.R.; Mohanty, P.K. Variability in water quality of two meso-tidal estuaries of Odisha, East Coast of India. J. Mar. Syst. 2024, 241, 103919. [Google Scholar] [CrossRef]
  59. Chen, C.-T.A.; Huang, T.-H.; Fu, Y.-H.; Bai, Y.; He, X. Strong sources of CO2 in upper estuaries become sinks of CO2 in large river plumes. Curr. Opin. Environ. Sustain. 2012, 4, 179–185. [Google Scholar] [CrossRef]
  60. Zhai, W.; Dai, M.; Guo, X. Carbonate system and CO2 degassing fluxes in the inner estuary of Changjiang (Yangtze) River, China. Mar. Chem. 2007, 107, 342–356. [Google Scholar] [CrossRef]
  61. Polukhin, A.A.; Flint, M.V.; Belikov, I.B.; Gusak, G.V.; Kazakova, U.A.; Muravya, V.O.; Pankratova, N.V.; Pronina, Y.O.; Skorokhod, A.I.; Chultsova, A.L.; et al. Carbon Dioxide Flux at the Water–Air Boundary at the Continental Slope in the Kara Sea. Oceanology 2021, 61, 625–631. [Google Scholar] [CrossRef]
  62. Koltunov, A.M.; Tishchenko, P.Y.; Zvalinskii, V.I.; Chichkin, R.V.; Lobanov, V.B.; Nekrasov, D.A. The carbonate system of the Amur estuary and the adjacent marine aquatic areas. Oceanology 2009, 49, 643–654. [Google Scholar] [CrossRef]
  63. Chen, L.; Gao, Z.; Sun, H.; Chen, B.; Cai, W.-J. Distributions and air-sea fluxes of CO2 in the summer Bering Sea. Acta Oceanol. Sin. 2014, 33, 1–8. [Google Scholar] [CrossRef]
  64. Pilcher, D.; Naiman, D.; Cross, J.; Hermann, A.; Siedlecki, S.; Gibson, G.; Mathis, J. Modeled effect of coastal biogeochemical processes, climate variability, and ocean acidification on aragonite saturation state in the Bering Sea. Front. Mar. Sci. 2018, 5, 508. [Google Scholar] [CrossRef]
  65. Shadwick, E.H.; Thomas, H.; Chierici, M.; Else, B.; Fransson, A.; Michel, C.; Miller, L.A.; Mucci, A.; Niemi, A.; Papakyriakou, T.N.; et al. Seasonal variability of the inorganic carbon system in the Amundsen Gulf region of the southeastern Beaufort Sea. Limnol. Oceanogr. 2011, 56, 303–322. [Google Scholar] [CrossRef]
  66. Berghoff, C.F.; Pierrot, D.; Epherra, L.; Silva, R.I.; Segura, V.; Negri, R.M.; Hozbor, M.C.; Carignan, M.O.; Barbero, L.; Lutz, V.A. Physical and biological effects on the carbonate system during summer in the Northern Argentine Continental Shelf (Southwestern Atlantic). J. Mar. Syst. 2023, 237, 103828. [Google Scholar] [CrossRef]
Figure 1. Locations of stations. 1, 2—anchor stations taking measurements during the tidal cycle.
Jmse 12 00517 g001
Figure 2. Water level at St. 1 and designation of the periods under study in the Shelikhov Gulf, Penzhina Bay, and the Penzhina River, as well as daily observations from St. 1 and 2.
Jmse 12 00517 g002
Figure 3. The Penzhina River’s minimum, average, and maximum discharge from 1989 to 2012 (the references to primary sources are in [39]).
Jmse 12 00517 g003
Figure 4. Temperature (left panels) and salinity (right panels) at the surface water layer (A,B) and the bottom water layer (C,D).
Jmse 12 00517 g004
Figure 5. pCO2 (left panels) and pH (right panels) at the surface water layer (A,B) and the bottom water layer (C,D).
Jmse 12 00517 g005
Figure 6. TA (left panels) and DIC (right panels) at the surface water layer (A,B) and the bottom water layer (C,D).
Jmse 12 00517 g006
Figure 7. Dependence of the carbonate system parameters on salinity in the surface and bottom water layers. HTW—high turbidity water.
Jmse 12 00517 g007
Figure 8. Daily variability of salinity, temperature, pCO2, and pH at anchored stations: St. 1—left panels, St. 2—right panels. HW—high-water period, LW—low-water period.
Jmse 12 00517 g008
Figure 9. Dependence of nutrients on salinity. HTW—high turbidity water.
Jmse 12 00517 g009
Figure 10. The dependence of the pCO2 on AOU and the concentration of Chl a, HSs, and photic zone thickness on salinity. HTW—high turbidity water. More information about dependence of the AOU on salinity can be found in Figure S1.
Jmse 12 00517 g010
Figure 11. FCO2 calculated for minimum (3 m/s), real, and maximum (12 m/s) wind speeds during the period of the cruise.
Jmse 12 00517 g011
Disclaimer/Publisher’s Note: The statements, opinions and data contained in all publications are solely those of the individual author(s) and contributor(s) and not of MDPI and/or the editor(s). MDPI and/or the editor(s) disclaim responsibility for any injury to people or property resulting from any ideas, methods, instructions or products referred to in the content.

