Article

Study of Hydrokinetic Energy Harvesting of Two Tandem Three Rigidly Connected Cylinder Oscillators Driven by Fluid-Induced Vibration

Department of Energy and Power Engineering, Kunming University of Science and Technology, Kunming 650093, China
*
Author to whom correspondence should be addressed.
J. Mar. Sci. Eng. 2024, 12(3), 515; https://doi.org/10.3390/jmse12030515
Submission received: 28 February 2024 / Revised: 17 March 2024 / Accepted: 19 March 2024 / Published: 20 March 2024
(This article belongs to the Special Issue Sustainable Utilization of Marine Renewable Energy)

Abstract

:
This study utilizes a bidirectional fluid–structure interaction numerical method to investigate the hydrodynamic and energy harvesting characteristics of two tandem three rigidly connected cylinder oscillators with different inter-oscillator spacing ratios. The analysis considers inter-oscillator spacing ratios of 8, 12, and 16 within a reduced velocity range of U* = 2–13 (equivalent to flow velocities of 0.18–1.16 m/s). The research explores the hydrodynamic interference features, energy harvesting variations, and the efficiency and density of energy harvesting of both upstream and downstream three-cylinder oscillators. The findings indicate that with increasing reduced velocity and inter-oscillator spacing ratio, the mutual interference between upstream and downstream oscillators diminishes. Wake patterns observed in the two series-connected three-cylinder oscillators include 2P, 2S, and 2T patterns, with fragmented vortices and banded vortices at specific reduced velocities. The most significant disparity in energy harvesting efficiency between upstream and downstream oscillators is observed at U* = 9.

1. Introduction

Hydrokinetic energy is recognized as a clean and renewable energy source in oceans and rivers, making it a crucial marine energy resource. Utilizing this renewable energy source to its full potential could significantly reduce fossil fuel consumption and mitigate global warming effects [1,2]. Ocean current energy boasts high energy density, environmental friendliness, and cost-effectiveness, presenting immense development opportunities [3,4,5]. Various energy conversion devices, such as axial flow turbines, cross-flow turbines, and oscillation energy harvesting devices, have been designed for different current environments [6,7,8]. While turbines can utilize ocean currents at flow rates as low as 2.5–3.6 m/s, conventional rotary energy conversion devices struggle to operate efficiently in most low-speed flows. Given that significant portions of ocean and river flows are below 1.5 m/s, the hydrodynamic characteristics of standard rotating underwater turbines may not be suitable for such low flow ranges [9,10,11]. Large areas of the world’s ocean flows are less than 1.5 m/s, and river flows are usually less than 1.0 m/s, and the hydrodynamic performance and characteristics of ordinary rotating underwater turbines are not necessarily suitable for such a low flow range [12,13]. In the past decade, scholars have proposed low-speed ocean current power generation devices driven by vorticity vibration, which can realize the development of low-speed current energy through alternating lift equipment. This innovative approach holds promise for maximizing water flow utilization and warrants further investigation.
Fluid-induced vibration (FIV) has been utilized for harnessing hydrokinetic energy to generate electricity [14,15,16]. Bernitsas and his research group developed the VIVACE (vortex-induced vibration aquatic clean energy) converter [17,18], which captures hydrokinetic energy from low-speed ocean currents, making a significant impact on marine energy harvesting. The VIVACE converter can effectively harness flow energy from speeds as low as 0.4 m/s without an upper limit, boasting the highest power density among various marine renewable energy technologies. This feature allows for relatively small installations to produce low-cost energy [19,20].
Numerous scholars have extensively researched the vortex-induced vibration of a single cylinder, uncovering fundamental principles of VIV. Experimental studies on VIV of a single cylinder in water have demonstrated the emergence of three distinct response branches as the reduced velocity increases: initial branch, upper branch, and lower branch. Further analysis of cylinder VIV has identified various vortex modes, including ‘2S’, ‘2P’, ‘P+S’, ‘2T’, and ‘2C’, along with proposing a correlation between vortex-induced response frequency and amplitude [21].
The hydrokinetic energy harvesting of a single cylindrical oscillator, known as VIVACE, has been extensively studied in recent years. Sun et al. performed numerous experiments on a single smooth or rough cylinder to optimize the hydrodynamic conversion using a virtual spring-damping system (Vck) with linear and nonlinear parameters [22,23,24]. Zhang et al. studied the influence of the shape (triangle, quadrilateral, hexagonal, octagon, and circle) of the oscillator’s cross-section on the utilization of hydrokinetic energy. They found that the cylinder with a circular section was subjected to stronger hydrodynamic force and could achieve higher amplitude [25]. Additionally, the effect of energy harvesting was better at 0° than at 90° when cylinders with different cross-sectional shapes were subjected to different inflow attack angles; the energy harvesting oscillator with a triangular section achieved larger amplitude [26]. Sun et al. found that the surface roughness can effectively suppress VIV response and reduce the lock-in area [27]. They showed that during VIV energy harvesting of bluff bodies with different cross-sections in a tandem arrangement, the motion of the upstream oscillator was suppressed and the downstream oscillator increased the clogging of the tail vortex when the tandem spacing was less than 5D. A maximum amplitude ratio of 1.17 as well as an energy conversion efficiency of 26.5% can be achieved by the Cir-Tria prism under low mass ratio and high Reynolds number conditions [28]. Xu et al. investigated the VIV and energy collection performance when an energy converter composed of a single cylinder is working in shallow water and found that the free surface is very important [29]. However, through reasonable selection and design of the control parameters, it is feasible to use the VIVACE converter near the free surface, effectively using the hydrokinetic energy.
In order to maximize the power density of the VIV hydrodynamic converter for energy capture, it is essential to consider a multi-cylinder arrangement. Conducting research on fluid-induced vibration (FIV) of a multi-cylinder system consisting of more than two cylinders holds great significance in the field of engineering design and its practical applications. When a fluid flows through multiple cylinders, its hydrodynamic characteristics and FIV response are complex due to the interactions of the cylinders; this differs from a single-cylinder scenario. As a result, numerous scholars have conducted research on the eddy current interaction in multi-cylinder systems. Among them, the energy-harvesting structure composed of two cylinders was the representative structural form [30].
Several teams conducted further research on the harvesting energy of a multi-cylinder with rigid connections and found that it has a better energy harvesting effect than a single cylinder [31,32,33]. In the field of hydrokinetic energy conversion, the rigidly connected multi-cylinder oscillator offers greater economic and efficiency advantages, making it a more valuable subject for practical research. Rigidly connecting multiple cylinders enhances the energy conversion density of the oscillator.
Kim and Bernitsas conducted experimental FIV tests on energy converters made using two, three, and four cylinders in serial arrangements, with space ratios ranging from 2.5 to 5.0. The results showed that multiple cylinders close to each other can harvest more hydrokinetic energy than the same number of isolated cylinders [34].
In terms of numerical simulations, Qiu et al. and Wei Wang et al. modified two cylinders and enhanced the VIV by changing the surface parameters of the cylinders to study the intensity of the vortexes and the shedding form of the vortexes [35,36]. Chen et al. studied the FIV response of three cylinders in series mode at low Reynolds numbers. The results showed that the dynamic response of three cylinders in a tandem arrangement is different from that of two cylinders. In addition, the amplitude of all three cylinders increased compared to a single cylinder [37]. Zou Q et al. investigated four arrangements of two cylinders via simulation, and the amplitude of two rigidly connected cylinders was larger than that of independently vibrating cylinders when U* > 9. The motion trajectories of the cylinders under two degrees of freedom were also investigated, and certain motion laws were given [38]. Liu et al. conducted a study on two parallel elastic-connected cylinders and found that the stiffness ratio and spacing ratio of the structure could affect the amplitude of the structure and the size of the locking interval. However, there was no research on energy capture in the article [39].
Zhu et al. conducted experiments on cylinders with rigid connections, and their results showed that rigid connections had a special inhibitory effect on downstream cylinders. Compared with free connections, the maximum amplitude decreased by 15% but the locking interval increased by 80% [40].
A few researchers have investigated the energy harvesting of multi-cylinders with rigid connections. Han et al. studied the response of FIV of three rigidly coupled cylinders. They found that interference between the cylinders was stronger than that of other cases with a small space ratio with incidence angle α = 0°, at which time the three-cylinder oscillator underwent galloping vibration and the maximum amplitude increased with the flow velocity. Based on the average energy conversion efficiency and maximum efficiency evaluation of the three-cylinder oscillator [41], Han et al. found that damping ratio ξ t o t a l = 0.5 and spacing ratio G = 0.2 are the optimum parameters for harvesting hydrokinetic energy from low-speed ocean current [42].
The energy harvesting performance of a multi-cylinder oscillator with rigid connections is notably enhanced by the strong fluid–solid coupling effect in uniform flow, as opposed to a single-cylinder energy harvesting oscillator. Additionally, it was observed that a rigidly connected oscillator demonstrates superior energy harvesting capabilities compared with an oscillator composed of multiple individual cylinders.
To establish a large-scale VIVACE converter array, there is an urgent need for research on VIV in multi-cylinder oscillators. However, current studies have not yet reported on the VIV response characteristics, energy harvesting performance, and interaction mechanisms between multi-cylinder oscillators with rigid connections. Additionally, the impact of the spacing ratio between oscillators on the VIV response, hydrodynamic characteristics, and energy harvesting efficiency of each oscillator remains unclear. In the case of two tandem multi-rigidly connected cylinder oscillators, the spacing ratio (Z) between them directly influences the interaction of wake vortices, flow velocity, pressure, and viscous forces. The flow dynamics, gap development, wake flow, and coupling strength with the downstream oscillator are complex for the upstream oscillator, leading to differences in vortex shedding frequency, response amplitude, lift coefficient, and hydrokinetic energy extraction from low-speed flows between the two oscillators.
This study investigates the hydrodynamic characteristics, response characteristics, and energy harvesting effect of three rigidly connected cylinder oscillators. Each oscillator comprises three rigidly connected cylinders, with two oscillators arranged in tandem. The numerical simulation of fluid–structure interaction (FSI) is utilized to explore the interaction characteristics of the two oscillators with different spacing ratios (Z = 8, 12, and 16). Additionally, the study examines the mechanism influencing energy harvesting by the upstream and downstream oscillators.

2. The Oscillator Model of VIV

2.1. Physical Model

This study explores the vortex-induced vibration (VIV) and energy harvesting of two three-cylinder converters connected rigidly in a tandem arrangement, as illustrated in Figure 1. Each energy conversion device comprises three rigidly connected cylinder oscillators, springs, and a generator, forming a mass–spring–damping system that is constrained to move in the y direction. The relative positions of the three cylinders remain constant during vibration. Table 1 and Table 2 display the parameters and symbols relevant to VIV.

2.2. Fluid control Equation

2.2.1. Fluid Control Equation

Analysis of the energy harvesting oscillator in a uniform incoming flow falls within the realm of a typical fluid–structure interaction (FSI) problem. The unsteady Reynolds-averaged Navier–Stokes (u-RANS) equations are employed as the governing fluid equations; the SST k-ω turbulence model is employed for solving the flow field. The finite-volume method is utilized to discretize the control equations, with the fluid control equations outlined as follows:
u ¯ i x ¯ i = 0
ρ u ¯ i t + ρ u i u j ¯ x j = P ¯ x i + μ 2 u ¯ i ρ u i u j ¯ x j
where x i is the Cartesian coordinate system in the x-direction, u ¯ i and u ¯ j are the i-directional velocity components and velocity variations, t is time, P ¯ refers to pressure, and ρ and μ are the density and kinetic viscosity of the fluid, respectively.
Where the Reynolds stress ρ u i u j ¯ is:
ρ u i u j ¯ = μ t u ¯ i x j + u ¯ j x i 2 3 ρ k t δ i j
where μ t represents the turbulent eddy viscosity, which is given by the turbulent model. k t is the turbulent kinetic energy obtained from the oscillating velocity field and δ i j is the Kronecker function.
The SST k-ω turbulence model includes transport equations for the turbulent kinetic energy kt and the turbulent dissipation rate ω. The SST k-ω turbulence model includes transport equations for the turbulent kinetic energy kt and the turbulent dissipation rate ω.
ρ k t t + ρ u j k t x j = P β * ρ ω k t + x j μ + σ k μ i k t x j
The transport equation for the turbulent dissipation rate ω is given by
ρ ω t + ρ u j ω x j = γ v t P β ρ ω 2 + x j μ + μ t σ ω ω x j + 2 1 F 1 ρ σ ω ω k x j ω x j
In the two Equations (4) and (5) above: P represents the dual scalar product of the Reynolds stress and the tensor of mean kinematic deformation rate, β * is the coefficient of thermal expansion, σ k represents the turbulent kinetic energy Prandtl number, which defines the ratio of momentum diffusion caused by turbulent transport to turbulent kinetic energy. γ , β , σ ω are empirical coefficients; F 1 refers to a hybrid function designed to allow the transport equation to overrun from the near-wall k-ω model to the external k-ε model. It is defined as
F 1 = tanh ( λ 1 4 )
where λ 1 = min [ max ( k β * ω y ; 500 ν y 2 ω ) ; 4 ρ σ ω 2 k C D k ω y 2 ] , C D κ ω = max ( 2 ρ σ ω 2 1 ω k x j ω x j , 10 10 ) .
Some constants in the model control equation can be solved using Equation (7).
ϕ = F 1 ϕ 1 + 1 F 1 ϕ 2
where the coefficient ϕ 1 represents the k-ω model near the wall, ϕ 1 = β 1 / β * σ ω 1 κ 2 β * ; the coefficient ϕ 1 is the k-ε model outside, ϕ 2 = β 2 / β * σ ω 2 κ 2 β * .

2.2.2. Solids Governing Equation

The structure vibration equations are discretely solved using the fourth-order Runge–Kutta method. At each time step, the solid vibration equations are solved based on the user-defined function (UDF). The results obtained from solving these equations are then transferred to the fluid equations to obtain a bidirectional fluid–solid coupling calculation, as shown in Figure 2. The fourth-order Runge–Kutta method was chosen due to its high computational efficiency and superior computational accuracy.
The solid vibration equations are solved in the following form, as shown in Equation (8):
f v , y = F f l u i d t M 2 ξ ω 0 y ˙ t ω 0 2 y t
Using the fourth-order Runge–Kutta method to discretize v , y in Equation (8):
v t n + 1 = v t n + Δ t 6 × K 1 + 2 K 2 + 2 K 3 + K 4
y t n + 1 = y t n + Δ t × v t n + Δ t 2 6 K 1 + K 2 + K 3
K 1 , K 2 , K 3 , K 4 are conversion factors for the fourth-order Runge–Kutta method, expressed as follows. Δ t is the time step. After determining the displacement y t n and the velocity v t n of the oscillation structure at moment t n , the displacement y t n + 1 at moment t n + 1 can be calculated using the following equations.
K 1 = F f l u i d t M 2 ξ ω 0 v t n ω 0 2 y t n
K 2 = F f l u i d t M 2 ξ ω 0 v t n + Δ t 2 K 1 ω 0 2 y t n + Δ t 2 v t n
K 3 = F f l u i d t M 2 ξ ω 0 v t n + Δ t 2 K 2 ω 0 2 y t n + Δ t 2 v t n + Δ t 2 4 K 1
K 4 = F f l u i d t M 2 ξ ω 0 v t n + Δ t K 3 ω 0 2 y t n + Δ t v t n + Δ t 2 2 K 2

2.2.3. Energy Calculation Equations

The total energy harvested by the three-cylinder oscillator under VIV during one vibration cycle ( T v i b ) is shown in Equation (15).
P V I V = 1 T v i b 0 T v i b F y d A y d t = 1 T v i b 0 T v i b ( M d 2 A y d t 2 + C d A y d t + K A y ) d A y d t d t
The two parameters, mass M and stiffness K, do not contribute to energy harvesting because they are always out of phase with the velocity [42], thus P V I V can be rewritten as:
P V I V = 1 T v i b 0 T v i b C ( d A y d t ) 2 d t = C ( d A y d t ) 2
where ⟨⋅⟩ is the time-averaged quantity.
Throughout the energy conversion process, there are inevitable mechanical losses that result in the incomplete conversion of fluid energy into electrical energy. As a result, it is necessary to deduct the lost power from the total power. Since the dissipation coefficient of the damping system is difficult to obtain, this parameter only affects the subsequent calculation of the harvesting energy. Therefore, in this paper, the same representation as in Barrero-Gil et al. is adopted to describe the energy harvesting characteristics in terms of the total damping coefficient and the total power [43].
P V I V = P K Q
where PK is the static pressure head that can be obtained using Bernoulli’s equation, and Q denotes the volumetric flow rate. Because the gap ratio G = 0.2 is selected for testing, the corresponding flow area is S f l o w = 2.2D (D being a characteristic diameter).
The energy conversion efficiency η V I V is defined as the ratio of the total energy power P V I V obtained to the maximum energy flow rate that can be obtained from the fluid. This efficiency metric measures how effectively the energy harvesting system converts the available hydrodynamic energy into usable power.
η V I V = P V I V P f l u i d × Betz   limit = 2 C ( d A y d t ) 2 ρ U 3 S f l o w × Betz   limit
where S f l o w is the flow area. The above equation introduces the Betz limit, which represents the maximum theoretical efficiency that can be used for energy conversion in the incoming flow. The value of the Betz limit is known to be 59.26% (16/27) [23].
By incorporating the damping ratio and reduced velocity defined in Table 1, Equation (14) mentioned earlier can be modified as follows:
η V I V = 27 π 4 M * ξ t o t a l Y ˙ Y ˙ 2 U r 3 ( 0.2 + 2 )
Under different oscillator spacing ratios, the energy density P D e n i s i t y parameter becomes more comparative. This parameter represents the energy value per unit flow area at the same velocity.
P D e n i s i t y = P V I V 6 S T r i a n g l e
where S T r i a n g l e is the area of the triangle shown in Figure 3, which includes three cylinders. This is indicated by the black dashed line.

2.3. Computational Domain and Meshing

The study utilized the reliable CFD software FLUENT 2021R1 for transient simulation. User-defined functions (UDF) written in C programming language were employed to address the response of the VIV system and enable dynamic mesh in FLUENT. The numerical simulation of flow around cylinders was conducted using 2D unsteady Reynolds-averaged Navier–Stokes (u-RANS) equations coupled with the SST k-ω turbulence model. It is important to note that this method does not account for three-dimensional effects.
Figure 3 illustrates the computational domain of VIV of three rigidly connected cylinder oscillators, which includes the solid domain and fluid domain. In order to examine the interaction between the rigidly connected three-cylinder oscillators, the influence of the obstruction ratio and wall effect on the calculation results is ignored in the numerical experiments under the low-velocity uniform incoming flow. The computational domain is defined by a length and width of 40D and 20D, respectively. With the W/D ratio (where W represents the width of the computational domain) exceeding 10, the impact of side boundaries on simulation results is considered negligible [44]. The center distances between adjacent oscillators are 8D, 12D, and 16D, with the three-cylinder oscillator positioned 8D from the inlet.
The calculation domain is characterized by four boundary conditions: inlet, outlet, sidewall, and fluid–solid interaction boundary (FSI). The fluid enters the boundary as a velocity inlet and exits as a pressure outlet, while the top and bottom of the calculation domain act as sidewalls. To further explore the impact of water flow passing through the upstream three-cylinder oscillator on the downstream counterpart, five equidistant velocity monitoring points are established at a distance of 0.25D from the downstream three-cylinder oscillator. These monitoring points enable the observation of water flow characteristics and their effect on the downstream three-cylinder oscillator.
During vortex-induced vibration, the movement of the energy-harvesting structure induces the surrounding grid to move in unison. When the mesh deformation reaches a certain level, distortion occurs, resulting in negative volume and halting the calculation process. To enhance computational precision and efficiency, it is recommended to accurately capture the flow field information around the cylinder, study its evolutionary pattern, utilize unstructured grids, and discretize the 8D × 8D region surrounding the energy harvesting structure.
As depicted in Figure 3b, boundary layer meshes with a certain growth rate are employed for the near-wall surface of the three-cylinder structure, taking into account the significant deformation of the mesh due to large changes in velocity gradient. In this study, the SST k-ω turbulence model is utilized. As per the model specifications, the dimensionless wall thickness y+ is set to 1, resulting in a first boundary layer thickness ranging from 1.77 × 10⁻⁵ to 9.47 × 10⁻⁵. The mesh consisted of approximately 4.90 × 10⁵ elements. The high-quality mesh generated facilitated well-converged solutions, meeting the convergence criteria of mass conservation within 10−3.

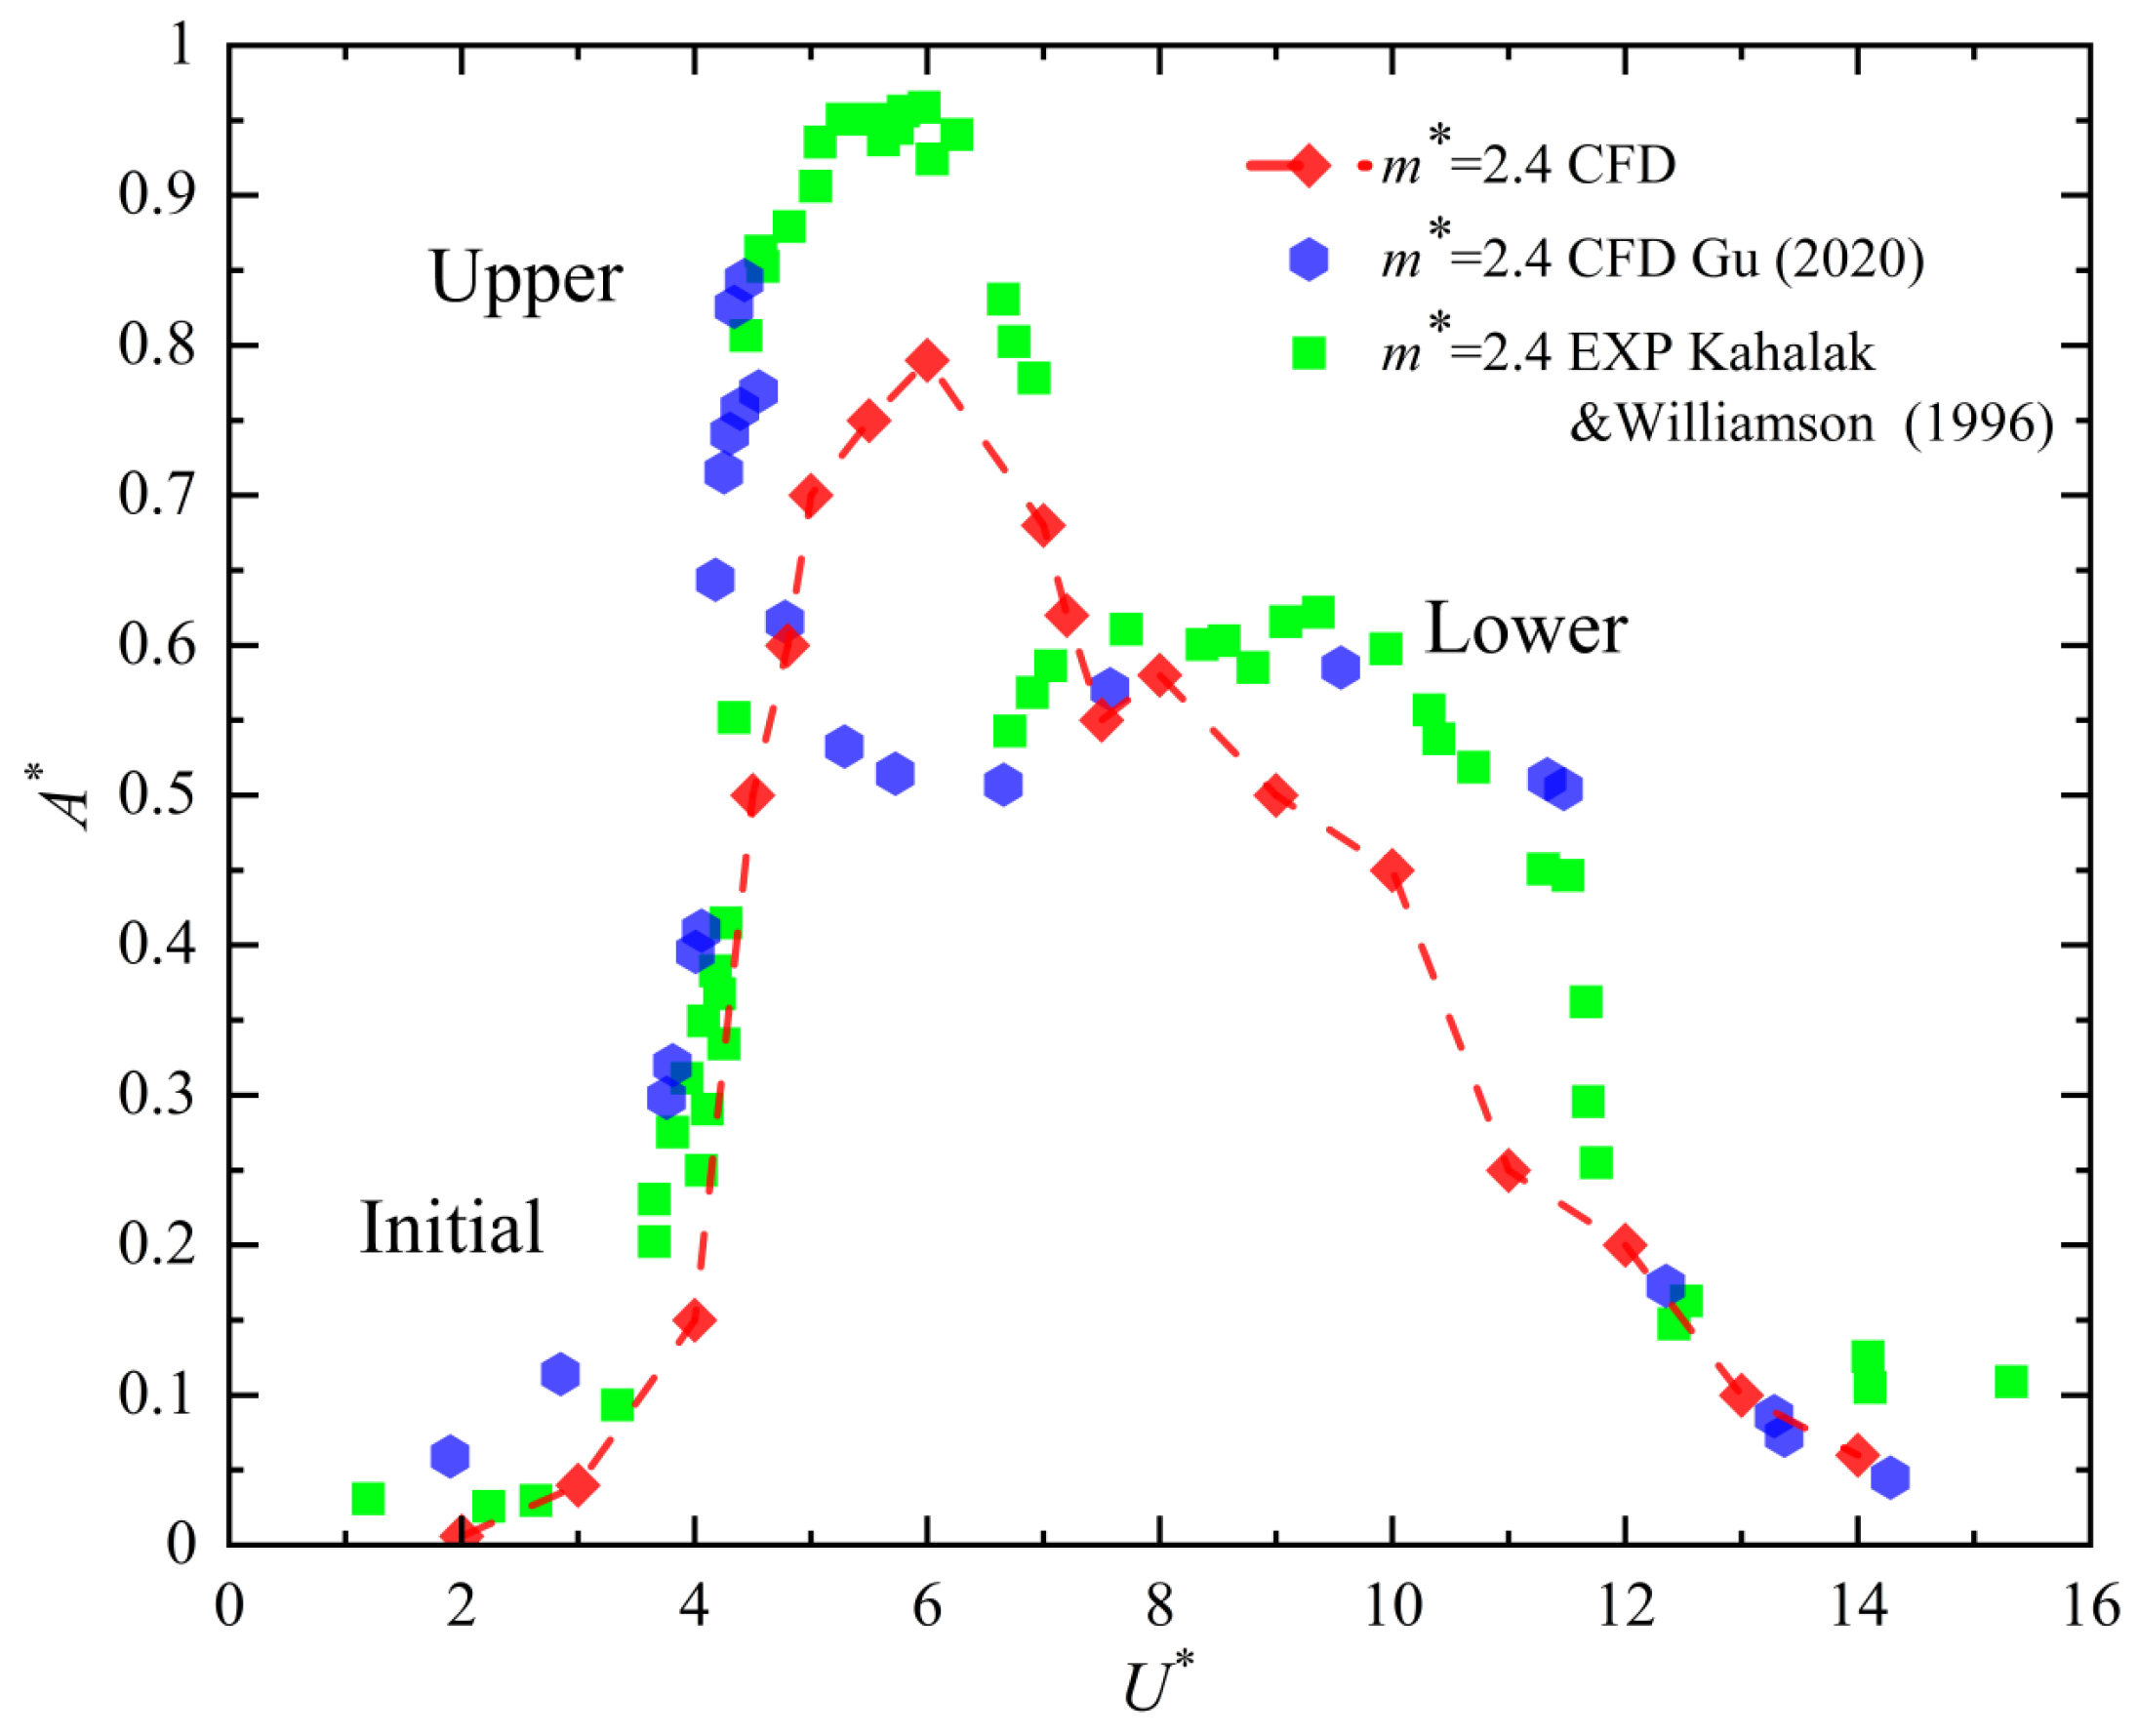
2.4. Numerical Method Validation

To validate the accuracy of the numerical method employed in this research, identical parameters were utilized to compare the amplitude ratio findings of a single-cylinder mass–spring–damper system with existing data in the literature. The experimental parameters are shown in Table 3. The experimental reduced velocity range U* = 2~14 and the Reynolds number Re = 2.06 × 10³~1.445 × 10⁴. Figure 4 illustrates that the trend between amplitude and reduced velocity, as determined using the numerical method in this study, closely aligns with the observations of Kahalak and Williamson [45] and Gu [46]. Notably, distinct VIV response branches are evident, including the initial branch, upper branch, and lower branch. Furthermore, the amplitude of the upper branch exhibits a closer resemblance to the experimental outcomes reported by Kahalak [45].
Compared with the experimental results obtained by Kahalak and Williamon, the maximum amplitude ratio A* of the upper branch is slightly lower than the experimental results. This difference can be attributed to two main reasons: (1) In the VIV experiments, the parameters of the energy harvesting structure, such as the mass ratio m* and damping ratio ξ t o t a l , as well as the reduced velocity U*, are presented in a dimensionless form. There might be discrepancies in translating these dimensionless parameters into actual parameters, leading to a narrower range of upper branches in this experiment. (2) The numerical simulation of VIV of a cylinder was conducted under two-dimensional conditions, which lacks a dimension compared to experiments, that is, the fluid in this study is assumed to be an ideal three-dimensional fluid without side flow. This assumption affects the stability between the vibration frequency and the natural frequency, thereby affecting the response amplitude of VIV, particularly for the upper branches with larger amplitudes, resulting in a lower amplitude ratio than the experimental results. (3) The experimental model was placed on the free surface and the water tank to complete the experiment. The oscillator in the flow channel was potentially influenced by the flat plate and free surface, which was not fully replicated in the numerical simulation. This discrepancy may have led to gaps in the data.
In summary, the amplitude–frequency ratios of VIV in this numerical experiment closely align with the actual experimental results, satisfying the accuracy and convergence criteria for numerical simulation. The numerical method utilized in this study demonstrates feasibility and exhibits high accuracy.

2.5. Verification of Grid Independence

In the simulation process, the mesh size plays a crucial role in determining the accuracy of calculation results and computational time. To guarantee the precision of the obtained data, it is essential to conduct grid-independent verification. This study utilized three different grid densities (0.005, 0.001, and 0.0005) in simulations of three distinct cases. By comparing and validating the average maximum lift coefficient under vibration stability conditions, it was confirmed that the grid density met the necessary accuracy standards.
The validation results are presented in Table 4. The validation results indicate that when the minimum grid density is set to 0.001, the influence of the grid on the experimental results is almost negligible. This confirms that the grid density at this level is sufficient to meet the accuracy requirements for the calculation results. Consequently, the grid density of 0.001 was adopted for the subsequent calculations to obtain reliable and accurate simulation outcomes. Figure 5 shows the change in lift coefficient with time under three quantities of grid division. The purpose is to assess the effect of these time steps on the calculation accuracy, with the average lift coefficient used as an indicator.
The grid model with a minimum grid number of 0.001 was chosen for validation. We predicted the FIV of three rigidly coupled cylinders at different time steps: 0.003, 0.0025, and 0.001. The purpose was to assess the effect of these time steps on the calculation accuracy, with the average lift coefficient used as an indicator. The validation results are presented in Table 5.
Upon analysis and considering subsequent data processing, it was determined that the experiment met the required accuracy when a time step of 0.001 was used. Setting t = 0.001 allowed for more time points to be selected within the total calculation time, thus enhancing the readability of the visualized images. This affirmed that the chosen time step produced reliable and accurate simulation results, meeting the study’s accuracy standards.

3. Results and Discussion

3.1. Verification of Grid Independence

To demonstrate the impact of centralized capturing of hydrokinetic energy in the three rigidly connected cylinder oscillators, we analyzed the VIV response of a single three-cylinder oscillator within a range of reduced velocities, U* = 2~14, along with the corresponding flow velocity and Reynolds number. In Figure 6, it can be observed that when the vibration frequency fosc is close to the natural frequency fn,water within, the vibrating structure (f* = fosc/fn,water ≈ 1) enters a lock-in state with a relatively high amplitude. As the reduced velocity increases, the response of the rigidly connected three-cylinder oscillator exhibits distinct branches: an initial branch, an upper-end branch, and at U* = 10~12, a short lower-end branch, before transitioning into the branch where VIV transforms into galloping vibration.
Figure 7 illustrates the wake vortex patterns of a single three-cylinder converter at various reduced velocities. At U* = 4, the shedding wakes vortices of a single three-cylinder oscillator follow a 2S pattern (two separate vortices are shed in one vibration cycle). These shedding vortices collide, merge, and subsequently evolve downstream, eventually transforming into the vortex pattern shown in Figure 7a. At U* = 7, the frequency ratio of the harvesting energy structure is approximately 1, resulting in the oscillator being in a locking state. The vibrational response of the three-cylinder oscillator enters the upper branch with a higher amplitude, while the wake patterns continue to exhibit the classical 2S mode.
As the reduced velocity increases to U* = 9, the wake patterns exhibit a more complex flow situation. The interaction between the gap flow and the three-cylinder oscillator becomes apparent, leading to a higher lift force being experienced by the three-cylinder oscillator. This results in a shift of the wake patterns mode from 2S to 2P. However, when U* = 11, the response transitions to a brief lower branch with a decrease in amplitude, with the wake pattern being in the 2T mode.

3.2. The FIV Response Results of Two Tandem Three-Cylinder Oscillators

3.2.1. Characterization of the Wake Vortexes

The output of two three-cylinder oscillators in vortex-induced vibration (VIV) displays distinct flow characteristics when compared to a single three-cylinder oscillator. This is attributed to the mutual interference of gap flow within the oscillators and the upstream and downstream tail flow. By conducting frequency spectrum analysis using the Fast Fourier Transform (FFT), the vibration frequency can be determined. Subsequently, the frequency ratio can be calculated as f* = fosc/fn,water. Analyzing wake pattern modes and understanding their formation under different spacing ratios (Z) and reduced velocities aids in comprehending the impact of these parameters on the excitation motion of the oscillators.
The shedding tail vortices of the upstream and downstream three-cylinder oscillators exhibit variations in both reduced velocities (U*) and inter-oscillator spacing ratios (Z), as illustrated in Figure 8. Cylinders A and B in the upstream three-cylinder oscillator are directly subjected to the uniform incoming flow, leading to a pair of positive and negative vortex pairs shedding at each reduced velocity. These vortices then collide and fuse with the shedding vortex of cylinder C after interacting with the gap flow. As the shedding vortex progresses towards the inter-three-cylinder oscillators, it combines with the wake patterns of the downstream three-cylinder oscillator and the gap flow, continuing to evolve downstream. In a tandem arrangement of the two oscillators, the vortex-shedding form of the upstream oscillator maintains a nearly constant 2S shape. The wake dynamics of the downstream oscillator become more intricate due to the influence of the upstream wake, exhibiting 2S and 2P modes, as well as the emergence of the banded vortex and complex fragmented vortex patterns.

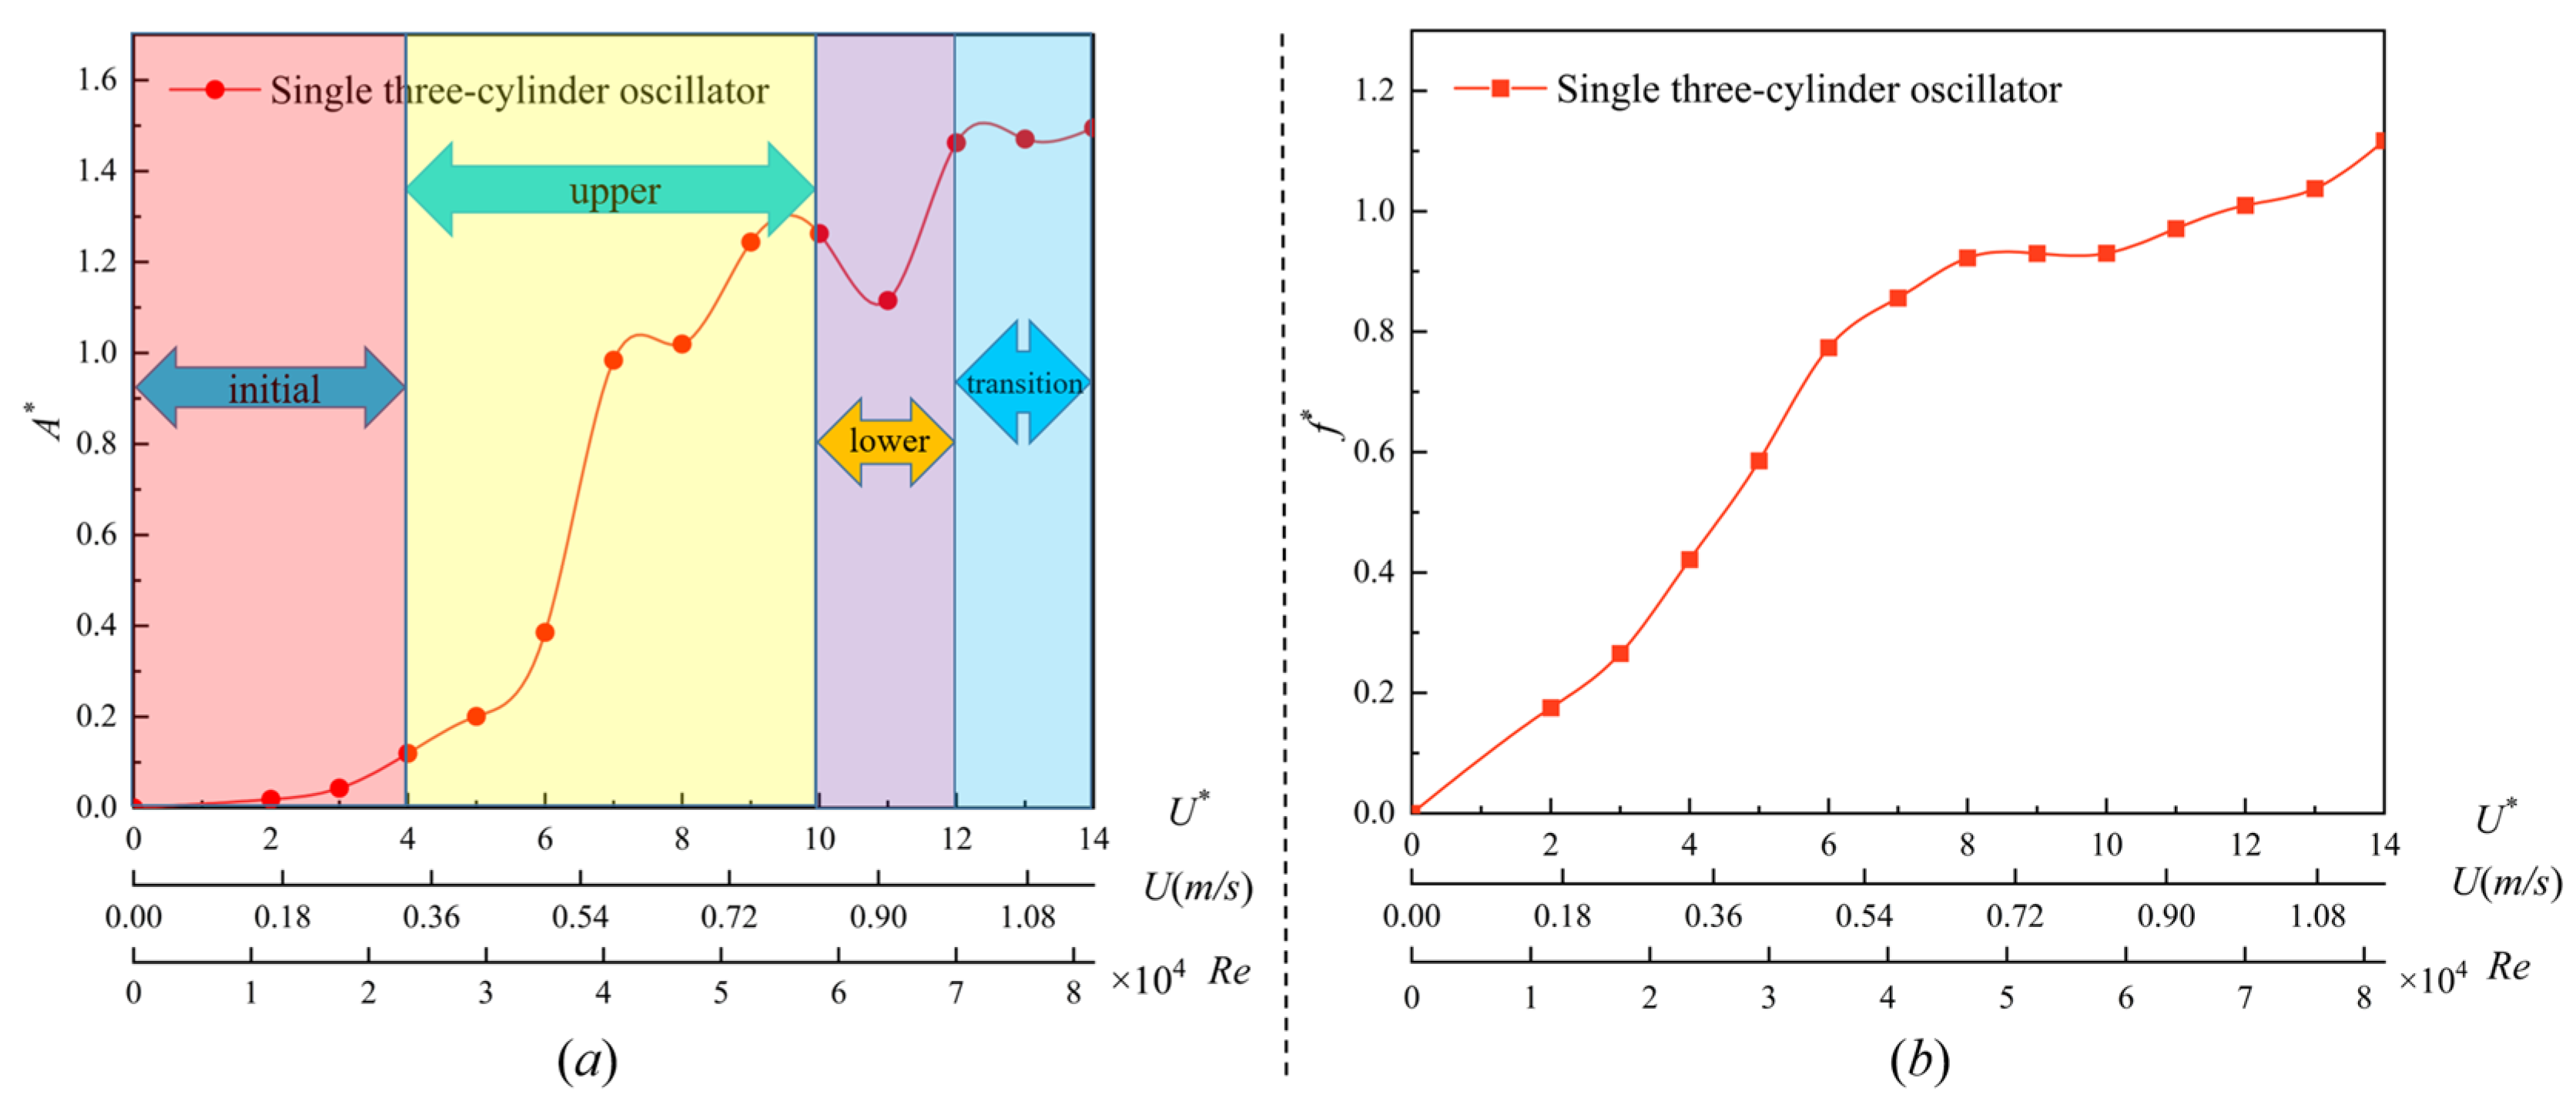
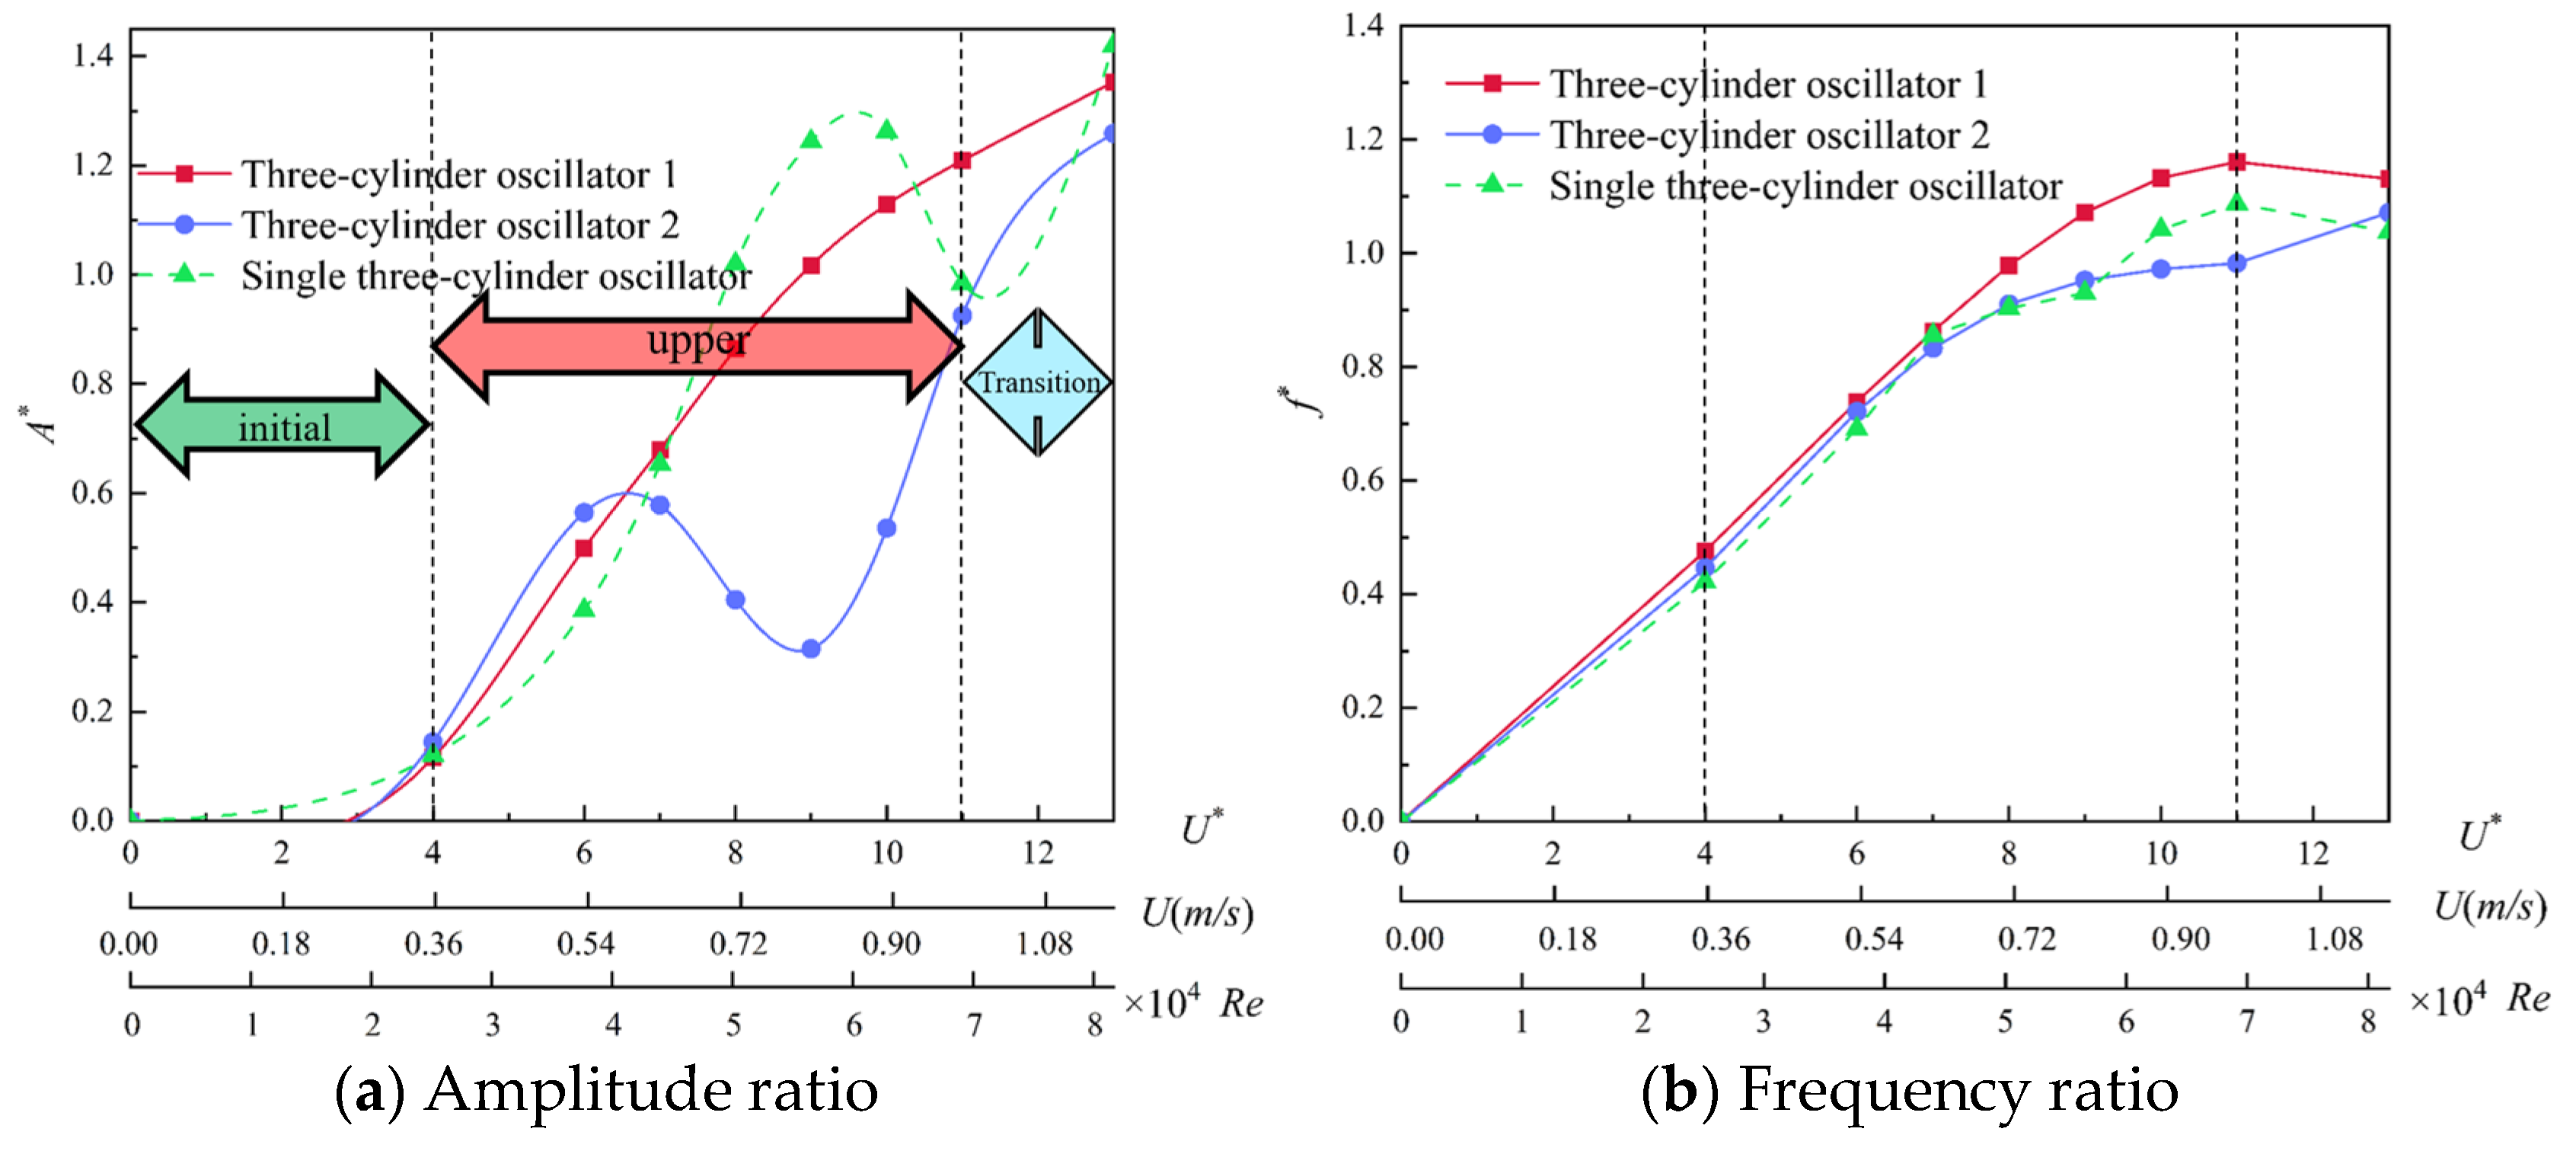
3.2.2. Analysis of the Amplitude Ratio and Frequency Ratio

The main parameters influencing the energy harvesting of the energy converter are the amplitude ratio (A*) and frequency ratio (f*). The VIV response and flow conditions were examined at different reduced velocities when Z = 8, 12, and 16, as shown in Figure 9, Figure 10 and Figure 11.
The amplitude ratio response of two tandem oscillators differs from that of a single oscillator. Different inter-oscillator ratios lead to distinct responses due to the interference of wake vortices and the integration of gap flow between the upstream and downstream oscillators. These differences manifest in the amplitude ratio, frequency ratio, and overall flow dynamics of the two oscillator structures. After the response reaches the upper branch, there is no clear lower branch observed; instead, it directly enters the transition zone from VIV to galloping vibration, as illustrated in Figure 9, Figure 10 and Figure 11. This behavior further illustrates the unique characteristics of the tandem three-cylinder oscillators with a rigidly connected structure in capturing hydrokinetic energy.
As shown in Figure 9, Figure 10 and Figure 11, it is evident that at the initial branch of reduced velocity, the excitation effect on both the upstream and downstream oscillators is relatively weak, with no significant difference in the amplitude ratio between them. In contrast, for cases where Z = 8 or 16, the downstream oscillators display a higher amplitude ratio. This phenomenon highlights the distinctive qualities of tandem three-cylinder oscillators with a rigidly connected structure in harnessing hydrokinetic energy.
When Z = 8 and U* = 7 in the upper branch of VIV, the amplitude ratio of the upstream oscillator reaches 0.475. The downstream oscillator is positively excited due to the full integration of the upstream shedding vortex and the downstream energy harvesting structure cylinder gap flow. As a result, the downstream oscillator experiences stronger hydrodynamic forces and greater amplitude compared to the upstream oscillator. However, the shedding frequency decreases due to interference from the upstream shedding vortex, leading to strong fluctuations.
The upstream cylinder can achieve a larger amplitude when the reduced velocity reaches the upper branch (U* > 7). The amplitude ratio difference between the upstream and downstream oscillators is largest when U* = 9. The amplitude ratio of downstream oscillators is only 30.97% of that of upstream oscillators. Specifically, among the Z = 8, 12, and 16, the amplitude difference is largest at Z = 16 due to the high intensity of the upstream vortex, as shown in Figure 8g. When flowing through the downstream oscillator, the wake vortex impacts and envelops the downstream oscillator, suppressing downstream vibration. Under almost the same vibration frequency, the amplitude ratio of the downstream oscillator is only 48.3% of the upstream oscillator (average value within the cycle). This indicates that the interaction between the upstream and downstream oscillators is strongest during this time.
When the reduced velocity is in the transition branch, both oscillators exhibit an increasing trend in vibration amplitudes. This occurs when the flow velocity is high, causing the shedding vortex of the upstream oscillator to directly impact the downstream oscillator. As shown in Figure 8l, the response frequency and amplitude ratio of the energy harvesting structure both increase when U* = 11. Due to the fast flow velocity, the wake shedding position of the upstream oscillator significantly deviates from the equilibrium point position. As a result, the shedding vortex can effectively interact and merge with the gap flow and wake vortex of the downstream oscillator, thereby reducing the vibration suppression effect of the downstream oscillator. Although the downstream oscillator is still influenced by the wake vortex of the upstream oscillator, its amplitude ratio is slightly lower than that of the upstream oscillator.
When the reduced velocity is in the transition branch, both oscillators show an increasing trend in vibration amplitudes due to the high flow velocity. This leads to the shedding vortex of the upstream oscillator directly impacting the downstream oscillator. In Figure 8l, both the response frequency and amplitude ratio of the energy harvesting structure increase when U* = 11. The large amplitude ratio causes the wake–shedding position of the upstream oscillator to deviate significantly from the equilibrium point. Consequently, the shedding vortex can effectively interact and merge with the gap flow and wake vortex of the downstream oscillator, reducing the vibration suppression effect. Although the downstream oscillator is still influenced by the wake vortex of the upstream oscillator, its amplitude ratio is slightly lower than that of the upstream oscillator.
Under the three inter-oscillator spacing ratios Z = 8, 12, and 16, the amplitude ratio between the upper and lower oscillators is more pronounced compared to the two groups of 8 and 16. The frequency ratio variations are most intricate when Z = 8. The amplitude gap between the leading and trailing oscillators in the initial branch is significant, with the trailing oscillator exhibiting clear advantages. When Z = 16, the disparity between the leading and trailing two oscillators in the upper response branch is the most significant among the three spacing ratios. This indicates that different Z values will result in varying levels of interference in different response branches.

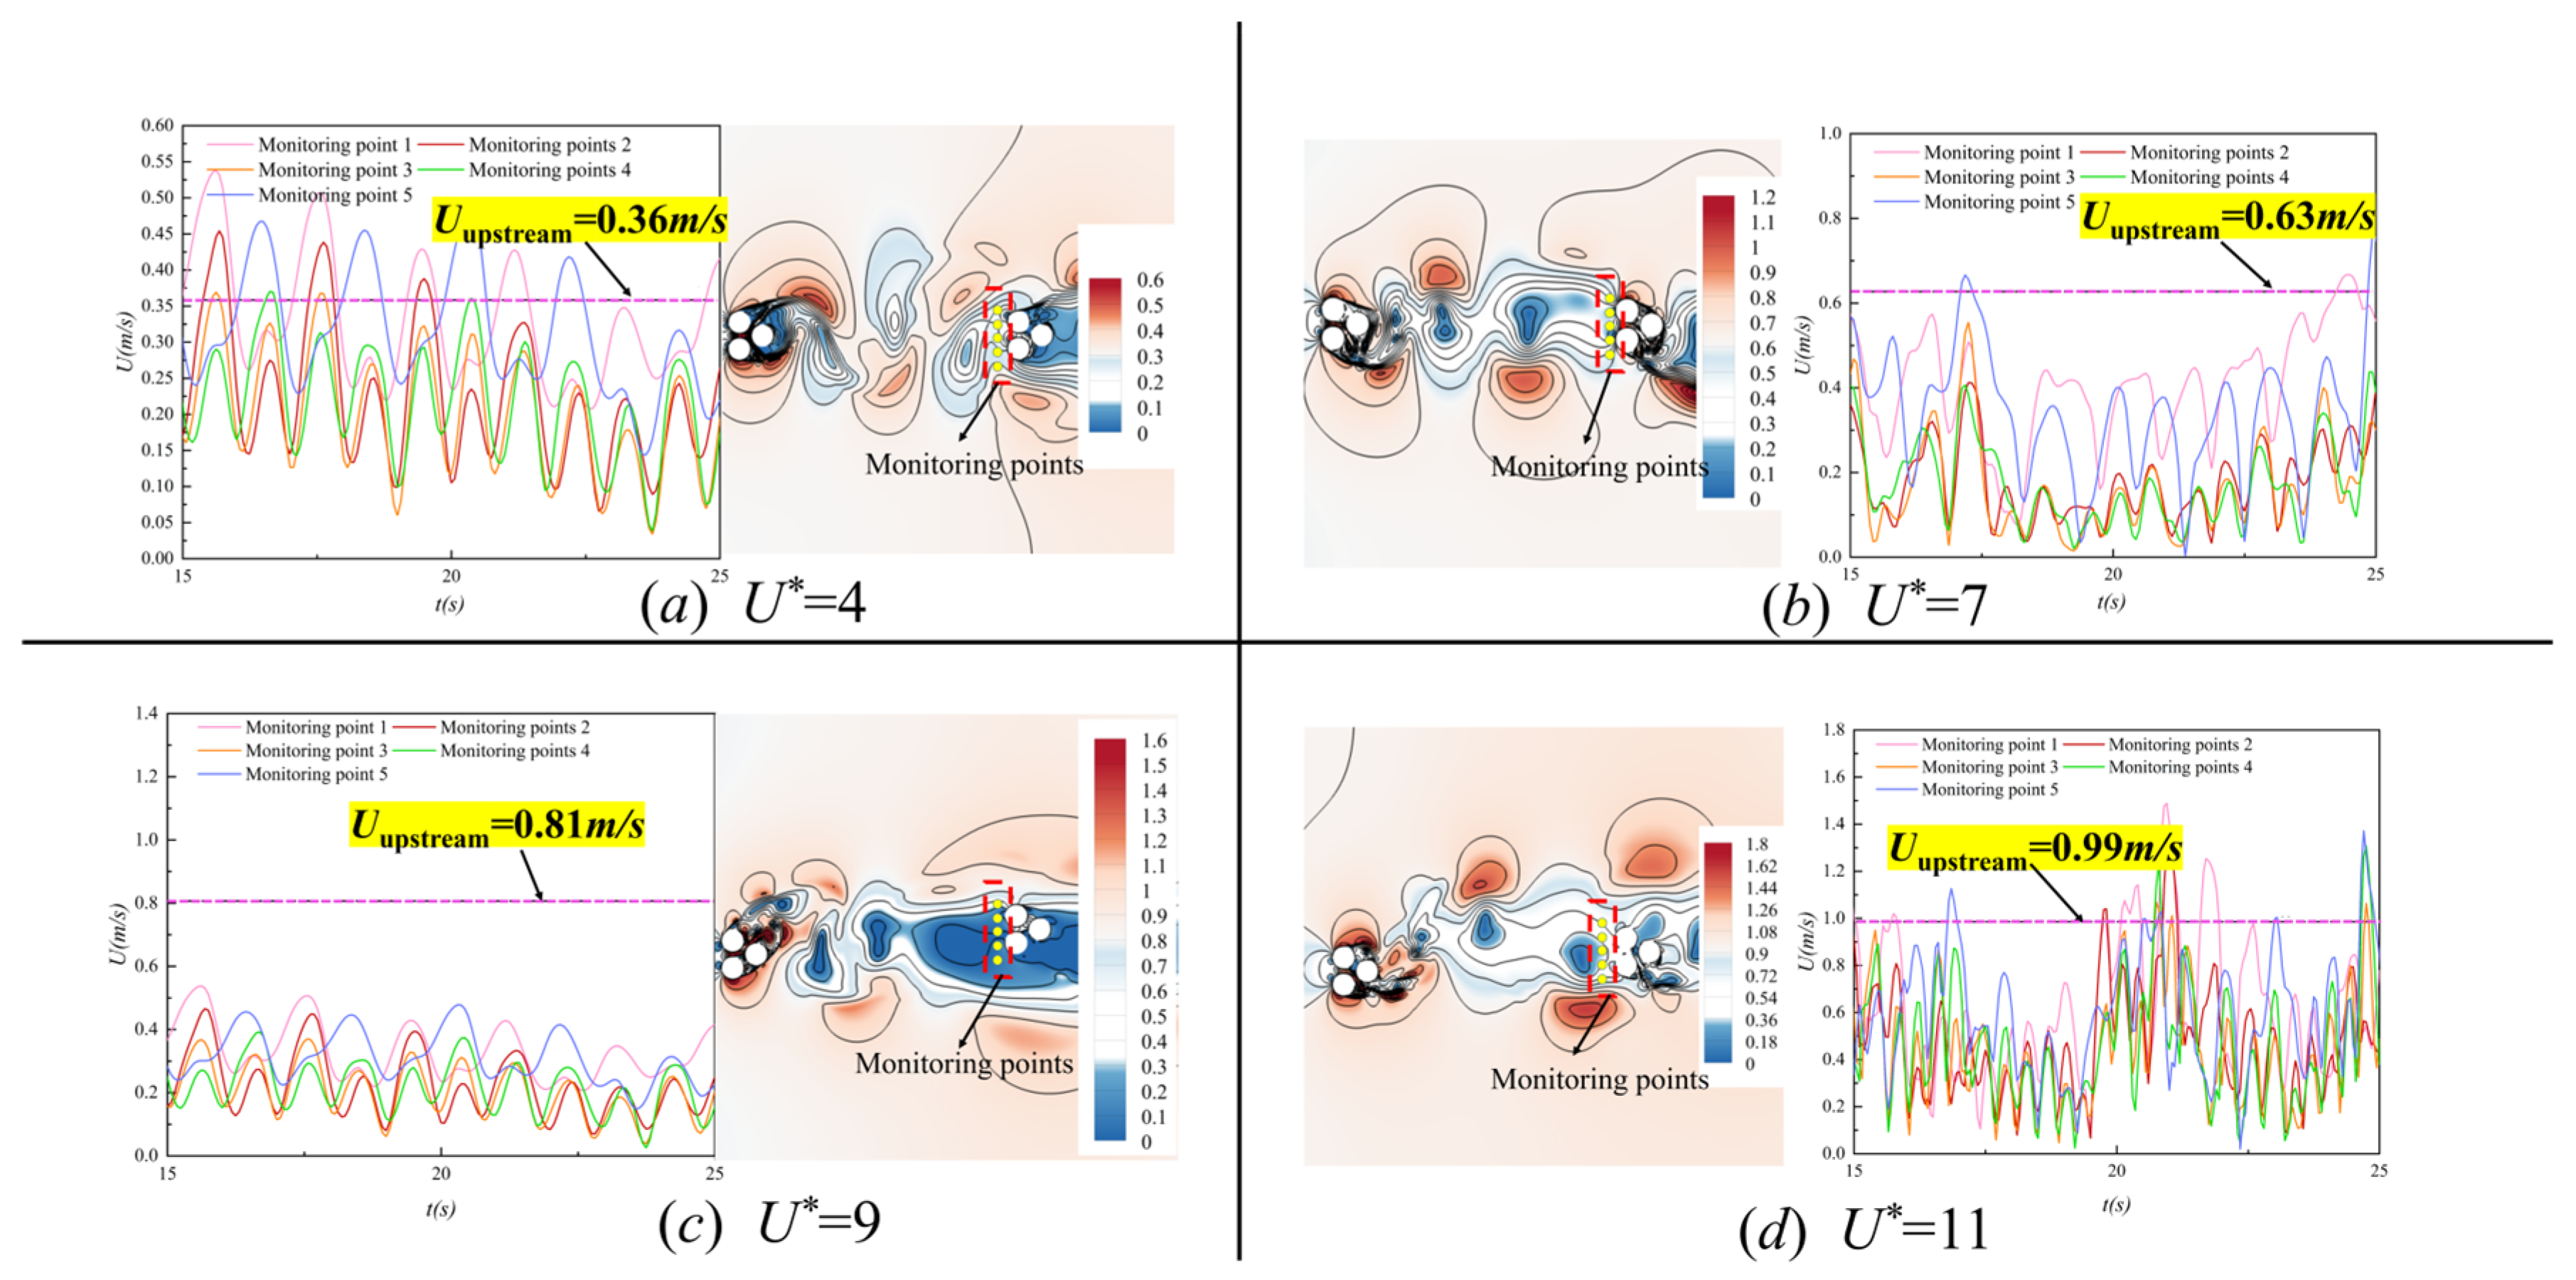
3.2.3. Effect of Incoming Flow Velocity on the Downstream Oscillator

The wake patterns of the downstream oscillator are influenced by the incoming flow velocity of the upstream oscillator, resulting in a difference in the hydrodynamic energy harvested by each oscillator. To investigate how different spacing ratios and upstream flow velocities affect the flow velocity and harvested energy of the downstream oscillator, five equally spaced monitoring points (see Figure 3) are placed 0.25D ahead of the downstream oscillator to measure the flow velocity. Real-time incoming flow velocity and velocity contour plots of the downstream oscillator for three spacing ratios are depicted in Figure 12, Figure 13 and Figure 14. The velocities at the monitoring points deviate from the inlet incoming flow velocity as the water passes through the upstream oscillator at reduced velocities.
The results depicted in Figure 12, Figure 13 and Figure 14 show that, at a constant reduced velocity, the velocities at the monitoring points differ from the inlet flow velocity once the water has passed through the upstream three-cylinder oscillator. For Z = 8, the close proximity between the upstream and downstream oscillators results in a noticeable mutual interference effect between the cylinders. This leads to a more intricate flow pattern in the wake and significant fluctuations in the incoming flow velocity at the downstream monitoring points. The velocities at each monitoring point do not follow a distinct cycle of change, with most fluctuation values in the incoming flow velocity being smaller than those at the upstream inlet. As a result, the downstream cylinder oscillator harvests less energy (Figure 12).
For Z = 12, the wake patterns of the upstream oscillator appear to be more stable, resulting in a simpler flow pattern. The velocity changes exhibit regular fluctuations, with a higher frequency of fluctuations in the initial and lower branches. The flow velocity at individual monitoring points closely resembles the inlet flow velocity, and the fluctuations between monitoring points are more consistent. Additionally, as shown in Figure 10, the amplitude changes of both the upstream and downstream oscillators are relatively gentle, with no significant variations observed.
For Z = 16, the wake patterns of the upstream oscillator are stable and can evolve into a pair of stable vortices at a sufficient distance. There is a certain regularity in the velocity fluctuation, with the velocity of the downstream oscillator being higher than that of the previous two oscillators and closer to the inlet flow velocity. When U* = 4, the amplitude ratio of the upstream and downstream oscillators is nearly identical, as shown in Figure 11. Additionally, Figure 8i illustrates that the wake vortex can fully develop into a regular shedding vortex pair. At higher flow velocities, the fluctuation slows down, indicating a weakened interaction between the two three-cylinder oscillators. Notably, at U* = 9, the velocities at the downstream monitoring points are significantly smaller than the inlet velocities, as depicted in Figure 14. Observing Figure 8k and Figure 11a, it is evident that the vortex shedding from the upstream oscillator directly collides with the downstream oscillator, resulting in a decrease in the incoming flow velocity, which is much lower than the inlet flow velocity.
The study examines how the spacing ratio between two tandem three-cylinder oscillators affects inlet velocity. The findings indicate that as the inter-oscillator spacing ratio increases, the flow velocity decreases once the water passes through the upstream oscillator. At a certain distance, the wake patterns of the upstream oscillator create a stable pair of vortices, resulting in consistent fluctuations in the inlet velocity of the downstream oscillator. This enables the downstream oscillator to closely align with the inlet velocity at a low reduced velocity (U* = 4). When U* = 9, the frequency of vortex shedding increases. This leads to a notable enhancement in the suppression effect of the regular vortex downstream oscillator. Consequently, the inflow velocity in front of the downstream oscillator becomes significantly lower than the inlet flow velocity. It is clear that the inter-oscillator spacing ratio plays a crucial role in influencing the inlet velocity of the downstream oscillator, thereby impacting the potential hydrokinetic energy that can be harvested.

3.2.4. Analysis of the Lift of Two Tandem Three-Cylinder Oscillators

Lift force is a key factor in energy conversion systems utilizing VIV for hydrokinetic energy harvesting. Figure 15 demonstrates the lift forces on both upstream and downstream three-cylinder oscillators at various spacing ratios that are then contrasted with the lift forces on a single three-cylinder oscillator.
When U* = 7, an increase in the inter-oscillator spacing ratio results in a gradual decrease in the lift value of the downstream oscillator. Specifically, the lift values are 71.86, 55.37, and 41.43 for Z values of 8, 12, and 16, respectively. Figure 9, Figure 10 and Figure 11 illustrate that as the inter-oscillator spacing ratio increases, the downstream oscillator experiences a reduction in both amplitude ratio and frequency ratio. This ultimately strengthens the suppression effect on the motion of the downstream column group.
When U* = 9, the lift difference between the upstream and downstream three-cylinder oscillators reaches its maximum value for three spacing ratios (Z = 8, 12, 16). At this reduced velocity, the connection between the gap flow and wake vortex of the upstream oscillator has a notable effect on the downstream oscillator. Strong vortices envelop the downstream oscillator, hindering its movement. Combined with Figure 9, Figure 10 and Figure 11, there are noticeable variations in the frequency and amplitude ratios of the oscillator.
The transition branch is reached when U* = 11, leading to a large upstream incoming flow velocity and noticeable turbulent kinetic energy loss. The mutual interference between the two oscillators impacts the excitation effect, causing a decrease in lift for both the upstream and downstream three-cylinder oscillators compared to the individual oscillator across all three spacing ratios.
When Z = 8, increasing the reduced velocity results in an increase in the lift force experienced by the upstream oscillator. The difference between the lift values of the upstream and downstream oscillators is maximized at U* = 9. For U* = 4 and 7, the lift value of the downstream oscillator surpasses that of the upstream oscillator. Figure 8a,b illustrates how the shedding vortex from the upstream oscillator affects the downstream oscillator, lifting it through the wake vortex effect and creating a stronger motivating force. At U* = 11, both the upstream and downstream oscillators reach their maximum lift values. As shown in Figure 8, the wake vortex detached from the upstream oscillator only collides with the outer side of the downstream column group, weakening its impact on the downstream oscillator motion and producing a slight inhibitory effect. Additionally, due to the interactions between the two three-cylinder oscillators, the peak lift values of both oscillators in the transition response branch are lower than those experienced by a single three-cylinder oscillator. Specifically, when Z = 12, the lift of the upstream oscillator increases with the increase in U*. When Z = 16, the mutual interference between the two oscillators is weakened, and the lift gradually increases with increasing reduced velocity.
In summary, under varying spacing ratios, the interaction between two oscillators impacts lift. The influence lessens as the spacing ratio increases. Significant changes in the downstream oscillator, especially at U* = 9 in the upper response branch, result in the largest lift difference between the upstream and downstream oscillators. However, as Z increases, this difference gradually diminishes.

4. Analysis of Energy Harvesting of the Two Tandem Three-Cylinder Oscillators

To harness hydrokinetic energy on a large scale, a rigidly connected staggered three-cylinder oscillator structure is utilized. The vortex-induced vibration (VIV) response and energy harvesting performance are influenced by the interaction between the upstream and downstream oscillators at different spacing ratios and reduced velocities. The energy harvesting analysis was conducted for the upstream and downstream oscillators at Z = 8, 12, and 16, considering three parameters: the magnitude of harvested energy (PVIV), energy harvesting efficiency (ηVIV), and energy harvesting density (PDensity), as illustrated in Figure 16, Figure 17 and Figure 18.
Figure 16 illustrates the harvesting energy magnitude (PVIV) of the oscillators at different inter-oscillator spacing ratios. In the lower branch, the flow velocity is significantly low, resulting in a low structural response frequency, small overall vibration amplitude, and minimal energy harvested for both the upstream and downstream oscillators. The harvesting energy curves for both oscillators are nearly identical across all spacing ratios. In the upper branch, the harvesting energy characteristics of the oscillators exhibit similar trends under different Z values. Based on previous research findings, it is evident that in the initial branch, U* < 4, the upstream oscillator exhibits a low vibration frequency, small vibration amplitude, and weak lifting force on the column group structure. Of the three spacing ratios, the downstream oscillator attains an energy harvesting efficiency of 8.4% only at Z = 8. Upon transitioning to the upper branch, particularly when 4 ≤ U* < 7, the excitation effect on the structure intensifies, leading to an increase in both the amplitude ratio and frequency ratio of the structure. When U* ≤ 7, the downstream oscillator is affected by the wake shedding from the upstream oscillator, resulting in the downstream oscillator harvesting higher energy compared to the upstream oscillator once the gap flow and wake patterns merge. This region is therefore identified as the dominant region for energy harvesting by the downstream oscillator. The response frequencies of the oscillators, when rigidly connected, approach their natural frequency in water when U* > 7. This weakens the interference effect between the upstream and downstream oscillators, causing the energy harvesting of the upstream oscillator to surpass that of the downstream oscillator. In this case, the dominant region for energy harvesting shifts to the upstream oscillator.
Figure 17 shows the energy-harvesting efficiency ηVIV of the three-cylinder oscillators under different inter-oscillator spacing ratios. The ηVIV of the upstream three-cylinder oscillator is weakly affected by Z, with consistent trends and small differences at different Z, while the downstream three-cylinder oscillator is significantly disturbed. The efficiency of the upstream three-cylinder oscillator reaches a maximum at U* = 9. At the same time, the efficiency of the upstream oscillator reaches a maximum of 38.77% at Z = 16. However, under the three spacing ratios, the downstream oscillators all have the lowest efficiency and the smallest harvesting energy at U* = 9, indicating that at this reduced velocity, the shedding vortex of the upstream oscillator acts on the downstream oscillator to inhibit the motion of the downstream oscillator, resulting in a decrease in the amplitude of the downstream oscillator. At the same time, the incoming velocity of the downstream oscillator decreases dramatically after water flow passes through the upstream oscillator, and ultimately, the harvesting energy of the downstream oscillator decreases. When the wake patterns shedding from the upstream oscillator interact with the downstream oscillator, they move back to the upstream oscillator, harvesting additional energy. After the reduced velocity increases further, the energy that can be harvested by the oscillator converter increases further but the capturing efficiency appears to decrease. Therefore, Z = 16 and U* = 9 are considered the optimal efficiency point of the upstream oscillator.
The energy-harvesting densities, PDenisty, of the two oscillators at different Z are given in Figure 18. Under the initial branch, the energy densities of the upstream and downstream oscillators at the various spacing ratios are almost indistinguishable, and the effect of the spacing ratio on the energy densities is not obvious. After entering the upper branch, the energy density increases with the increase in the reduced velocity, the energy densities of the downstream oscillator at U* = 6 are all larger than those of the upstream oscillator under the three spacing ratios, and the downstream oscillator harvests more energy after coupling with the upstream wake patterns. The upstream oscillator harvests more energy than the downstream at Z = 12 and 16 when U* = 7, but the downstream oscillator can harvest more energy when Z = 8. This shows that the space ratio Z affects the energy density of the upstream and downstream three-cylinder oscillator harvesting energy slightly.
In summary, the effect of Z on the harvesting energy of the tandem three-cylinder rigidly connected oscillators is not obvious. The energy harvesting value and energy density of the upstream oscillator increase as U* rises, particularly on the upper-end branch where the increase is more rapid, before leveling off at the transition branch. Conversely, the downstream oscillator experiences a decrease in the energy harvesting value at the upper branch, influenced by the incoming flow rate and reduced lift. Notably, the highest captive energy efficiency of the upstream oscillator and the lowest captive energy efficiency of the downstream three-cylinder oscillator both occur at U* = 9

5. Conclusions

This study aimed to investigate the effects of different spacing ratios on the vortex-induced vibration (VIV) response and energy harvesting characteristics of a structure consisting of three rigidly connected cylinders. Numerical fluid–solid interaction methods were employed for this investigation. The main findings of the study are as follows:
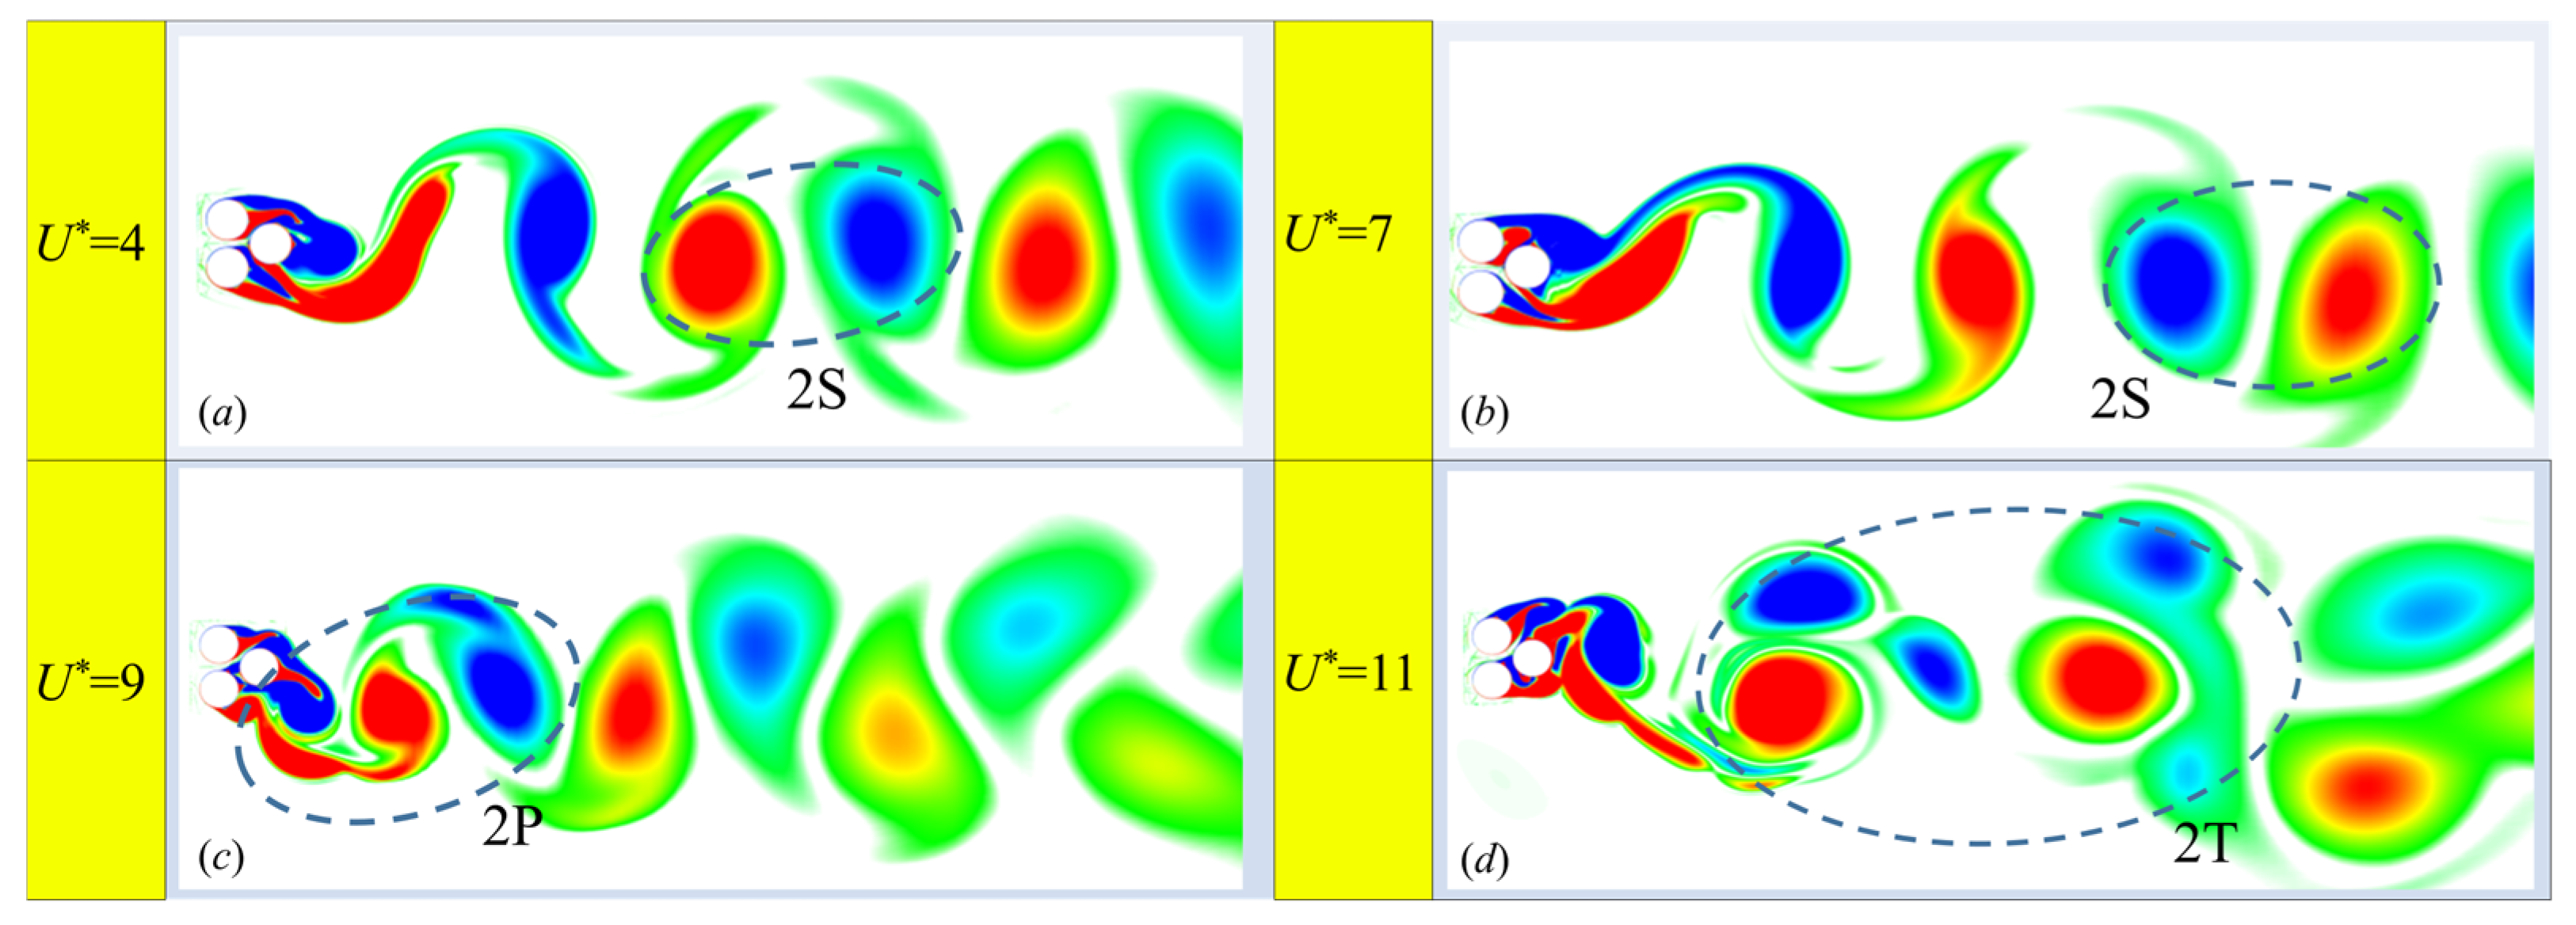
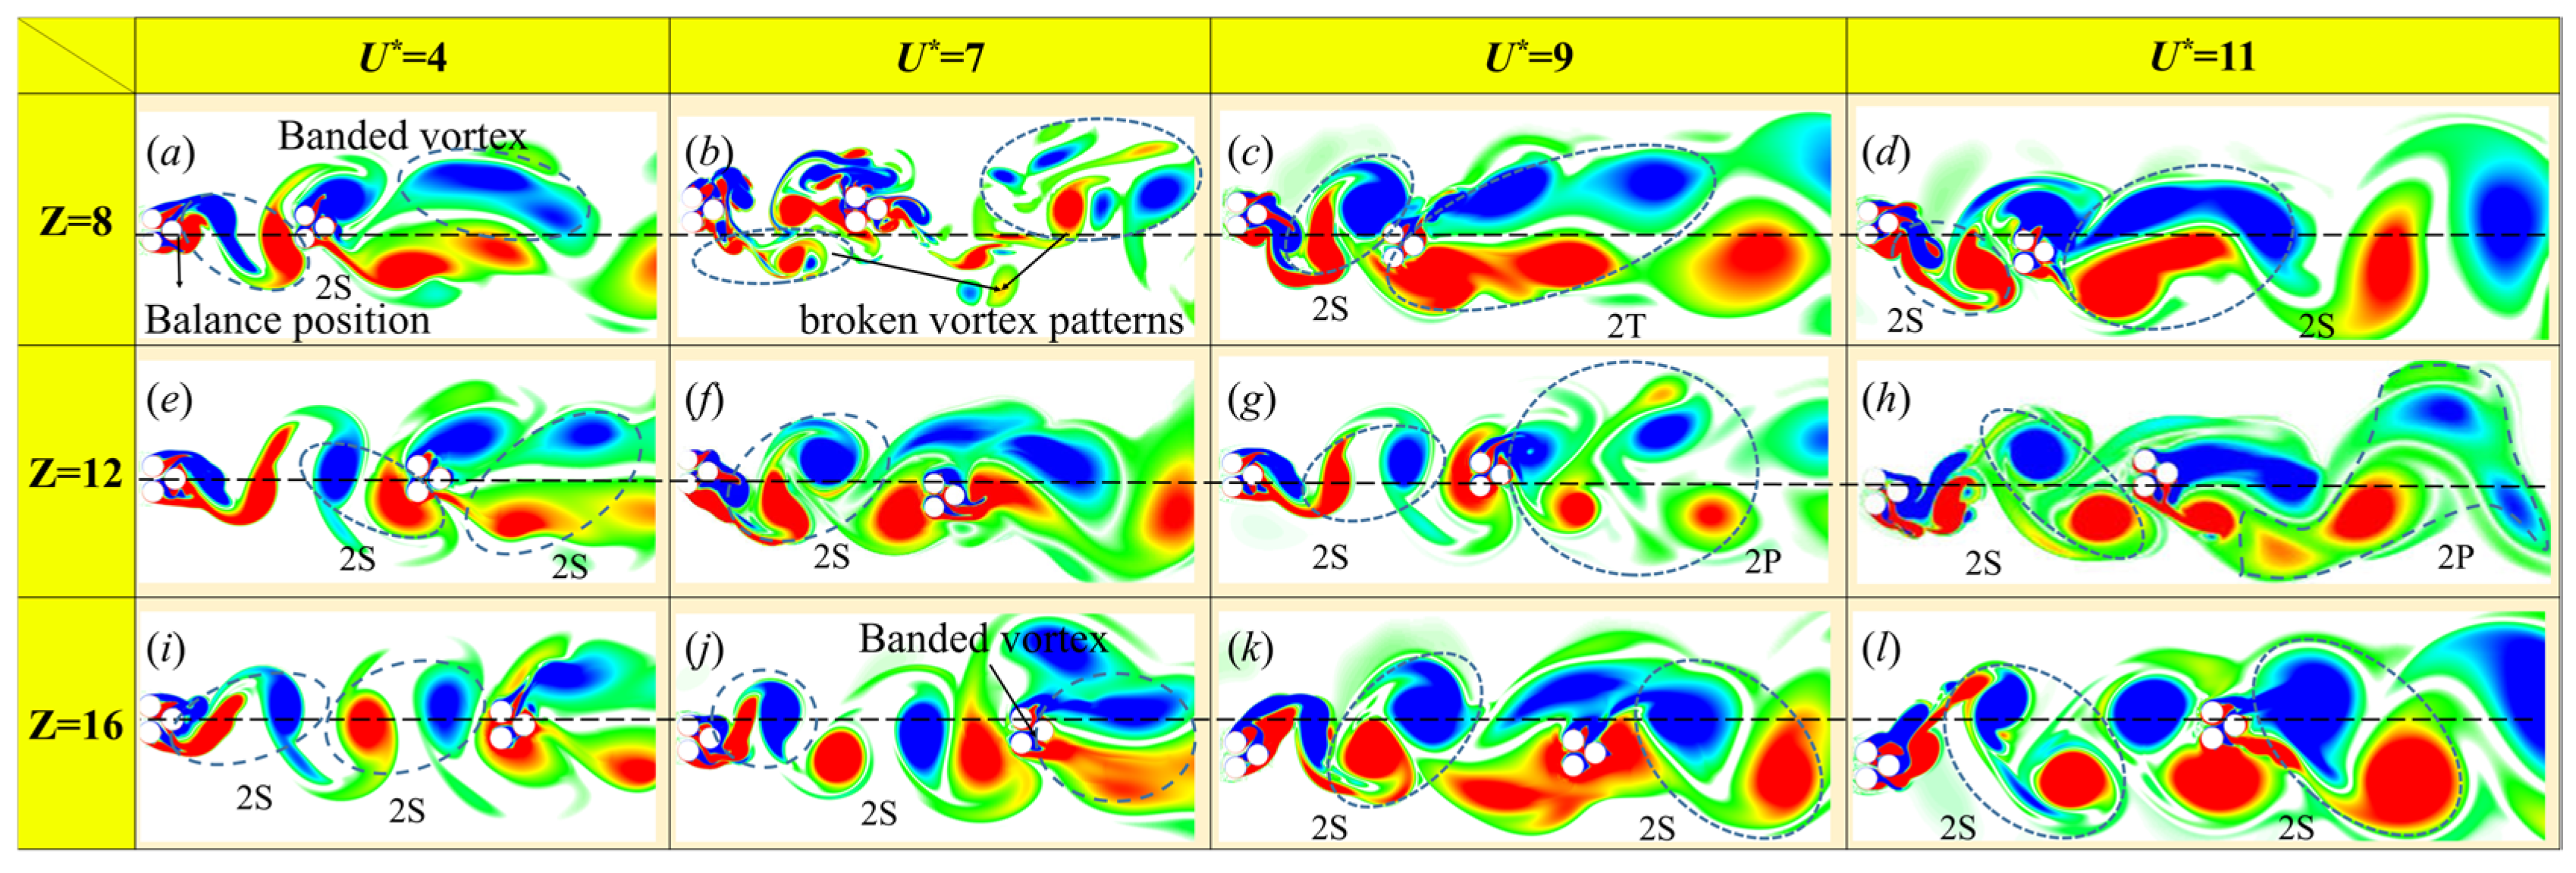
  • When analyzing two rigidly connected oscillators with different inter-oscillator space ratios, the shedding vortices and wake flow patterns of the energy harvesting structure demonstrate more complex fluid–structure coupling effects compared with independent single oscillators. The wake vortices primarily correspond to the 2S and 2P modes. For a specific scenario where Z = 12 and U* = 9 or 11, the wake patterns of the downstream oscillator are in the 2P mode. In individual cases, the oscillators strongly interfere with each other, resulting in the formation of banded vortices and a significant number of broken vortices.
  • In the structure of two tandem rigidly connected oscillators, the amplitude ratio of the vortex-excited vibration response of the upstream oscillator is not significantly influenced by the spacing ratio between the oscillators. However, the downstream oscillator, which is interfered with by the upstream shedding tail vortex, has a significantly disturbed VIV response and a large change in the amplitude ratio.
  • At Z = 8, there is a clear interaction between the upstream and downstream oscillators, with the frequency ratio changing alternately. The spacing ratio between oscillators increases, allowing the upstream oscillator to achieve a higher amplitude ratio. At Z = 16, the amplitude ratio of the upstream oscillator is consistently larger than that of the downstream oscillator across all reduced velocities.
  • When the inter-oscillator spacing is small (Z = 8), the downstream oscillator experiences intense flow velocity fluctuations with a fast fluctuation frequency. As Z increases, the velocity fluctuations gradually decrease, exhibiting more noticeable regularity. With U* = 4, as Z increases, the downstream oscillator flow velocity is weakened by interference from the upstream tail vortex, allowing it to eventually approach the inlet flow velocity.
  • Overall, the lift value of the upstream oscillator increases as the reduced velocity increases, but the lift value of the downstream oscillator is noticeably affected by the inter-oscillator spacing ratio. When U* = 7, the lift value of the downstream oscillator decreases as the inter-oscillator spacing ratio increases. The difference in lift value between Z = 8 and Z = 16 is 42.34%.
  • The energy harvesting effect of the tandem rigidly connected oscillator structure is minimally impacted by parameter Z within the vortex-induced vibration range. Variations in inter-oscillator spacing ratios result in noticeable differences in the upper branch. The interference between the upstream and downstream oscillators is most pronounced when U* = 9. The upstream oscillator achieves maximum energy harvesting efficiency, reaching 38.77%, while the downstream oscillator achieves a minimum efficiency of 3.92%. This results in a significant difference of 34.85% in energy harvesting efficiency. Under this condition, the majority of incoming energy is harvested by the upstream oscillator.
  • PVIV and PDenisty increase with increasing U*. The rate of increase in the energy harvesting value and energy density is greatest in the upper branch. The maximum growth rate of the energy density of the upstream oscillator is 39.71% from U* = 8 to U* = 9 when Z = 8. Additionally, the maximum growth rate of the captured energy value is 32.19% when Z = 16.
In conclusion, the spacing ratio and flow velocity have a small effect on the vortex-induced vibration (VIV) response and capture performance of the upstream oscillator, but a large effect on the downstream oscillator. Therefore, it can be positioned in the upstream branch by tuning the hydrodynamic vibration response of the energy harvesting structure based on the incoming flow velocity. Additionally, fully utilizing the ocean current by selecting an appropriate oscillator spacing ratio can enhance the energy-harvesting efficiency of the downstream oscillator. The study’s findings offer valuable theoretical guidance and reference for the practical implementation of VIV-based energy harvesting. However, as the study relies on two-dimensional numerical simulations, further exploration is necessary to fully comprehend the eddy current-induced vibration mechanism of tandem multi-cylindrical oscillators.

Author Contributions

Conceptualization, H.C.; Software, T.Y.; Data curation, G.D.; Validation, H.C.; Writing, H.C.; Writing—review and editing, Z.L. and T.Y.; Supervision, G.D.; Funding acquisition, Z.L.; resource, Z.L. All authors have read and agreed to the published version of the manuscript.

Funding

This research was funded by the National Natural Science Foundation of China (NSFC) (Grant no. 52069010) and Applied Basic Research Key Project of Yunnan (Applied Basic Research Key Project of Yunnan Province) (Grant no. 202401AS070058).

Institutional Review Board Statement

This article does not contain any studies with human participants or animals performed by any of the authors.

Informed Consent Statement

Not applicable.

Data Availability Statement

All data, models, and code generated or used during the study appear in the submitted article.

Acknowledgments

I would like to thank Zhumei Luo for his guidance during the research process, and my fellow students for helping me with my studies.

Conflicts of Interest

The authors declare no conflicts of interest.

References

  1. Zhao, D.; Zhou, J.; Tan, T.; Yan, Z.; Sun, W.; Yin, J.; Zhang, W. Hydrokinetic piezoelectric energy harvesting by wake induced vibration. Energy 2021, 220, 119722. [Google Scholar] [CrossRef]
  2. Ibrahim, W.I.; Mohamed, M.R.; Ismail, R.M.T.R.; Leung, P.K.; Xing, W.W.; Shah, A.A. Hydrokinetic energy harnessing technologies: A review. Energy Rep. 2021, 7, 2021–2042. [Google Scholar] [CrossRef]
  3. Neshat, M.; Mirjalili, S.; Sergiienko, N.Y.; Esmaeilzadeh, S.; Amini, E.; Heydari, A.; Garcia, D.A. Layout optimisation of offshore wave energy converters using a novel multi-swarm cooperative algorithm with backtracking strategy: A case study from coasts of Australia. Energy 2022, 239, 122463. [Google Scholar] [CrossRef]
  4. Rostami, A.B.; Armandei, M. Renewable energy harvesting by vortex-induced motions: Review and benchmarking of technologies. Renew. Sustain. Energy Rev. 2017, 70, 193–214. [Google Scholar] [CrossRef]
  5. Wang, J.; Geng, L.; Ding, L.; Zhu, H.; Yurchenko, D. The state-of-the-art review on energy harvesting from flow-induced vibrations. Appl. Energy 2020, 267, 114902. [Google Scholar] [CrossRef]
  6. Wu, Z.; Ye, W.; Liu, R. Dynamics of a novel bistable electromagnetic vibration energy harvester. Chin. J. Appl. Mech. 2017, 34, 848–854. [Google Scholar] [CrossRef]
  7. Laws, N.D.; Epps, B.P. Hydrokinetic energy conversion: Technology, research, and outlook. Renew. Sustain. Energy Rev. 2016, 57, 1245–1259. [Google Scholar] [CrossRef]
  8. Wang, J.; Su, Z.; Li, H.; Ding, L.; Zhu, H.; Gaidai, O. Imposing a wake effect to improve clean marine energy harvesting by flow-induced vibrations. Ocean Eng. 2020, 208, 107455. [Google Scholar] [CrossRef]
  9. Kim, G.-Y.; Lim, C.; Kim, E.S.; Shin, S.-C. Prediction of Dynamic Responses of Flow-Induced Vibration Using Deep Learning. Appl. Sci. 2021, 11, 7163. [Google Scholar] [CrossRef]
  10. Yuce, M.I.; Muratoglu, A. Hydrokinetic energy conversion systems: A technology status review. Renew. Sustain. Energy Rev. 2015, 43, 72–82. [Google Scholar] [CrossRef]
  11. Mohammadi, S.; Hassanalian, M.; Arionfard, H.; Bakhtiyarov, S. Optimal design of hydrokinetic turbine for low-speed water flow in Golden Gate Strait. Renew. Energy 2020, 150, 147–155. [Google Scholar] [CrossRef]
  12. Shi, X.; Dong, J.; Yan, G.; Zhu, C. Flow around a rectangular cylinder placed in achannel with a high blockage ratio under a subcritical Reynolds number. Water 2021, 13, 3388. [Google Scholar] [CrossRef]
  13. Park, H.; Mentzelopoulos, A.P.; Bernitsas, M.M. Hydrokinetic energy harvesting fb3berom slow currents using flow-induced oscillations. Renew. Energy 2023, 214, 242–254. [Google Scholar] [CrossRef]
  14. Ding, L.; Bernitsas, M.M.; Kim, E.S. 2-D URANS vs. experiments of flow induced motions of two circular cylinders in tandem with passive turbulence control for 30,000 < Re < 105,000. Ocean Eng. 2013, 72, 429–440. [Google Scholar] [CrossRef]
  15. Kim, E.S.; Sun, H.; Park, H.; Shin, S.-C.; Chae, E.J.; Ouderkirk, R.; Bernitsas, M.M. Development of an alternating lift converter utilizing flow-induced oscillations to harness horizontal hydrokinetic energy. Renew. Sustain. Energy Rev. 2021, 145, 111094. [Google Scholar] [CrossRef]
  16. Modir, A.; Goudarzi, N. Experimental investigation of Reynolds number and spring stiffness effects on vortex induced vibrations of a rigid circular cylinder. Eur. J. Mech. B Fluids 2019, 74, 34–40. [Google Scholar] [CrossRef]
  17. Bernitsas, M.M.; Ben-Simon, Y.; Raghavan, K.; Garcia, E.M.H. The VIVACE converter: Model tests at high damping and reynolds number around 105. In Proceedings of the 25th International Conference on Offshore Mechanics and Arctic Engineering, Hamburg, Germany, 4–9 June 2006; pp. 639–653. [Google Scholar] [CrossRef]
  18. Bernitsas, M.M.; Raghavan, K.; Ben-Simon, Y.; Garcia, E.M.H. VIVACE (Vortex Induced Vibration Aquatic Clean Energy): A New Concept in Generation of Clean and Renewable Energy From Fluid Flow. J. Offshore Mech. Arct. Eng. 2008, 130, 10–24. [Google Scholar] [CrossRef]
  19. Sun, H.; Ma, C.; Bernitsas, M.M. Hydrokinetic Power Conversion using Flow Induced Vibrations with Nonlinear (adaptive piecewise-linear) Springs. Energy 2016, 143, 1085–1106. [Google Scholar] [CrossRef]
  20. Narendran, K.; Murali, K.; Sundar, V. Investigations into efficiency of vortex induced vibration hydro-kinetic energy device. Energy 2016, 109, 224–235. [Google Scholar] [CrossRef]
  21. Williamson, C.H.K.; Govardhan, R. Vortex-Induced Vibrations. Annu. Rev. Fluid Mech. 2004, 36, 413–455. [Google Scholar] [CrossRef]
  22. Sun, H.; Ma, C.; Kim, E.S.; Nowakowski, G.; Mauer, E.; Bernitsas, M.M. Hydrokinetic energy conversion by two rough tandem-cylinders in flow inducedmotions: Effect of spacing and stiffness. Renew. Energy 2017, 107, 61–80. [Google Scholar] [CrossRef]
  23. Ma, C.; Sun, H.; Nowakowski, G.; Mauer, E.; Bernitsas, M.M. Nonlinear piecewise restoring force in hydrokinetic power conversion using flow induced motions of single cylinder. Ocean Eng. 2016, 128, 1–12. [Google Scholar] [CrossRef]
  24. Sun, H.; Ma, C.; Kim, E.S.; Nowakowski, G.; Mauer, E.; Bernitsas, M.M. Flow-induced vibration of tandem circular cylinders with selective roughness: Effect of spacing, damping and stiffness. Eur. J. Mech. B Fluids 2019, 74, 219–241. [Google Scholar] [CrossRef]
  25. Zhang, B.; Song, B.; Mao, Z.; Li, B.; Gu, M. Hydrokinetic energy harnessing by spring-mounted oscillators in FIM with different cross sections: From triangle to circle. Energy 2019, 189, 116249. [Google Scholar] [CrossRef]
  26. Zhu, H.; Tang, T.; Zhou, T.; Cai, M.; Gaidai, O.; Wang, J. High performance energy harvesting from flow-induced vibrations in trapezoidal oscillators. Energy 2021, 236, 121484. [Google Scholar] [CrossRef]
  27. Sun, C.; Zhou, T.; An, H.; Zhu, H.; Cheng, L. On the study of vortex-induced vibration of circular cylinders covered with different roughness. Appl. Ocean Res. 2022, 124, 103215. [Google Scholar] [CrossRef]
  28. Zhang, B.; Song, B.; Mao, Z.; Tian, W.; Li, B. Numerical investigation on VIV energy harvesting of bluff bodies with different cross sections in tandem arrangement. Energy 2017, 133, 723–736. [Google Scholar] [CrossRef]
  29. Xu, W.; Yang, M.; Wang, E.; Sun, H. Performance of single-cylinder VIVACE converter for hydrokinetic energy harvesting from flow-induced vibration near a free surface. Ocean Eng. 2020, 218, 108168. [Google Scholar] [CrossRef]
  30. Assi, G.R.S.; Bearman, P.W.; Meneghini, J.R. On the wake-induced vibration of tandem circular cylinders: The vortex interaction excitation mechanism. J. Fluid Mech. 2010, 661, 365–401. [Google Scholar] [CrossRef]
  31. Zhang, B.; Mao, Z.; Song, B.; Ding, W.; Tian, W. Numerical investigation on effect of damping-ratio and mass-ratio on energy harnessing of a square cylinder in FIM. Energy 2018, 144, 218–231. [Google Scholar] [CrossRef]
  32. Zhang, B.; Mao, Z.; Song, B.; Tian, W.; Ding, W. Numerical investigation on VIV energy harvesting of four cylinders in close staggered formation. Ocean Eng. 2018, 165, 55–68. [Google Scholar] [CrossRef]
  33. Luo, Z.; Nie, C.; Guo, T. Study on concentrated capture of Marine current power by VIV driven cylinder group structure. Acta Energiae Solaris Sin. 2020, 42, 89–94. (In Chinese) [Google Scholar] [CrossRef]
  34. Kim, E.S.; Bernitsas, M.M. Performance prediction of horizontal hydrokinetic energy converter using multiple-cylinder synergy in flow induced motion. Appl. Energy 2016, 170, 92–100. [Google Scholar] [CrossRef]
  35. Qiu, T.; Xu, Q.; Du, X.; Zhao, Y.; Lin, W. VIV of twin square cylinders in various configurations at a low Reynolds number. Ocean Eng. 2022, 260, 112067. [Google Scholar] [CrossRef]
  36. Wang, W.; Song, B.; Mao, Z.; Tian, W.; Zhang, T. Numerical investigation on VIV suppression of the cylinder with the bionic surface inspired by giant cactus. Ocean Eng. 2020, 214, 107775. [Google Scholar] [CrossRef]
  37. Chen, W.; Ji, C.; Williams, J.; Xu, D.; Yang, L.; Cui, Y. Vortex-induced vibrations of three tandem cylinders in laminar cross-flow: Vibration response and galloping mechanism. J. Fluids Struct. 2018, 78, 215–238. [Google Scholar] [CrossRef]
  38. Zou, Q.; Ding, L.; Zou, R.; Kong, H.; Wang, H.; Zhang, L. Two-degree-of-freedom flow-induced vibration of two circular cylinders with constraint for different arrangements. Ocean Eng. 2021, 225, 108806. [Google Scholar] [CrossRef]
  39. Liu, G.; Song, Z.; Xu, W.; Sha, M. Numerical study on the VIVs of two side-by-side elastically coupled cylinders under different Re and natural frequencies. Ocean Eng. 2023, 284, 115261. [Google Scholar] [CrossRef]
  40. Zhu, H.; Zhao, Y.; Qiu, T.; Lin, W.; Du, X.; Dong, H. Vortex-induced vibrations of two tandem rigidly coupled circular cylinders with streamwise, transverse, and rotational degrees of freedom. Phys. Fluids 2023, 35, 023606. [Google Scholar] [CrossRef]
  41. Han, P.; Pan, G.; Tian, W. Numerical simulation of flow-induced motion of three rigidly coupled cylinders in equilateral-triangle arrangement. Phys. Fluids 2018, 30, 125107. [Google Scholar] [CrossRef]
  42. Han, P.; Pan, G.; Zhang, B.; Wang, W.; Tian, W. Three-cylinder oscillator under flow: Flow induced vibration and energy harvesting. Ocean Eng. 2020, 211, 107619. [Google Scholar] [CrossRef]
  43. Barrero-Gil, A.; Alonso, G.; Sanz-Andres, A. Energy harvesting from transverse galloping. J. Sound Vib. 2010, 329, 2873–2883. [Google Scholar] [CrossRef]
  44. Zhao, M.; Tong, F.; Cheng, L. Numerical Simulation of Two-Degree-of-Freedom Vortex-Induced Vibration of a Circular Cylinder Between Two Lateral Plane Walls in Steady Currents. J. Fluids Eng. 2012, 134, 1097–1110. [Google Scholar] [CrossRef]
  45. Khalak, A.; Williamson, C.H.K. Dynamics of a hydroelastic cylinder with very low mass and damping. J. Fluids Struct. 1996, 10, 455–472. [Google Scholar] [CrossRef]
  46. Gu, M.; Song, B.; Zhang, B.; Mao, Z.; Tian, W. The effects of submergence depth on Vortex-Induced Vibration (VIV) and energy harvesting of a circular cylinder. Renew. Energy 2020, 151, 931–945. [Google Scholar] [CrossRef]
Figure 1. Schematic diagram of the energy conversion device and its oscillator.
Jmse 12 00515 g001
Figure 2. The two-way solution concept of the flow–solid interaction.
Jmse 12 00515 g002
Figure 3. Computational domain and mesh division.
Jmse 12 00515 g003
Figure 4. Comparison of amplitude ratio A* between the numerical results and experimental results [45,46].
Jmse 12 00515 g004
Figure 5. Lift coefficient of grid minimums of 0.005, 0.001, and 0.0005.
Jmse 12 00515 g005
Figure 6. Numerical results of a single three-cylinder oscillator: (a) Amplitude ratio of a single three-cylinder oscillator (b) Frequency ratio of a single three-cylinder oscillator.
Jmse 12 00515 g006
Figure 7. Wake vortex patterns of a single three-cylinder oscillator with rigid connection (different colors mean different directions of rotation).
Jmse 12 00515 g007
Figure 8. Wake vortex pattern of the tandem rigidly connected three-cylinder oscillator: Z = 8 (a) U* = 4, (b) U* = 7, (c) U* = 9, (d) U* = 11, Z = 12, (e) U* = 4, (f) U* = 7, (g) U* = 9, (h) U* = 11, Z = 16, (i) U* = 4, (j) U* = 7, (k) U* = 9, (l) U* = 11. (different colors mean different directions of rotation).
Jmse 12 00515 g008
Figure 9. The amplitude ratio and the frequency ratio under an inter-oscillator spacing ratio Z = 8.
Jmse 12 00515 g009
Figure 10. The amplitude ratio and the frequency ratio under an inter-oscillator spacing ratio Z = 12.
Jmse 12 00515 g010
Figure 11. The amplitude ratio and the frequency ratio under ab inter-oscillator spacing ratio Z = 16.
Jmse 12 00515 g011
Figure 12. Real-time velocity and velocity contour cloud chart of the two three-cylinder oscillators at Z = 8.
Jmse 12 00515 g012
Figure 13. Real-time velocity and velocity contour cloud chart of the two three-cylinder oscillators at Z = 12.
Jmse 12 00515 g013
Figure 14. Real-time velocity and velocity contour cloud chart of the two three-cylinder oscillators at Z = 16.
Jmse 12 00515 g014
Figure 15. Lift diagram of two three-cylinder oscillators (a) At Z = 8, (b) At Z = 8, (c) At Z = 16.
Jmse 12 00515 g015
Figure 16. Harvesting energy PVIV of the two three-cylinder oscillators at different inter-oscillator spacing ratios, Z.
Jmse 12 00515 g016
Figure 17. Harvesting the energy efficiency ηVIV of the two three-cylinder oscillators at different inter-oscillator spacing ratios, Z.
Jmse 12 00515 g017
Figure 18. Energy harvesting density PDenisty of the two three-cylinder oscillators at different spacing ratios, Z.
Jmse 12 00515 g018
Table 1. Symbols for parameters associated with VIV.
SymbolDescriptionSymbolDescription
A (mm)Amplitude of vibrationA* = A/DAmplitude ratio
foscOscillating cylinder frequencyf* = fosc/fn,waterFrequency ratio
Z = S / DInter-oscillator spacing ratioCaAdded mass coefficient
K (N · m)Spring stiffnessm* = mosc/mdMass ratio
CTotal system dampingRe = UD/vReynolds number
ξ t o t a l = C t o t a l 2 K m o s c + m a Damping ratio f n , w a t e r = 2 π 4 m o s c + m a Natural Frequency in water
v (m2/s)Kinematic viscosityU (m/s)Flow velocity
m o s c Mass of cylindersU* = U/( f n , w a t e r D) Reduced velocity
L (m)Length of cylinderma = CamdAdded mass
D (m)Cylinder’s diameter m d = π 4 ρ w D 2 L Cylindrical drainage quality
Table 2. Main parameters of the flow and VIV energy converter.
DescriptionSymbolValue
Height of the square cylinderD (m)0.08
Spring stiffnessK (N · m)592
Mass ratiom* 1.8
Flow velocityU (m/s)0.16~1.12
Reduced velocityU* 2~13
Natural frequency in water f n , w a t e r 1.12
Length of cylinderL (mm)1000
Kinematic viscosity of waterv (m2/s)1.14 × 10−6
Damping ratio ξ t o t a l 0.1
Table 3. Experimental parameters in numerical methods used for validation.
DescriptionSymbolValue
Diameter of the cylinderD (m)0.0508
Spring stiffnessK (N · m)43.5
Mass ratiom* 2.4
Reduced velocity U* 2–14
Natural frequencyfn,water1.12
Kinematic viscosity v 1.14 × 10⁻⁶
Water densityρ1000
Table 4. Average max lift coefficients for different grids.
Number of Minimum Grid Number of Grid Average Max Lift Coefficient
0.00574,7122.347314
0.001418,9892.179511 (7.148%)
0.000511,459,6692.17680 (0.124%)
Table 5. Average max lift coefficients for different time steps.
Time StepAverage Max Lift Coefficient
0.0032.2954
0.00252.256 (1.718%)
0.0012.2457 (0.456%)
Disclaimer/Publisher’s Note: The statements, opinions and data contained in all publications are solely those of the individual author(s) and contributor(s) and not of MDPI and/or the editor(s). MDPI and/or the editor(s) disclaim responsibility for any injury to people or property resulting from any ideas, methods, instructions or products referred to in the content.

