Article

Numerical Study on Wave Dissipation and Mooring Force of a Horizontal Multi-Cylinder Floating Breakwater

1
State Key Laboratory of Hydraulic Engineering Intelligent Construction and Operation, Tianjin University, Tianjin 300350, China
2
Key Laboratory of Earthquake Engineering Simulation and Seismic Resilience of China Earthquake Administration, Tianjin University, Tianjin 300350, China
3
Transport Planning and Research Institute, Ministry of Transport, Beijing 100028, China
4
School of Civil Engineering, Hebei University of Science & Technology, Shijiazhuang 050018, China
5
School of Engineering, Civil, Environmental and Mining Engineering, The University of Western Australia, Perth 6009, Australia
*
Author to whom correspondence should be addressed.
J. Mar. Sci. Eng. 2024, 12(3), 449; https://doi.org/10.3390/jmse12030449
Submission received: 25 January 2024 / Revised: 23 February 2024 / Accepted: 29 February 2024 / Published: 1 March 2024

Abstract

:
A three-dimensional numerical model was established based on ANSYS-AQWA (R19.0) software for the purpose of analyzing the hydrodynamic characteristics of a floating breakwater. This study examines three distinct floating breakwaters with different cross-sectional designs in order to evaluate their respective wave dissipation capabilities. It is suggested that the horizontal multi-cylinder floating breakwater exhibits a superior ability to dissipate waves when compared to both the single-cylinder and square pontoon configurations and can be deemed the most advantageous shielding strategy for potential engineering applications. Subsequently, this study examines the effects of influential parameters, including a large cylinder diameter, a small cylinder diameter, the angular position of the small cylinder, and the height and period of the incident wave, on the wave transmission coefficient. An empirical formula for the wave transmission coefficient was derived based on the numerical results. Additionally, the effects of influential parameters, including wind speed, current velocity, incident wave height and period, and water depth, on the maximum total mooring force were investigated. Furthermore, an empirical formula for the maximum total mooring force is proposed for practical implementation in engineering.

1. Introduction

Breakwaters are used as an important protective structure for port and coastal engineering. It can keep the stability of the water’s surface in its protection area and ensure the safe operation of the port or protect the coastline from being damaged by waves. In accordance with the linear wave theory, a significant portion of the overall wave energy is concentrated in the upper layer of the water column, particularly in deep water environments [1]. Thus, a variety of floating breakwaters have been developed and applied increasingly due to their advantages of enhancing water exchange, expediting construction duration, minimizing construction materials, etc. [2]. Recently, the design and potential construction of an artificial floating island in Baa Atoll, Maldives, has been performed, and the implementation of a floating breakwater system is necessitated to ensure adequate protection for the floating artificial island. Consequently, the configuration, wave dissipation performance, and mooring force of the floating breakwater are crucial considerations in the design and construction of the system.
Over the past few decades, scholars have put forth diverse structural designs for floating breakwaters, which can be categorized into two distinct groups according to their operational principles: wave reflection and energy dissipation, as well as a combination of both. Among these, the pontoon-type floating breakwater stands as the basic form of a reflective breakwater. Floating breakwaters are typically constructed using reinforced concrete and secured to the seabed through an anchoring system. Various structural designs for floating breakwaters have been suggested, drawing inspiration from floating pontoon breakwaters. Peña et al. [3] proposed a configuration known as the floating double-pontoon breakwater, which incorporates two inner wings positioned between the two floating boxes. This design aims to increase the effective width in the direction of wave propagation and improve wave dissipation capabilities. Huang et al. [4] demonstrated that the wave dissipation performance of the breakwater can be enhanced by incorporating a vertical baffle with open holes at the bottom of the floating box. Similarly, Loukogeorgaki et al. [5] conducted experiments and determined that the hydroelastic and structural responses of the moored pontoon-type floating breakwater are significantly influenced by the wave period, while the wave height and obliquity primarily impact this response in the low-frequency range. Yang et al. [6] introduced a novel floating rectangular box breakwater featuring a conical bottom section, which exhibits a notable capacity to resist overturning owing to its low center of gravity position. Shen et al. [7] conducted an experimental investigation on the wave attenuation capabilities of a novel floating breakwater design featuring twin pontoons and multiple porous vertical plates. Their findings revealed that this proposed floating breakwater design outperforms the conventional single pontoon type in terms of wave attenuation. Chen et al. [8] reached a similar conclusion, highlighting the superior wave attenuation performance of the double pontoon floating breakwater in comparison to the single pontoon configuration. The comb-type floating breakwater has been developed as a modification of the pontoon-type floating breakwater, wherein a side plate is used to replace a portion of the main body of the pontoon [9]. Wang et al. [10] investigated the impact of the relative width and draft depth on the wave transmission coefficient for the floating comb-type breakwater and suggested certain enhancements based on physical model tests.
Several floating breakwaters with dissipation devices have been proposed as well. Dong et al. [11] conducted a study on the hydrodynamic characteristics and wave attenuation of a floating breakwater equipped with a horizontal plate and cage. Deng et al. [12] investigated the T-type floating breakwater featuring a vertical baffle at the bottom. Their findings indicate that the inclusion of an additional baffle can significantly decrease the wave transmission efficiency. Ruol et al. [13] conducted numerical research on a Π-type floating breakwater with a vertical baffle positioned on the lower section of the pontoon’s sides. Zhang et al. [14] proposed an L-shaped breakwater structure with a horizontal protruding plate installed on the seaward side of the breakwater. Similarly, Christensen et al. [15] investigated a fixed floating square box (L-shaped structure) with a horizontal extension bottom plate and successfully achieved a favorable wave dissipation effect. Similarly, Wang et al. [16] conducted experimental research on the dissipation characteristics of curtain-type flexible floating breakwaters. However, the uncertain design service life of these structures, along with the challenging environmental conditions they endure during long-term exposure to the sea, necessitate further improvements in structural stability and durability. Recently, Qiu et al. [17] introduced a novel floating breakwater design consisting of multiple horizontal cylinders, including a main horizontal cylinder and two smaller cylinders. The main cylinder is submerged in the water and serves to reflect wave energy, while the smaller cylinders, positioned near the water surface, contribute to wave energy dissipation. The floating breakwater under consideration possesses a straightforward design and offers ease of installation while also exhibiting a high level of efficiency in dissipating waves. It has been temporarily employed in the construction of Ashdod Port in Israel.
The anchoring of the floating breakwater to the seabed via the mooring chain plays a vital role in determining the breakwater’s performance, stability, and safety. According to López et al. [18], the arrangement and properties of the mooring chain significantly impact the heaving amplitude of the floating breakwater. However, it is important to note that increasing the stiffness of the mooring system can alter the natural frequency of the overall system. Consequently, by strategically designing the layout and material strength of the anchorage system, the natural frequency and motion displacement amplitude of the floating breakwater can be adjusted to a suitable range. This not only reduces the construction expenses of the mooring system but also facilitates efficient wave energy absorption, thereby optimizing the wave elimination process [19,20].
The hydrodynamic characteristics of floating structures can be investigated through various research methods, including theoretical analysis, physical model experiments, and numerical calculations. Numerical calculations offer an economical approach with distinct advantages for studying both the hydrodynamic characteristics of floating structures and the development process of nonlinear wave fields [14,21,22].
This study examines the hydrodynamic characteristics of a floating breakwater system intended for the construction of an artificial island in the Baa Atoll, Maldives. The numerical model was established based on the ANSYS-AQWA software. Initially, three variations in floating breakwaters were compared in terms of wave attenuation to ascertain the superiority of the current multi-cylinder floating breakwater over conventional alternatives. Subsequently, an examination was conducted to investigate the effects of various influential factors on the wave transmission coefficient for floating multi-cylinder breakwater, leading to the formulation of an empirical formula. Furthermore, the calculation of the mooring force for the floating breakwater was performed, considering different influential parameters. To facilitate practical implementation in engineering, an empirical formula for the maximum mooring force was suggested.

2. Establishment and Verification of Numerical Model

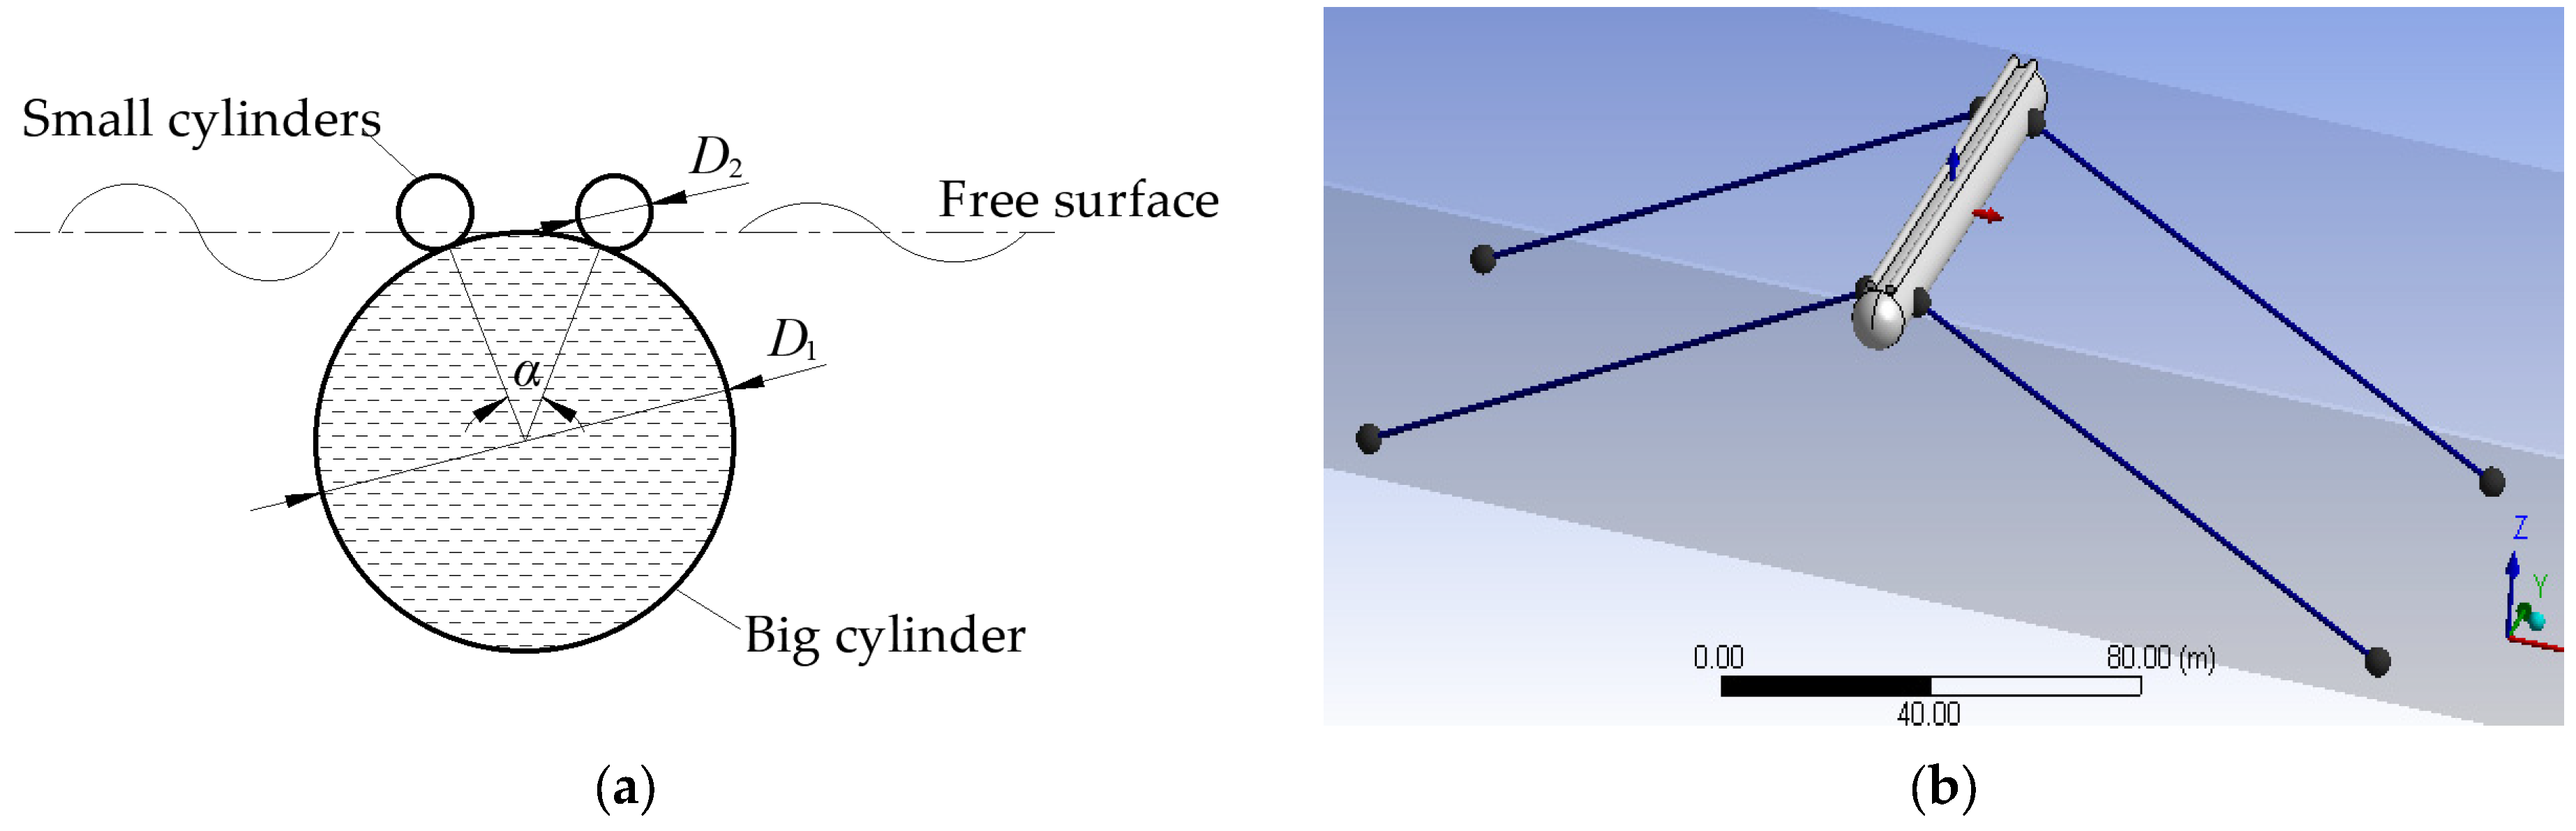
2.1. Establishment of Numerical Model

This study utilizes ANSYS-AQWA software [23] to construct a three-dimensional numerical model for investigating the wave dissipation capabilities and mooring line forces of a multi-cylinder floating breakwater. ANSYS AQWA is a widely acknowledged software tool for analyzing wave structure interactions based on the potential flow theory, which is commonly employed in hydrodynamic research on large floating structures [21,24,25]. The velocity potential is governed by the Laplace equation:
2 ϕ x 2 + 2 ϕ y 2 + 2 ϕ z 2 = 0
where ϕ is the velocity’s potential function and x, y, z are the three coordinate axis directions, respectively. The boundary conditions of the equation are as follows:
(i)
At the seabed (z = −d),
ϕ z = 0
(ii)
For the free surface (z = 0),
2 ϕ t 2 + g ϕ z = 0
where t is time, g is the acceleration of gravity, and the value is g = 9.81 m/s2;
(iii)
For the immersed surface of the object,
ϕ n = j = 1 6 v j f j x , y , z
where n is the direction vector; fj is the velocity potential on the jth degree of freedom; and vi is the motion speed on the jth degree of freedom.
The modeling process involves several steps. Initially, the three-dimensional structure of the floating breakwater is created using AutoCAD and saved as a CAD Igs file. Subsequently, the file is imported into AQWA. The model is then shelled, and the waterline is cut. Additionally, the seawater density, water depth, center of gravity position, and inertia moment are determined based on the hydrogeological characteristics of the structure. The anchor chains are arranged in parallel, aligning with the direction of the incident wave. One end of the chains is secured to the exterior of the breakwater, while the other end is fixed to the seabed. Next, the pertinent parameters of the anchor chain, such as its characteristics, length, stiffness, diameter, and mooring state, are established. For the purposes of this study, it is assumed that the wave passes through the breakwater in a direction perpendicular to it, disregarding any incident waves from other directions within the actual area. The calculation procedure encompasses both radiation diffraction analysis and balance analysis. Once the stiffness matrix of the anchor chain is acquired using post-processing software, the subsequent step involves conducting a second radiation diffraction analysis to derive the contour fields of the wave amplitude surrounding the floating breakwater.
The evaluation of the wave attenuation performance of the floating breakwater is typically conducted through the utilization of the wave transmission coefficient Kt:
Kt = Ht/Hi
where Ht is the transmission wave height, and Hi is the incident wave height. A decreased transmission coefficient signifies a more effective wave attenuation performance.

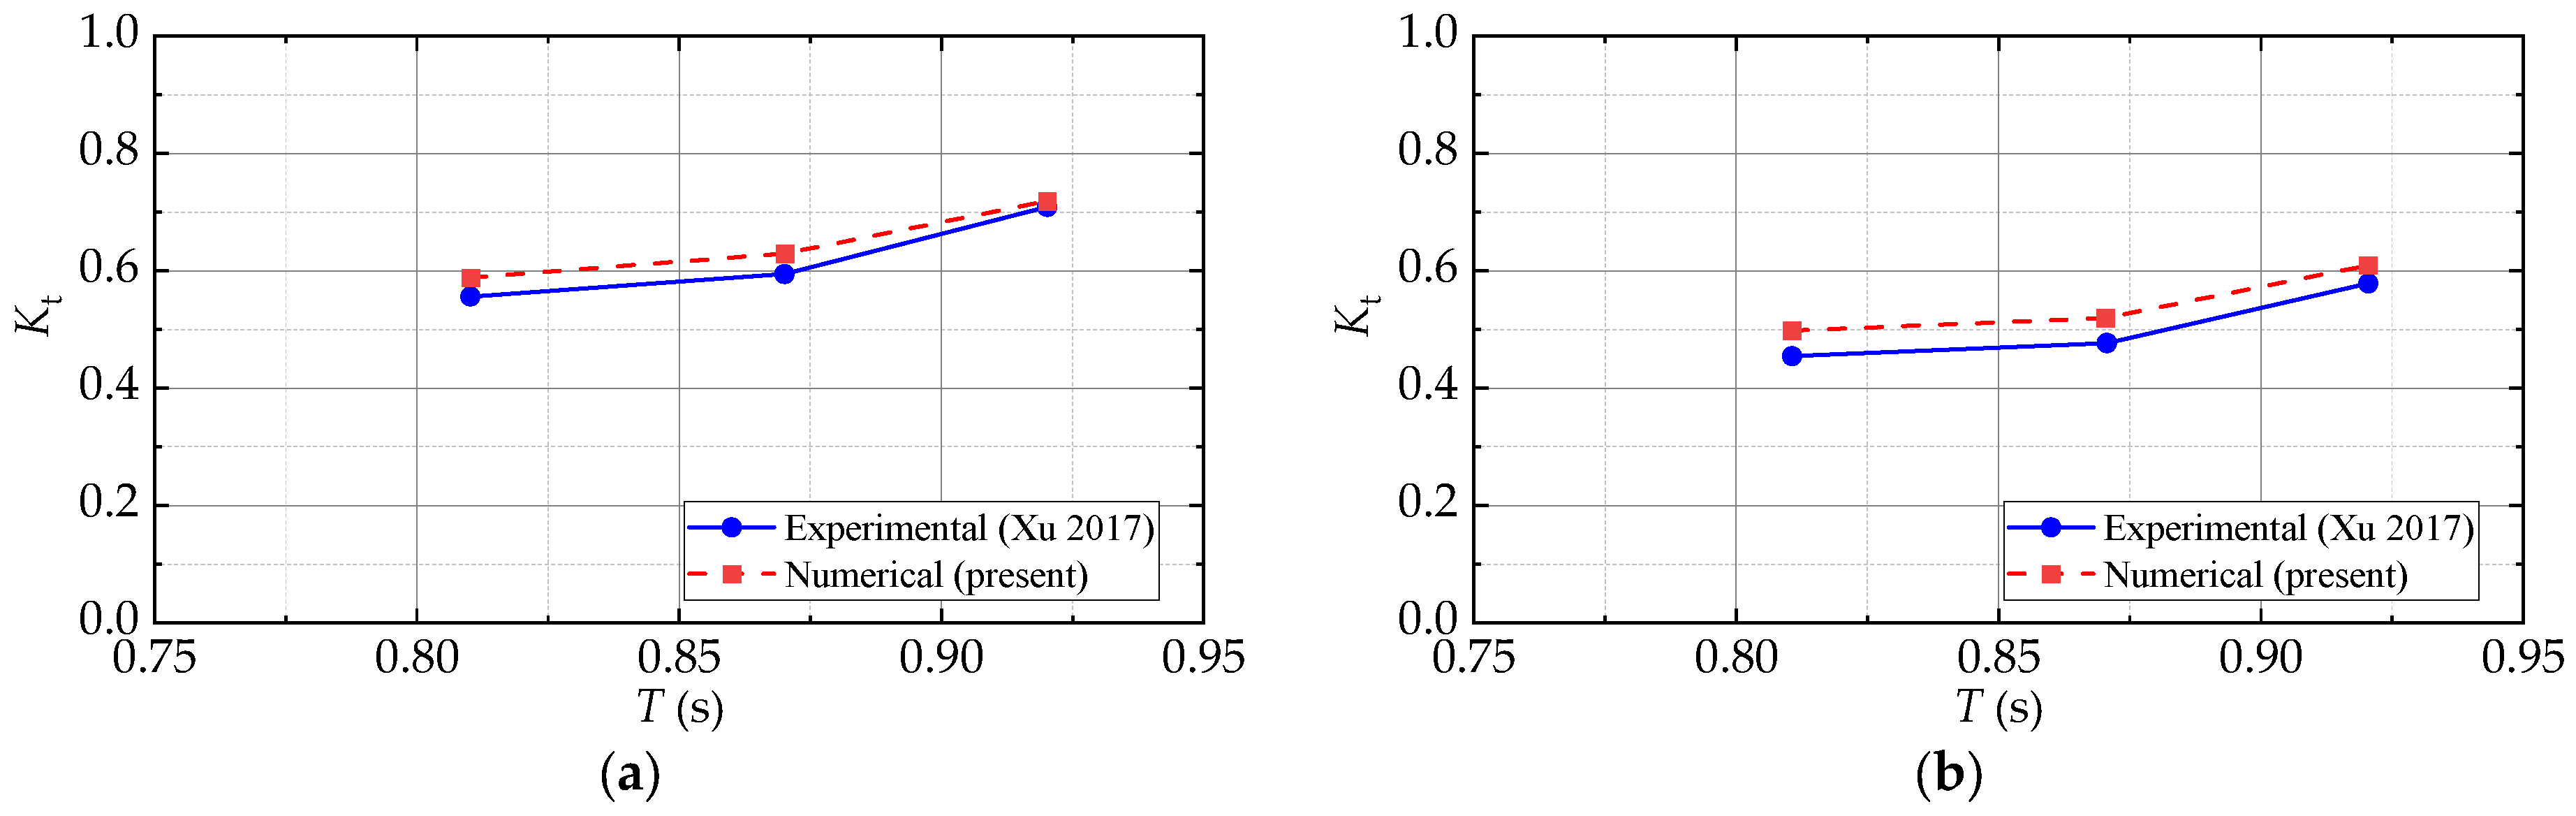
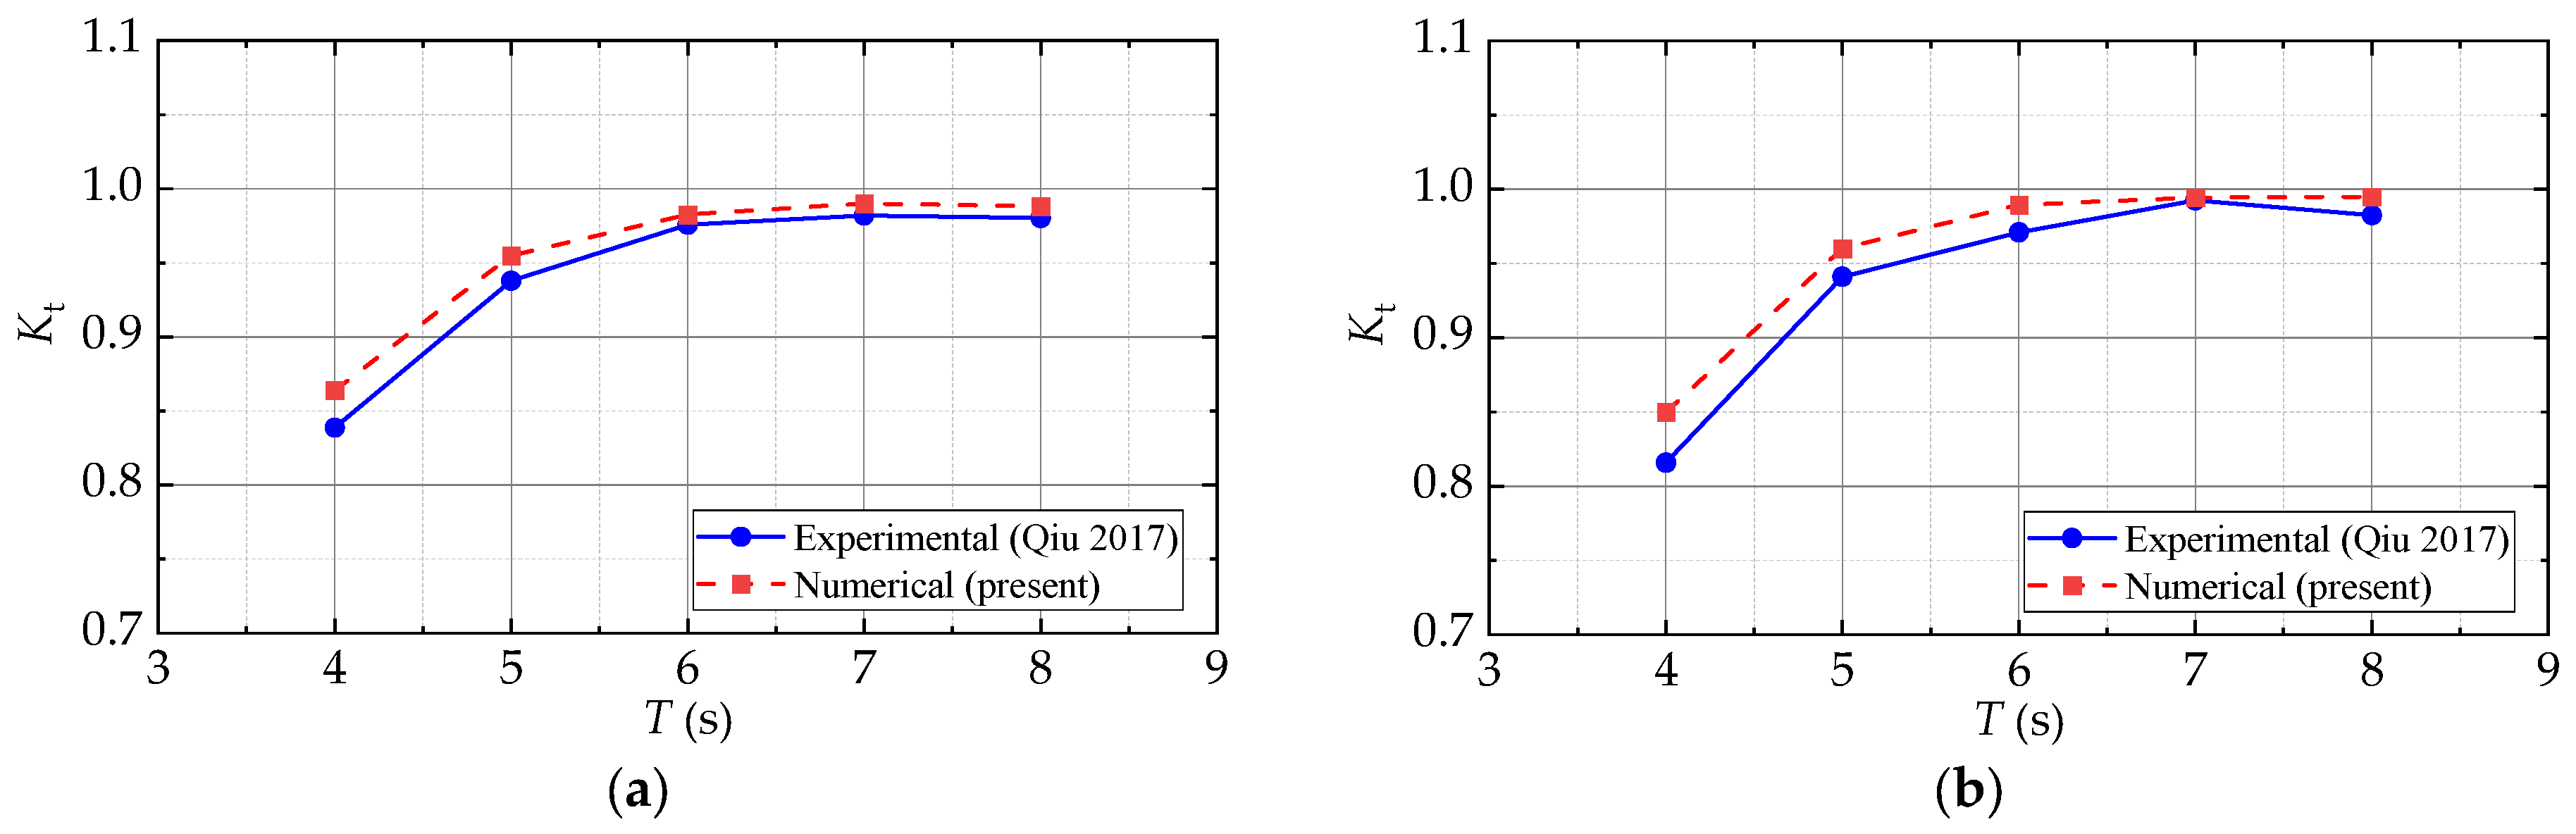
2.2. Verifications of Numerical Model

2.2.1. Modeling of Double-Box Floating Breakwater

Xu et al. [26] investigated the hydrodynamic forces associated with a double-box floating breakwater through experiments. The floating box had dimensions of 0.3 m in length, 0.15 m in width, 0.06 m in height, and a draft of 0.042 m. The front and rear boxes were of equal size, with a spacing of 0.03 m between them. The regular wave was perpendicular to the longitudinal axis of the square boxes. A tensioned anchor chain system was implemented, with the top of the anchor chains affixed to each side of the floating boxes while the bottom end of the anchor chain was fastened to the seabed. The cable was composed of steel and possessed a rigidity of 1.5 × 10⁶ N/m. A numerical model with three-dimensional characteristics, duplicating the dimensions and wave elements of the experimental model, was developed to effectively simulate the hydrodynamic behavior of double-row floating breakwaters.
Figure 1 illustrates the variation in the transmission coefficient in relation to the wave period, specifically at water depths of 0.20 m and 0.25 m. In general, the numerical results exhibit a similar trend and closely align with the experimental results.

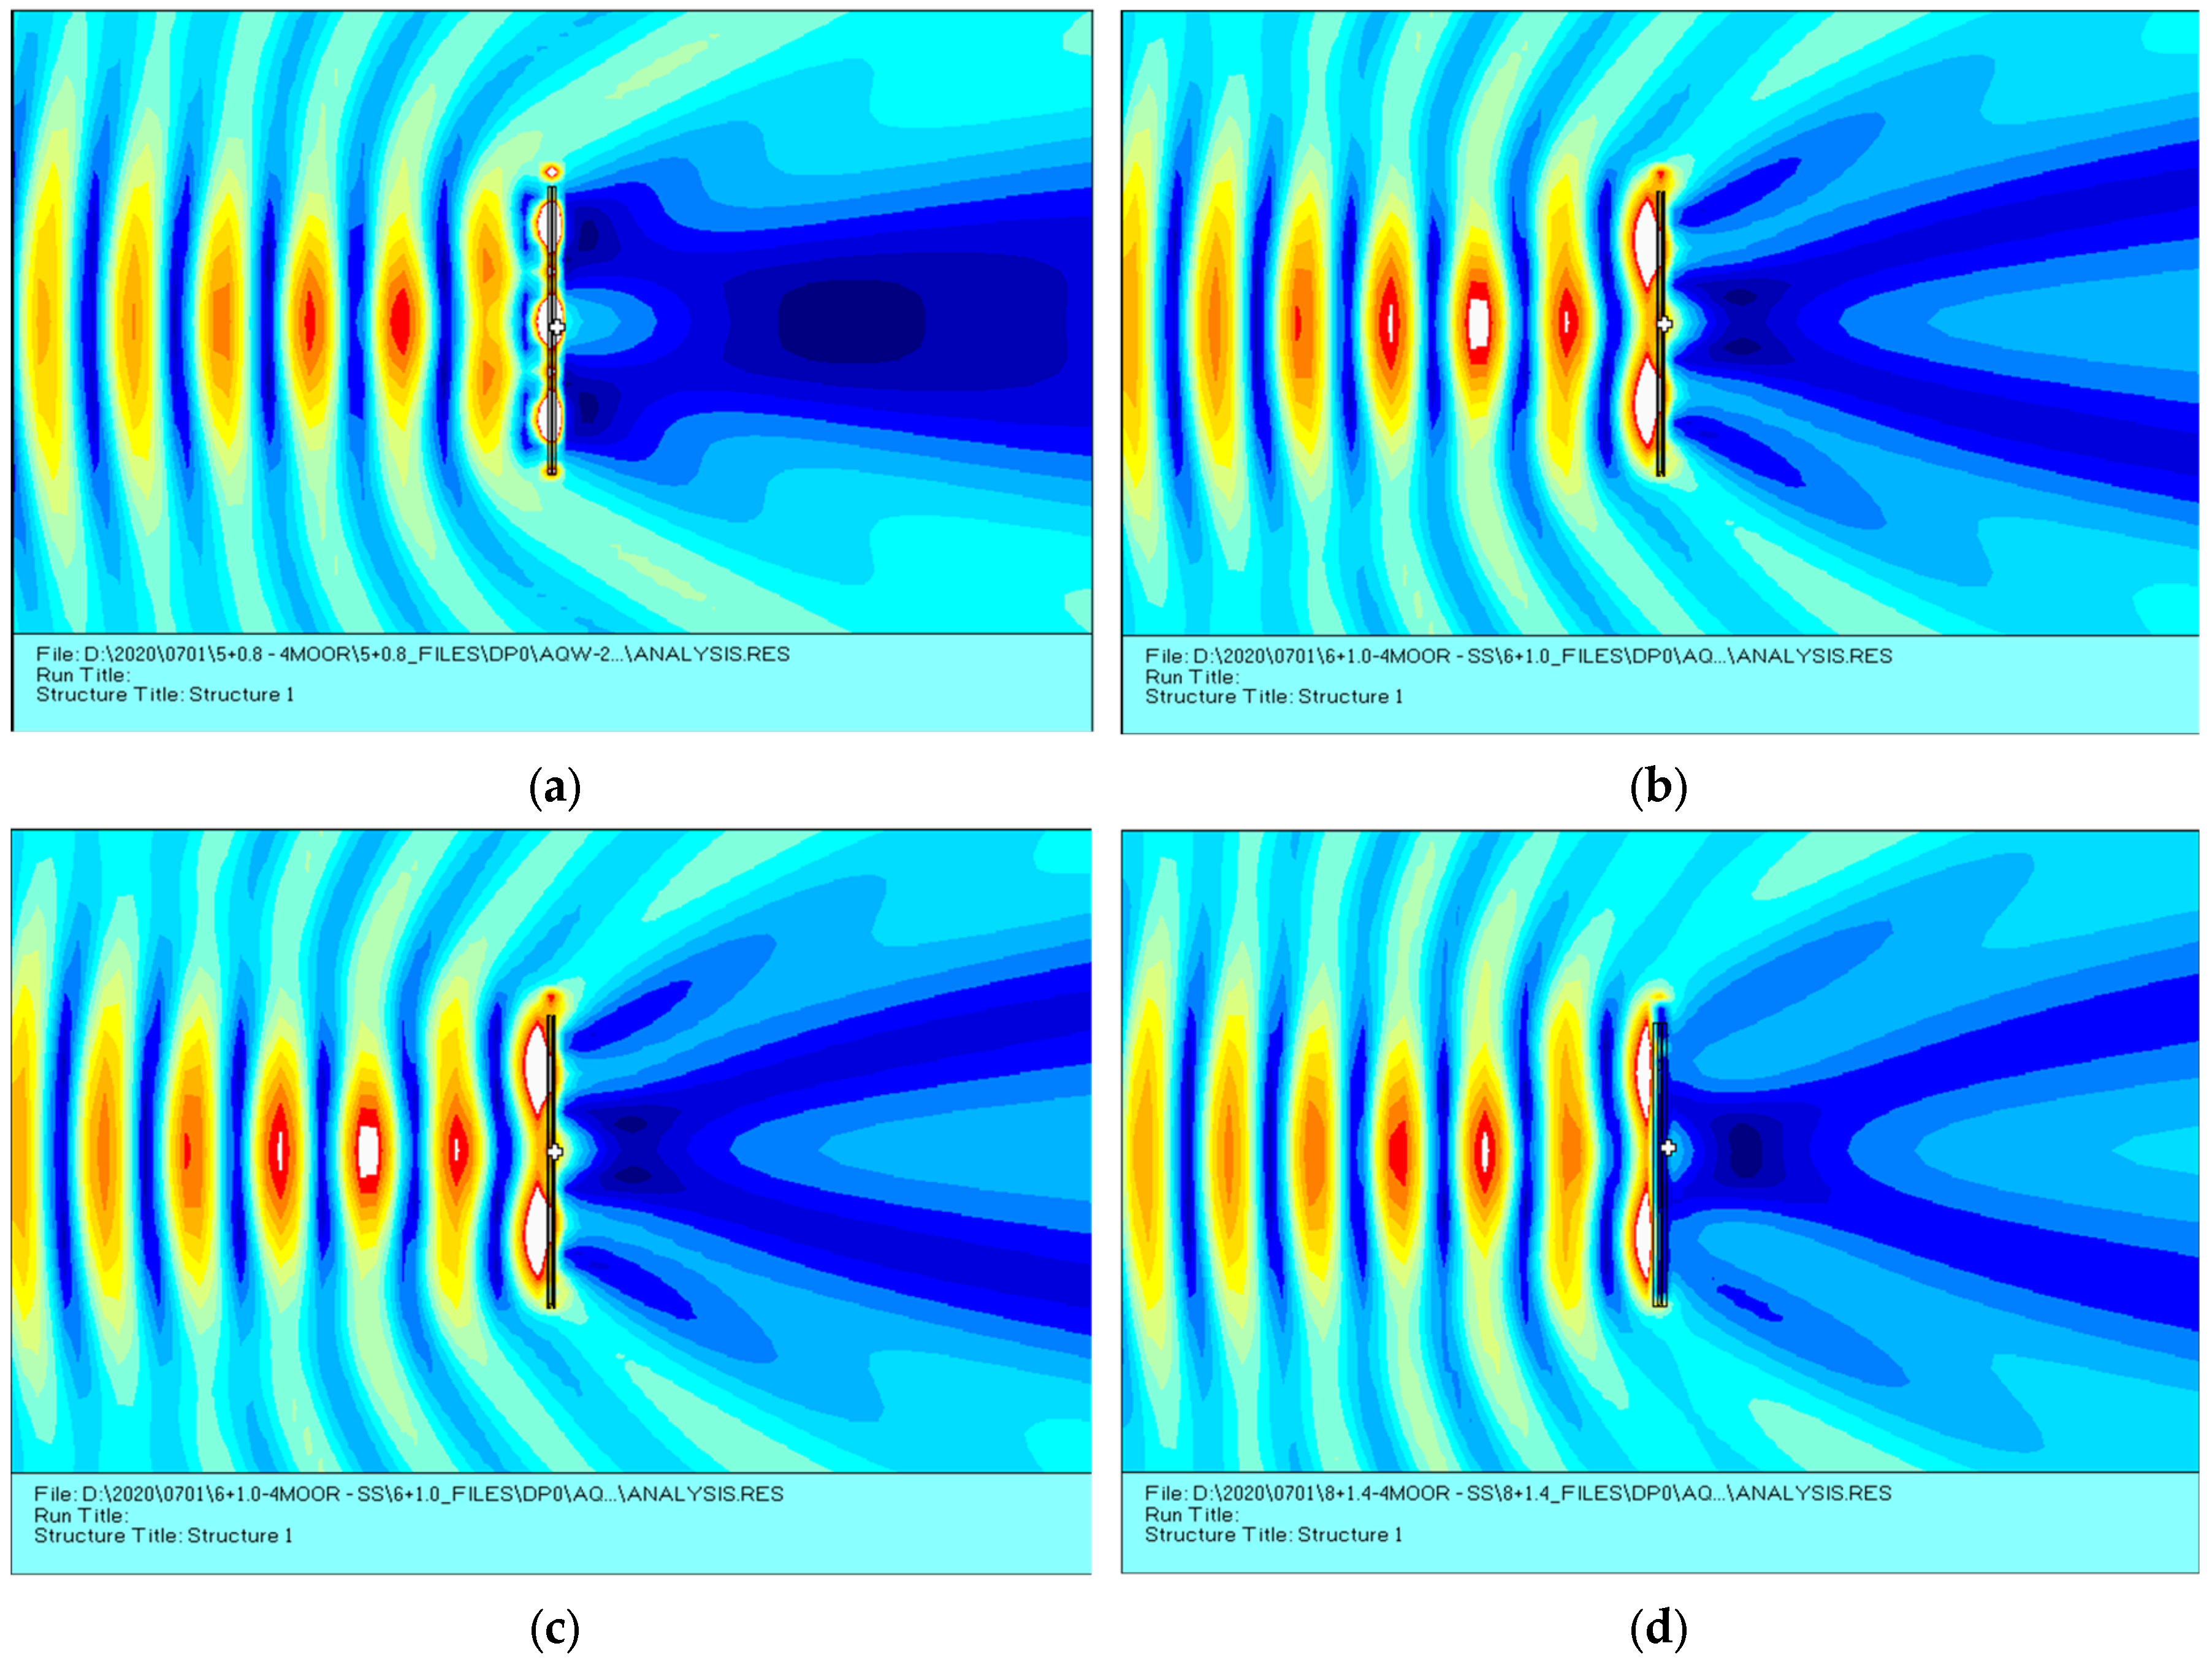
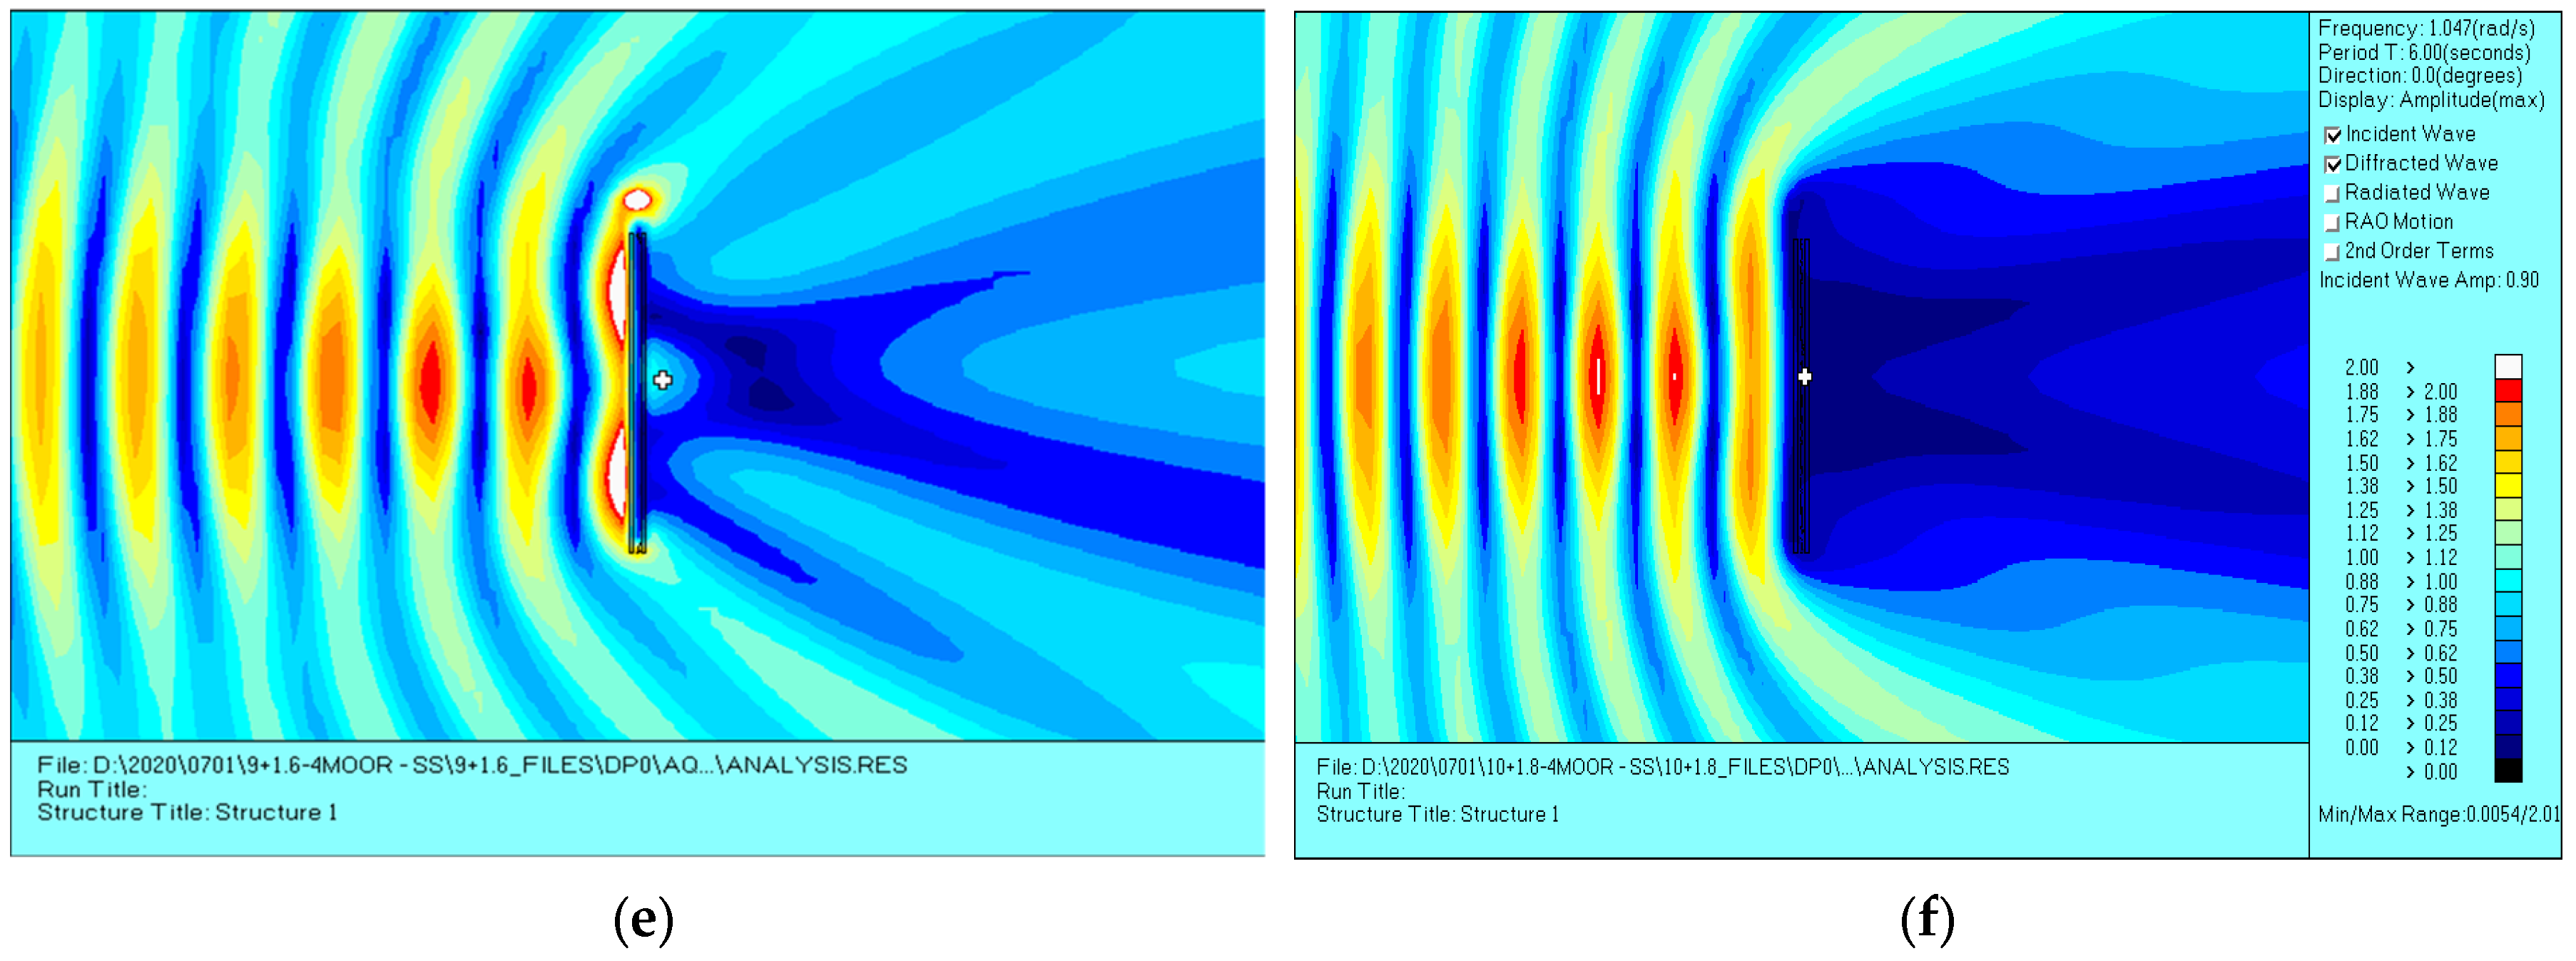
2.2.2. Modeling of Multi-Cylinder Floating Breakwater

Qiu et al. [17] conducted an experimental investigation on the efficacy of a horizontal multi-cylinder floating breakwater, as depicted in Figure 2a. The primary function of the submerged large cylinder was wave reflection, while the two smaller cylinders, positioned tangentially to the large cylinder and exposed above the water’s surface, were intended to disrupt the waves and achieve wave attenuation. The dimensions of the large cylinder were measured to be 0.5 m in diameter, while the two smaller cylinders exhibited a diameter of 0.08 m. Additionally, the breakwater’s length was determined to be 3.5 m, the water depth measured at 1.5 m, the wave height reached 0.09 m, and the wave period ranged from 1.27 s to 2.54 s. A three-dimensional numerical model was constructed, replicating the dimensions and wave components of the experimental model as depicted in Figure 2b. This model was employed to evaluate the wave dissipation characteristics of the floating breakwater under regular wave conditions. Subsequently, the numerical model was validated through comparisons with the data obtained from the physical model.
Figure 3 depicts the variation in the transmission coefficient of the breakwater as a function of the wave period, considering wave heights of Hi = 0.09 m and 0.15 m. The numerical model’s findings exhibit a high level of concurrence with the experimental results. Overall, the numerical outcomes demonstrate consistency with the experimental data, with the discrepancy falling within an acceptable range.
In this section, the authors conduct a three-dimensional numerical simulation of flexible cylinder floating breakwaters and double-row floating breakwaters and subsequently compare the results with experimental data. Taking into account the various factors that may affect the test model, the numerical calculations demonstrate a strong concurrence with the physical experimental results. This suggests that the numerical model employed in this study exhibits a high level of accuracy in investigating the transmission coefficient and wave dissipation capacity of breakwaters for the artificial floating island.

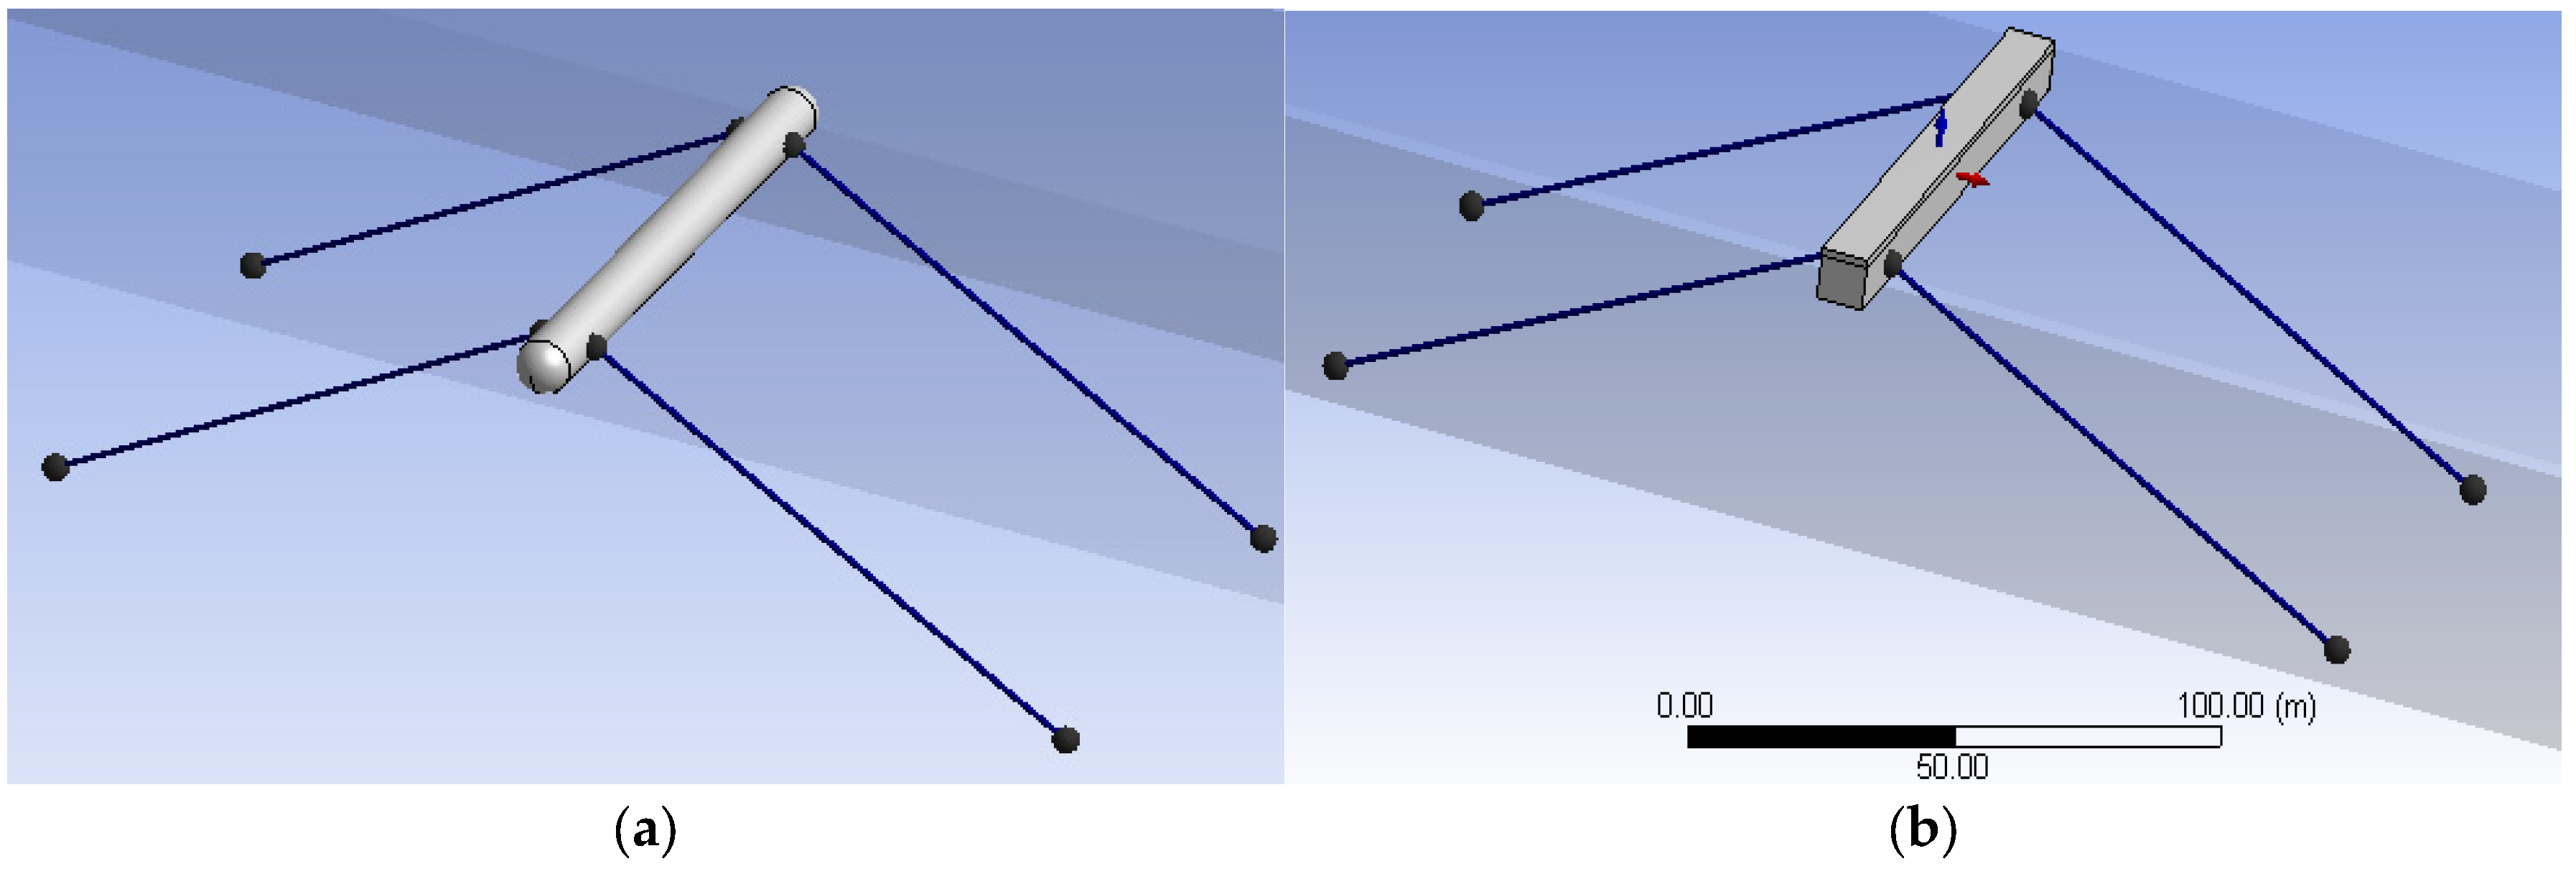
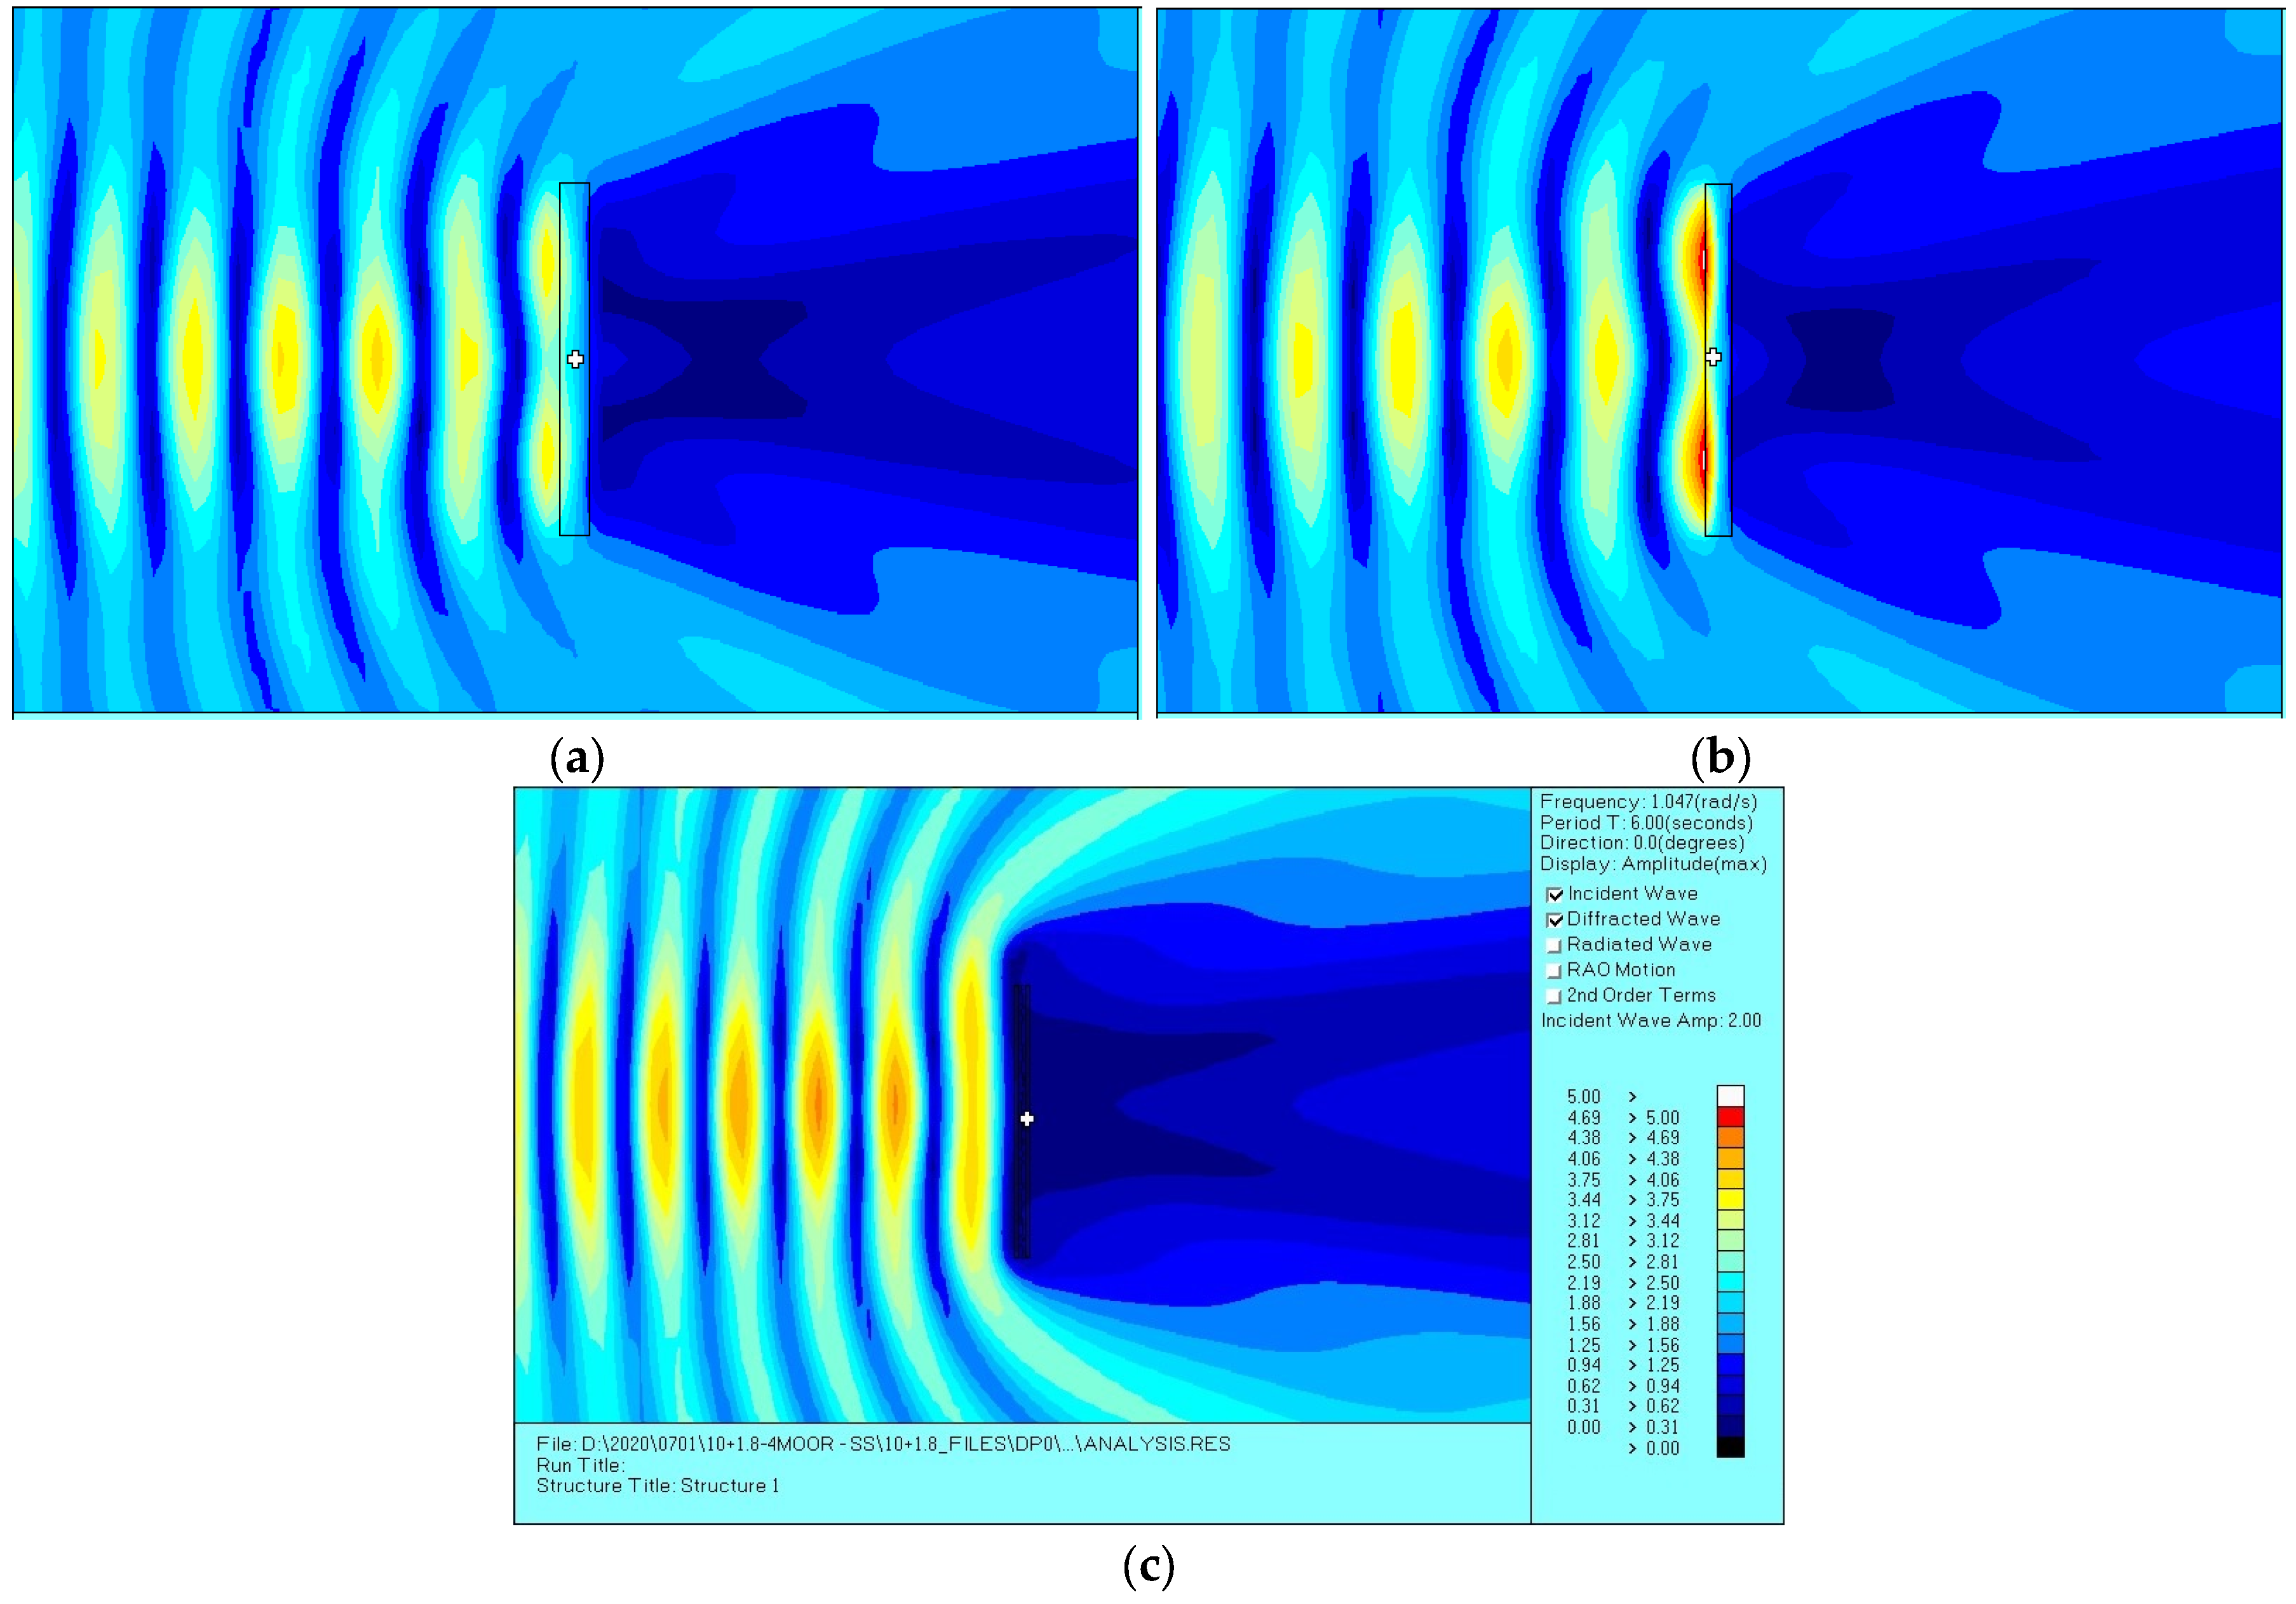
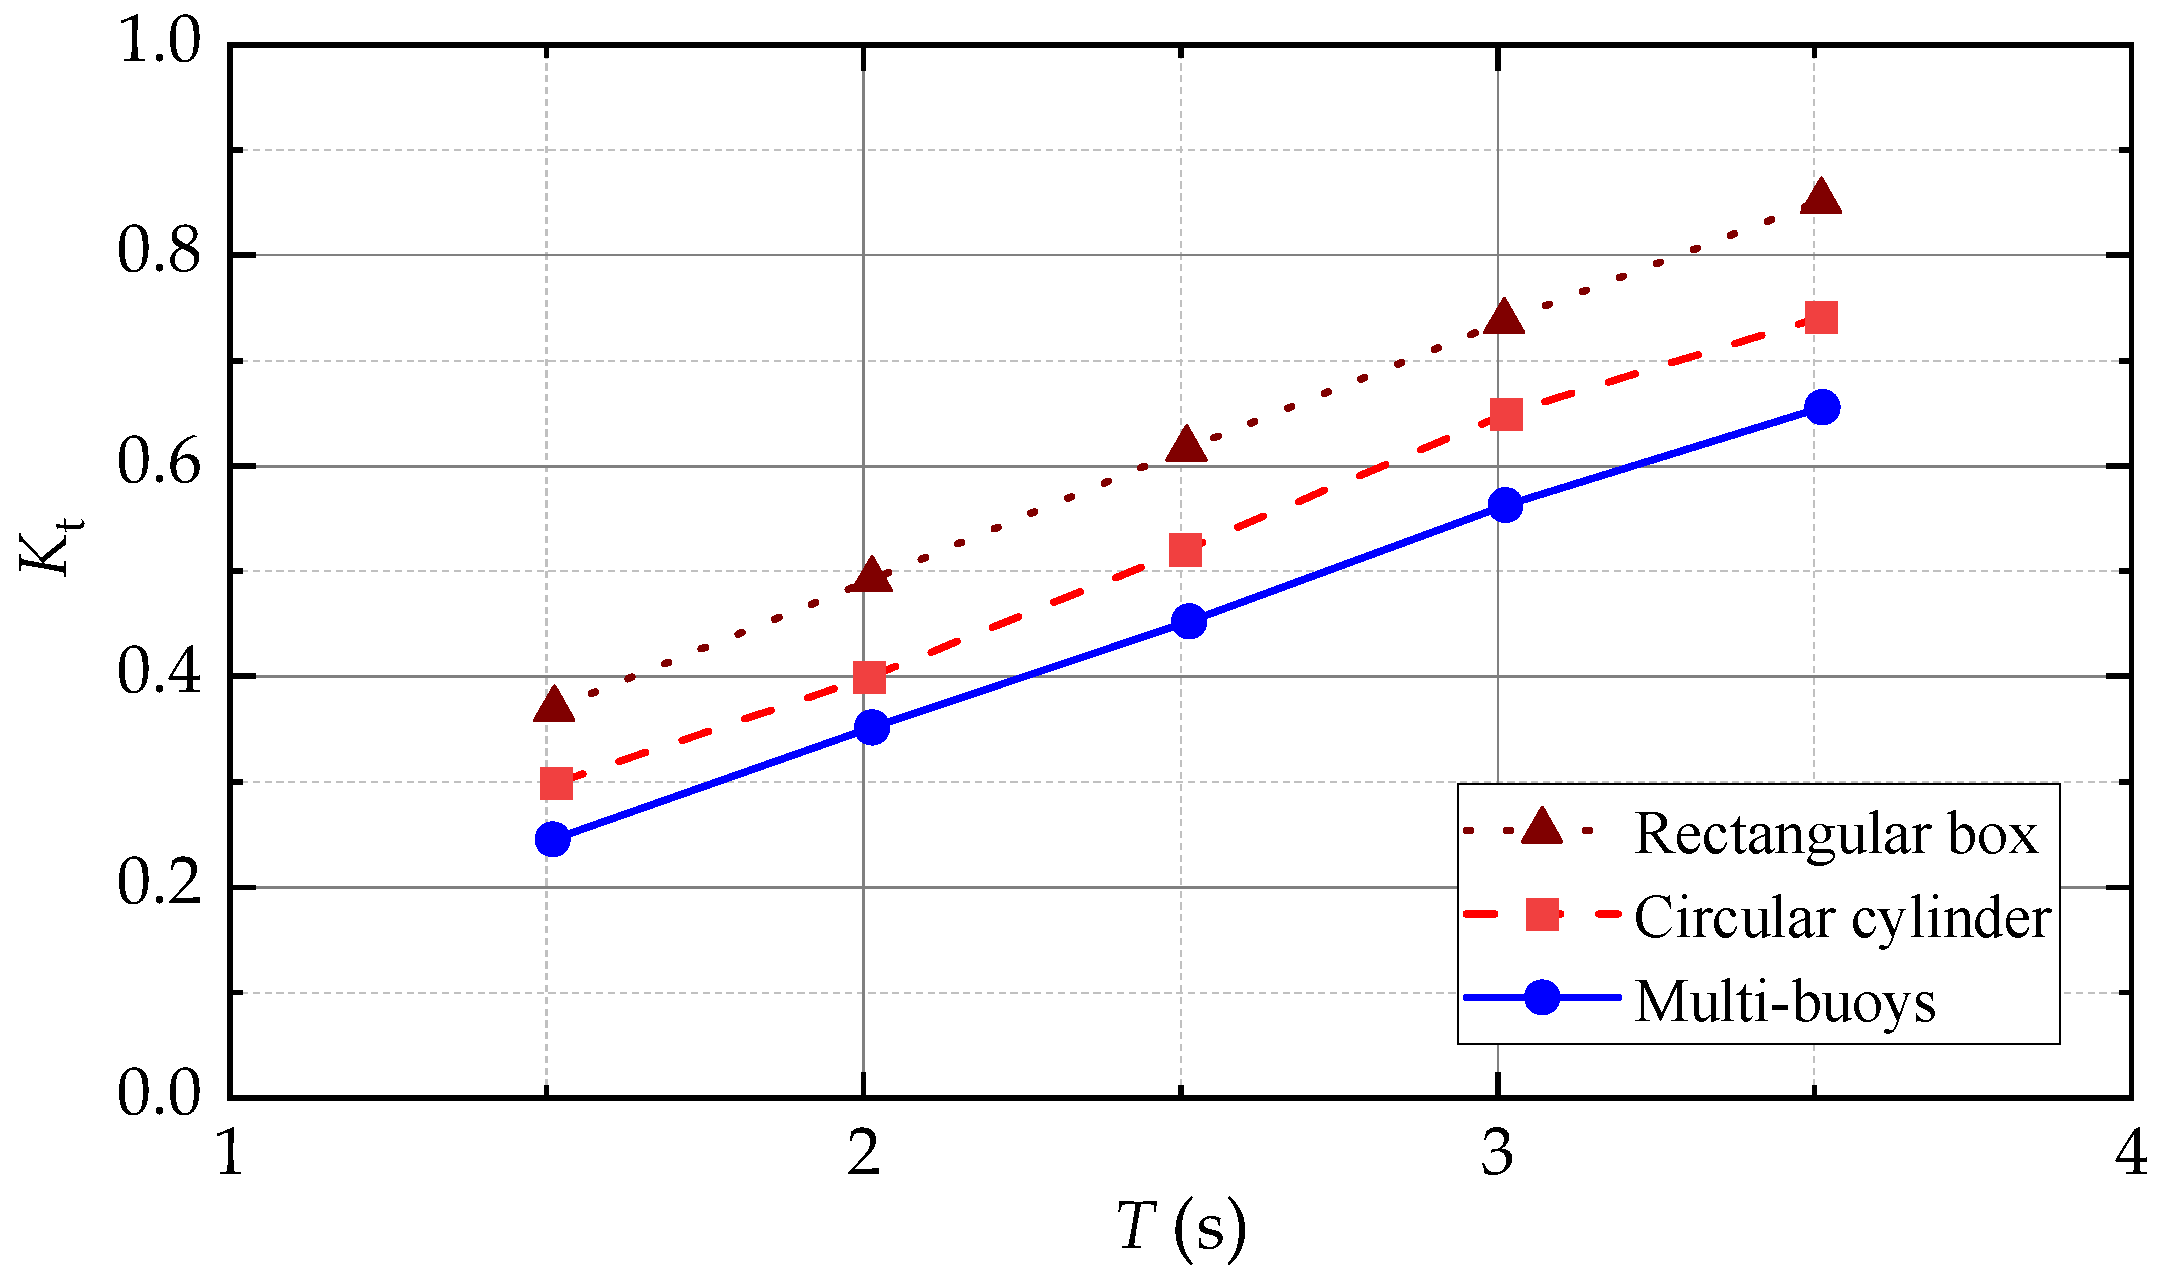
3. Comparisons among Floating Breakwaters with Different Cross-Sections

This section seeks to perform a comparative analysis of the wave dissipation capacity of three distinct floating breakwaters, each characterized by a different cross-sectional design, as a shielding scheme for the artificial floating island. The three floating breakwaters under consideration include the following: (a) the horizontal multi-cylinder configuration (Figure 1b); (b) the single-cylinder configuration (Figure 4a); and (c) the square pontoon configuration (Figure 4b). The section area of the breakwater for three floating breakwaters remains constant at approximately 81 m2. The dimensions of each cross-section configuration are as follows: (a) the large cylinder possesses a diameter of 9.6 m, while the two small cylinders have a diameter of 2.4 m each; (b) the section is circular with a diameter of 10.2 m; and (c) the section is square, with each side measuring 9.0 m. Each floating breakwater has a total length of 100 m and is secured by four mooring chains, with two mooring chains positioned upstream and downstream, respectively. The mooring chains are made of steel and possess a rigidity of 2.33 × 10⁸ N/m, while the spacing between them is 80 m. The lower end of the mooring chain is firmly attached to the sea’s bottom and is positioned 100 m horizontally from the breakwater. The incident wave height ranges from 1.5 to 3.5 m with a period of 6.0 s. The water depth is measured at 50 m, and the wave incidence direction is perpendicular to the long side of the breakwater.
Figure 5 illustrates the wave clouds encompassing the breakwaters of three different cross-sections, with the wave propagating in a left-to-right direction. The incident wave height and period are set as Hi = 4.0 m and T = 6.0 s, respectively. The combination of the incident wave and the reflected wave leads to an increased wave amplitude in the front of the breakwater, while the wave height behind the breakwater is dissipated to some extent. The wave height in front of the multi-cylinder breakwater (Figure 5c) exhibits a greater magnitude compared to the other two breakwater types owing to its deeper draft. Additionally, wave breaking transpires in the vicinity of smaller cylinders situated closer to the water’s surface. Both of these factors contribute to the lowest wave height behind the multi-cylinder breakwater.
Figure 6 illustrates the variation in the transmission coefficient as a function of the incident wave height for three distinct breakwater section types, thereby facilitating comparative analysis of the wave dissipation capabilities of various floating breakwaters. Generally, it can be observed that the transmission coefficient of the breakwater exhibits a linear relationship with the increment in incident wave height. It can be seen that the wave height of the incident wave has a great impact on the wave dissipation capacity of the breakwater. Under the same cross-sectional area, the transmission coefficient of the floating square box breakwater is 0.4~0.9, that of the single-cylinder breakwater is 0.3~0.8, and that of the multi-cylinder breakwater is 0.2~0.7. The transmission coefficient of a multi-cylinder breakwater is observed to be 0.3 lower than that of a pontoon breakwater and 0.1 lower than that of a single-cylinder breakwater when subjected to the same incident wave height. Consequently, it can be concluded that a horizontal multi-cylinder breakwater with equivalent volume exhibits superior wave dissipation capacity. Therefore, the utilization of the shielding scheme for the artificial floating island suggests that the current horizontal multi-cylinder floating breakwater may serve as the most advantageous choice.
Dai et al. (2018) [2] conducted a comprehensive review of floating breakwater, gathering data from multiple sources. The present study specifically compares the transmission coefficients of various types of floating breakwaters, as reported by Dai et al. (2018) [2]. Experimental data from Ikeno et al. (1988) [27], Murali and Mani (1997) [28], Uzaki et al. (2011) [29], Mani (2014) [30], and Ji et al. (2016) [21] were utilized and summarized in Table 1. The numerical results of both the single-box and multi-buoy-type breakwaters from the present numerical model are presented for comparative analysis. In these comparisons, the primary control parameter selected is the ratio of the breakwater width to wavelength (B/L), with values closely clustered between 0.16 and 0.21. Additionally, the ratios of water depth to wavelength (d/L) and wave height to wavelength (H/L) are provided for each case as a reference. In general, the transmission coefficient ranges from 0.46 to 0.92. The transmission coefficient of the single-box type in this study closely aligns with that reported by Ikeno et al. (1988) [27], supporting the validity of the current model. Floating breakwaters can typically be categorized into three levels based on their transmission coefficients. The multi-buoy floating breakwater in this study falls within the middle level with a transmission coefficient of 0.66, which is similar to the two pontoon types examined by Ikeno et al. (1988) [27]. The Y-frame with the pipe (Mani, 2014) [29] and cage type (Murali and Mani, 1997) [28] configurations of floating breakwaters exhibit superior wave dissipation performance, attributed to their deep draft in the water. By contrast, other types of floating breakwaters demonstrate high transmission coefficients exceeding 0.86. The current multi-buoy floating breakwater displays a lower transmission coefficient compared to the majority of floating breakwaters detailed in Table 1.

4. Analysis of Wave Dissipation Capacity of Multi-Cylinder Floating Breakwater

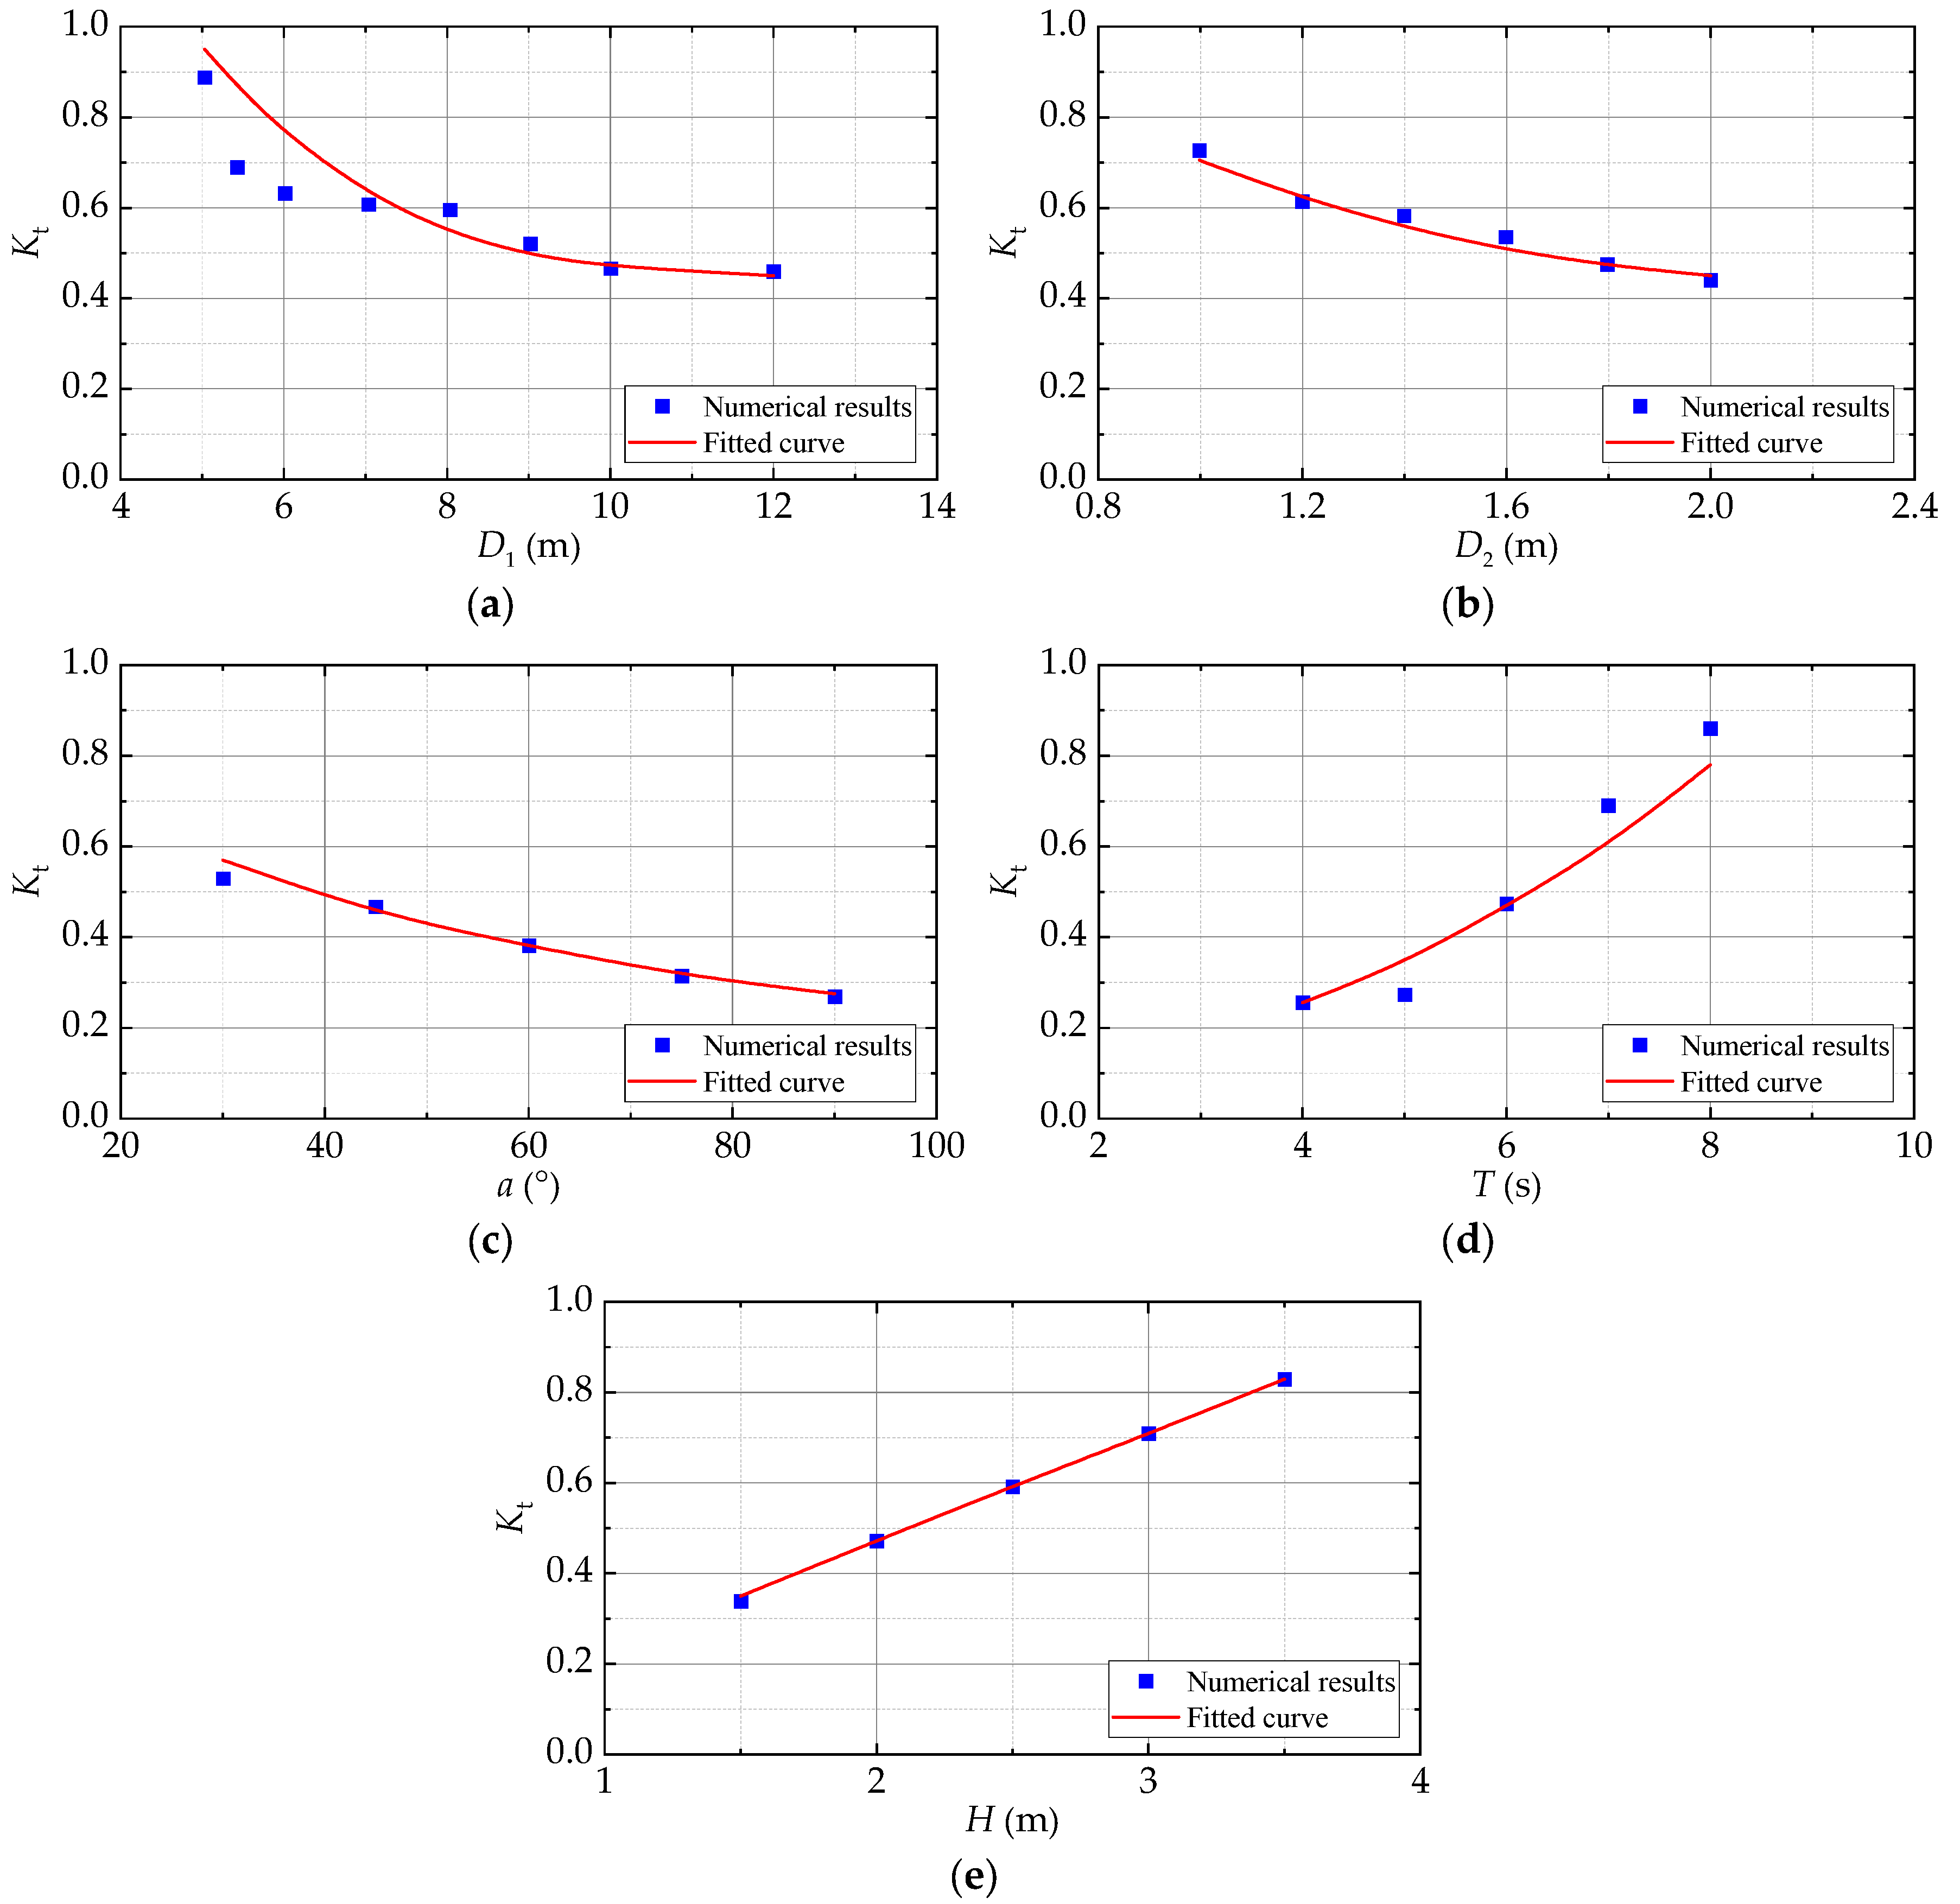
4.1. Effects of Influential Factors on Wave Transmission Coefficient

The three-dimensional numerical model is employed to simulate the behavior of a horizontal multi-cylinder floating breakwater with the mooring chains. The effects of the influential factors, including the large cylinder diameter (D2), small cylinder diameter (D1), small cylinder position (α), incident wave period (T), and incident wave height (Hi) on the transmission coefficient, are investigated.
Figure 7 shows a series of numerical results for the wave cloud around the floating breakwater with different values of the large cylinder diameter (D1). Figure 8 shows the wave height extracted along the centerline of the breakwater in the perpendicular direction. The wave height is taken from 175 m in front of and 175 m behind the breakwater, with the location of the breakwater at x = 0 m. It can be observed that the wave heights in front of and behind the breakwater have different values. Then, the averaged wave height behind the breakwater is utilized to calculate the wave transmission coefficient.

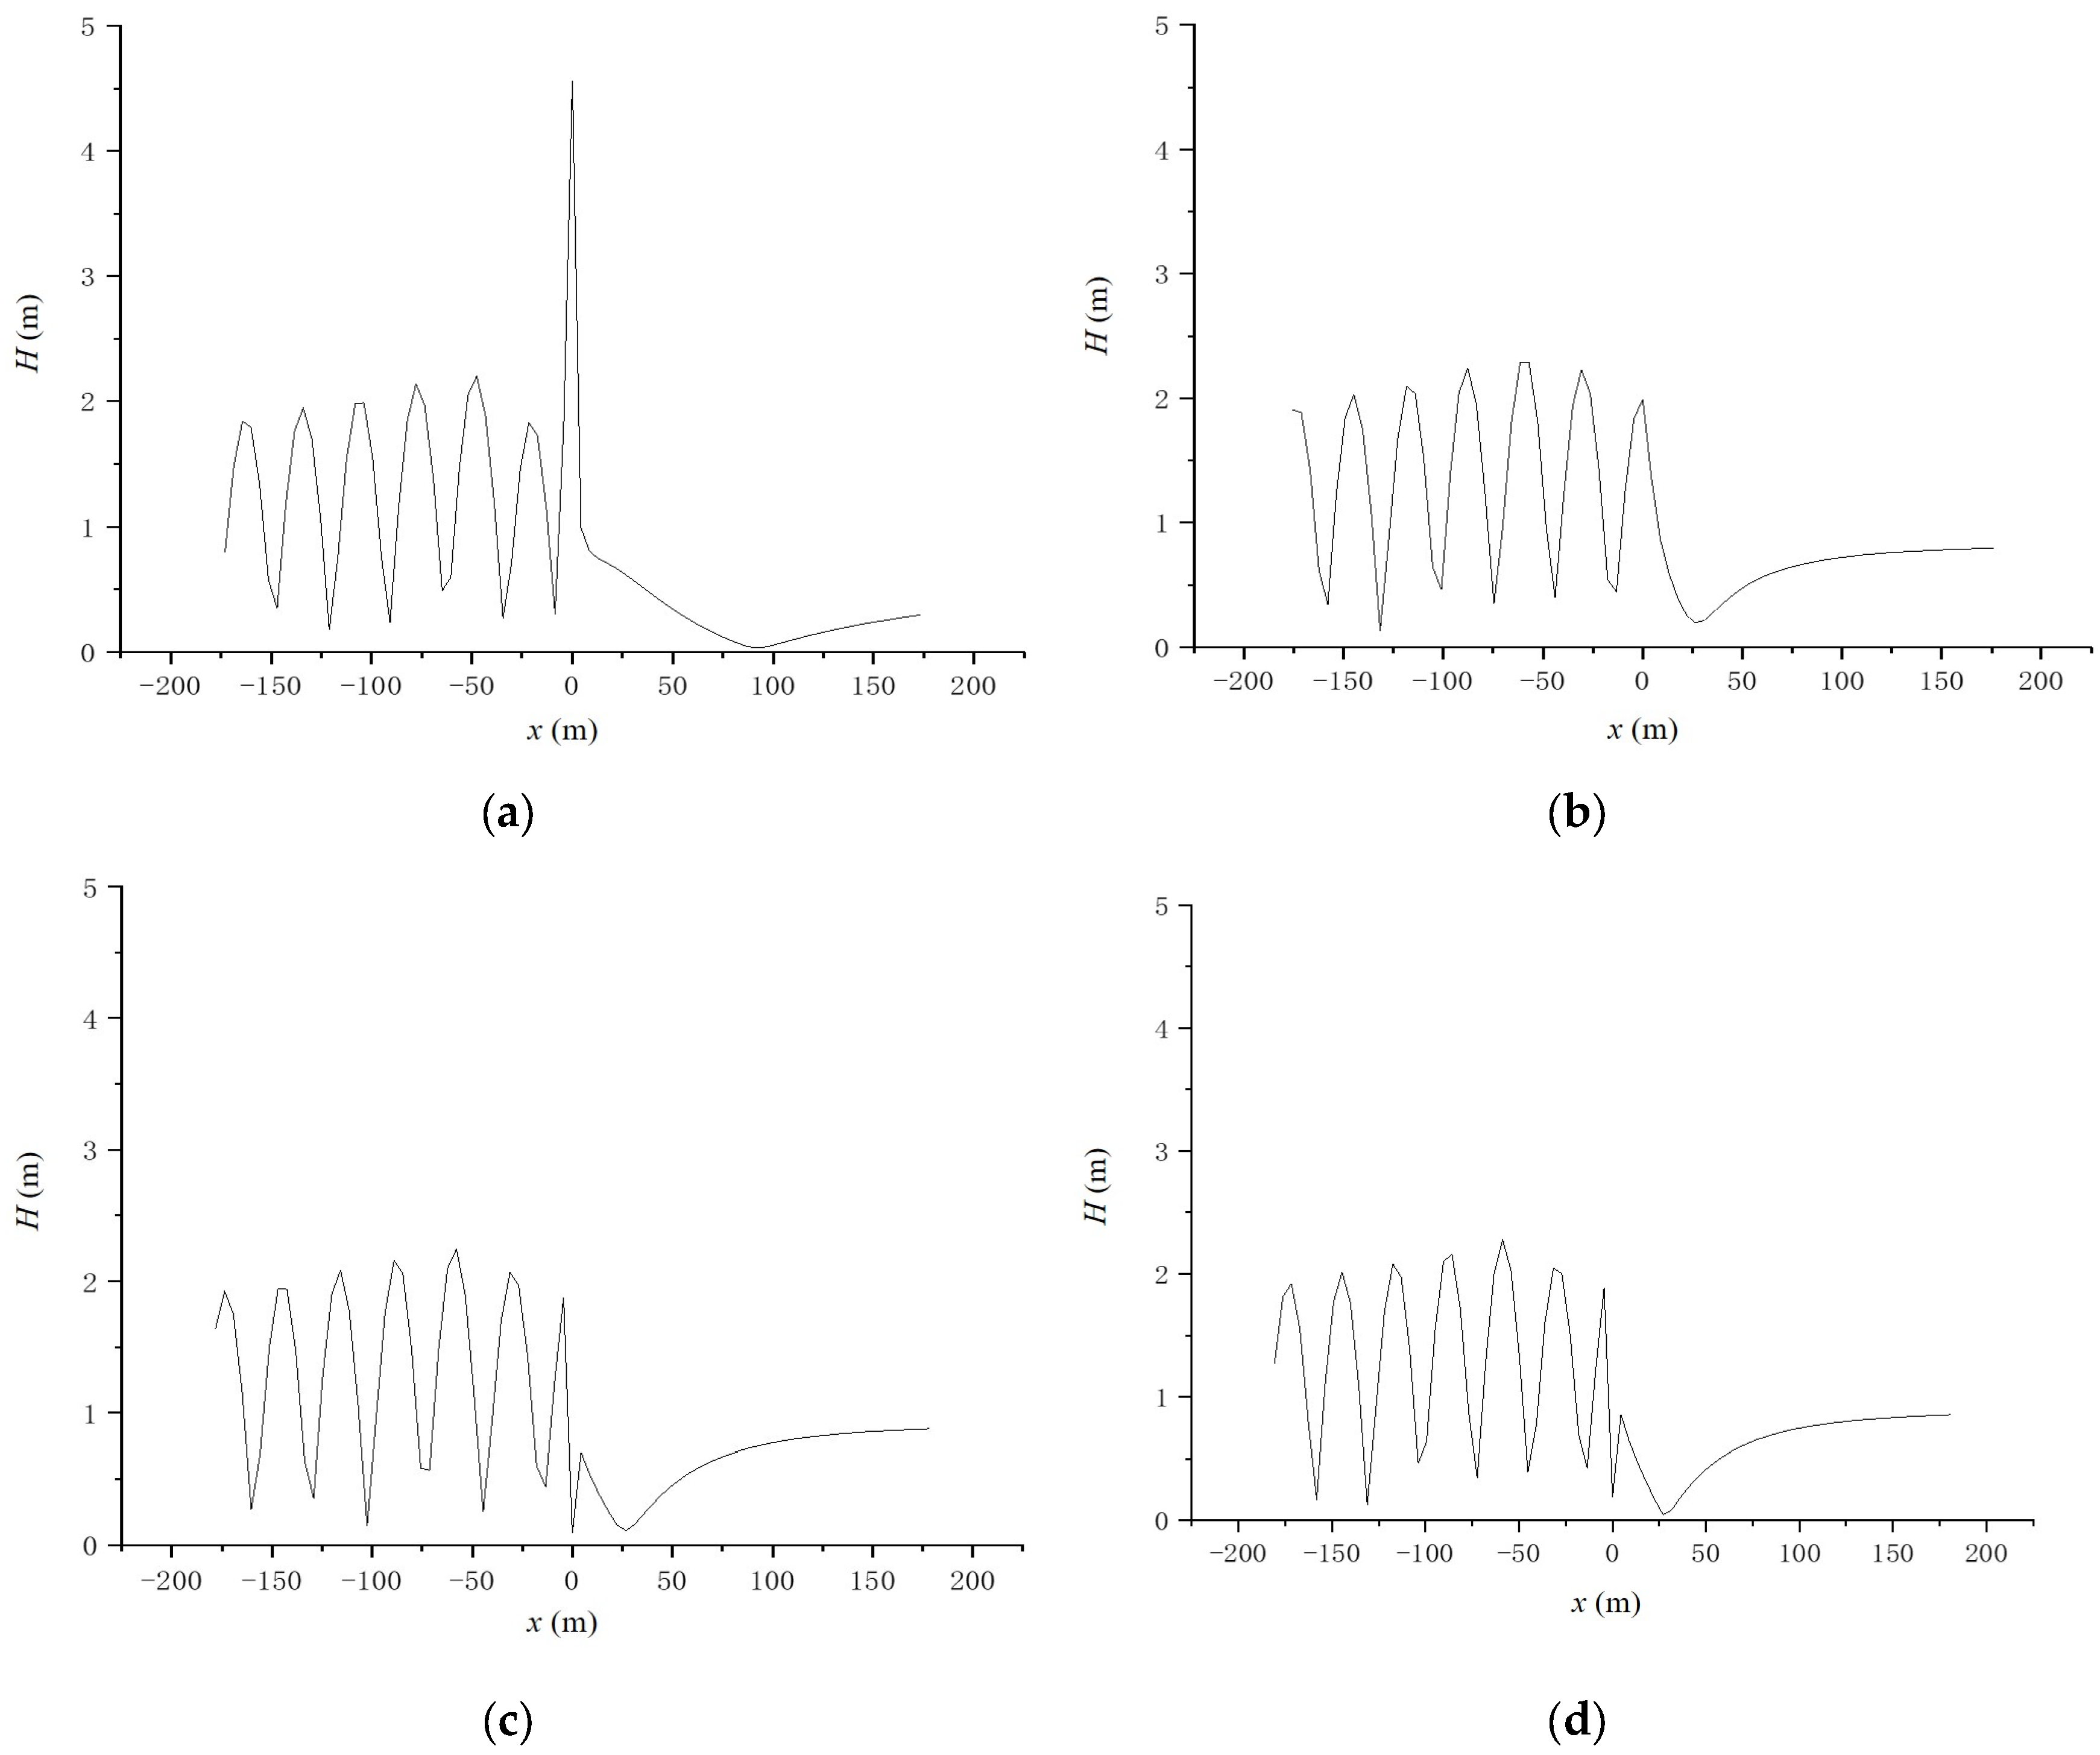
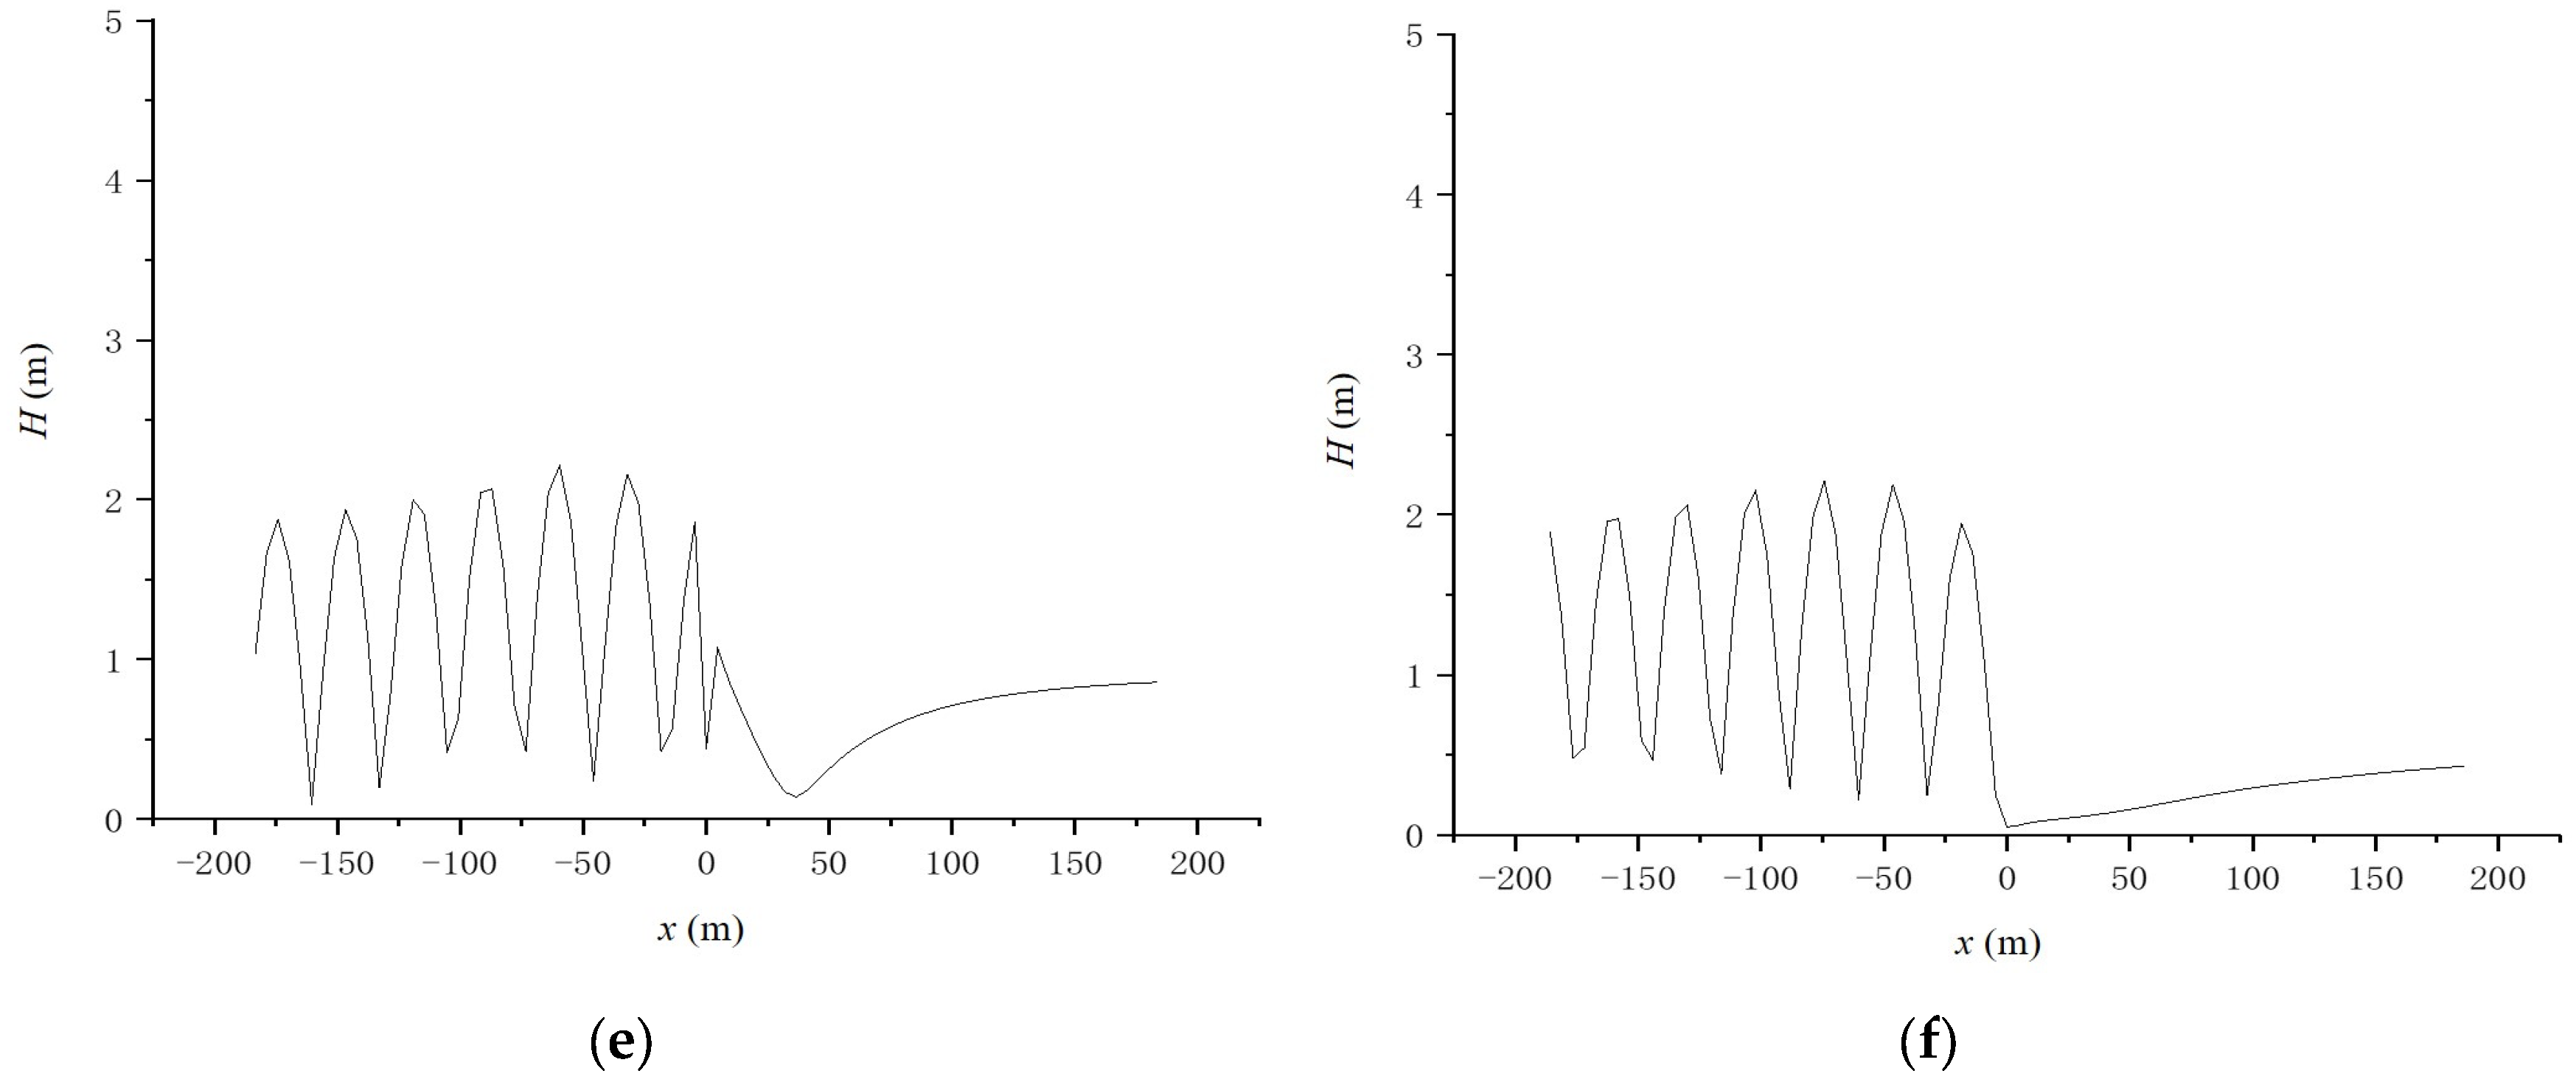
4.1.1. Effect of Large Cylinder Diameter

The large cylinder diameter takes the value of D1 = 5.0 m~12.0 m while other parameters are D2 = 1.8 m, α = 45°, T = 6.0 s, and Hi = 2.0 m and the water depth is d = 50 m. The numerical results of wave clouds around the floating breakwater are shown in Figure 7. The wave elevations along the centerline of the floating breakwater in wave propagation directions are shown in Figure 8. The transmission coefficients are calculated from the wave elevations behind the floating breakwater. As shown in Figure 9a, the transmission coefficient of the large cylinder decreases as its diameter increases due to the increased reflection of wave energy by the larger diameter. Simultaneously, the presence of the breakwater reduces the passage of diffracted waves through its bottom, thereby enhancing the wave dissipation capacity of the large-diameter multi-cylinder floating breakwater.

4.1.2. Effect of Small Cylinder Diameter

The diameter of the small cylinder (D2) ranges from 1.0 to 2.0 m. The remaining parameters of the cylinder breakwater, namely D1 = 10.0 m, α = 45°, T = 6.0 s, Hi = 2.0 m, and d = 50 m, remain constant. Figure 9b illustrates the correlation between the transmission coefficient of the breakwater and the diameter of the small cylinder. The transmission coefficient exhibits an overall range of 0.3 to 0.6 and diminishes with an increase in the small cylinder’s diameter. This phenomenon arises due to the unaltered diameter of the large cylinder, whereby an enlarged small cylinder diameter permits a greater passage of wave energy beneath the large cylinder, consequently leading to the increased transmission of wave energy through the breakwater.

4.1.3. Effect of the Angular Position of Small Cylinder

The analysis focuses on the impact of the angular position between two small cylinders. Specifically, the value of α is set to range from 30° to 90° while keeping the other parameters constant as follows: D2 = 1.8 m, D1 = 10.0 m, T = 6.0 s, Hi = 2.0 m, and d = 50 m. Figure 9c illustrates the correlation between the transmission coefficient and the variation in the angular position between the two small cylinders. It is evident that the transmission coefficient exhibits a distribution ranging from 0.3 to 0.6, and it tends to decrease as the central angle increases. This phenomenon can be attributed to the increased distance between the two small cylinders as the central angle expands, leading to wave interference and disruption between the small cylinders. Simultaneously, there is a gradual decrease in the height of the small cylinders, accompanied by an increase in the draft of the small cylinders. As a result, the angular position changes from 30° to 90°, leading to the gradual strengthening of the breakwater’s wave dissipation capacity.

4.1.4. Effect of Incident Wave Period

The range of the incident wave period is 4.0 s to 8.0 s, while the remaining parameters, including D1 = 10.0 m, D2 = 1.8 m, Hi = 2.0 m, α = 45°, and d = 50 m, remain constant. Figure 9d illustrates the relationship between the transmission coefficient and the incident wave period. The transmission coefficient generally varies between 0.2 and 0.9, indicating that the incident wave period significantly influences the transmission coefficient. Moreover, the transmission coefficient exhibits a gradual increase as the incident wave period increases. The reduction effect of the breakwater on the long wave is less clear than that of the short wave for the following three reasons: (i) the long-period incident wave has the ability to pass beneath the breakwater, resulting in a portion of its energy remaining unconsumed by the breakwater; (ii) when the long-period incident wave encounters the breakwater, it induces a vigorous motion response, causing significant agitation and subsequently elevating the wave height behind the breakwater; (iii) the breakwater’s ability to dissipate long-wave energy is relatively limited compared to its effectiveness for short waves; (iv) the wave overtopping induced by long-period waves surpasses that of short-period waves, thereby facilitating the infiltration of certain waves beyond the breakwater and into the protected region.

4.1.5. Effect of Incident Wave Height

The incident wave height, Hi, was changed from 1.5 m to 3.5 m while keeping the other parameters constant as follows: D1 = 10.0 m, D2 = 1.8 m, α = 45°, and d = 50 m. Figure 9e illustrates the relationship between the transmission coefficient of the breakwater and the incident wave height. The transmission coefficient exhibits a clear range between 0.3 and 0.9, signifying a notable correlation with the incident wave height. As the incident wave height increases, the transmission coefficient gradually rises. This phenomenon can be attributed to the overtopping caused by certain waves surpassing the breakwater and entering the protected area behind it, consequently augmenting the energy of the waves that traverse the breakwater. Consequently, the transmission coefficient of the breakwater exhibits an increase.

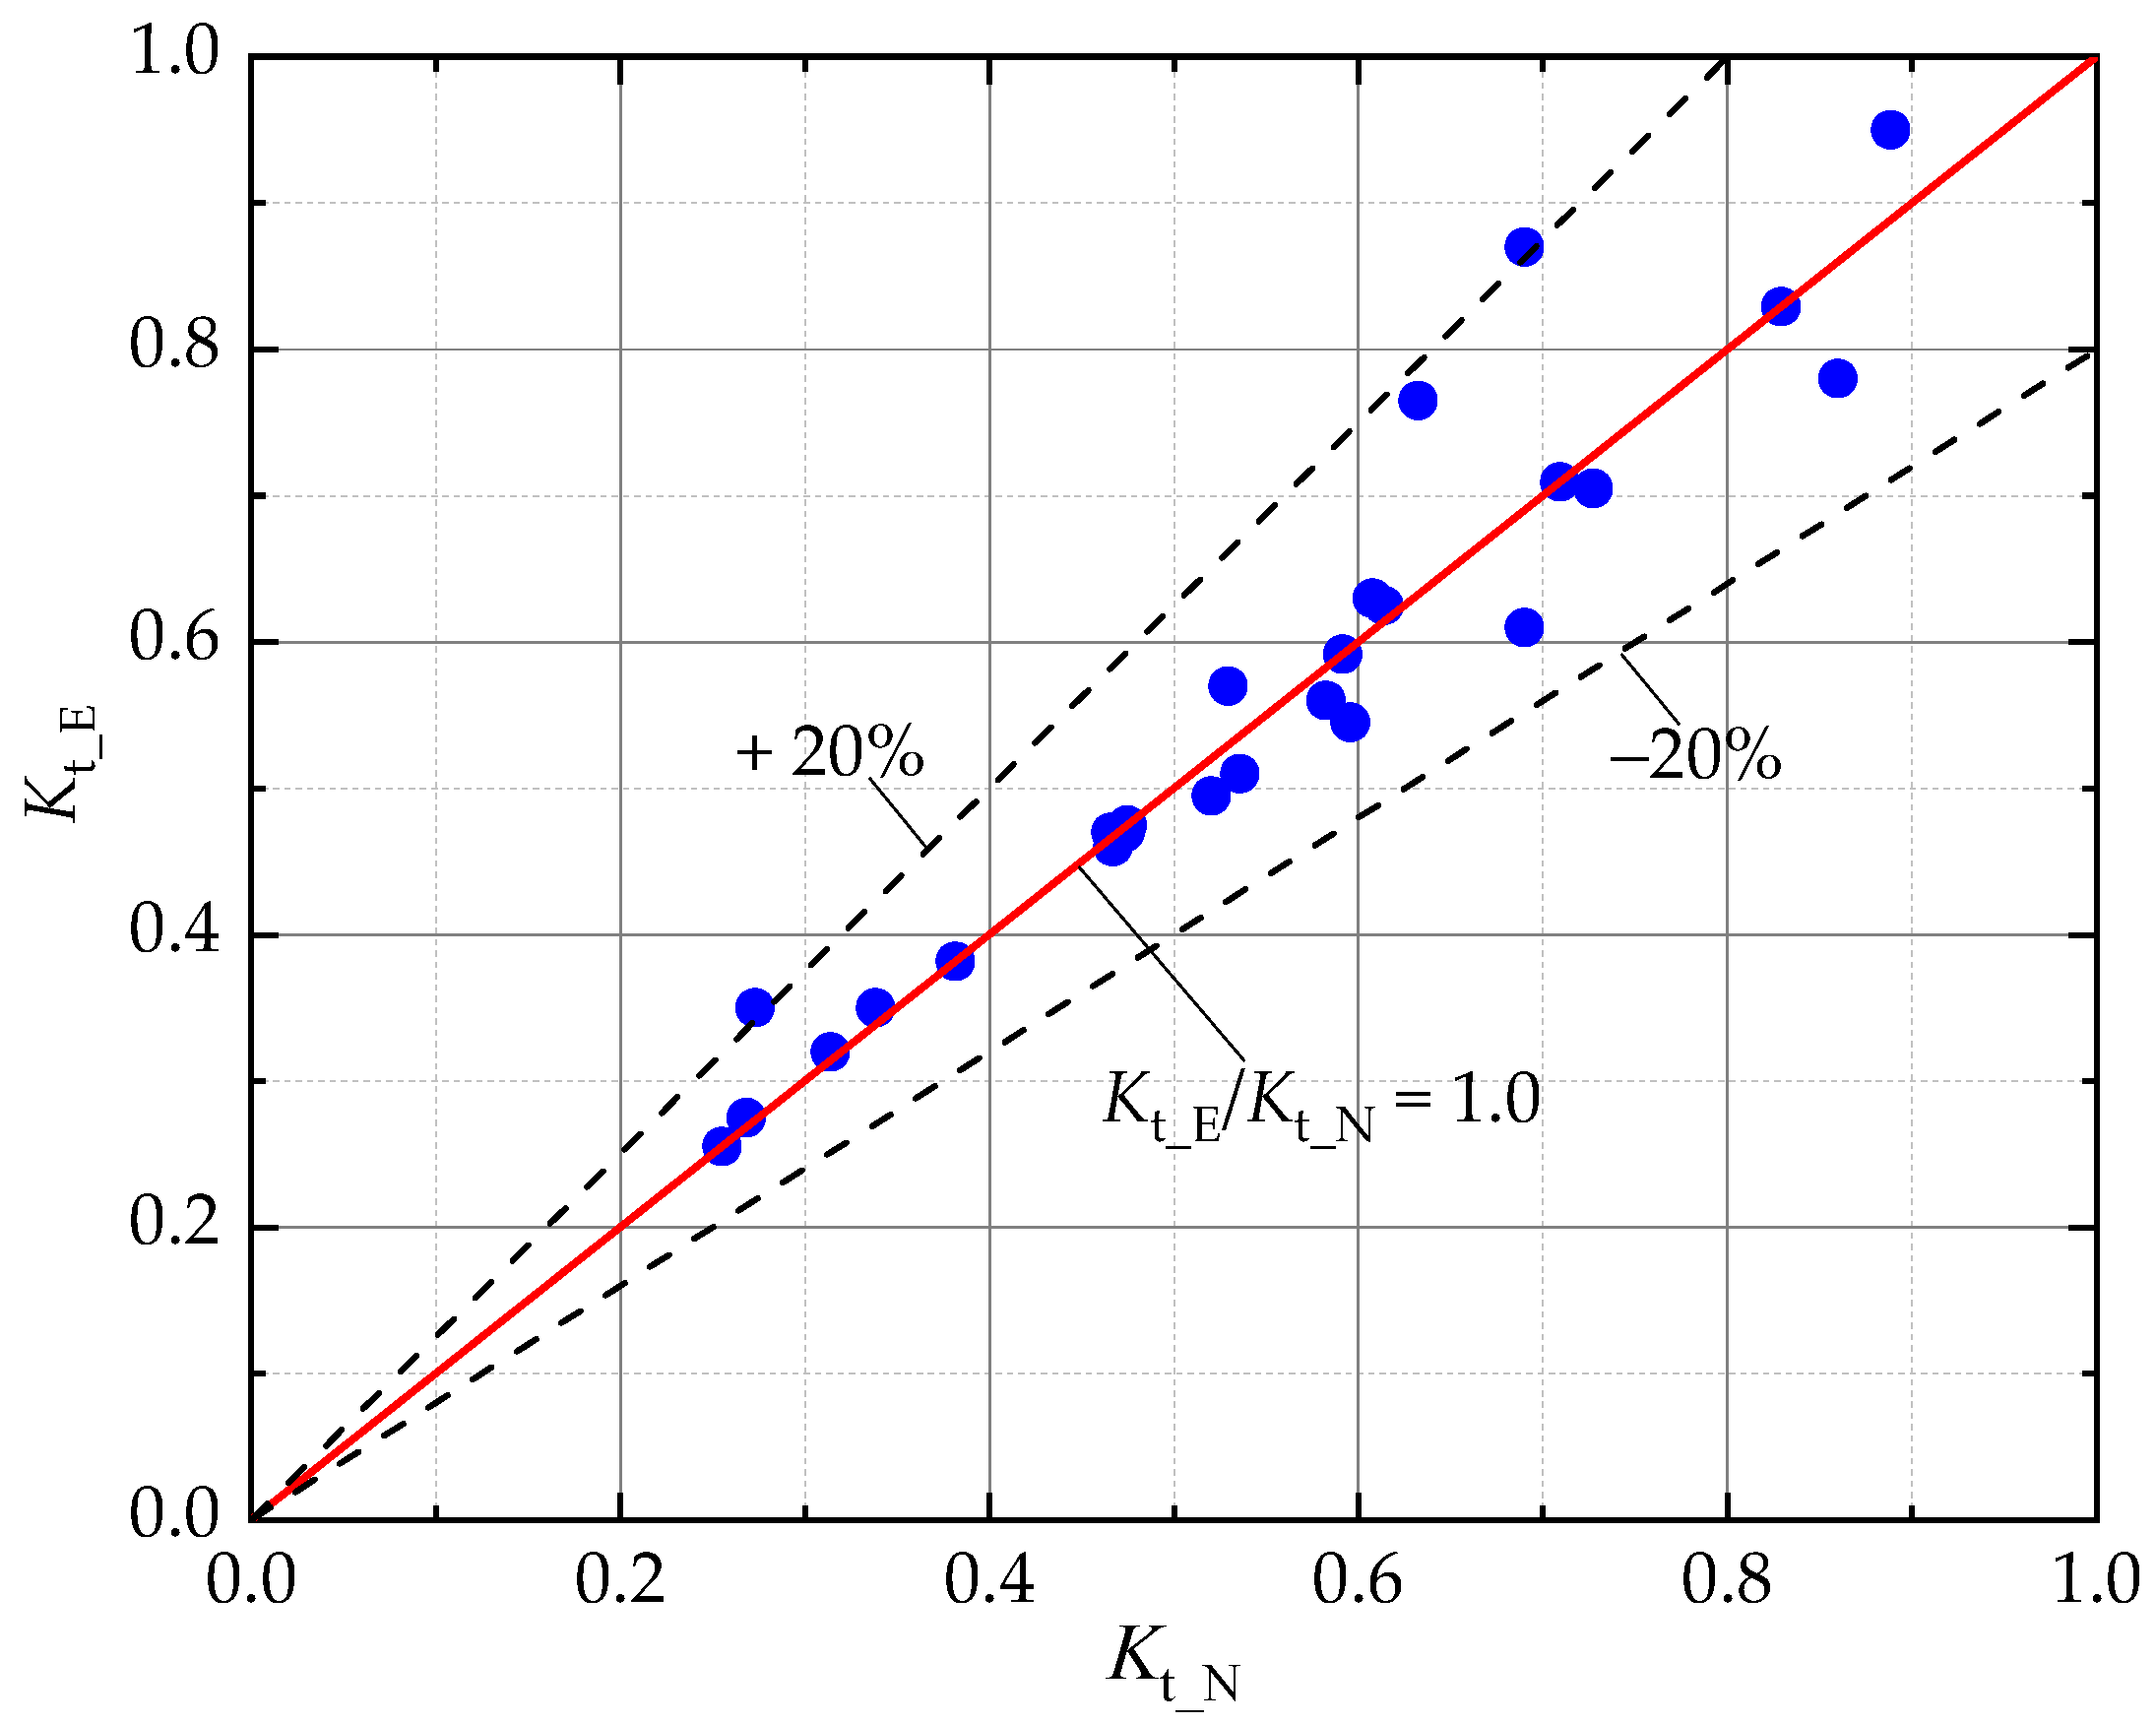
4.2. Empirical Formula

Based on the numerical results, the wave transmission coefficient Kt of the multi-cylinder floating breakwater is determined for different influential factors. To establish an empirical formula, the fitting process employs the multivariate linear regression method, resulting in the derivation of the following formula.
According to the dimension analysis, the transmission coefficient is dependent on four dimensionless parameters, i.e., the ratio of the diameter of the larger cylinder to that of the smaller cylinder (D1/D2), the angular position of the smaller cylinders (α/360°), the ratio of the wave period to the natural period (T/T0), and the ratio of the wave height to the water depth (Hi/d). Consequently, a correlation between the transmission coefficient and the aforementioned parameters is established as follows:
K t = f D 1 D 2 , α 360 ° , T T 0 , H i d
Given the assumption that the transmission coefficient varies with each parameter variable in a power function, the functional correlation between the transmission coefficient and the four dimensionless parameters is established as a nonlinear multiplication model, as depicted in the subsequent formula:
K t = β D 1 D 2 a α 360 ° b T T 0 c H i d d
By applying the natural logarithm, the following formula is obtained:
ln K t = ln β + a ln D 1 D 2 + b ln α 360 ° + c T T 0 + d H i d
Based on the numerical results, the relationship between the transmission coefficient and influential parameters can be curve-fitted as follows:
K t = 0.217 D 1 D 2 0.717 α 360 ° 0.691 T T 0 1.063 H i d 1.550
The application range for the aforementioned formula is defined by the following conditions: 5 ≤ D1/D2 ≤ 10, 0.13 ≤ α/360° ≤ 0.25, 0.33 ≤ T/T0 ≤ 0.67, and 0.30 ≤ Hi/d ≤ 0.70. The correlation coefficient, R = 0.882 (as illustrated in Figure 10), suggests a robust correlation between the transmission coefficient and the four dimensionless parameters, enabling the accurate prediction of the transmission coefficient of the present multi-cylinder floating breakwater.

5. Analysis of Total Mooring Force of Multi-Cylinder Floating Breakwater

5.1. Effects of Influential Parameters of Mooring Chain Force

The three-dimensional numerical model was employed to investigate the force characteristic of the mooring chains utilized for fixing the multi-cylinder floating breakwater under different environmental conditions. The multi-cylinder floating breakwater employed in this study was affixed by two pairs of anchor chains that were symmetrically distributed on both sides. The arrangement of the mooring chains can be referred to in Figure 2b.
Due to the complex interactions between the floating breakwater and mooring lines under wind, current, and waves, time domain analyses were conducted to calculate the mooring line force, similar to those adopted by Ji et al. (2016) [21] and Zou et al. (2023) [25]. In the current research, response amplitude operators (RAOs) were initially obtained through diffraction analysis in the frequency domain. Subsequently, the results from the diffraction module were utilized as input in the hydrodynamic response module to compute the responses of the floating breakwater and mooring line forces in the time domain. In this study, regular waves were utilized to calculate the maximum mooring line force, as demonstrated in previous research conducted by Xu et al. (2016) [31] and Yang et al. (2021) [32], because the trend of the mooring tension under regular waves is more distinct and facilitates the analysis of general characteristics. The influential factors considered in this study included wind speed (V), current velocity (u), incident wave height (Hi), incident wave period (T), and water depth (d). The configuration parameters for the multi-cylinder floating breakwater were set as follows: D1 = 12.0 m, D2 = 2.0 m, α = 60°, and were determined based on the minimum wave transmission coefficient according to the local design wave parameter.

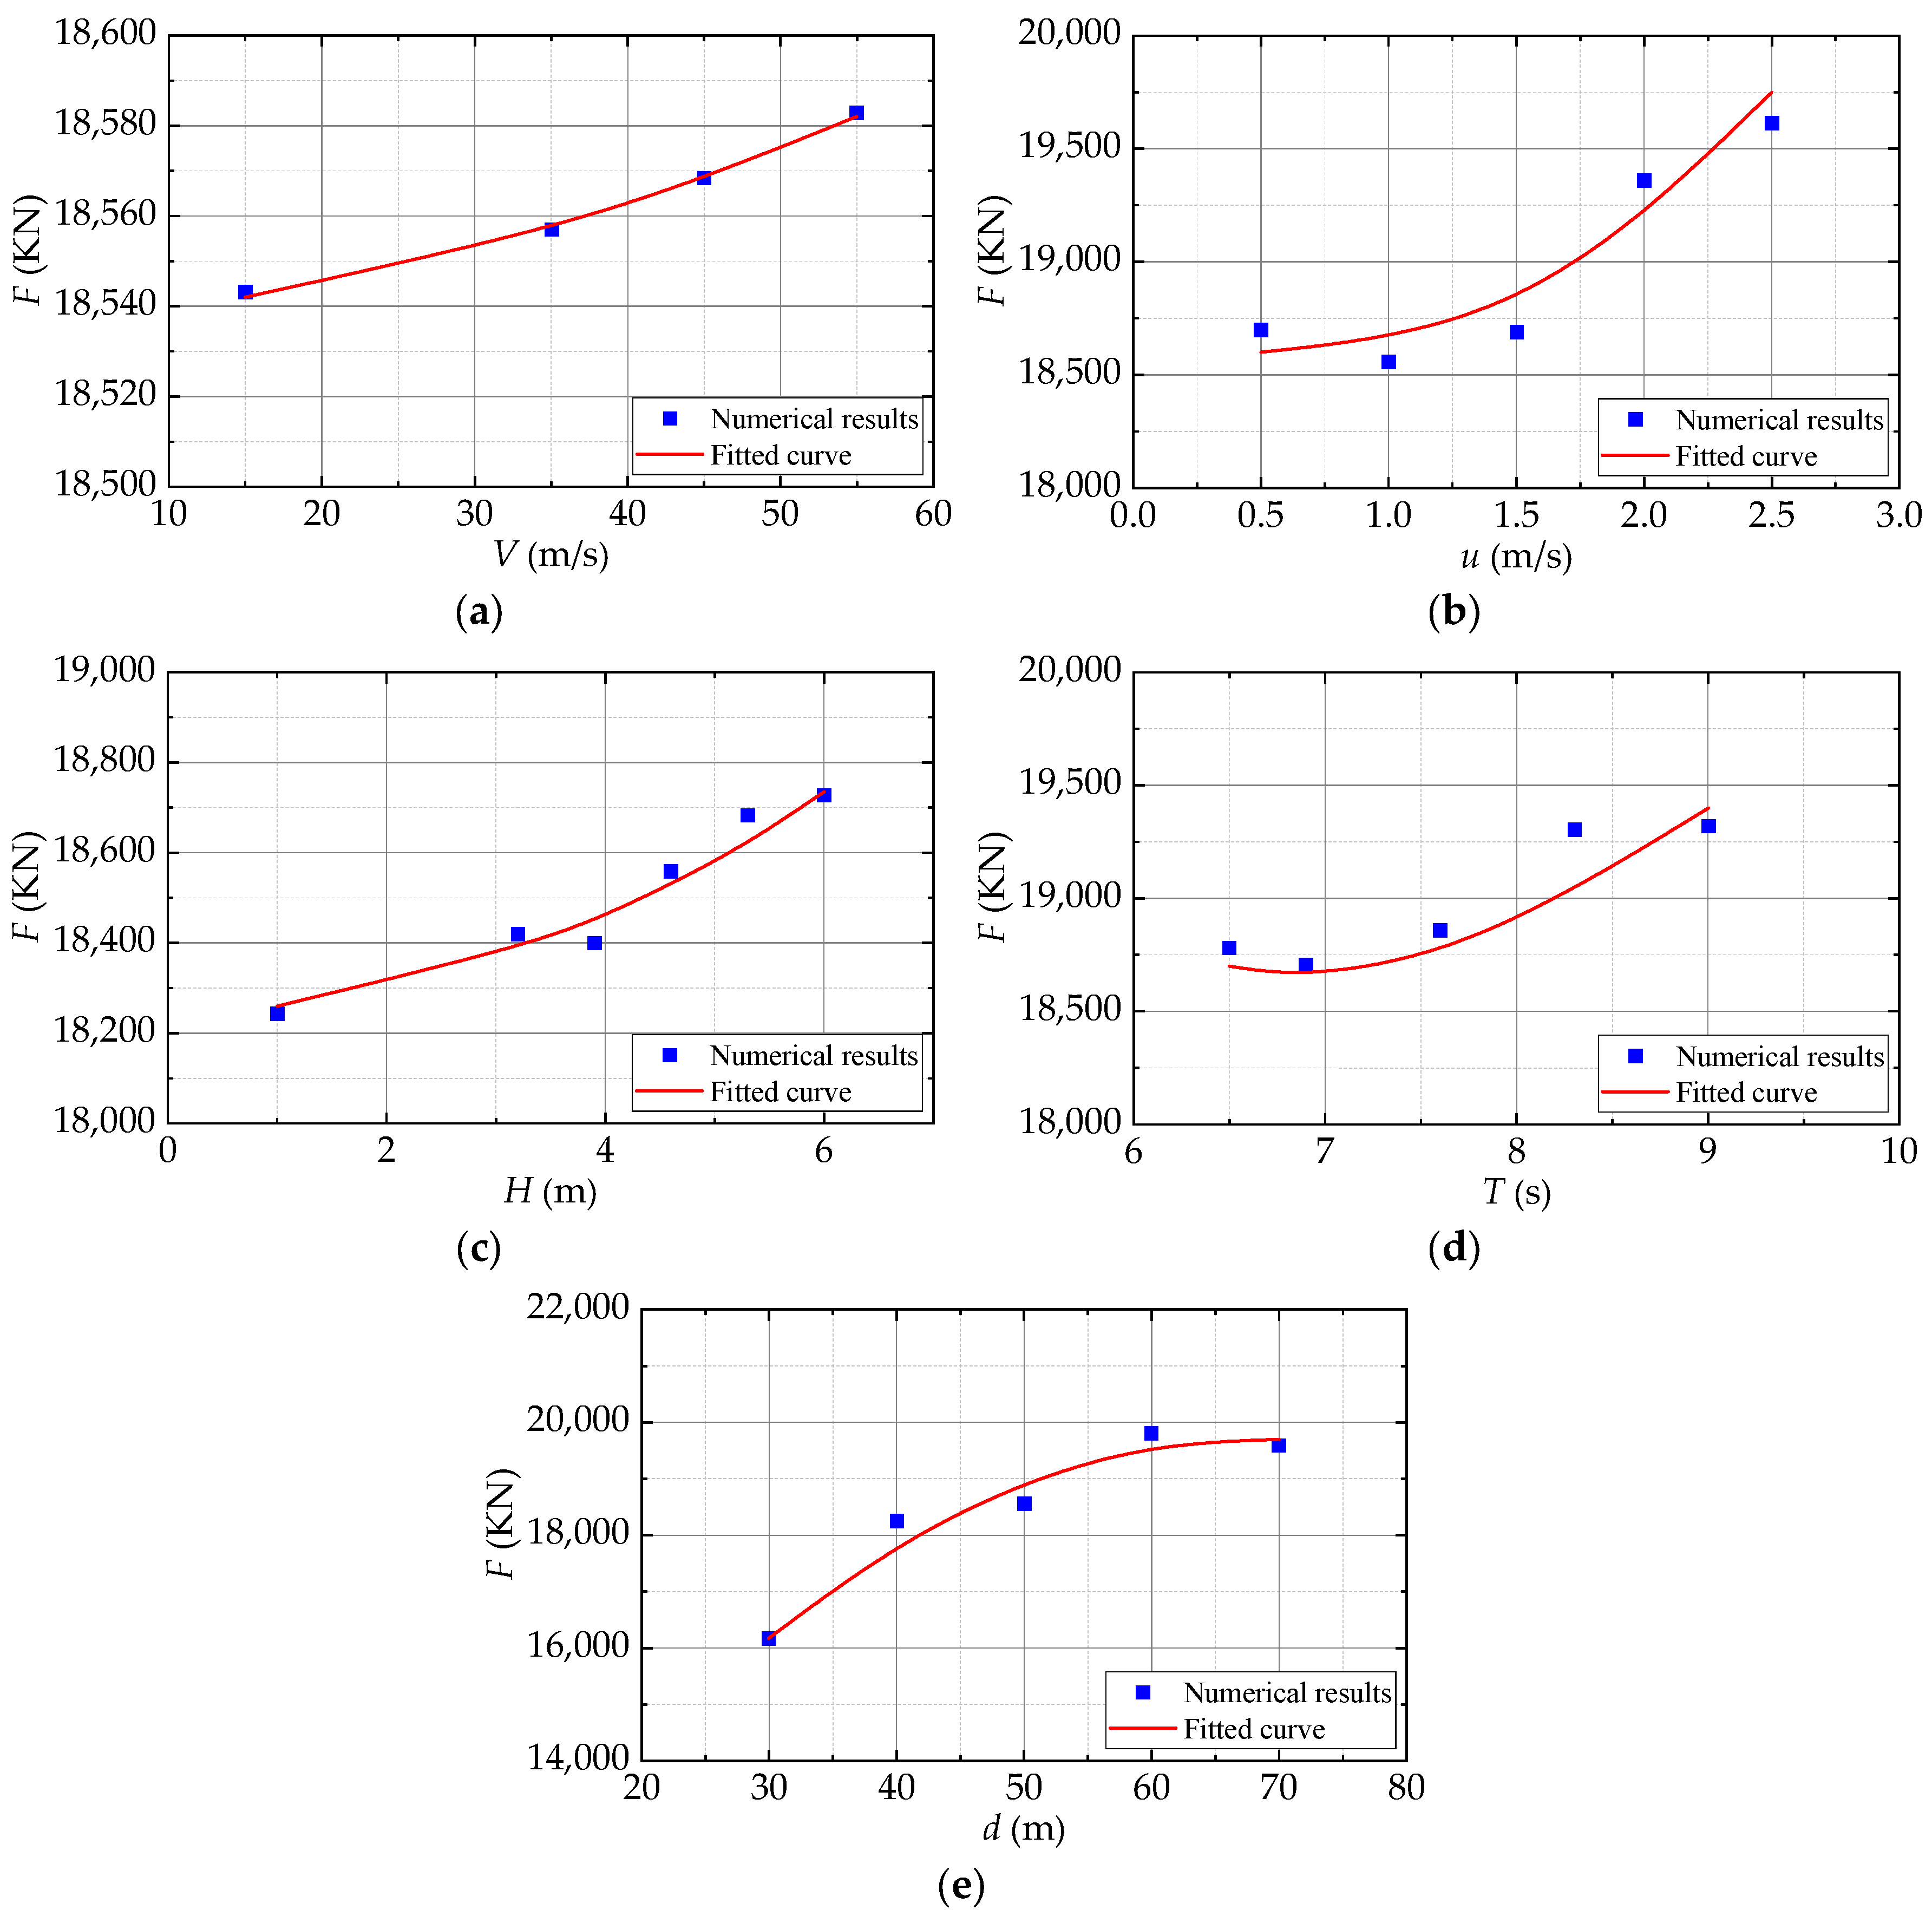
5.1.1. Effect of Wind Speed

The range of wind speed is set V = 15 m/s~55 m/s, and the other parameters are constant as follows: u = 1.0 m/s, Hi = 4.6 m, T = 7.6 s, d = 50 m. The forces on each individual mooring chain are determined using a numerical model, taking into account the specific environmental conditions. The total mooring force is then calculated as the sum of these four mooring chain forces in a time series. Then, the relationship between the maximum total mooring force and the wind speed is obtained, as shown in Figure 11a. Based on the depicted relationship, it can be deduced that the maximum total mooring force exhibits a positive correlation with wind speed, wherein the force increases with the increasing wind speed. Specifically, within the wind speed range of V = 15 m/s to V = 55 m/s, the maximum total mooring force experiences a modest increase from 1.854 × 10⁷ N to 1.859 × 10⁷ N.
The amplification of wind velocity results in an augmented exertion of force on the mooring chain. Nevertheless, owing to the limited exposure height of the multi-cylinder breakwater above the sea’s surface, the windward region of the breakwater is relatively small, thereby minimizing the influence of wind velocity fluctuations on the total maximum mooring force. This suggests that the wind force does not hold significant importance in determining the total mooring force of the floating breakwater.

5.1.2. Effect of Current Velocity

This study examines the effect of current velocity on the total mooring force of the floating breakwater, considering a range of current velocities from u = 0.5 m/s to 2.5 m/s. The remaining parameters, namely V = 35 m/s, Hi = 4.6 m, T = 7.6 s, and d = 50 m remain constant. Subsequently, the correlation between the maximum total mooring force of the breakwater and the current velocity is determined based on the numerical results and is visually represented in Figure 11b.
The maximum total mooring force experiences a slight initial increase followed by a rapid increase as the current velocity rises. The overall tension demonstrates a positive correlation with the current velocity. The flow rate increases from u = 0.5 m/s to u = 2.5 m/s, and the total tension of the anchor chain increases from 1.841 × 10⁷ N to 1.983 × 10⁷ N. It indicates that the impact of current velocity on the total mooring force surpasses that of wind speed. The presence of the breakwater diminishes the current velocity in the area behind the structure, resulting in enhanced water stability. Consequently, as the current velocity escalates, the mooring force exerted by the breakwater exhibits a positive correlation.

5.1.3. Effect of Incident Wave Height

The present study investigates the effect of the incident wave height on the mooring force in regular waves. The incident wave height (Hi) ranges from 1.0 to 6.0 m, while other parameters such as velocity (V = 35 m/s), current velocity (u = 1.0 m/s), wave period (T = 7.6 s), and water depth (d = 50 m) remain constant. Figure 11c displays the relationship curve between the maximum total mooring force and the incident wave height. It can be concluded that there is a positive correlation between the maximum total mooring force and the incident wave height. Specifically, as the incident wave height ranges from Hi = 1.0 m to Hi = 6.0 m, the maximum total mooring force exhibits an increase from 1.822 × 10⁷ N to 1.881 × 10⁷ N, thereby highlighting the substantial influence of the incident wave height on the maximum total mooring force.

5.1.4. Effect of Incident Wave Period

The effects of the incident wave period on the maximum total mooring force are examined within the range of T = 6.5 s to 9.0 s. All other variables remain constant, including V = 35 m/s, u = 1.0 m/s, Hi = 4.6 m, and d = 50 m. The correlation between the maximum total mooring force and the incident wave period is determined through numerical simulations, as depicted in Figure 11d. Generally, there is a positive correlation between the maximum total mooring force and the incident wave period. Specifically, as the incident wave period increases from T = 6.5 s to T = 9.0 s, the maximum total mooring force ranges from 1.845 × 10⁷ N to 1.982 × 10⁷ N, suggesting that the incident wave period is a significant determinant of the maximum total mooring force.

5.1.5. Effect of Water Depth

The effect of the water depth on the total mooring force of the floating breakwater is examined under specific wind, wave, and current conditions. The water depth ranges from d = 30 m to 70 m, while other parameters remain constant as follows: V = 35 m/s, u = 1.0 m/s, Hi = 4.6 m, T = 7.6 s. The correlation between the maximum total mooring force and the water depth is obtained based on numerical simulations, as shown in Figure 11e.
As the water depth increases from d = 30 m to d = 70 m, there is a corresponding change in the maximum total mooring force from 1.612 × 10⁷ N to 1.945 × 10⁷ N. This observation suggests that water depth is a significant factor influencing the maximum mooring force. Specifically, the maximum mooring force exhibits an upward trend with increasing water depth when d ≤ 60 m. However, at larger water depths, the maximum mooring force remains relatively stable, indicating that the impact of the water depth on the maximum total mooring force becomes negligible when the water depth reaches a certain threshold. Due to the increase in the water depth, the angle between the mooring chain and the horizontal external force has a large value. Thus, there is a need for a large mooring chain force to balance the external force.

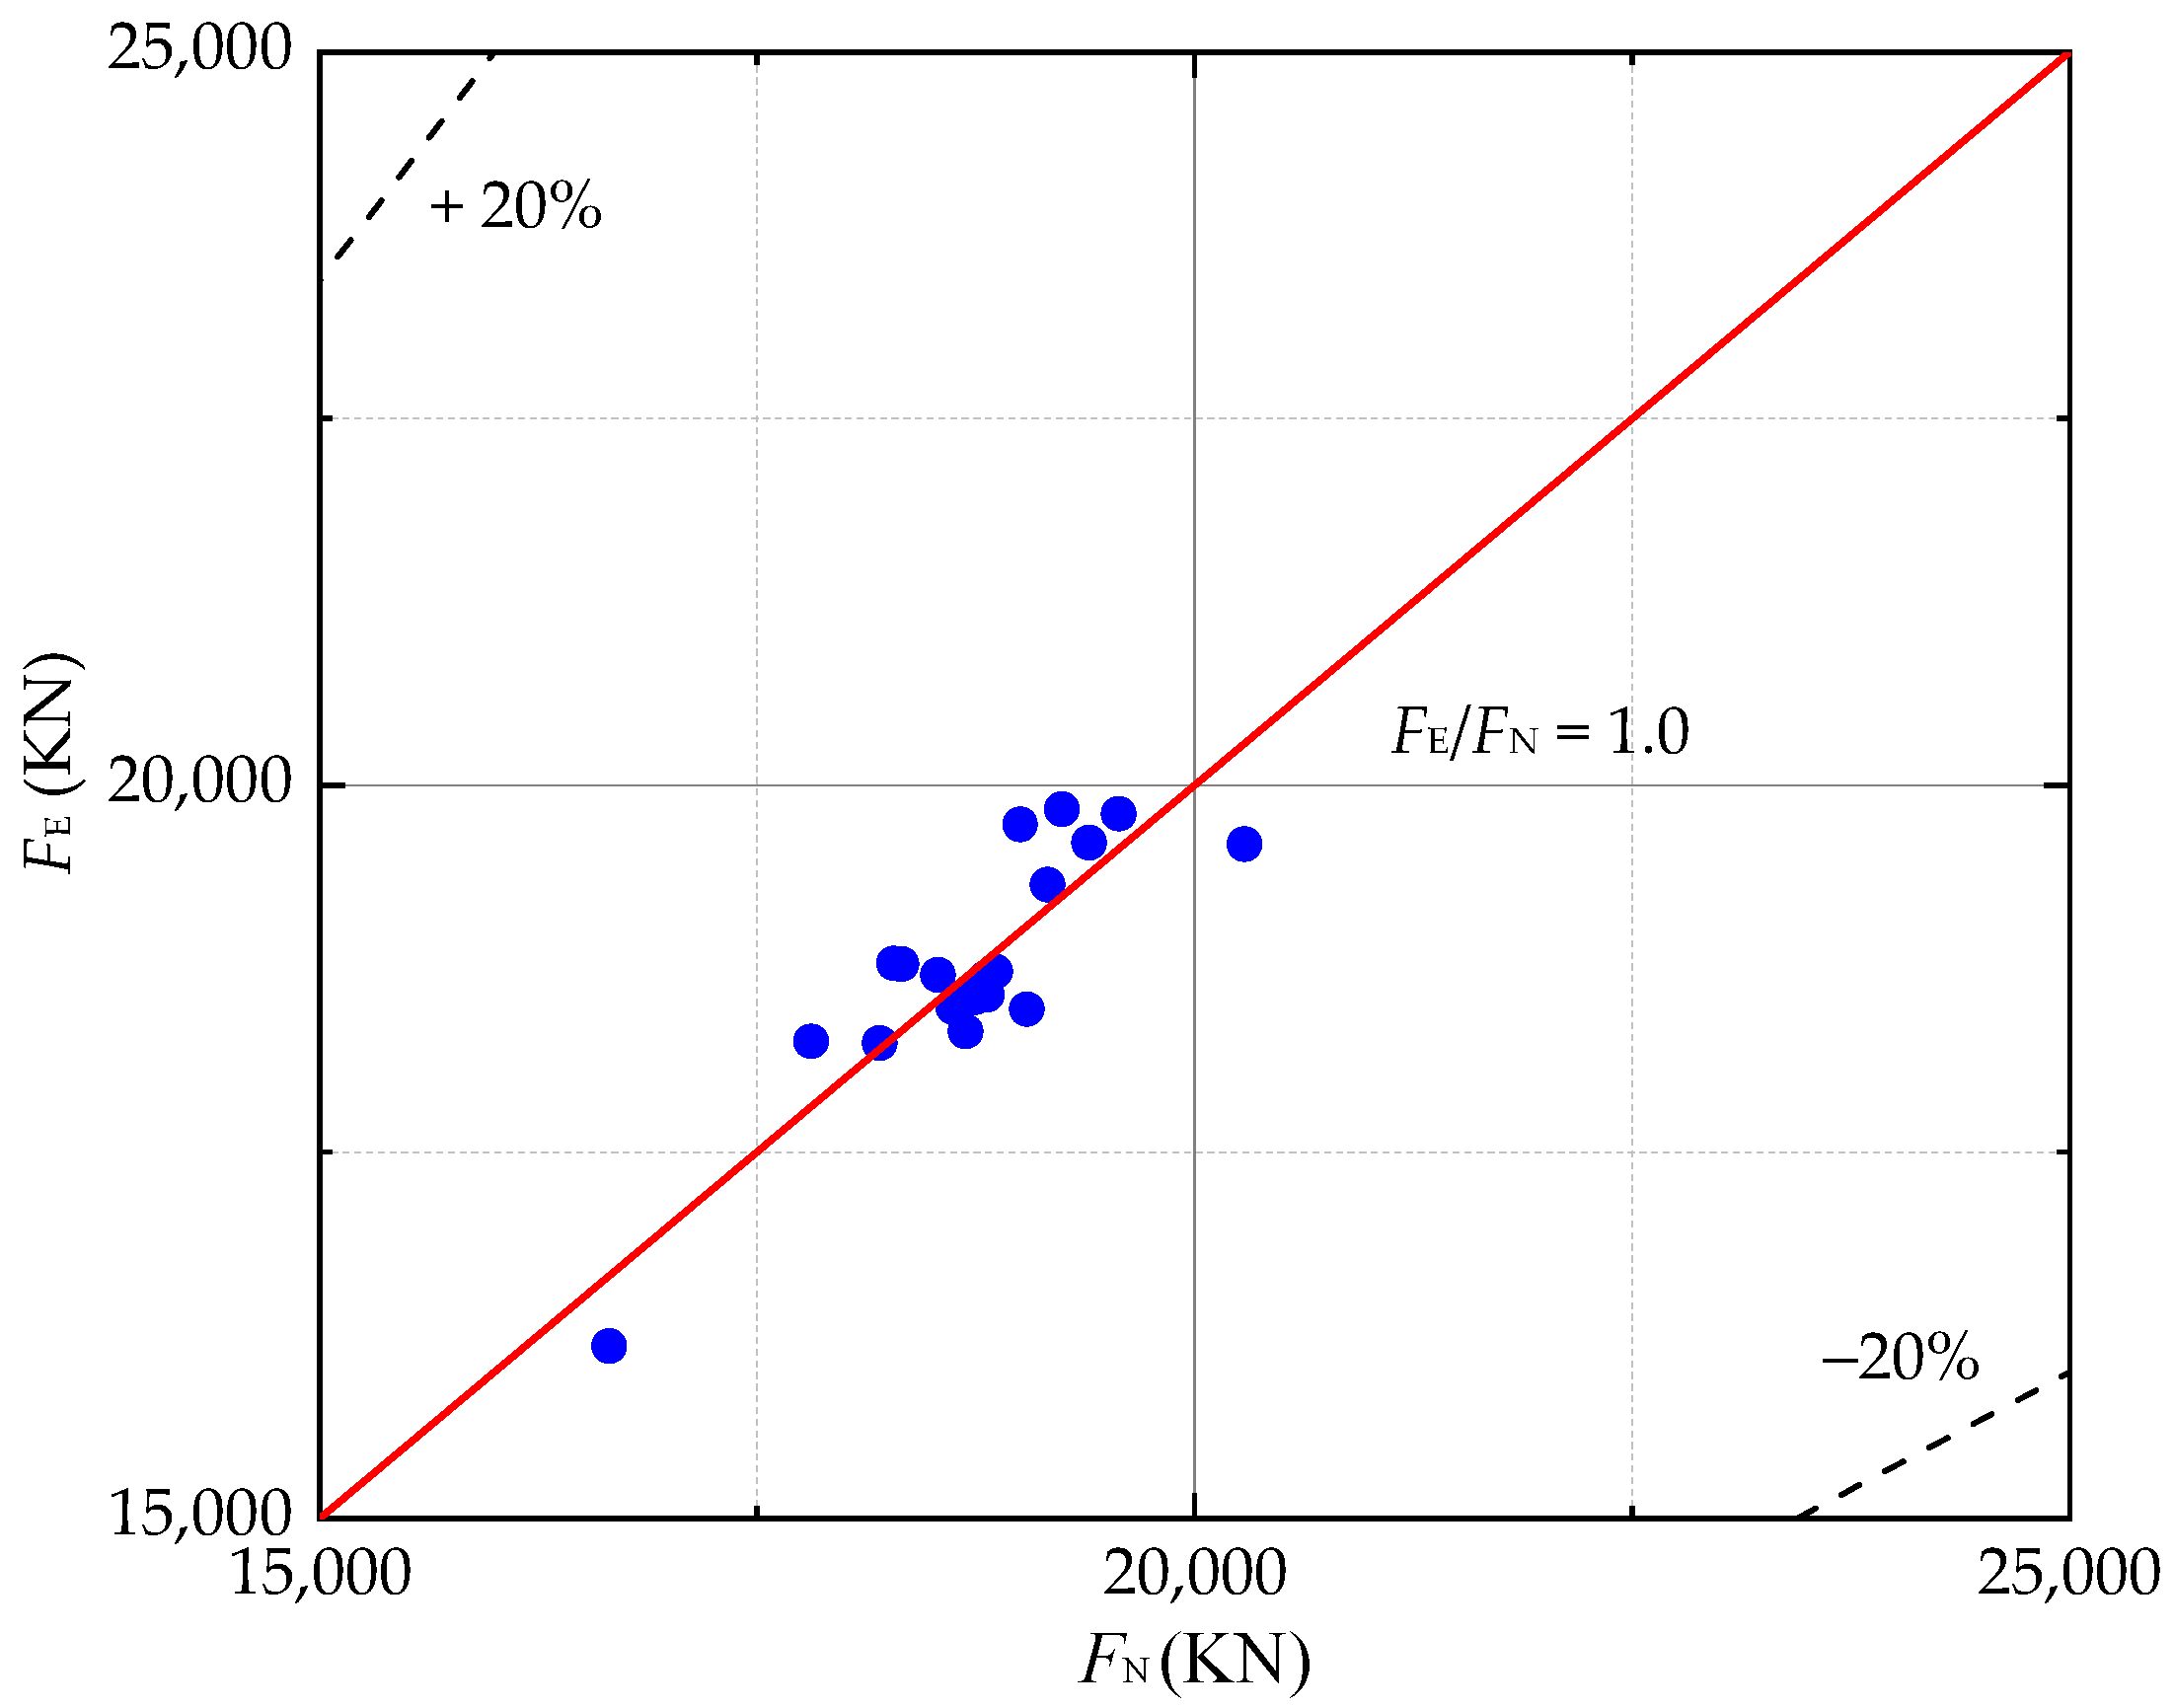
5.2. Empirical Formula

The empirical formula is obtained with the multivariate linear regression method based on numerical results. The influential factors investigated in this study include wind speed (V), velocity (u), incident wave height (Hi), incident wave period (T), and water depth (d).
Based on the dimension analysis, the dimensionless influential parameters are chosen as follows: the ratio of the maximum mooring force to the bearing force of the mooring chain (F/Fmax), the ratio of the wind speed to the one hundred years return value (V/V100), the ratio of the current velocity to the velocity of the foundation current (u/u0), the ratio of incident wave height to the large cylinder diameter (H/D1), the ratio of the incident wave period to the natural period of the floating breakwater structure (T/T0), and the ratio of water depth to the diameter of the large cylinder (d/D1). The relationship between the dimensionless total mooring force and the influential parameters is expressed as follows:
F F max = f V V 100 , v v 0 , H D 1 , T T 0 , d D 1
where Fmax = 400,000,000 N, V100 = 35 m/s, u = 1.0 m/s, D1 = 12.0 m, and T0 = 9.6 s. Assuming the application of a power law, the relationship stated in Equation (10) can be further expressed as:
F F m a x = β V V 100 a v v 0 b H D 1 c T T 0 d d D 1 e
By taking the natural logarithm of the equation in reference to Equation (11) and employing the linear form of multivariate variables, the subsequent equation can be derived as follows:
ln F F max = ln β + a ln V V 100 + b ln v v 0 + c ln H D 1 + d ln T T 0 + e ln d D 1
Linear regression analysis is conducted on the data obtained from the numerical simulation in order to determine the coefficients associated with each influencing factor in Equation (12), while the coefficients in Equation (11) can be obtained using the following approach:
F F max = 0.033205 V V 100 0.005945 v v 0 0.03678 H D 1 0.019688 T T 0 - 0.13588 d D 1 0.232927
The application range for the aforementioned formula is defined by the following conditions: 0.43 ≤ V/V100 ≤ 1.5, 0.5 ≤ u/u0 ≤ 2.5, 0.083 ≤ H/D1 ≤ 0.5, 0.67 ≤ T/T0 ≤ 0.94, 2.5 ≤ d/D1 ≤ 5.83. The correlation analysis of the predicted and numerical results is conducted, and the correlation coefficient is R = 0.913, with FE and FN denoting the predicted value and numerical results of the maximum total mooring force. The proposed empirical formula can be used to predict the total mooring force of the floating breakwater in practical engineering. See Figure 12.

6. Conclusions

This paper presents the establishment of a three-dimensional numerical model, utilizing ANSYS AQWA software to analyze the hydrodynamic characteristics of a multi-cylinder floating breakwater. The investigation focuses on the wave transmission coefficient and total mooring force of the floating breakwater, aiming to inform the design of a shielding scheme for a floating artificial island.
Initially, three unique floating breakwaters with different cross-sectional designs, namely the horizontal multi-cylinder configuration, the single-cylinder configuration, and the square pontoon configuration were examined to assess their wave dissipation capabilities. The numerical results indicate that the horizontal multi-cylinder floating breakwater demonstrates a superior capacity for wave dissipation compared to the other two configurations. Hence, the implementation of a horizontal multi-cylinder floating breakwater could be considered the most advantageous option for the protective shielding strategy of the artificial floating island.
Subsequently, this study examined the effects of influential parameters, including a large cylinder diameter, a small cylinder diameter, the angular position of the small cylinder, and the height and period of the incident wave, on the wave transmission coefficient. In general, the wave transmission coefficient exhibited a decline as the large cylinder diameter, the small cylinder diameter, and the angular position of the small cylinder increased, while it demonstrated an increase with the increase in the incident wave height and period. An empirical formula for the wave transmission coefficient was derived from the numerical results, with the intention of facilitating its application in engineering.
Finally, this study examined the effects of influential parameters, such as wind speed, current velocity, incident wave height and period, and water depth, on the maximum total mooring force. It was generally observed that the maximum mooring force of the floating breakwater exhibited an upward trend as the aforementioned influential parameters increased. An empirical formula of the maximum total mooring force was also proposed for engineering applications. It is noted that the fatigue life of the mooring line is also a crucial consideration in practical engineering design. Our forthcoming research entails a comprehensive investigation of this aspect in irregular wave conditions through time domain analyses.

Author Contributions

Conceptualization, Z.Z. and Z.F.; methodology, K.Q. and L.Z.; investigation, Z.Z., K.Q. and L.Z.; resources, Z.Z. and Z.F.; writing—original draft preparation, Z.Z., K.Q. and L.Z.; writing—review and editing, Z.Z., Z.F. and T.Z.; visualization, Z.F. and T.Z.; supervision, Z.Z. and T.Z.; funding acquisition, Z.Z. and Z.F. All authors have read and agreed to the published version of the manuscript.

Funding

This research was funded by the National Natural Science Foundation of China (51979192, 52371289).

Institutional Review Board Statement

Not applicable.

Informed Consent Statement

Not applicable.

Data Availability Statement

Data are contained within the article.

Acknowledgments

The authors thank the anonymous reviewers for their helpful comments and suggestions.

Conflicts of Interest

The authors declare no conflict of interest.

References

  1. Li, Y.; Teng, B. Wave Action on Maritime Structures, 2nd ed.; Oceanic Express: Beijing, China, 2002. [Google Scholar]
  2. Dai, J.; Wang, C.M.; Utsunomiya, T.; Duan, W. Review of recent research and developments on floating breakwaters. Ocean Eng. 2018, 158, 132–151. [Google Scholar] [CrossRef]
  3. Peña, E.; Ferreras, J.; Sanchez-Tembleque, F. Experimental study on wave transmission coefficient, mooring lines and module connector forces with different designs of floating breakwaters. Ocean Eng. 2011, 38, 1150–1160. [Google Scholar] [CrossRef]
  4. Huang, Z.; He, F.; Zhang, W. A floating box-type breakwater with slotted barriers. J. Hydraul. Res. 2014, 52, 720–727. [Google Scholar] [CrossRef]
  5. Loukogeorgaki, E.; Niki, E.; Lentsiou, M.; Aksel, M.; Yagci, O. Experimental investigation of the hydroelastic and the structural response of a moored pontoon-type modular floating breakwater with flexible connectors. Coast. Eng. 2017, 121, 240–254. [Google Scholar] [CrossRef]
  6. Yang, Z.; Xie, M.; Gao, Z.; Xu, T.; Guo, W.; Ji, X.; Yuan, C. Experimental investigation on hydrodynamic effectiveness of a water ballast type floating breakwater. Ocean Eng. 2018, 167, 77–94. [Google Scholar] [CrossRef]
  7. Shen, Y.; Pan, J.; Zhou, Y.; Wang, X. Experimental study on wave attenuation performance of a new type of floating breakwater with twin pontoons and multi porous vertical plates. China Ocean Eng. 2022, 36, 384–394. [Google Scholar] [CrossRef]
  8. Chen, Y.; Liu, Y.; Domenico, D.M. Comparison of hydrodynamic performances between single pontoon and double pontoon floating breakwaters through the SPH method. China Ocean Eng. 2022, 36, 894–910. [Google Scholar] [CrossRef]
  9. Zang, Z.; Fang, Z.; Zhang, N. Flow mechanism of impulsive wave forces and improvement on hydrodynamic performance of a comb-type breakwater. Coastal Eng. 2018, 133, 142–158. [Google Scholar] [CrossRef]
  10. Wang, Z.; Fang, Z.; Zang, Z.P.; Zhang, J.F. Experimental study on the hydrodynamic characteristics of a fixed comb-type floating breakwater. Water 2023, 15, 2689. [Google Scholar] [CrossRef]
  11. Dong, G.; Zheng, Y.; Li, Y.; Teng, B.; Guan, C.; Lin, D. Experiments on wave transmission coefficients of floating breakwaters. Ocean Eng. 2008, 35, 931–938. [Google Scholar] [CrossRef]
  12. Deng, Z.; Wang, L.; Zhao, X.; Huang, Z. Hydrodynamic performance of a T-shaped floating breakwater. Appl. Ocean Res. 2019, 82, 325–336. [Google Scholar] [CrossRef]
  13. Ruol, P.; Martinelli, L.; Pezzutto, P. Formula to predict transmission for π-type floating breakwaters. J. Waterw. Port Coast. Ocean Eng. 2012, 139, 1–8. [Google Scholar] [CrossRef]
  14. Zhang, X.; Ma, S.; Duan, W. A new L type floating breakwater derived from vortex dissipation simulation. Ocean Eng. 2018, 164, 455–464. [Google Scholar] [CrossRef]
  15. Christensen, E.D.; Bingham, H.B.; Skou Friis, A.P.; Larsen, A.K.; Jensen, K.L. An experimental and numerical study of floating breakwaters. Coastal Eng. 2018, 137, 43–58. [Google Scholar] [CrossRef]
  16. Wang, H.; Xu, H.; Liu, P.; Duan, J.; Chen, H.; Wang, B. Experimental study on the dissipation characteristics of curtain-type flexible floating breakwater. J. Coastal Res. 2015, 73, 410–414. [Google Scholar] [CrossRef]
  17. Qiu, Z.; Wu, Q.; Liu, J.; Zhao, D.; Wang, M. Study on wave dissipation characteristics of flexible floating breakwater. Yangtze River 2017, 48, 59–64. [Google Scholar]
  18. López, A.; Ferreras, J.; Peña, E. Structural performance of a floating breakwater for different mooring line typologies. J. Waterw. Port Coast. Ocean Eng. 2013, 140, 04014007. [Google Scholar]
  19. Liang, J.; Liu, Y.; Chen, Y.; Li, A. Experimental study on hydrodynamic characteristics of the box-type floating breakwater with different mooring configurations. Ocean Eng. 2022, 254, 111296. [Google Scholar] [CrossRef]
  20. Ozeren, Y.; Wren, D.G.; Altinakar, M.; Work, P.A. Experimental investigation of cylindrical floating breakwater performance with various mooring configurations. J. Waterw. Port Coast. Ocean Eng. 2011, 137, 300–309. [Google Scholar] [CrossRef]
  21. Ji, C.; Cheng, Y.; Yan, Q.; Wang, G. Fully coupled dynamic analysis of a FPSO and its MWA system with mooring lines and risers. Appl. Ocean Res. 2016, 58, 71–82. [Google Scholar] [CrossRef]
  22. Ren, B.; He, M.; Li, Y.; Dong, P. Application of smoothed particle hydrodynamics for modeling the wave-moored floating breakwater interaction. Appl. Ocean Res. 2017, 67, 277–290. [Google Scholar] [CrossRef]
  23. ANSYS Inc. AQWA Reference Manual; ANSYS Inc.: Canonsburg, PA, USA, 2019. [Google Scholar]
  24. Zheng, Y.; Li, J.; Mu, Y.; Zhang, Y.; Huang, S.; Shao, X. Numerical Study on Wave Dissipation Performance of OWC-Perforated Floating Breakwater under Irregular Waves. Sustainability 2023, 15, 11427. [Google Scholar] [CrossRef]
  25. Zou, M.; Chen, M.; Zhu, L.; Li, L.; Zhao, W. A constant parameter time domain model for dynamic modelling of multi-body system with strong hydrodynamic interactions. Ocean Eng. 2023, 268, 113376. [Google Scholar] [CrossRef]
  26. Xu, X.; Li, Y.; Sun, X.; Chen, Z.; Zhang, Y.; Kong, F. Experimental Study on Wave Dissipation Characteristic of a Double-box Floating Breakwater with Regulating Function. Port Eng. Technol. 2017, 54, 28–33. [Google Scholar]
  27. Ikeno, M.; Shimoda, N.; Iwata, K. A new type of breakwater utilizing air compressibility. In Proceedings of the 21st Coastal Engineering Conference, ASCE, Torremolinos, Spain, 20–25 June 1988; pp. 2326–2339. [Google Scholar]
  28. Murali, K.; Mani, J.S. Performance of cage floating breakwater. J. Waterw. Port. Coast. Ocean Eng. 1997, 123, 172–179. [Google Scholar] [CrossRef]
  29. Uzaki, K.I.; Ikehata, Y.; Matsunaga, N. Performance of the wave energy dissipation of a floating breakwater with truss structures and the quantification of transmission coefficients. J. Coast. Res. 2011, 27, 687–697. [Google Scholar] [CrossRef]
  30. Mani, J.S. Design of Y-frame floating breakwater. J. Waterw. Port Coast. Ocean Eng. 2014, 117, 105–119. [Google Scholar] [CrossRef]
  31. Xu, G.C.; Ma, Q.W.; Duan, W.Y.; Ma, S. Numerical prediction and experimental measurement on truss spar motion and mooring tension in regular waves. J. Ship Mech. 2016, 20, 288–305. [Google Scholar]
  32. Yang, C.; You, Z.; Bai, X.; Liu, Z.; Geng, J.; Johanning, L. Experimental and numerical analysis on the mooring tensions of the coupled tunnel-barge system in waves. Ocean Eng. 2021, 235, 109417. [Google Scholar] [CrossRef]
Figure 1. Comparisons of transmission coefficient related to the wave period between numerical and experimental results: (a) d = 0.20 m; (b) d = 0.25 m; Xu et al. (2017) [26].
Jmse 12 00449 g001
Figure 2. Model sketch of multi-cylinder floating breakwater: (a) cross-section of the breakwater; (b) 3D numerical model.
Jmse 12 00449 g002
Figure 3. Comparisons of transmission coefficients related to the wave period between experimental and numerical results: (a) Hi = 0.09 m; (b) Hi = 0.15 m; Qiu (2017) [17].
Jmse 12 00449 g003
Figure 4. Sketches of different floating breakwaters: (a) single cylinder; (b) square pontoon.
Jmse 12 00449 g004
Figure 5. Wave fields around the floating breakwaters for Hi = 4.0 m and T = 6.0 s: (a) rectangular box; (b) single circular cylinder; and (c) multi-buoys.
Jmse 12 00449 g005
Figure 6. Comparisons of wave transmission coefficients between different types of floating breakwaters.
Jmse 12 00449 g006
Figure 7. Wave fields around the floating breakwaters: (a) D1 = 6.0 m; (b) D1 = 7.0 m; (c) D1 = 8.0 m; (d) D1 = 9.0 m; (e) D1 = 10.0 m; (f) D1 = 12.0 m.
Jmse 12 00449 g007aJmse 12 00449 g007b
Figure 8. Wave elevation along the centerline of the floating breakwaters for Hi = 2.0 m, and T = 6.0 s: (a) D1 = 6.0 m; (b) D1 = 7.0 m; (c) D1 = 8.0 m; (d) D1 = 9.0 m; (e) D1 = 10.0 m; (f) D1 = 12.0 m.
Jmse 12 00449 g008aJmse 12 00449 g008b
Figure 9. Effects of influential factors on the transmission coefficient of the floating breakwater: (a) large cylinder diameter; (b) small cylinder diameter; (c) position angle of the small cylinder; (d) incident wave period; and (e) incident wave height.
Jmse 12 00449 g009
Figure 10. Correlation analysis between the empirical and numerical results of the wave transmission coefficient (5.0 m ≤ D1 ≤ 12.0 m; 1.0 m ≤ D2 ≤ 2.0 m; 30° ≤ α ≤ 90°; 1.5m ≤ H ≤ 3.5 m; 4.0 s ≤ T ≤ 8.0 s).
Jmse 12 00449 g010
Figure 11. Effects of main factors on the mooring chain forces: (a) wind speed, (b) current velocity, (c) incident wave period, (d) incident wave height, and (e) water depth.
Jmse 12 00449 g011
Figure 12. Correlation analysis between empirical and numerical results of the maximum total mooring force.
Jmse 12 00449 g012
Table 1. Comparisons of transmission coefficients in various types of floating breakwaters.
Floating Breakwater TypeReferenced/LH/LB/LKt
Two pontoon typesIkeno et al. (1988) [27]0.330.020.190.68
Single-box typeIkeno et al. (1988) [27]0.330.020.190.88
Y-frame without pipeMani (2014) [30]0.160.010.170.92
Y-frame with pipeMani (2014) [30]0.460.100.170.46
Cage typeMurali & Mani (1997) [28]0.460.100.190.50
Box type with steel truss Uzaki et al. (2011) [29]0.140.030.210.91
Porous breakwaterJi et al. (2016) [21]0.380.060.190.86
Mesh cage breakwaterJi et al. (2016) [21]0.380.060.190.88
Single-box typePresent study0.890.060.160.86
Multi-buoy typePresent study0.890.060.170.66
Disclaimer/Publisher’s Note: The statements, opinions and data contained in all publications are solely those of the individual author(s) and contributor(s) and not of MDPI and/or the editor(s). MDPI and/or the editor(s) disclaim responsibility for any injury to people or property resulting from any ideas, methods, instructions or products referred to in the content.

