
Study of a Center Pipe Oscillating Column Wave Energy Converter Combined with a Triboelectric Nanogenerator Device
 , and
, and
Abstract
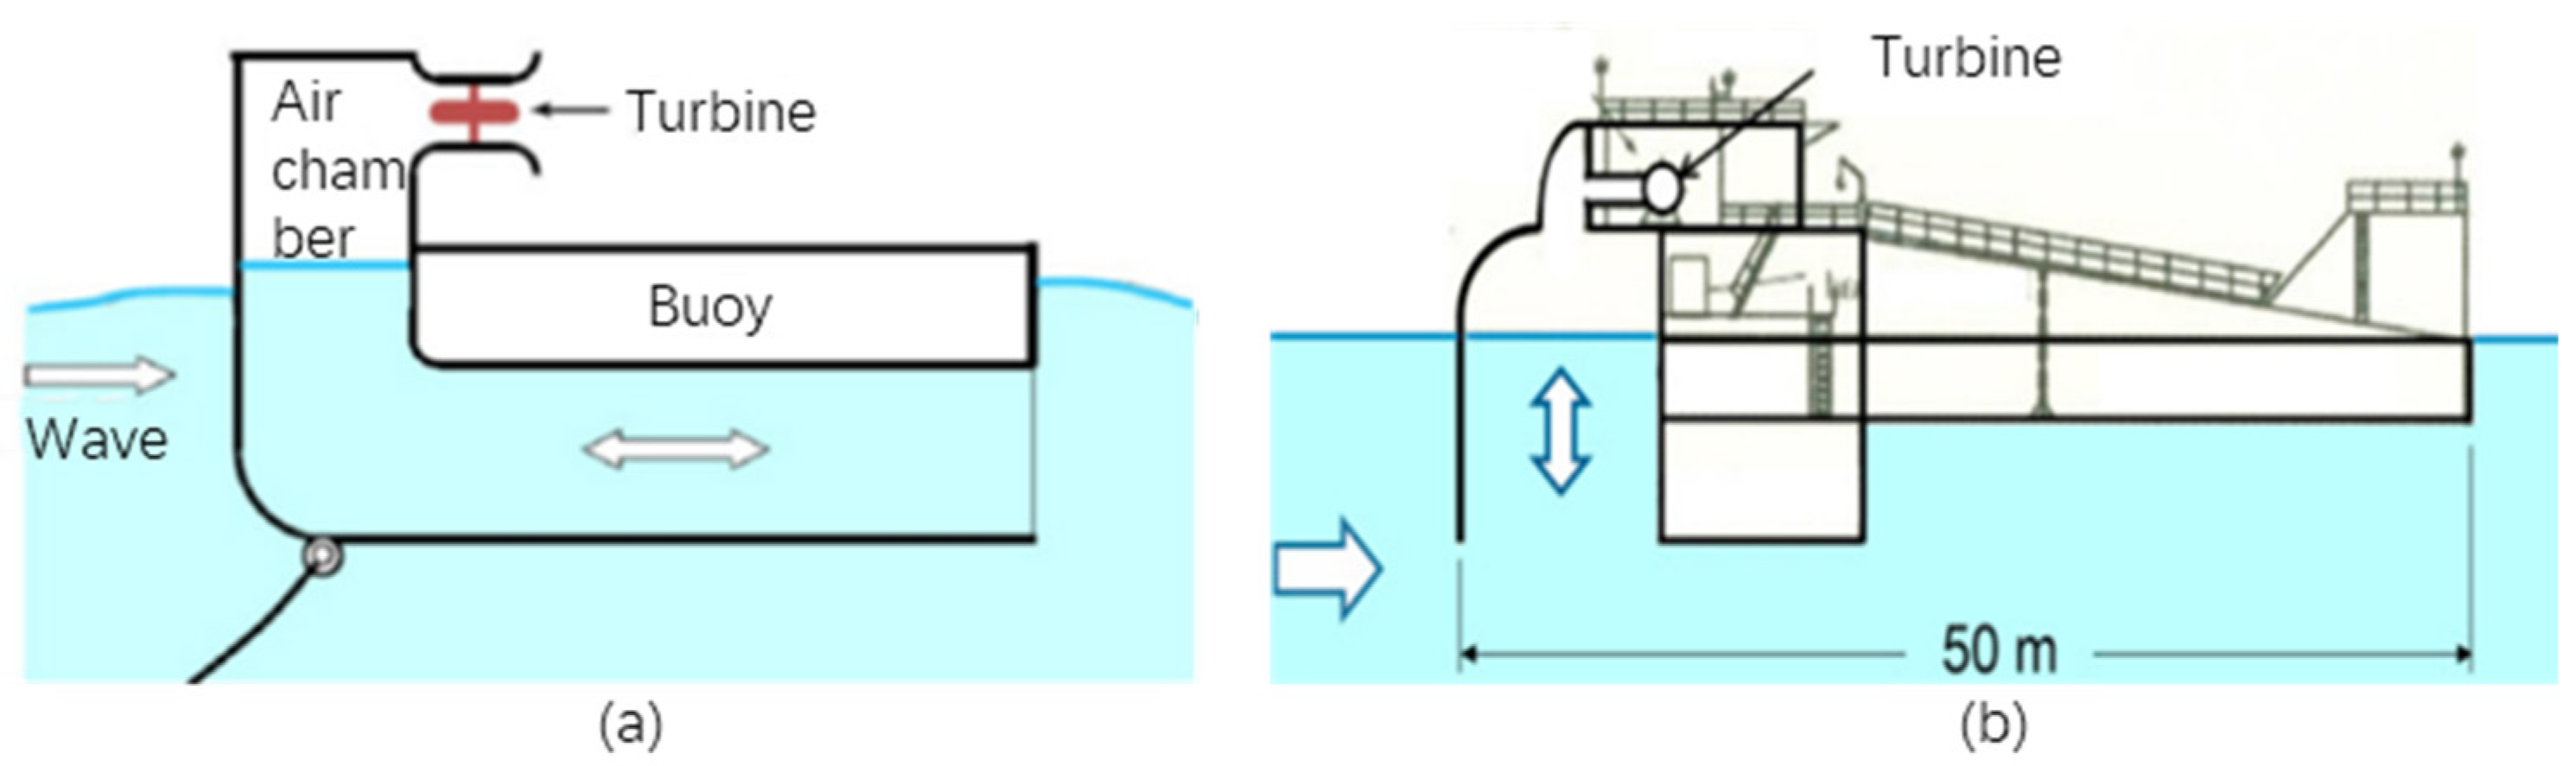
:1. Introduction
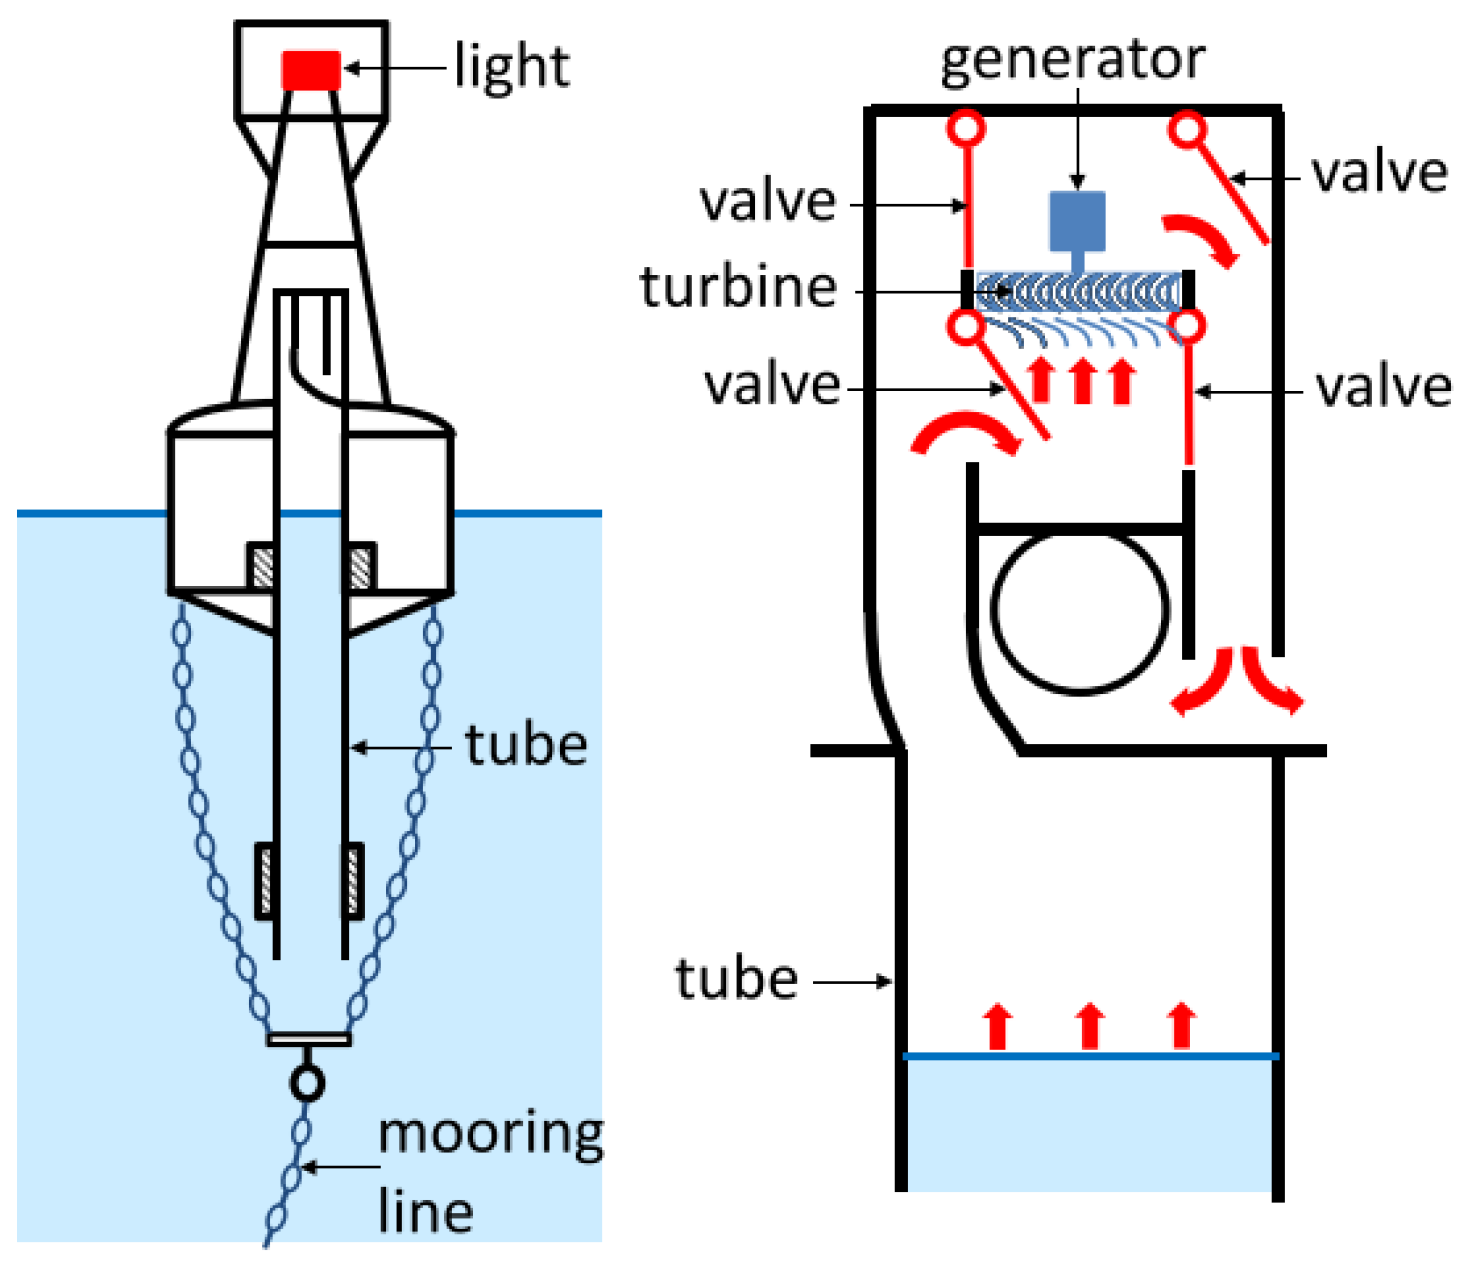
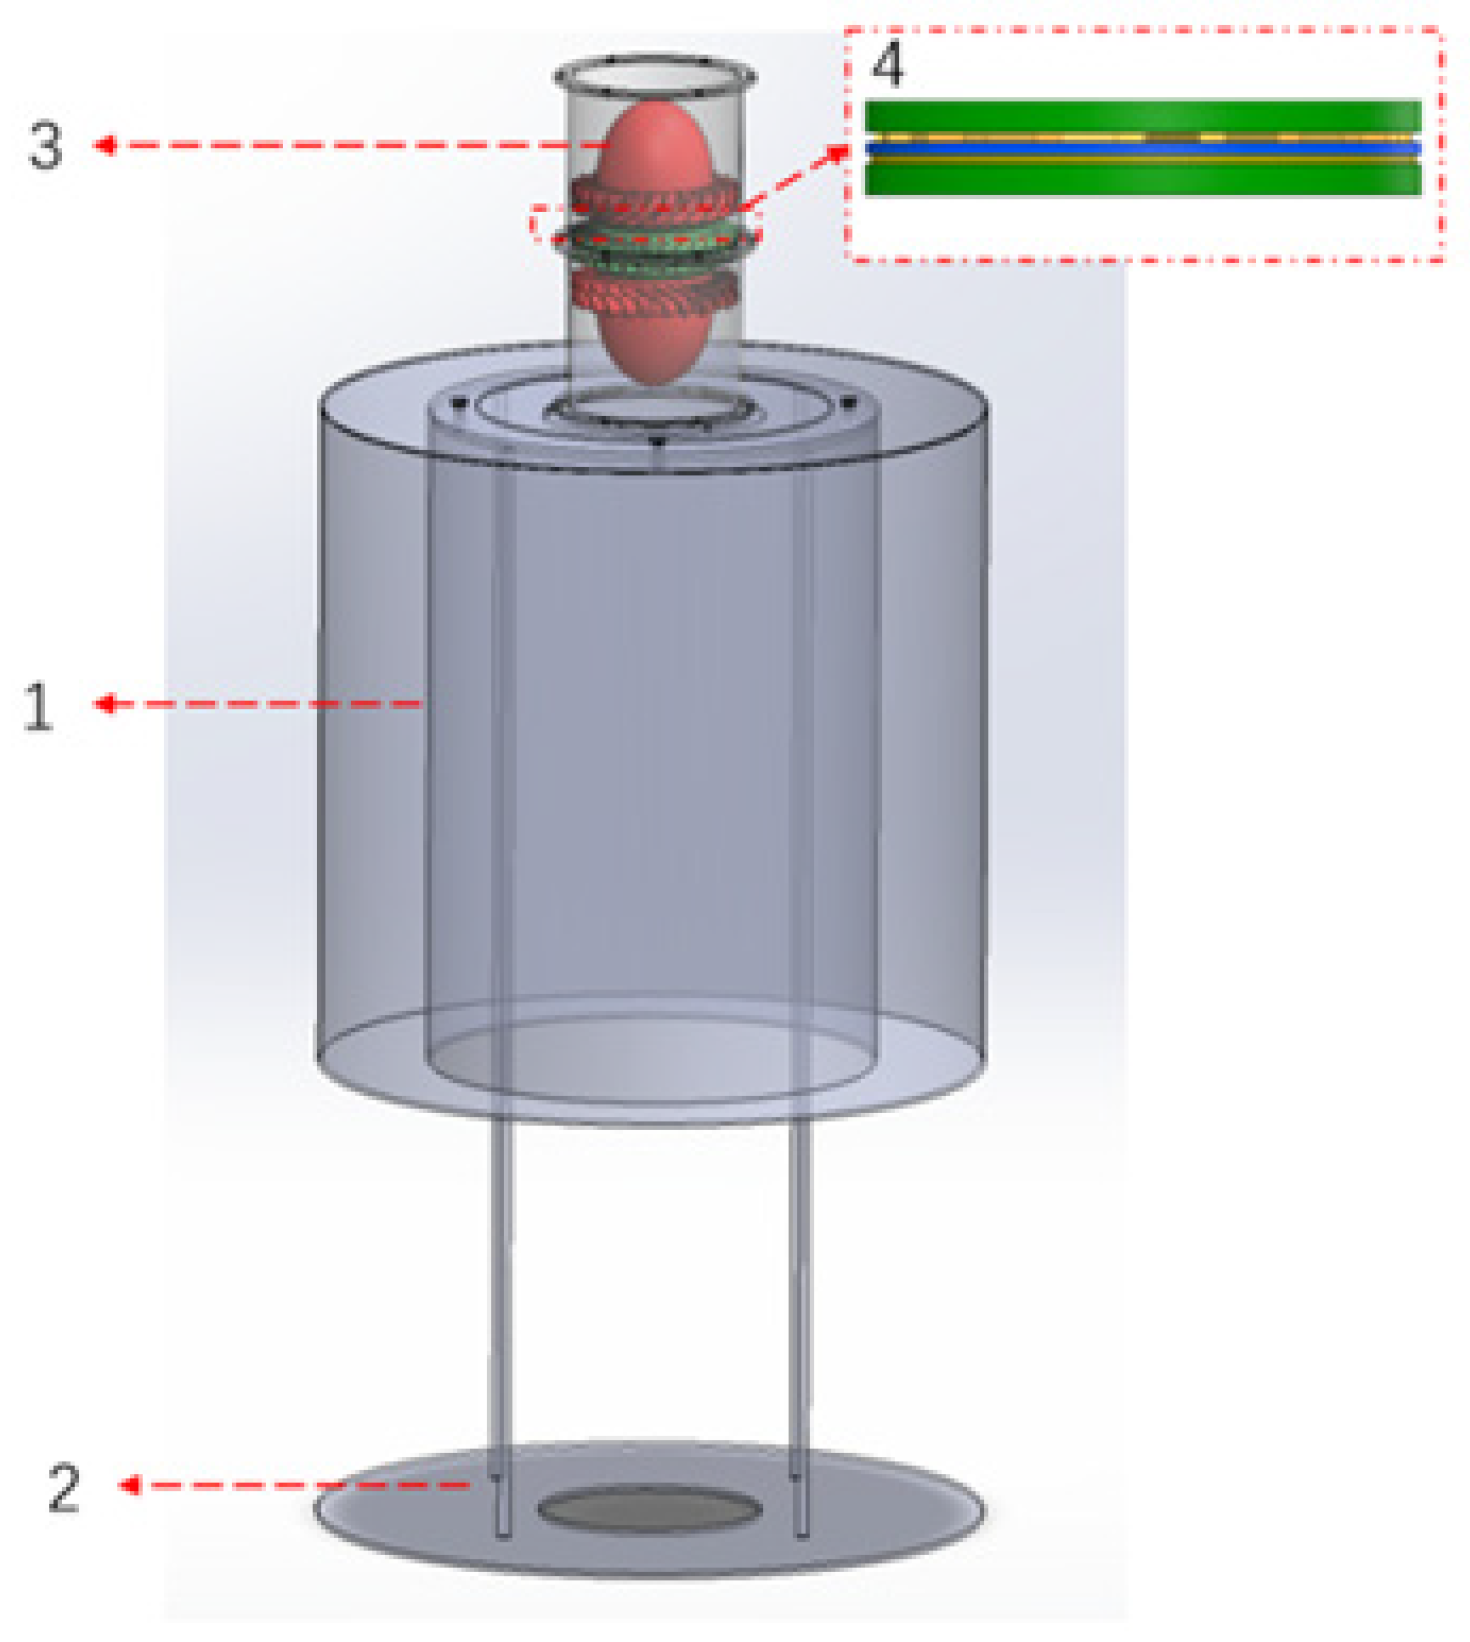
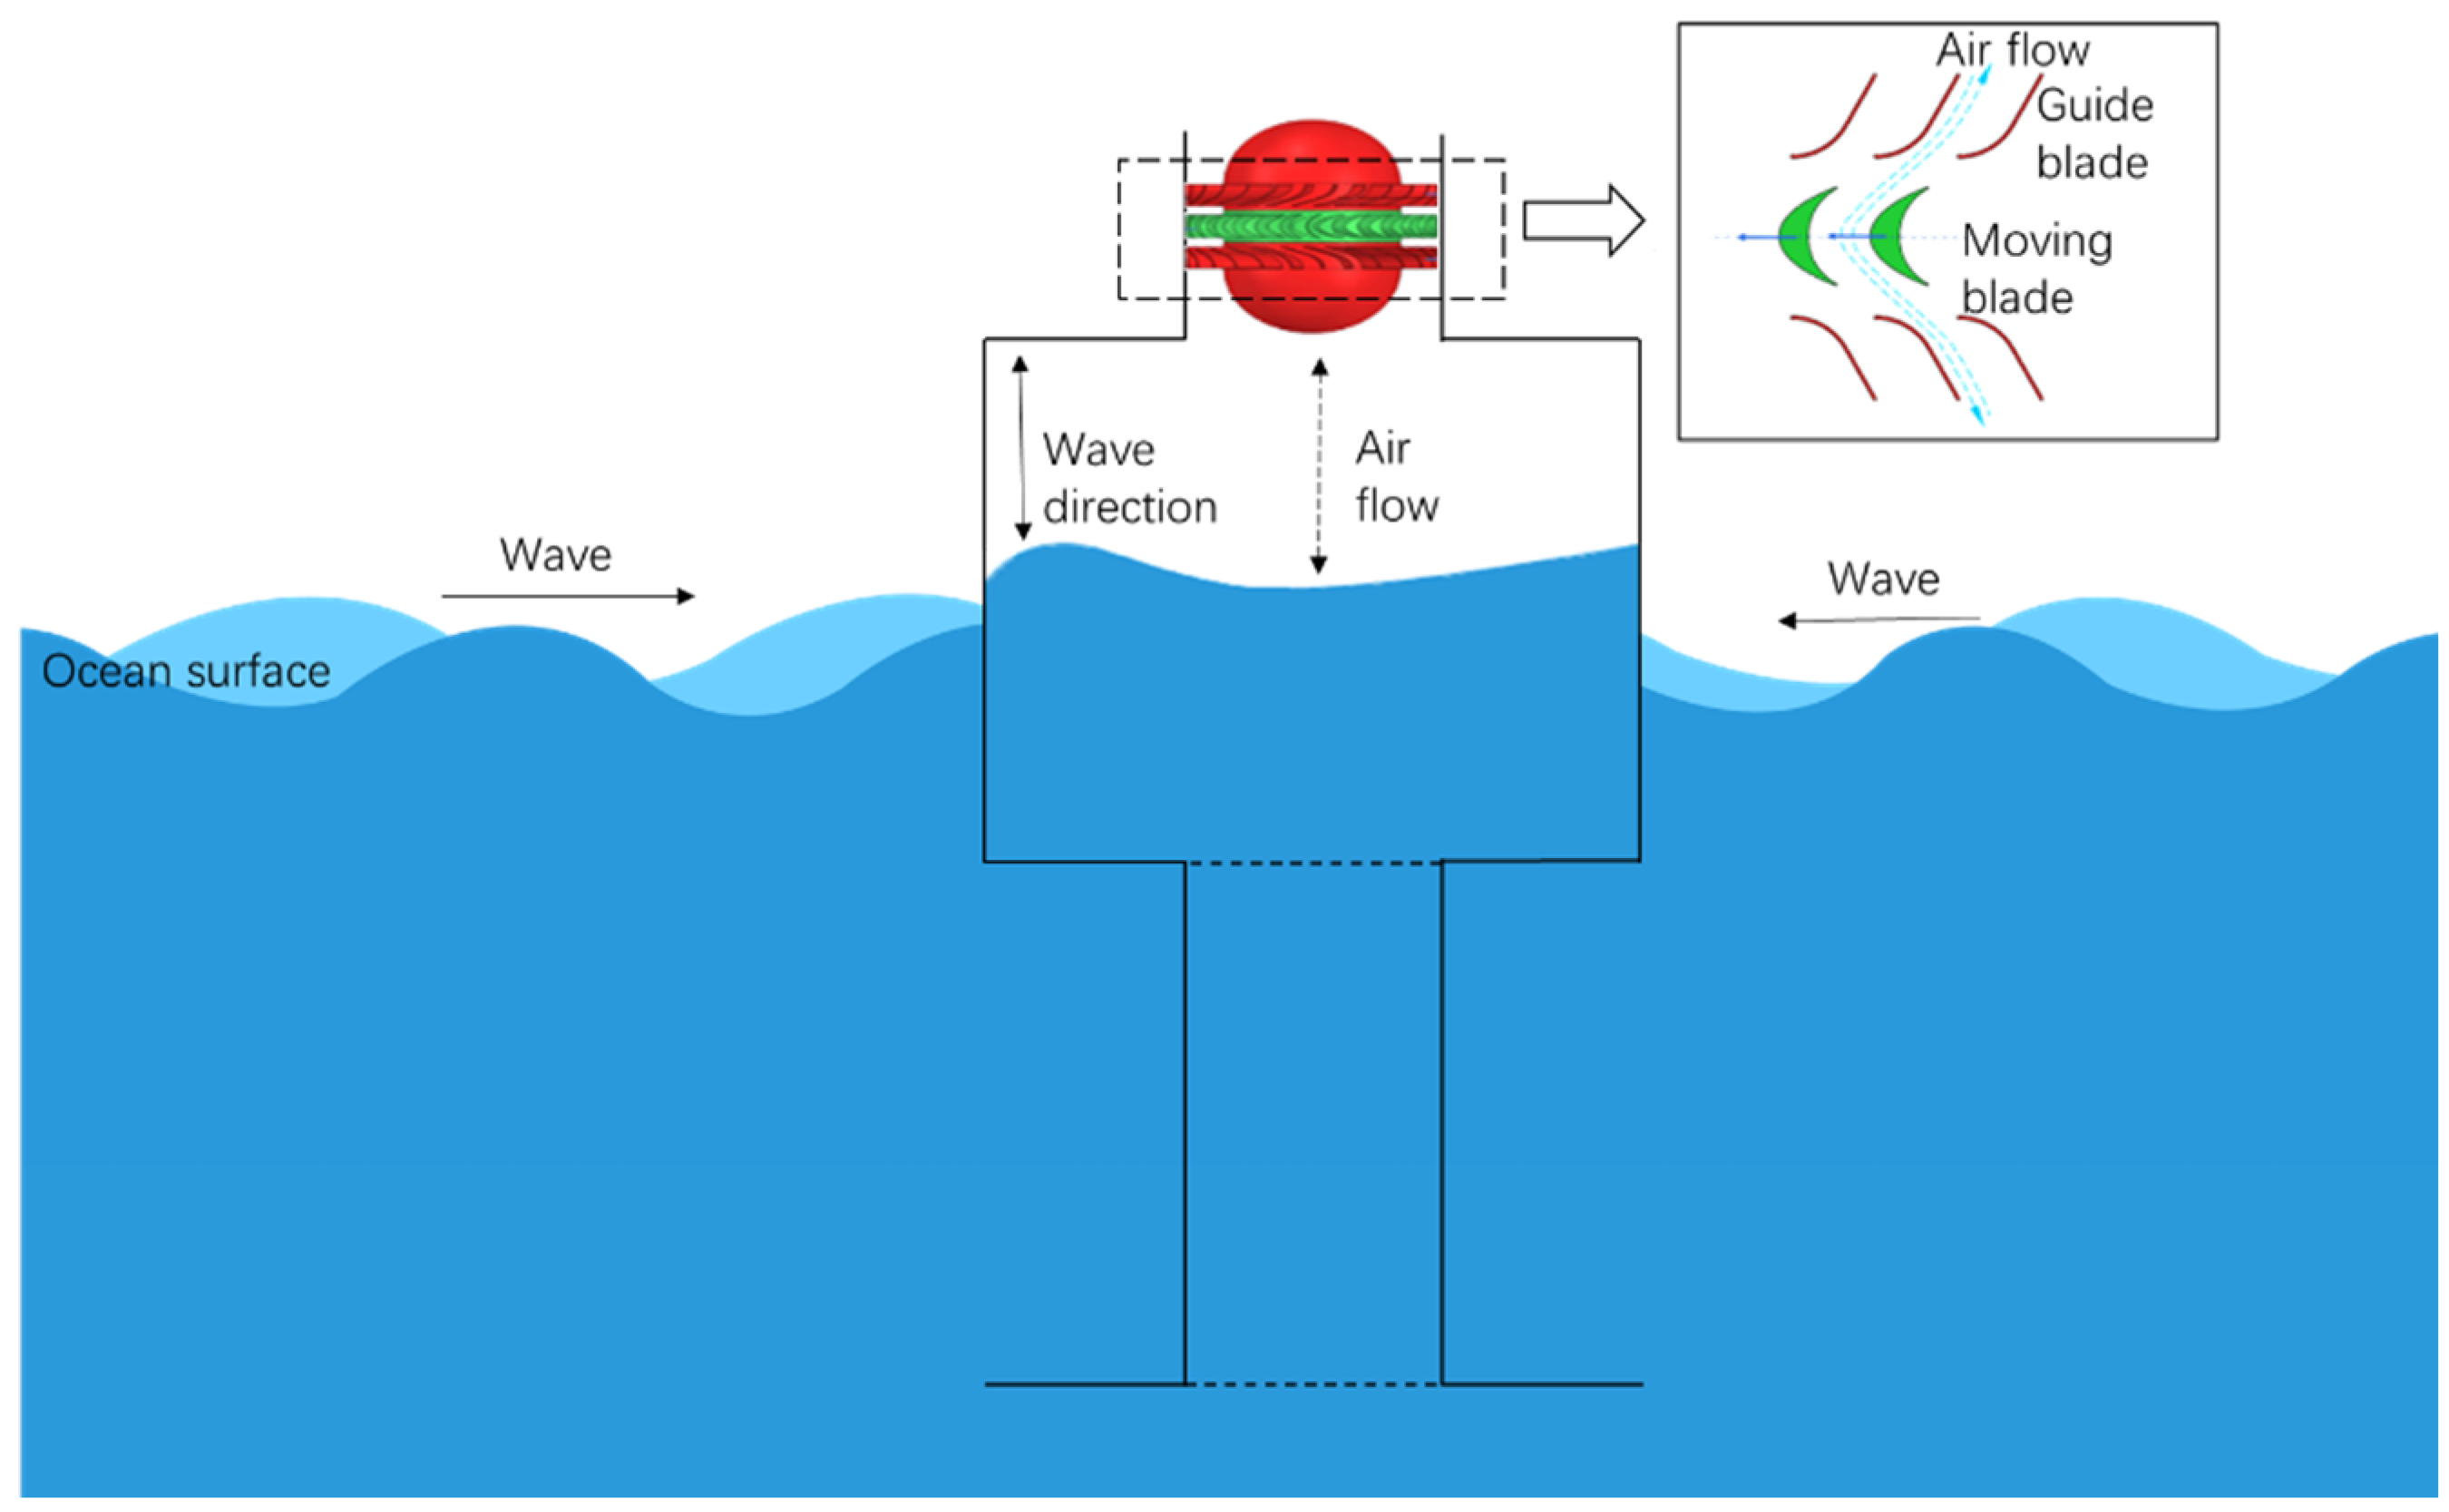
2. Overall Structure Design of the CP-TENG
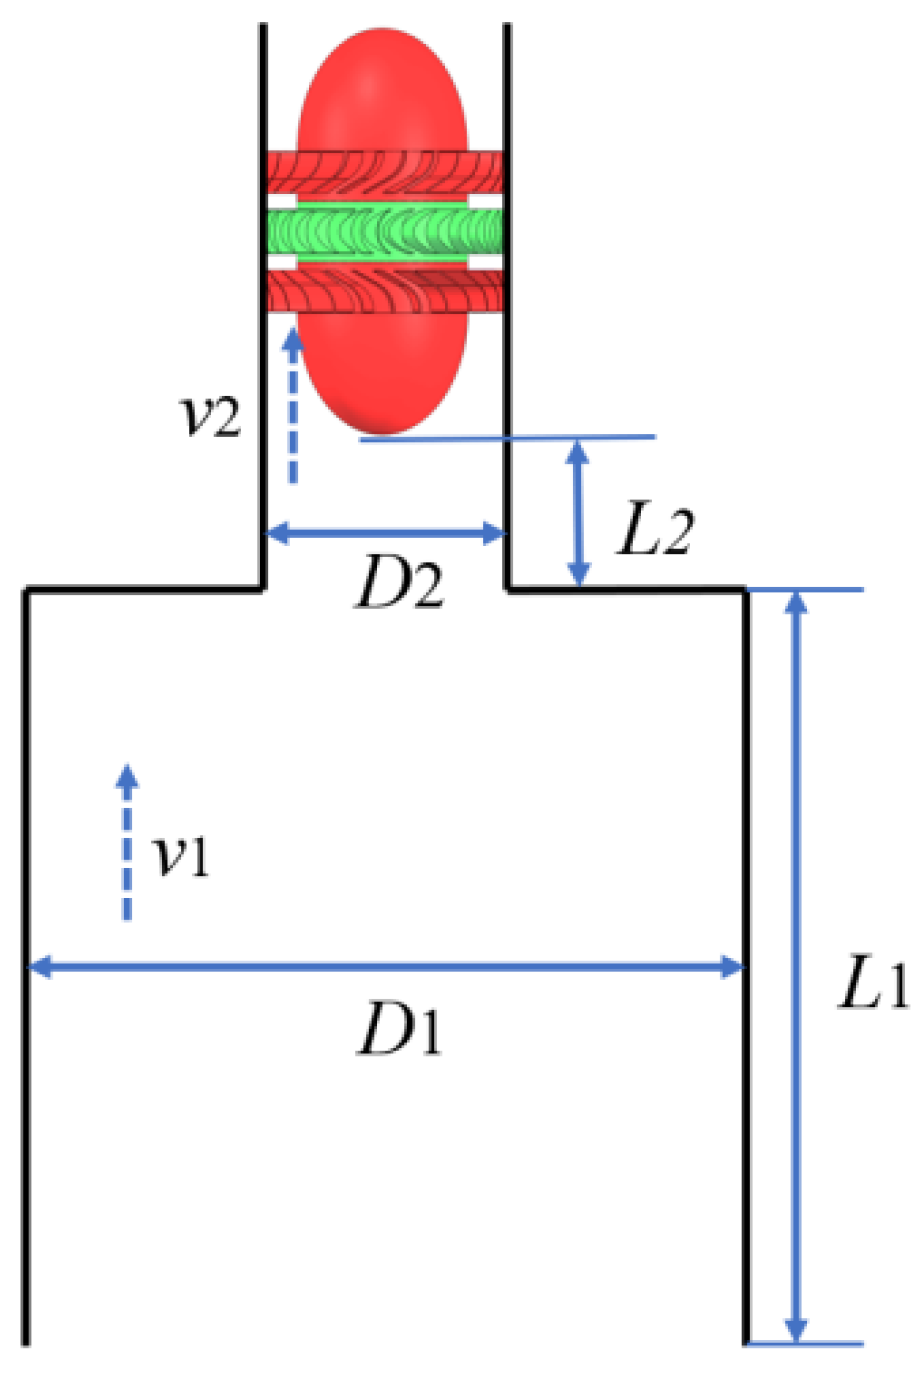
3. Hydrodynamics Principle of Floating Body
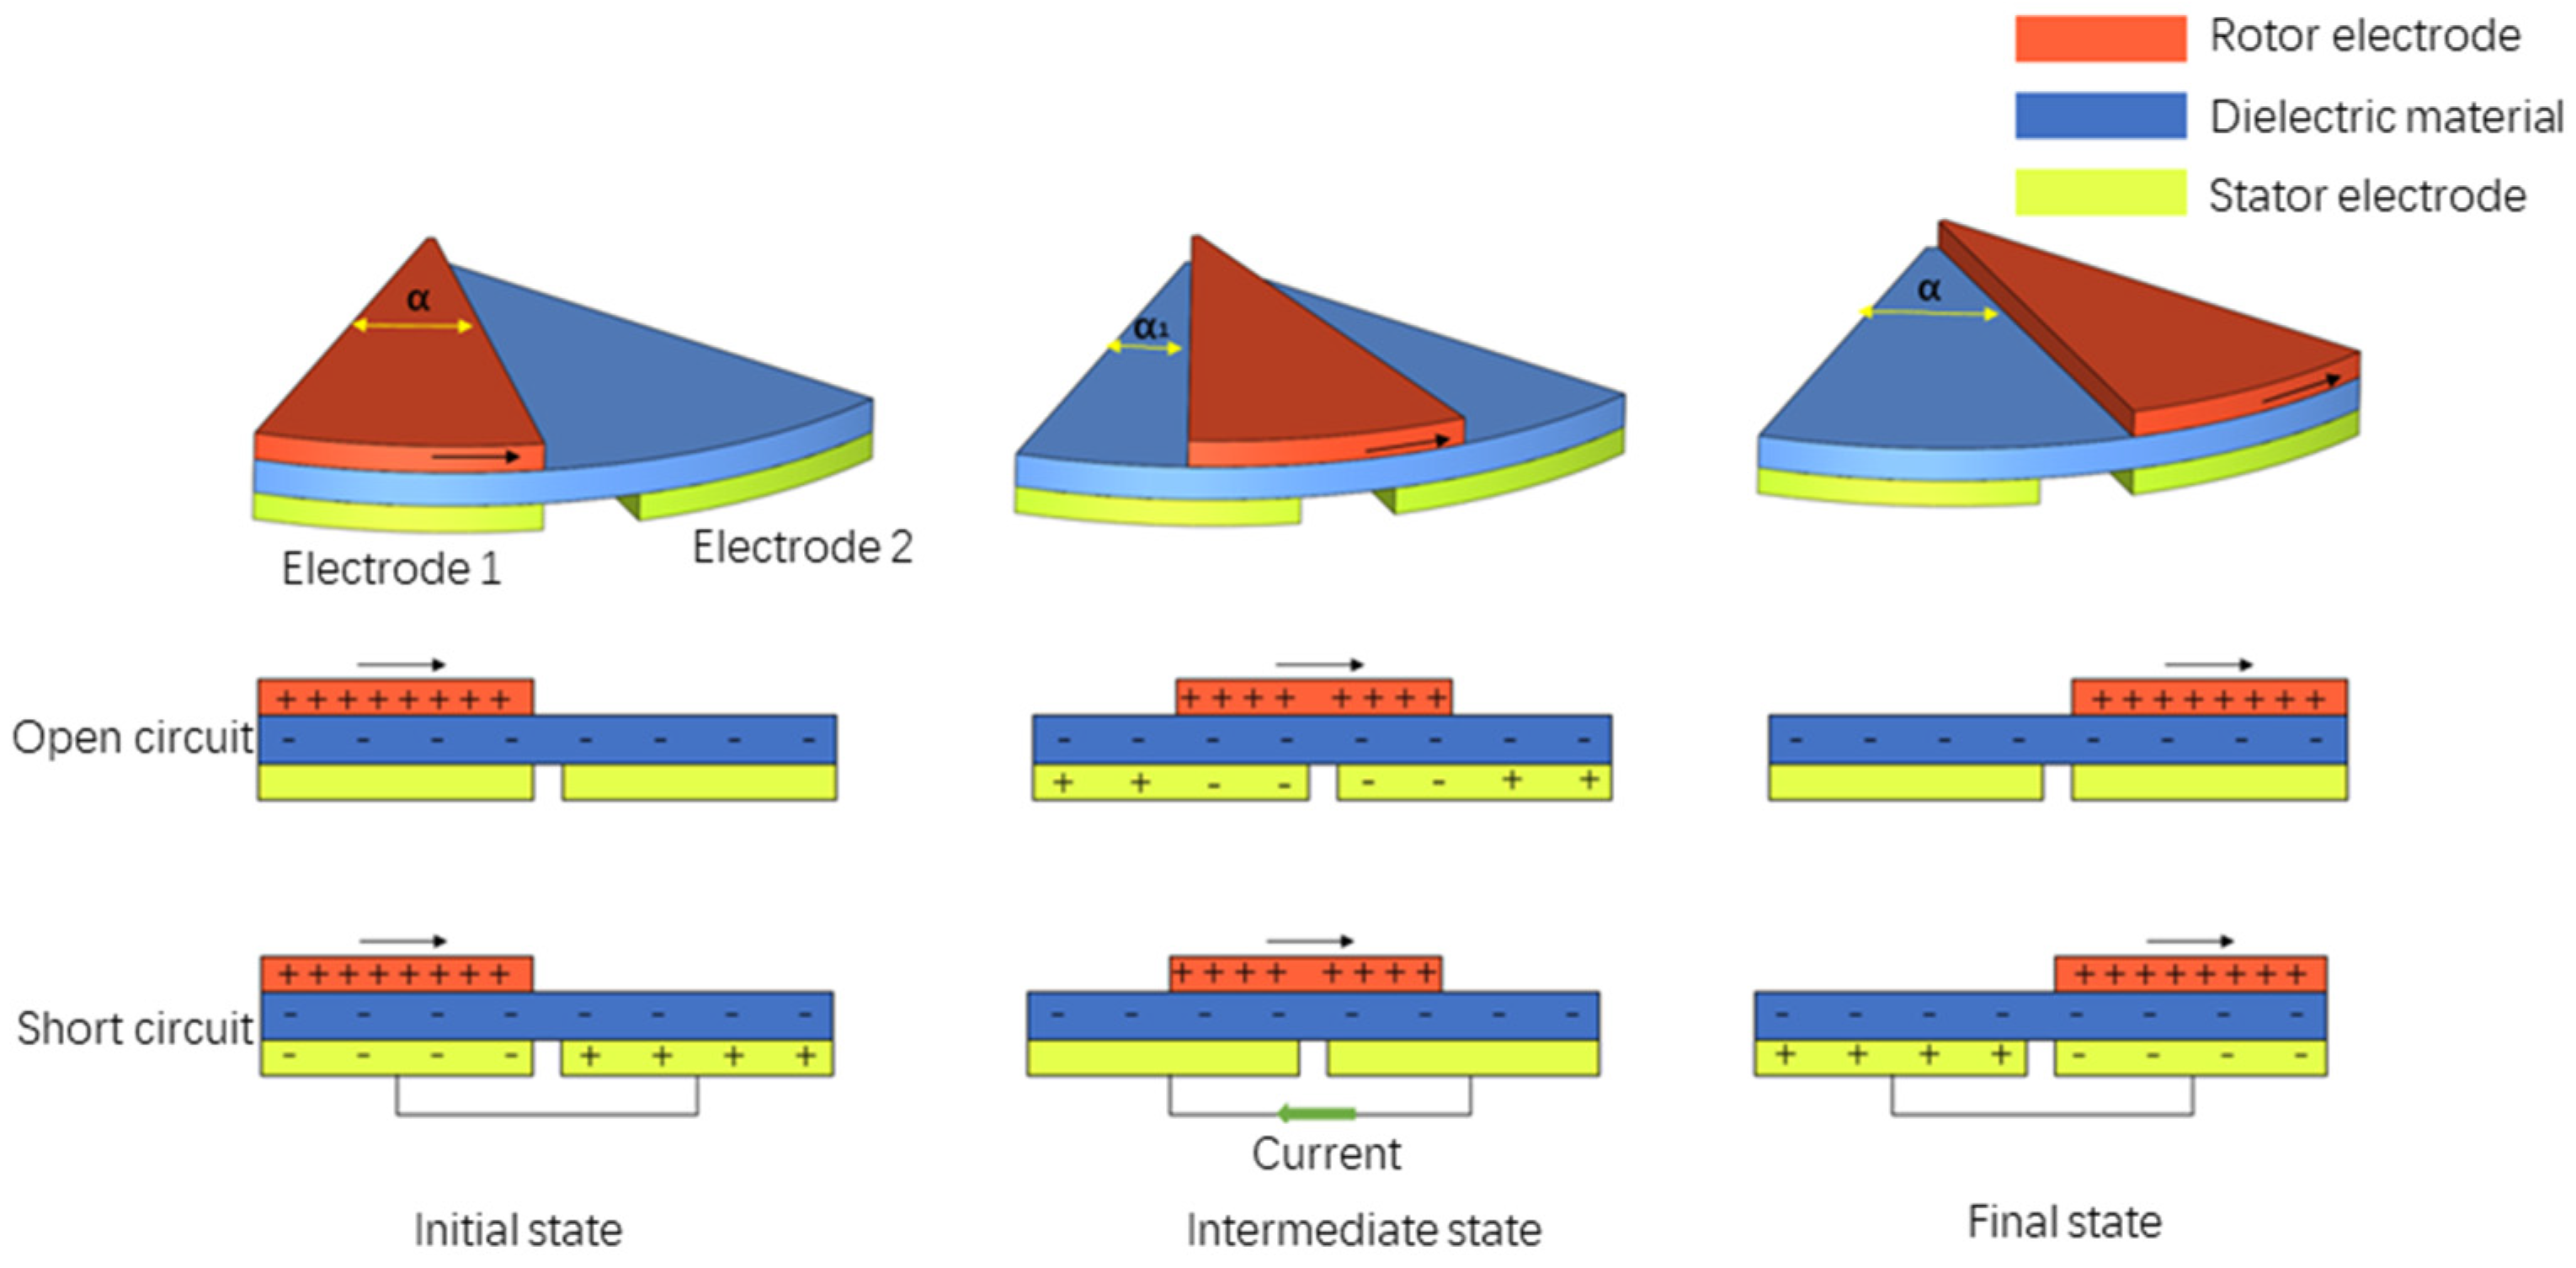
4. Power Generation Principle of Triboelectric Nanogenerator
5. Analysis of Hydrodynamic Characteristics for Model Selection of OWC
5.1. Influence of the Bottom Shape of the Main Floating Body on the Hydrodynamic Force of the Device
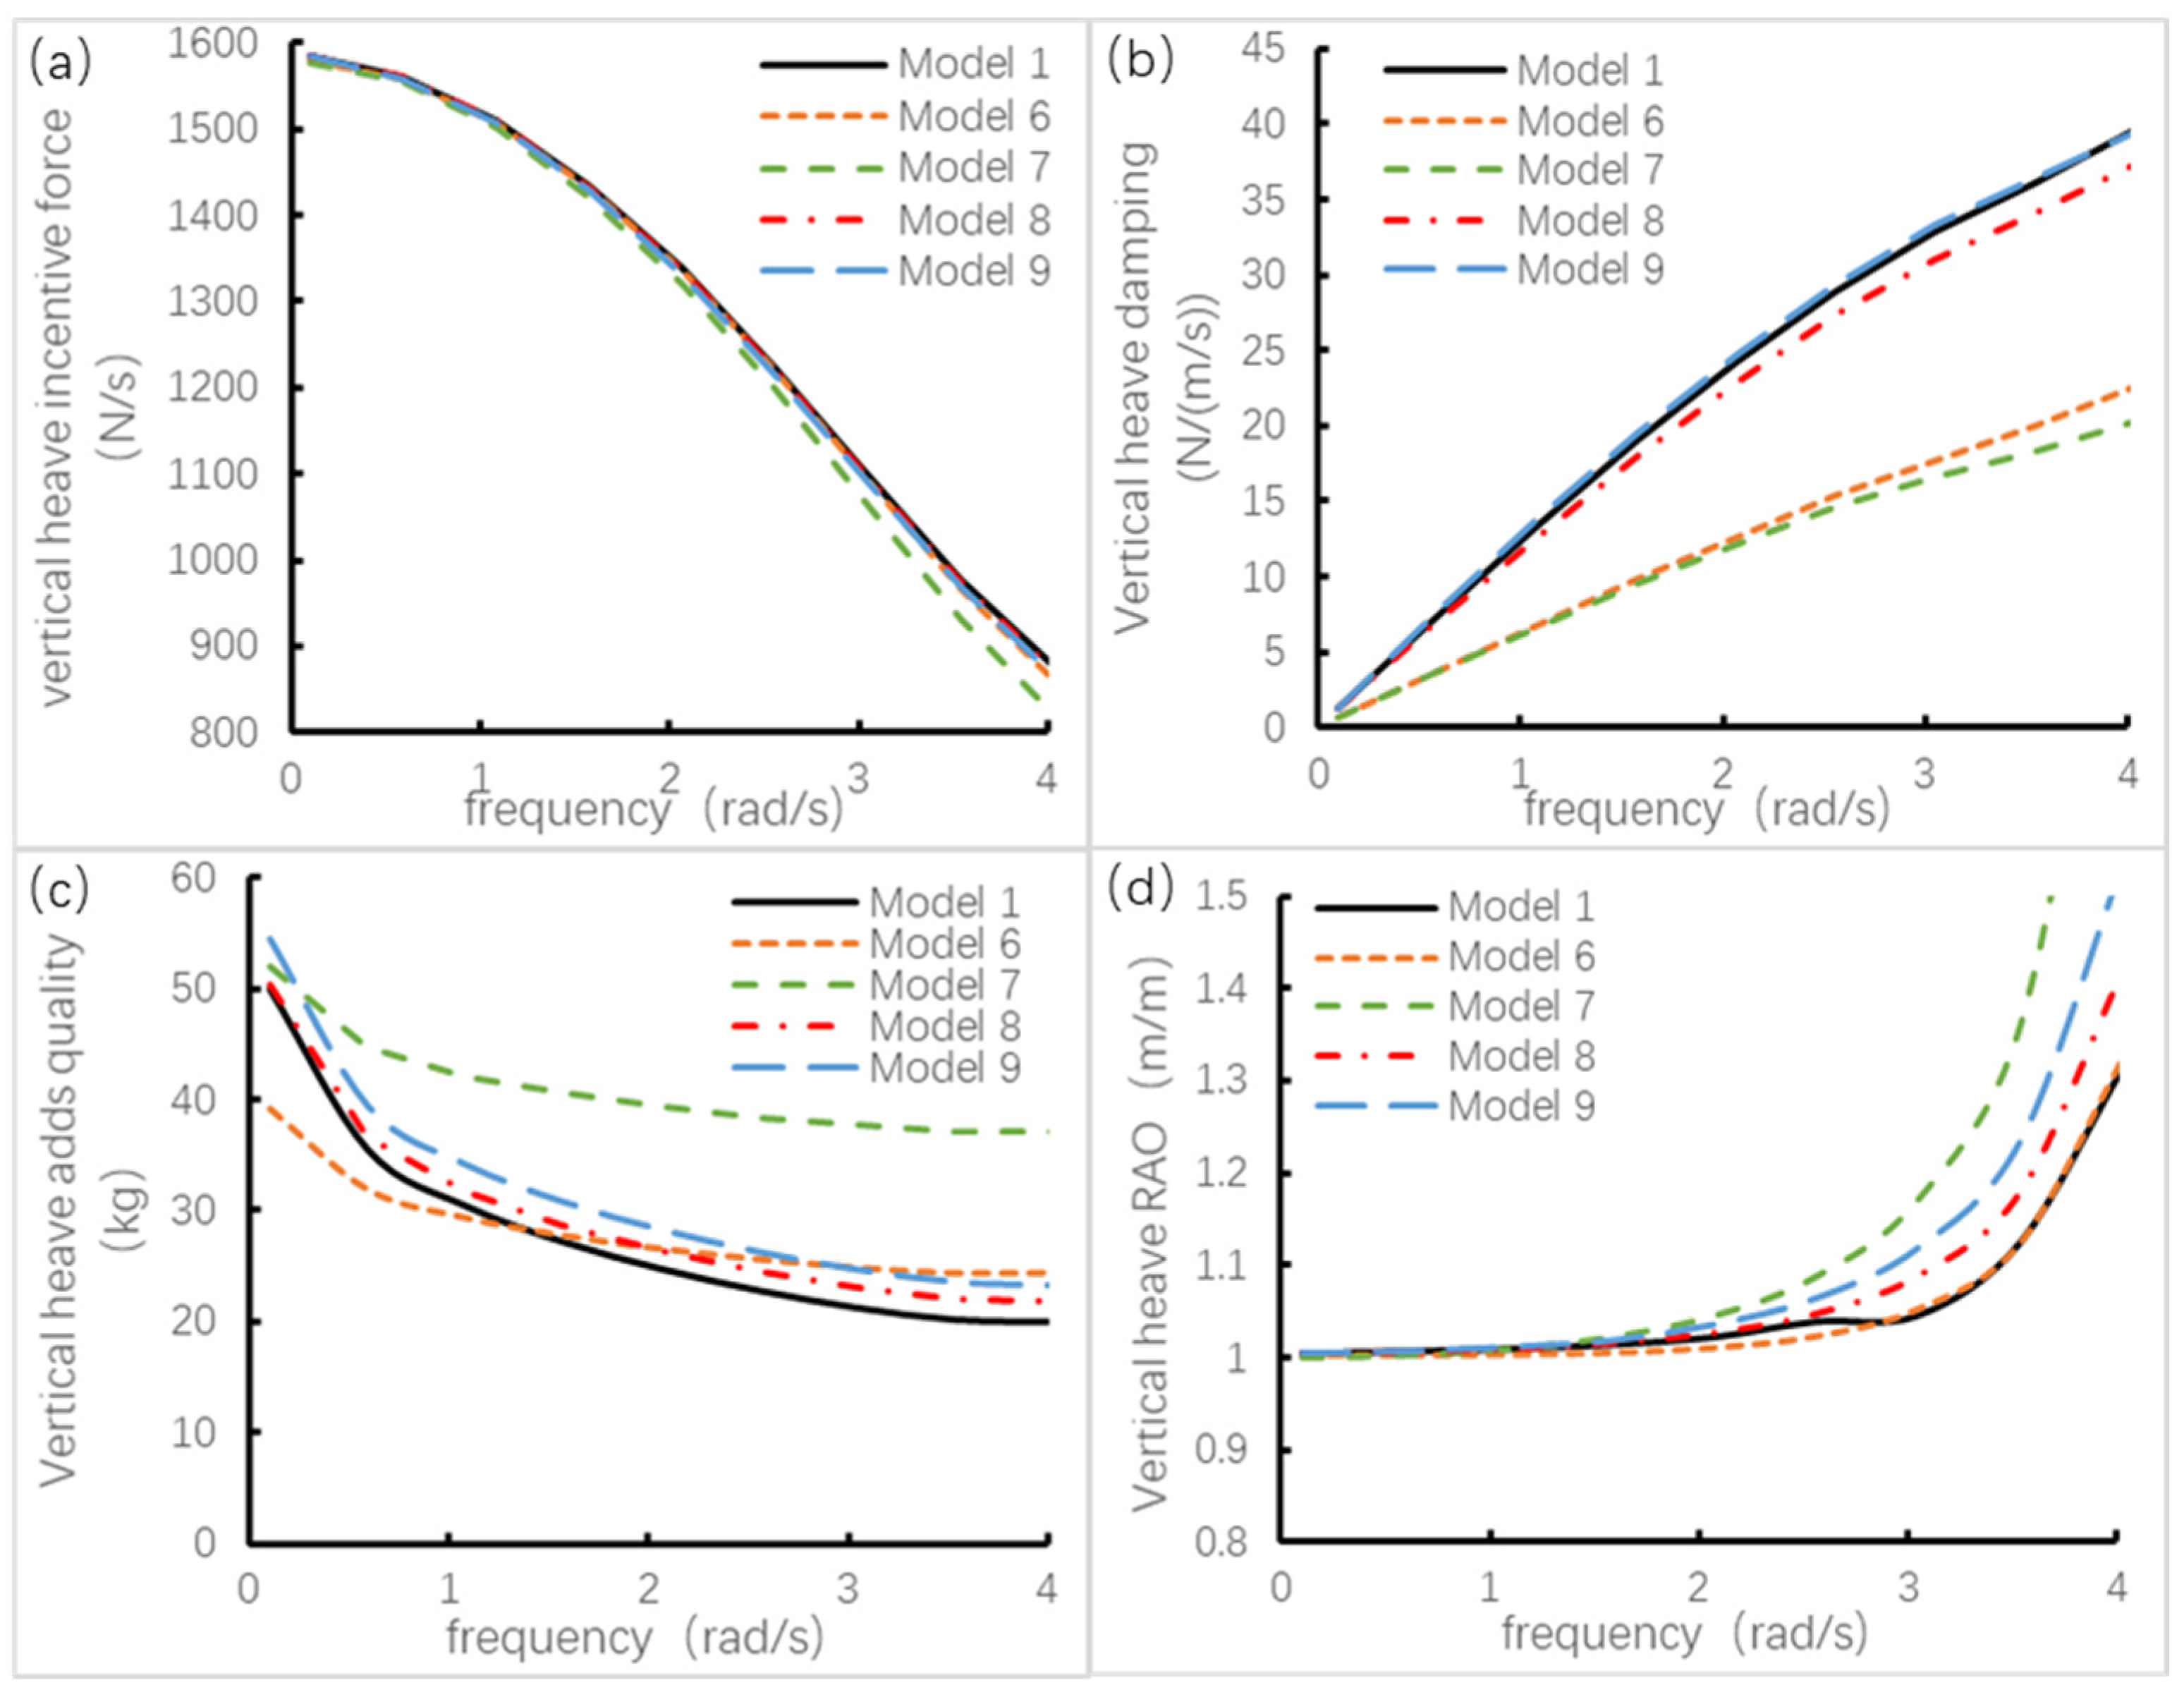
5.2. Influence of the Width of the Heave Plate on the Hydrodynamic Force of the Device
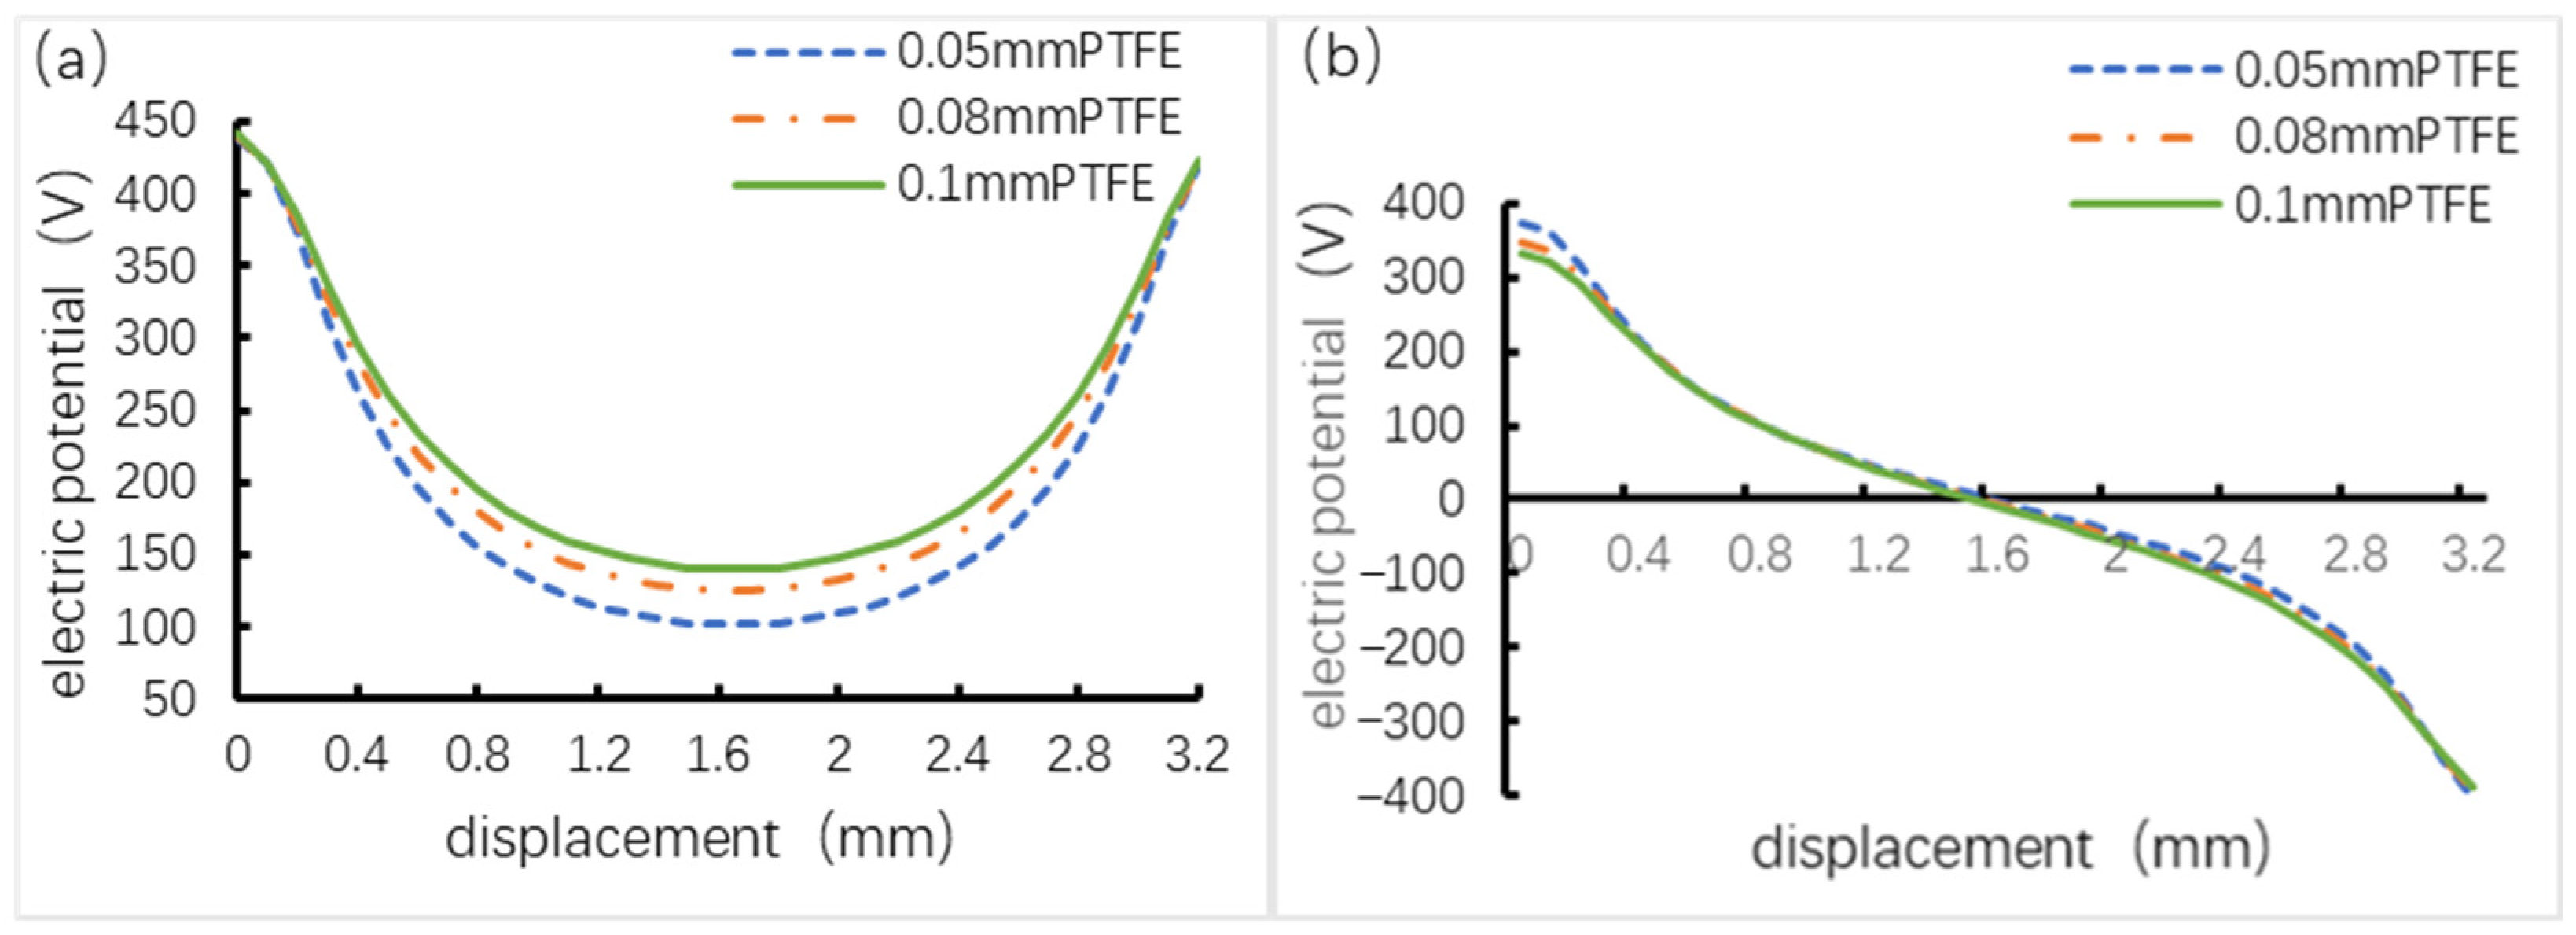
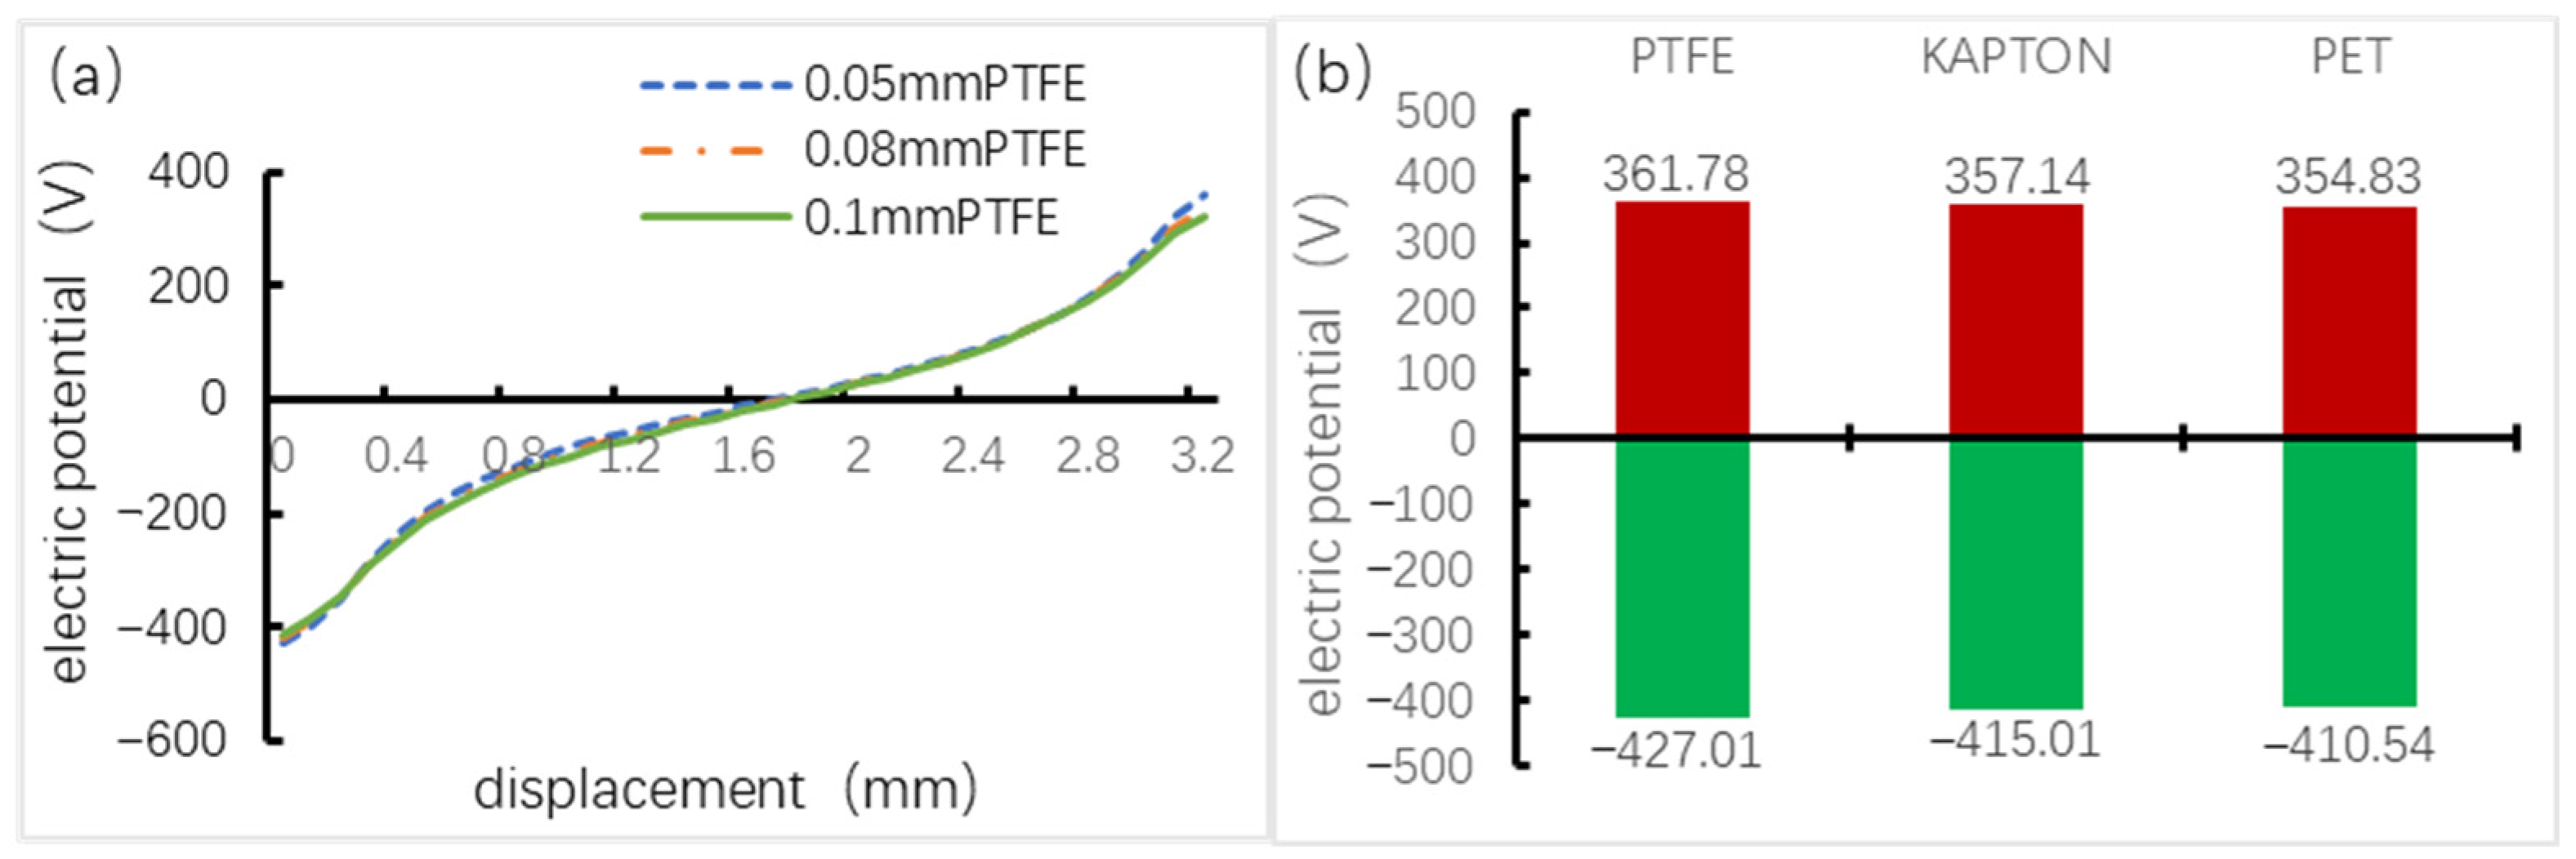
6. Electric Field Simulation Analysis for Material Selection of TENG
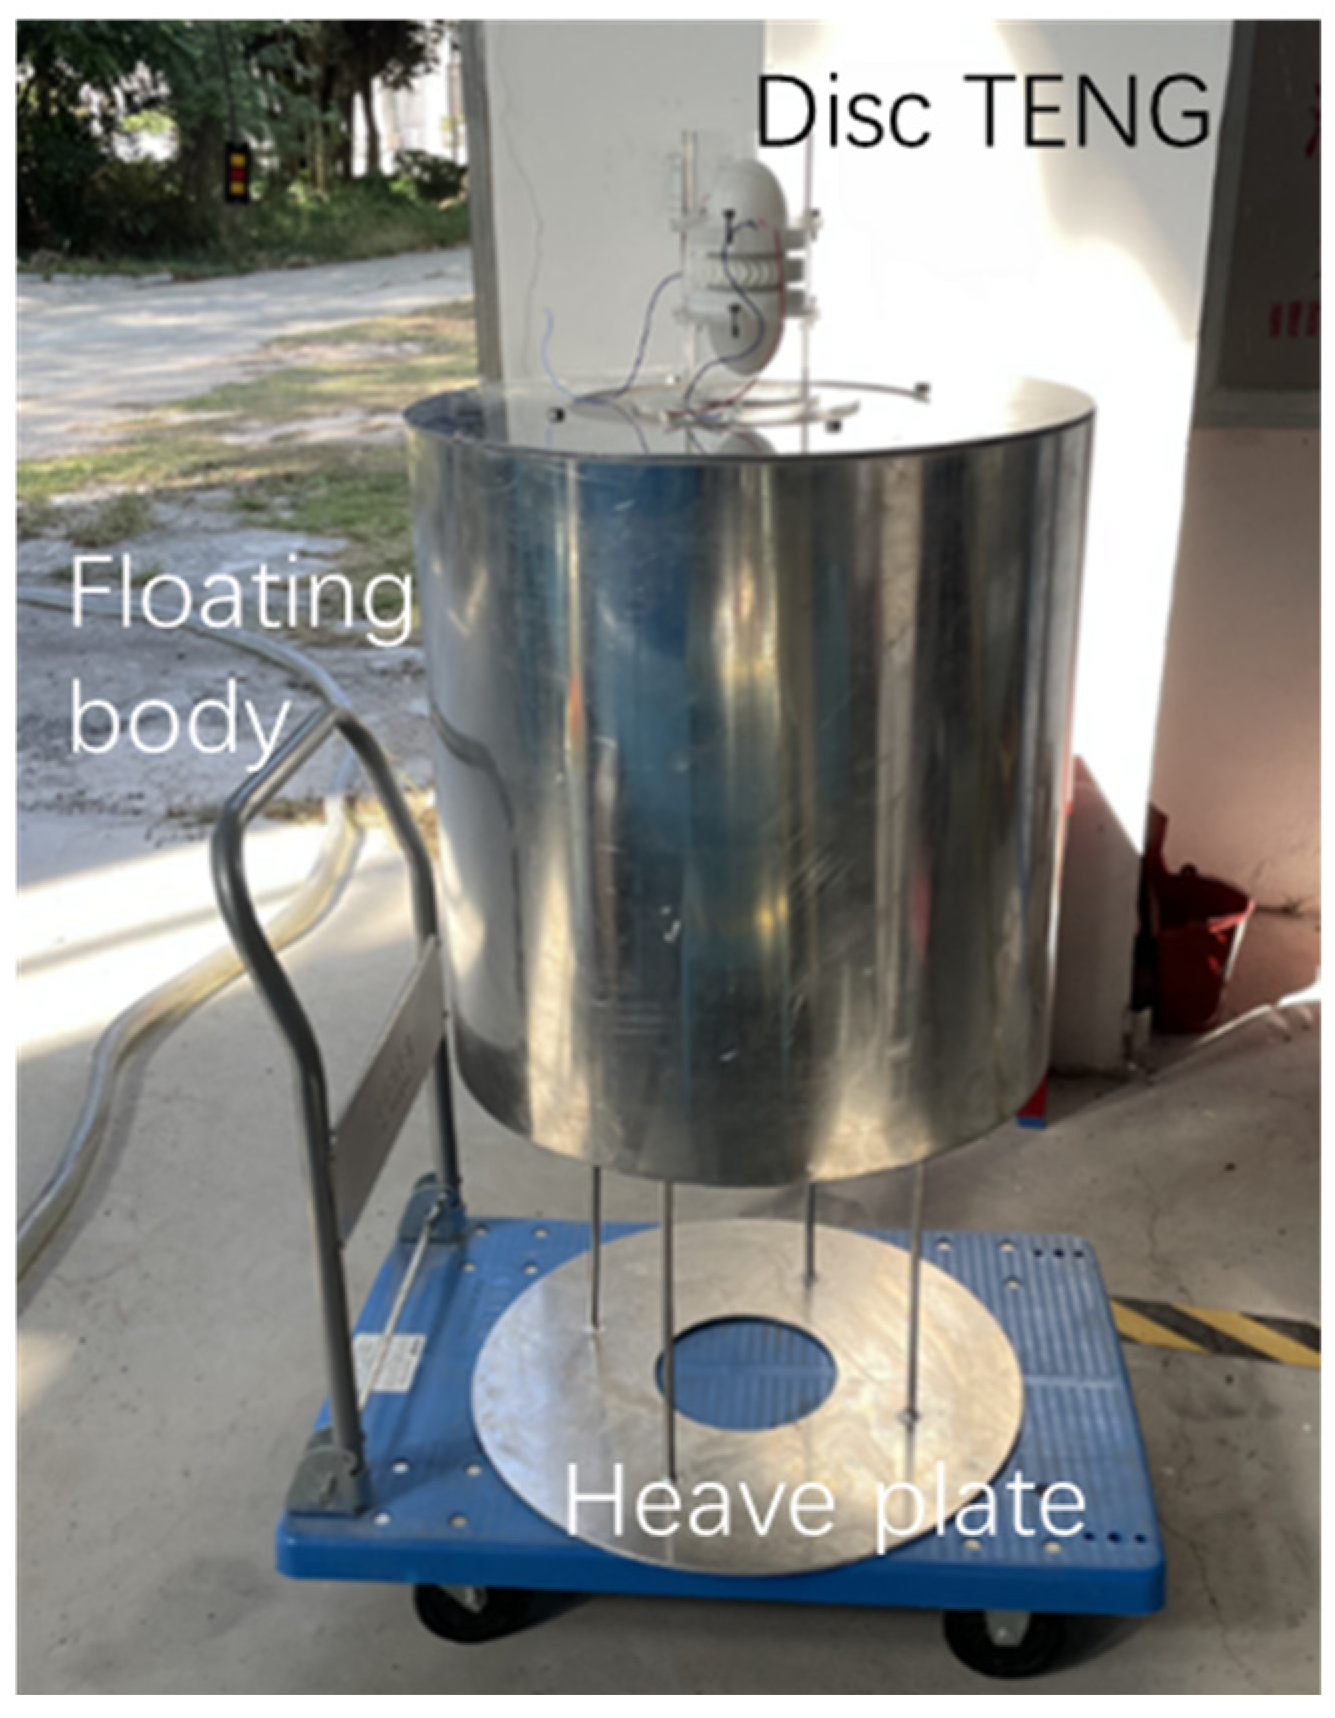
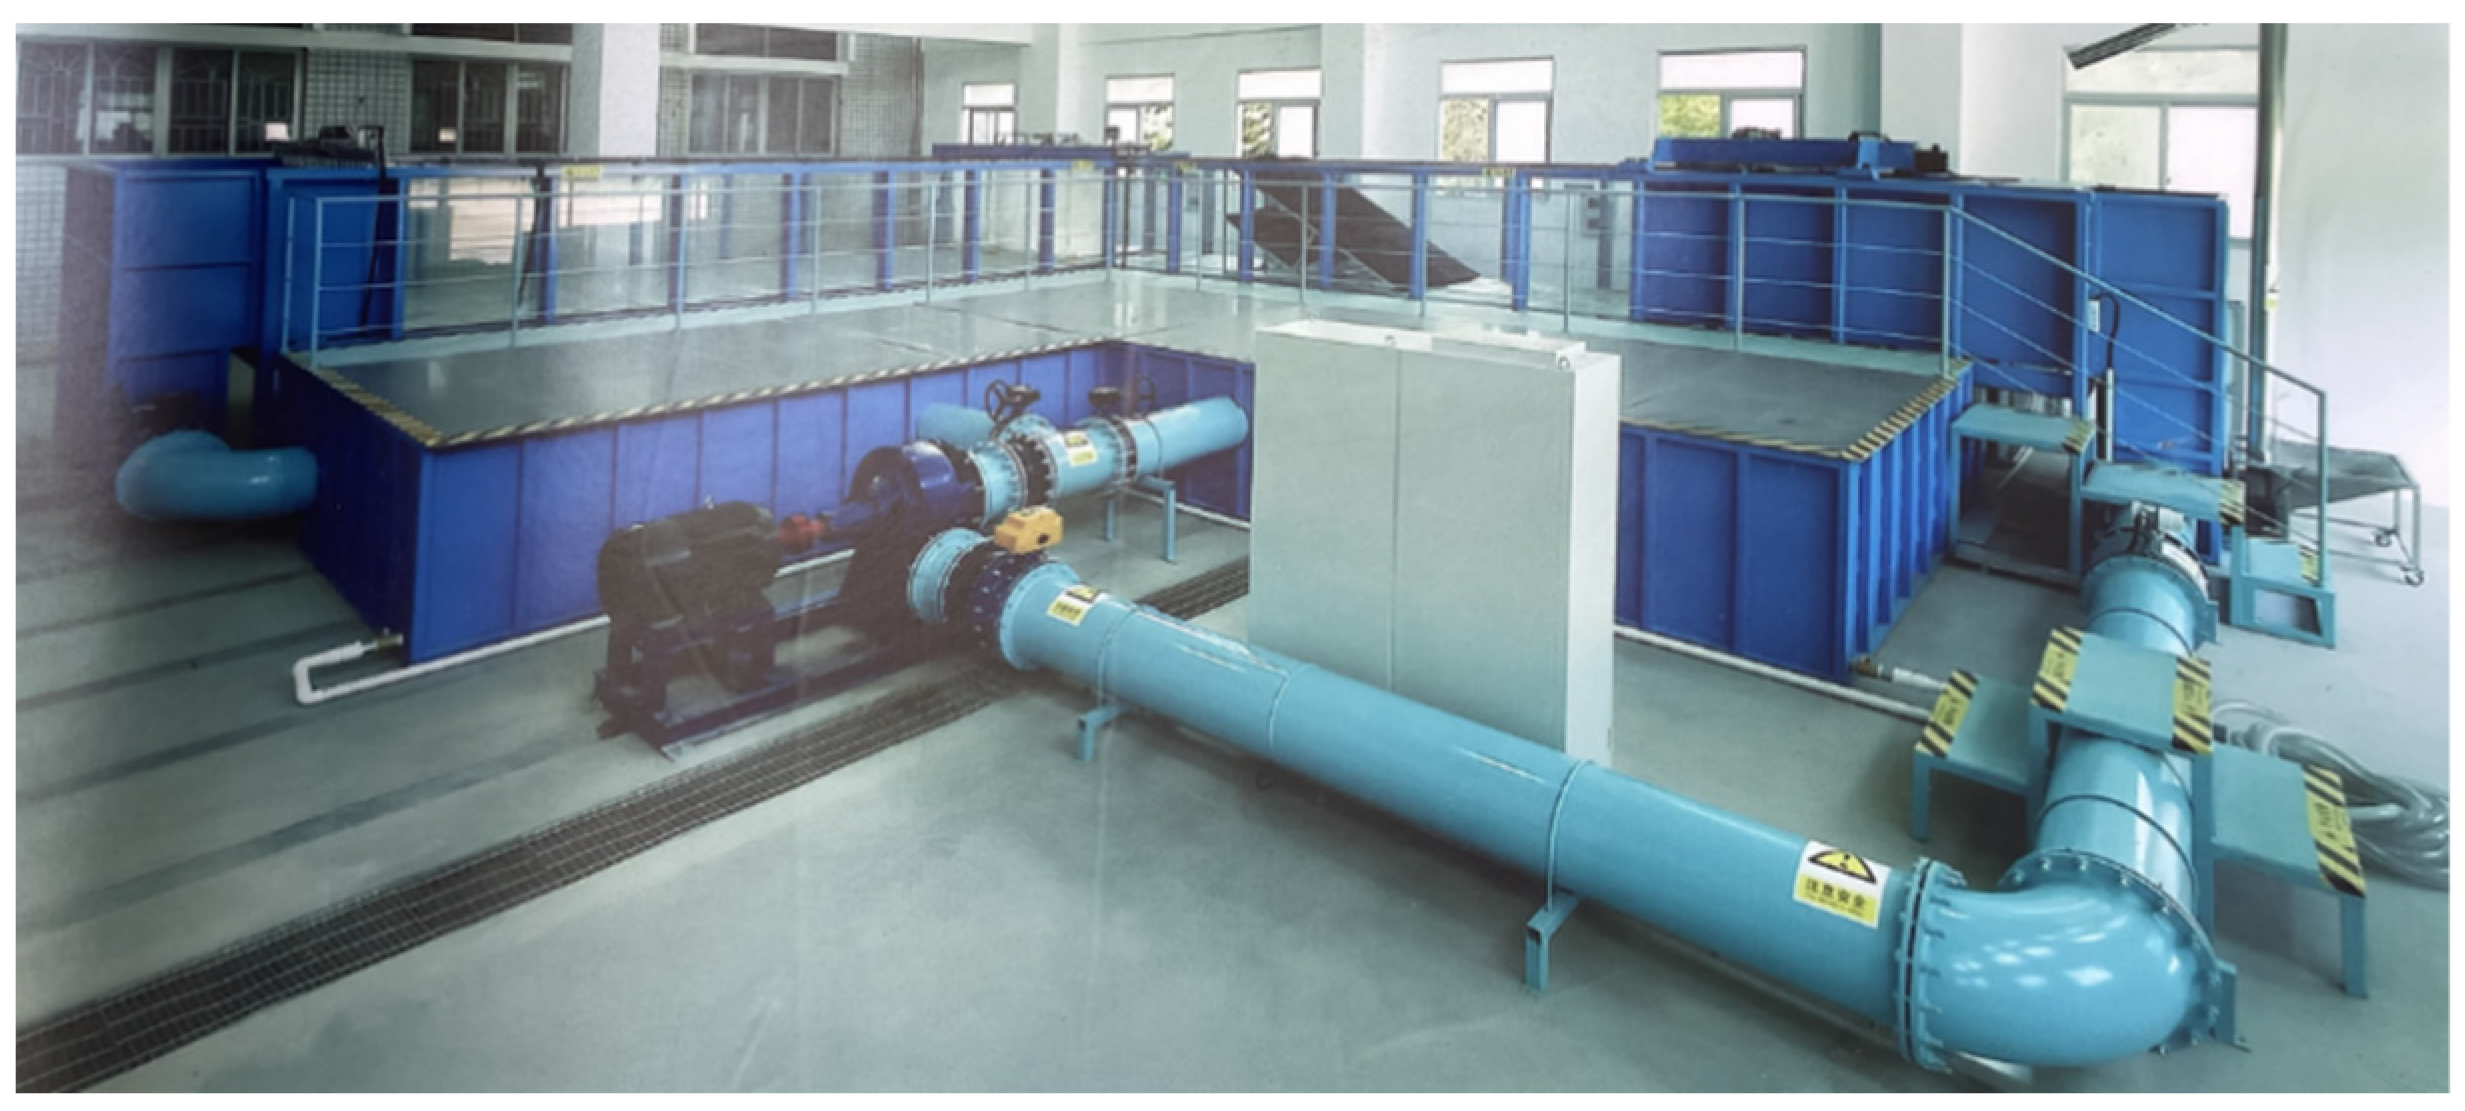
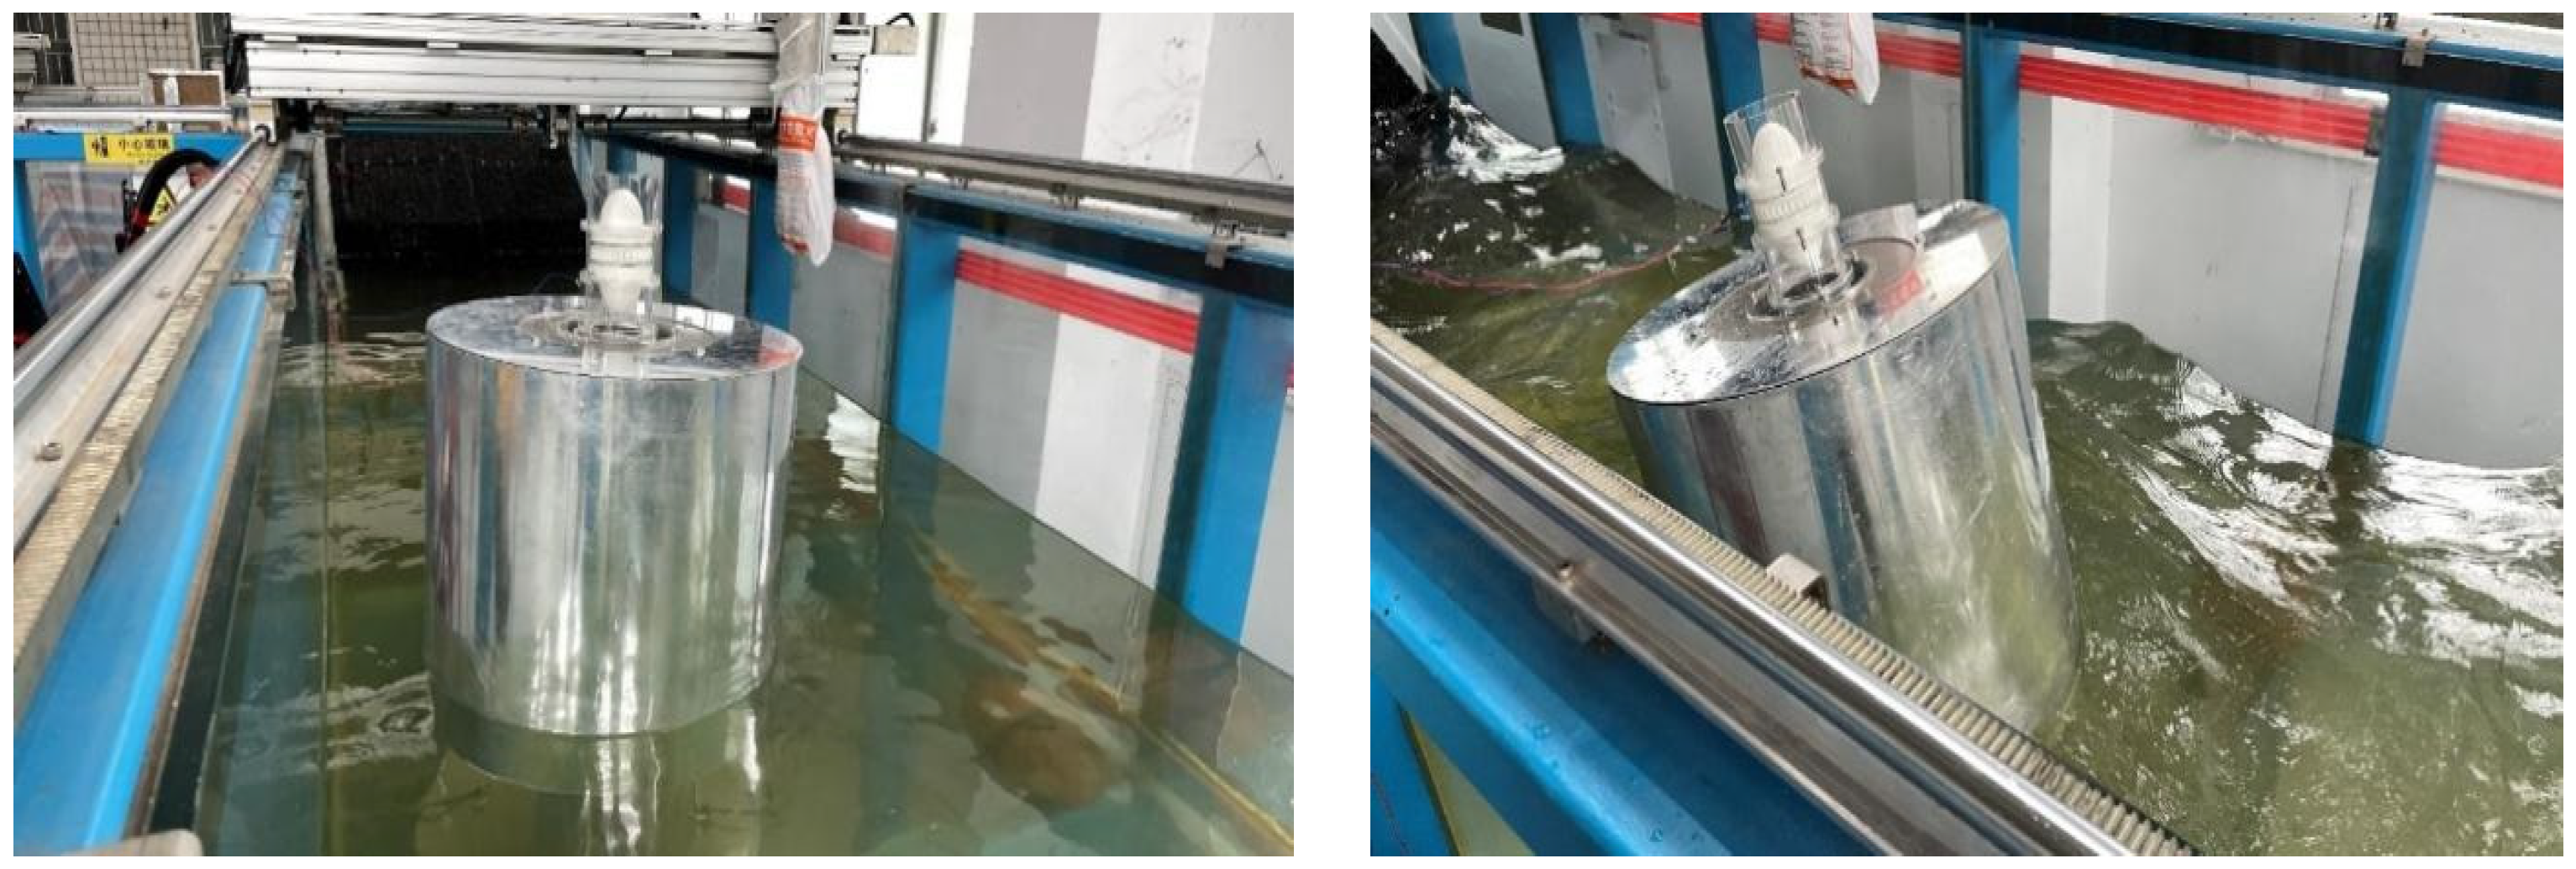
7. Prototype Development and Test Environment
7.1. Experimentation
7.2. Test and Result Analysis
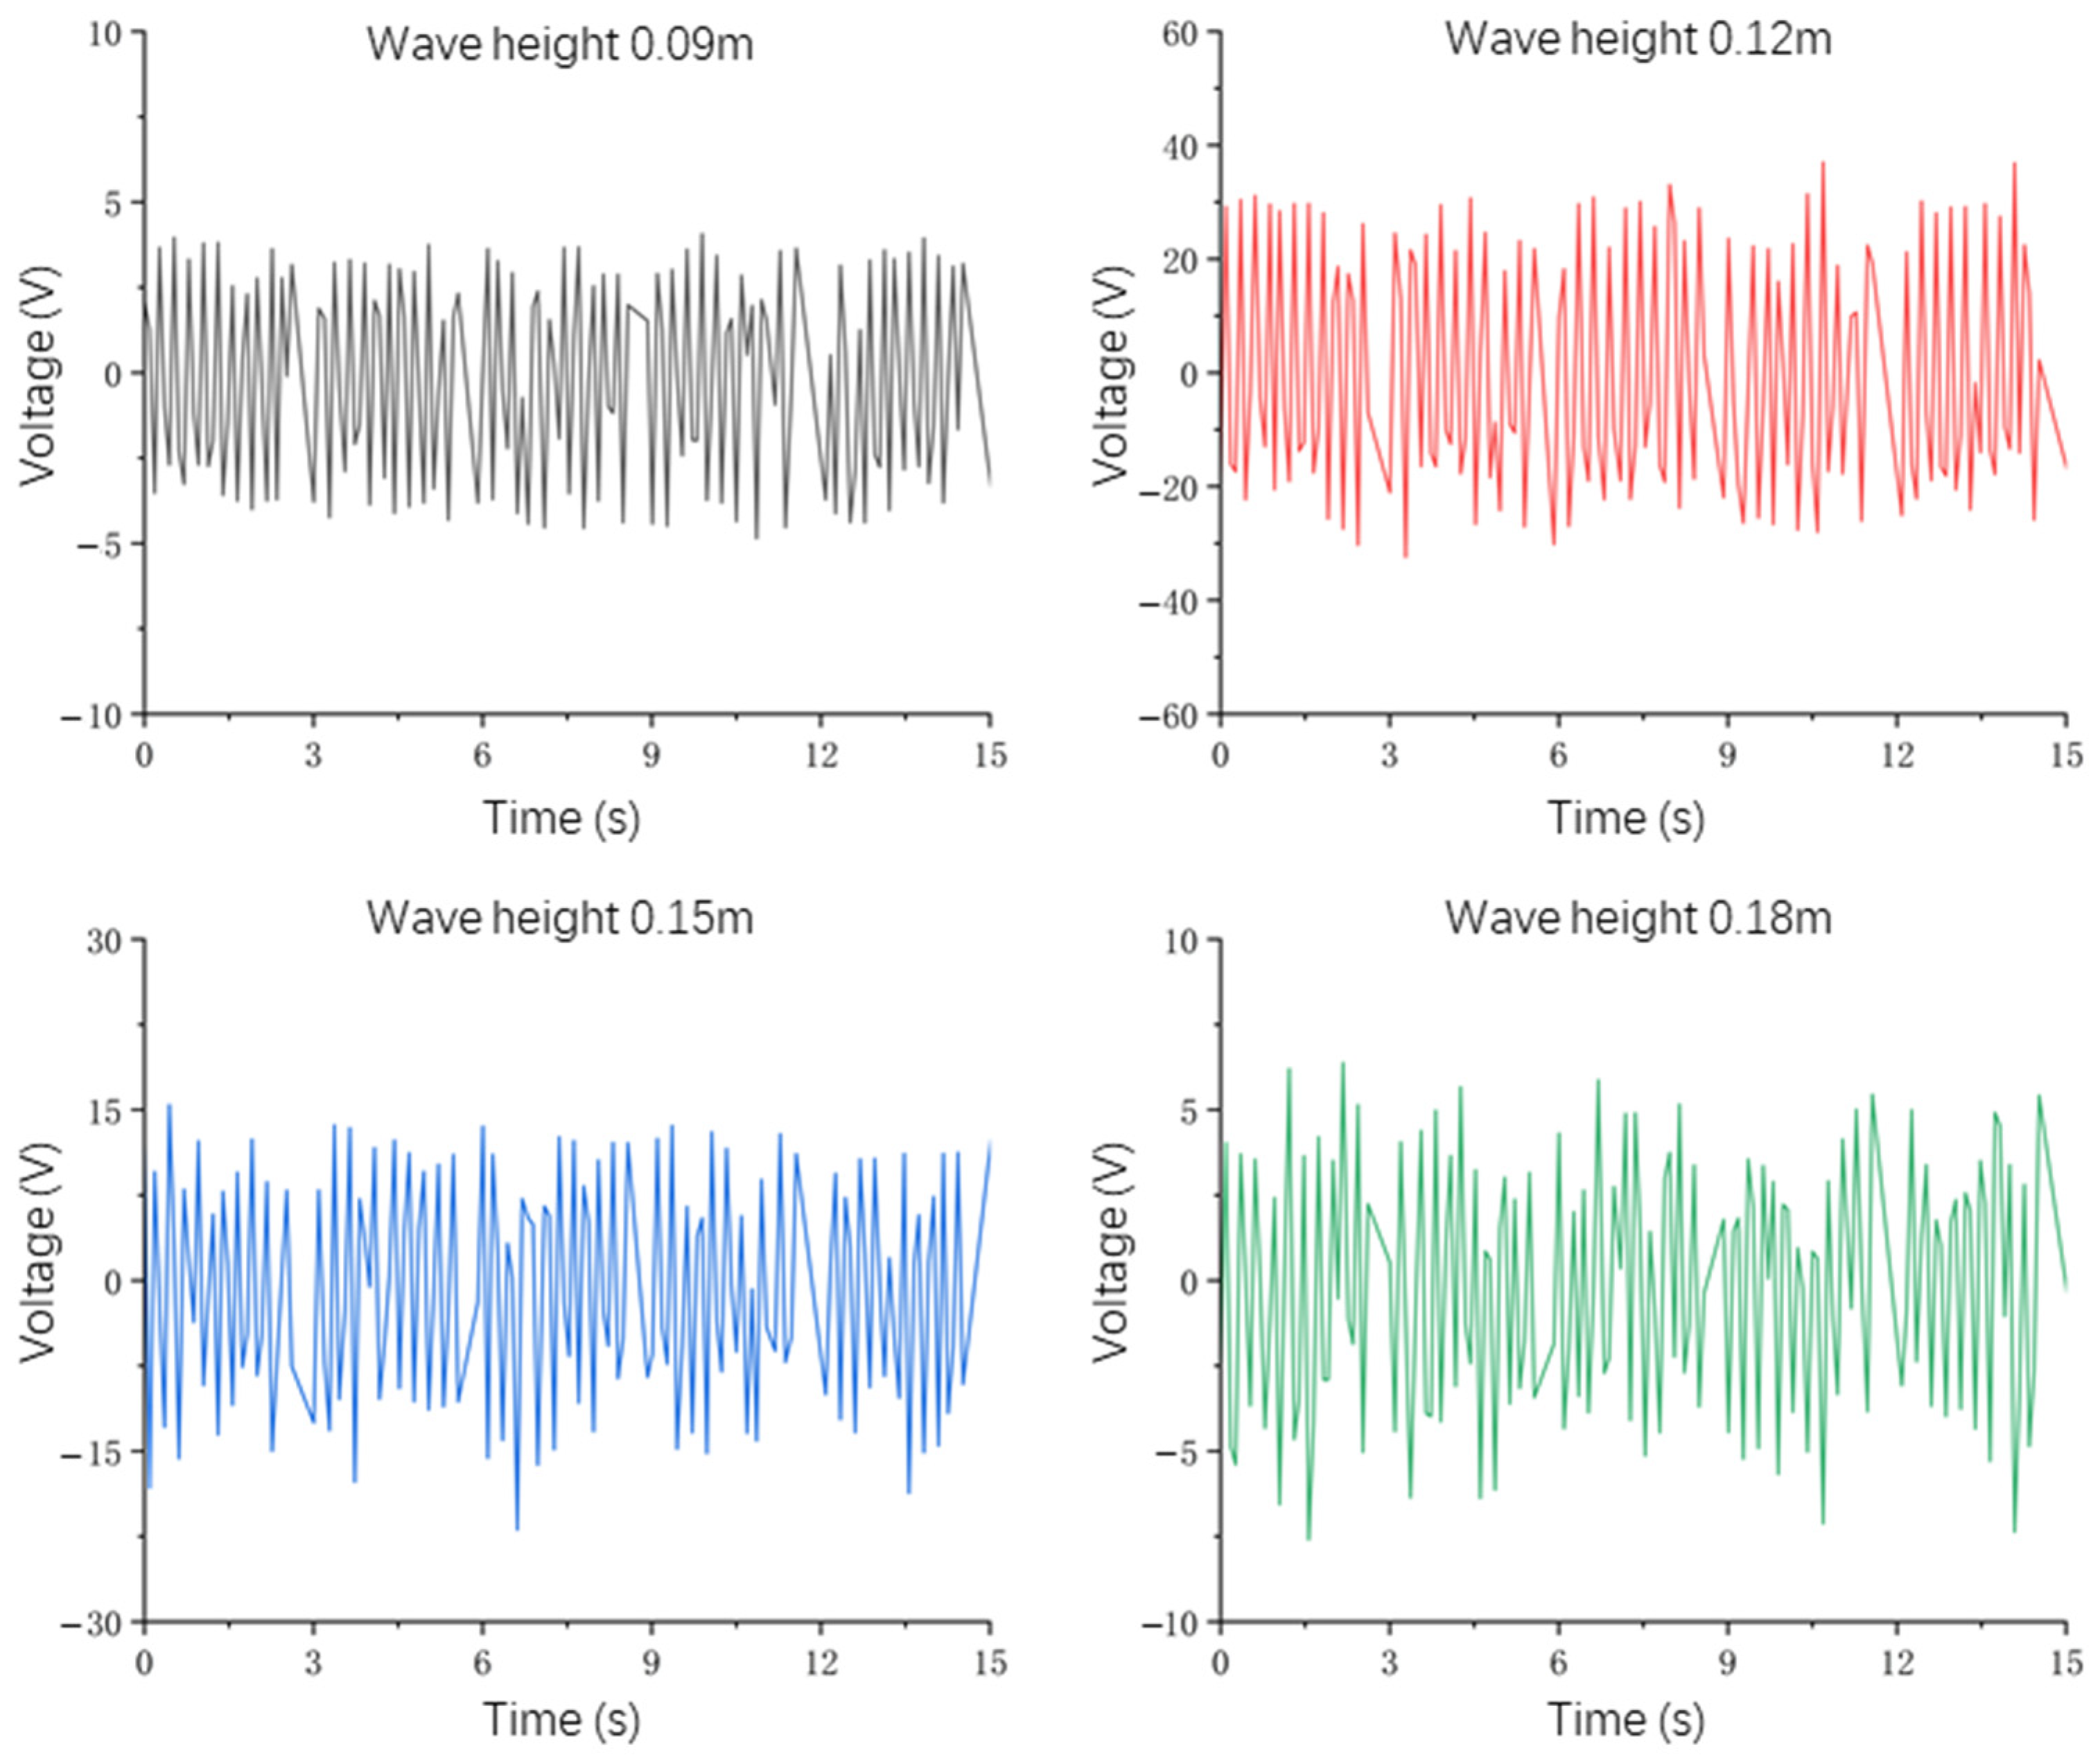
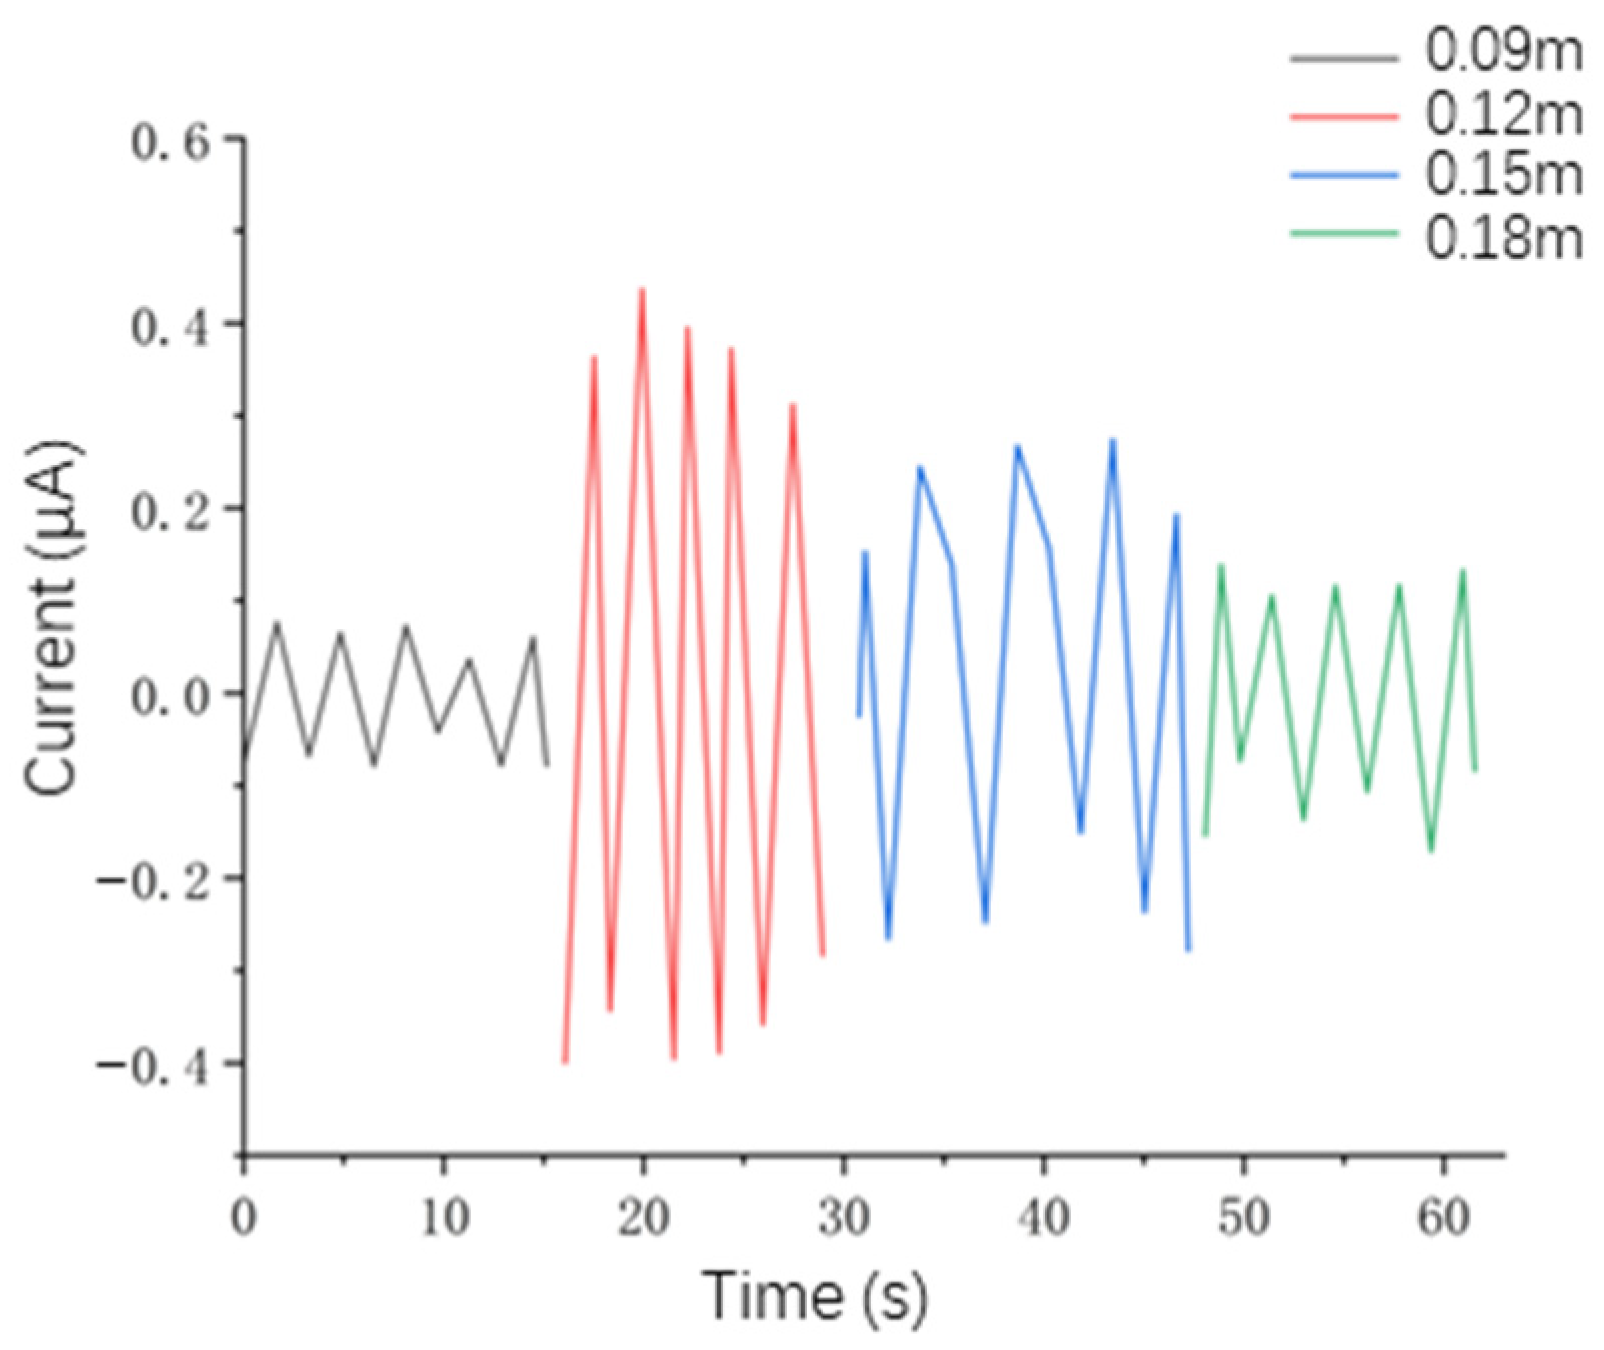
- (1)
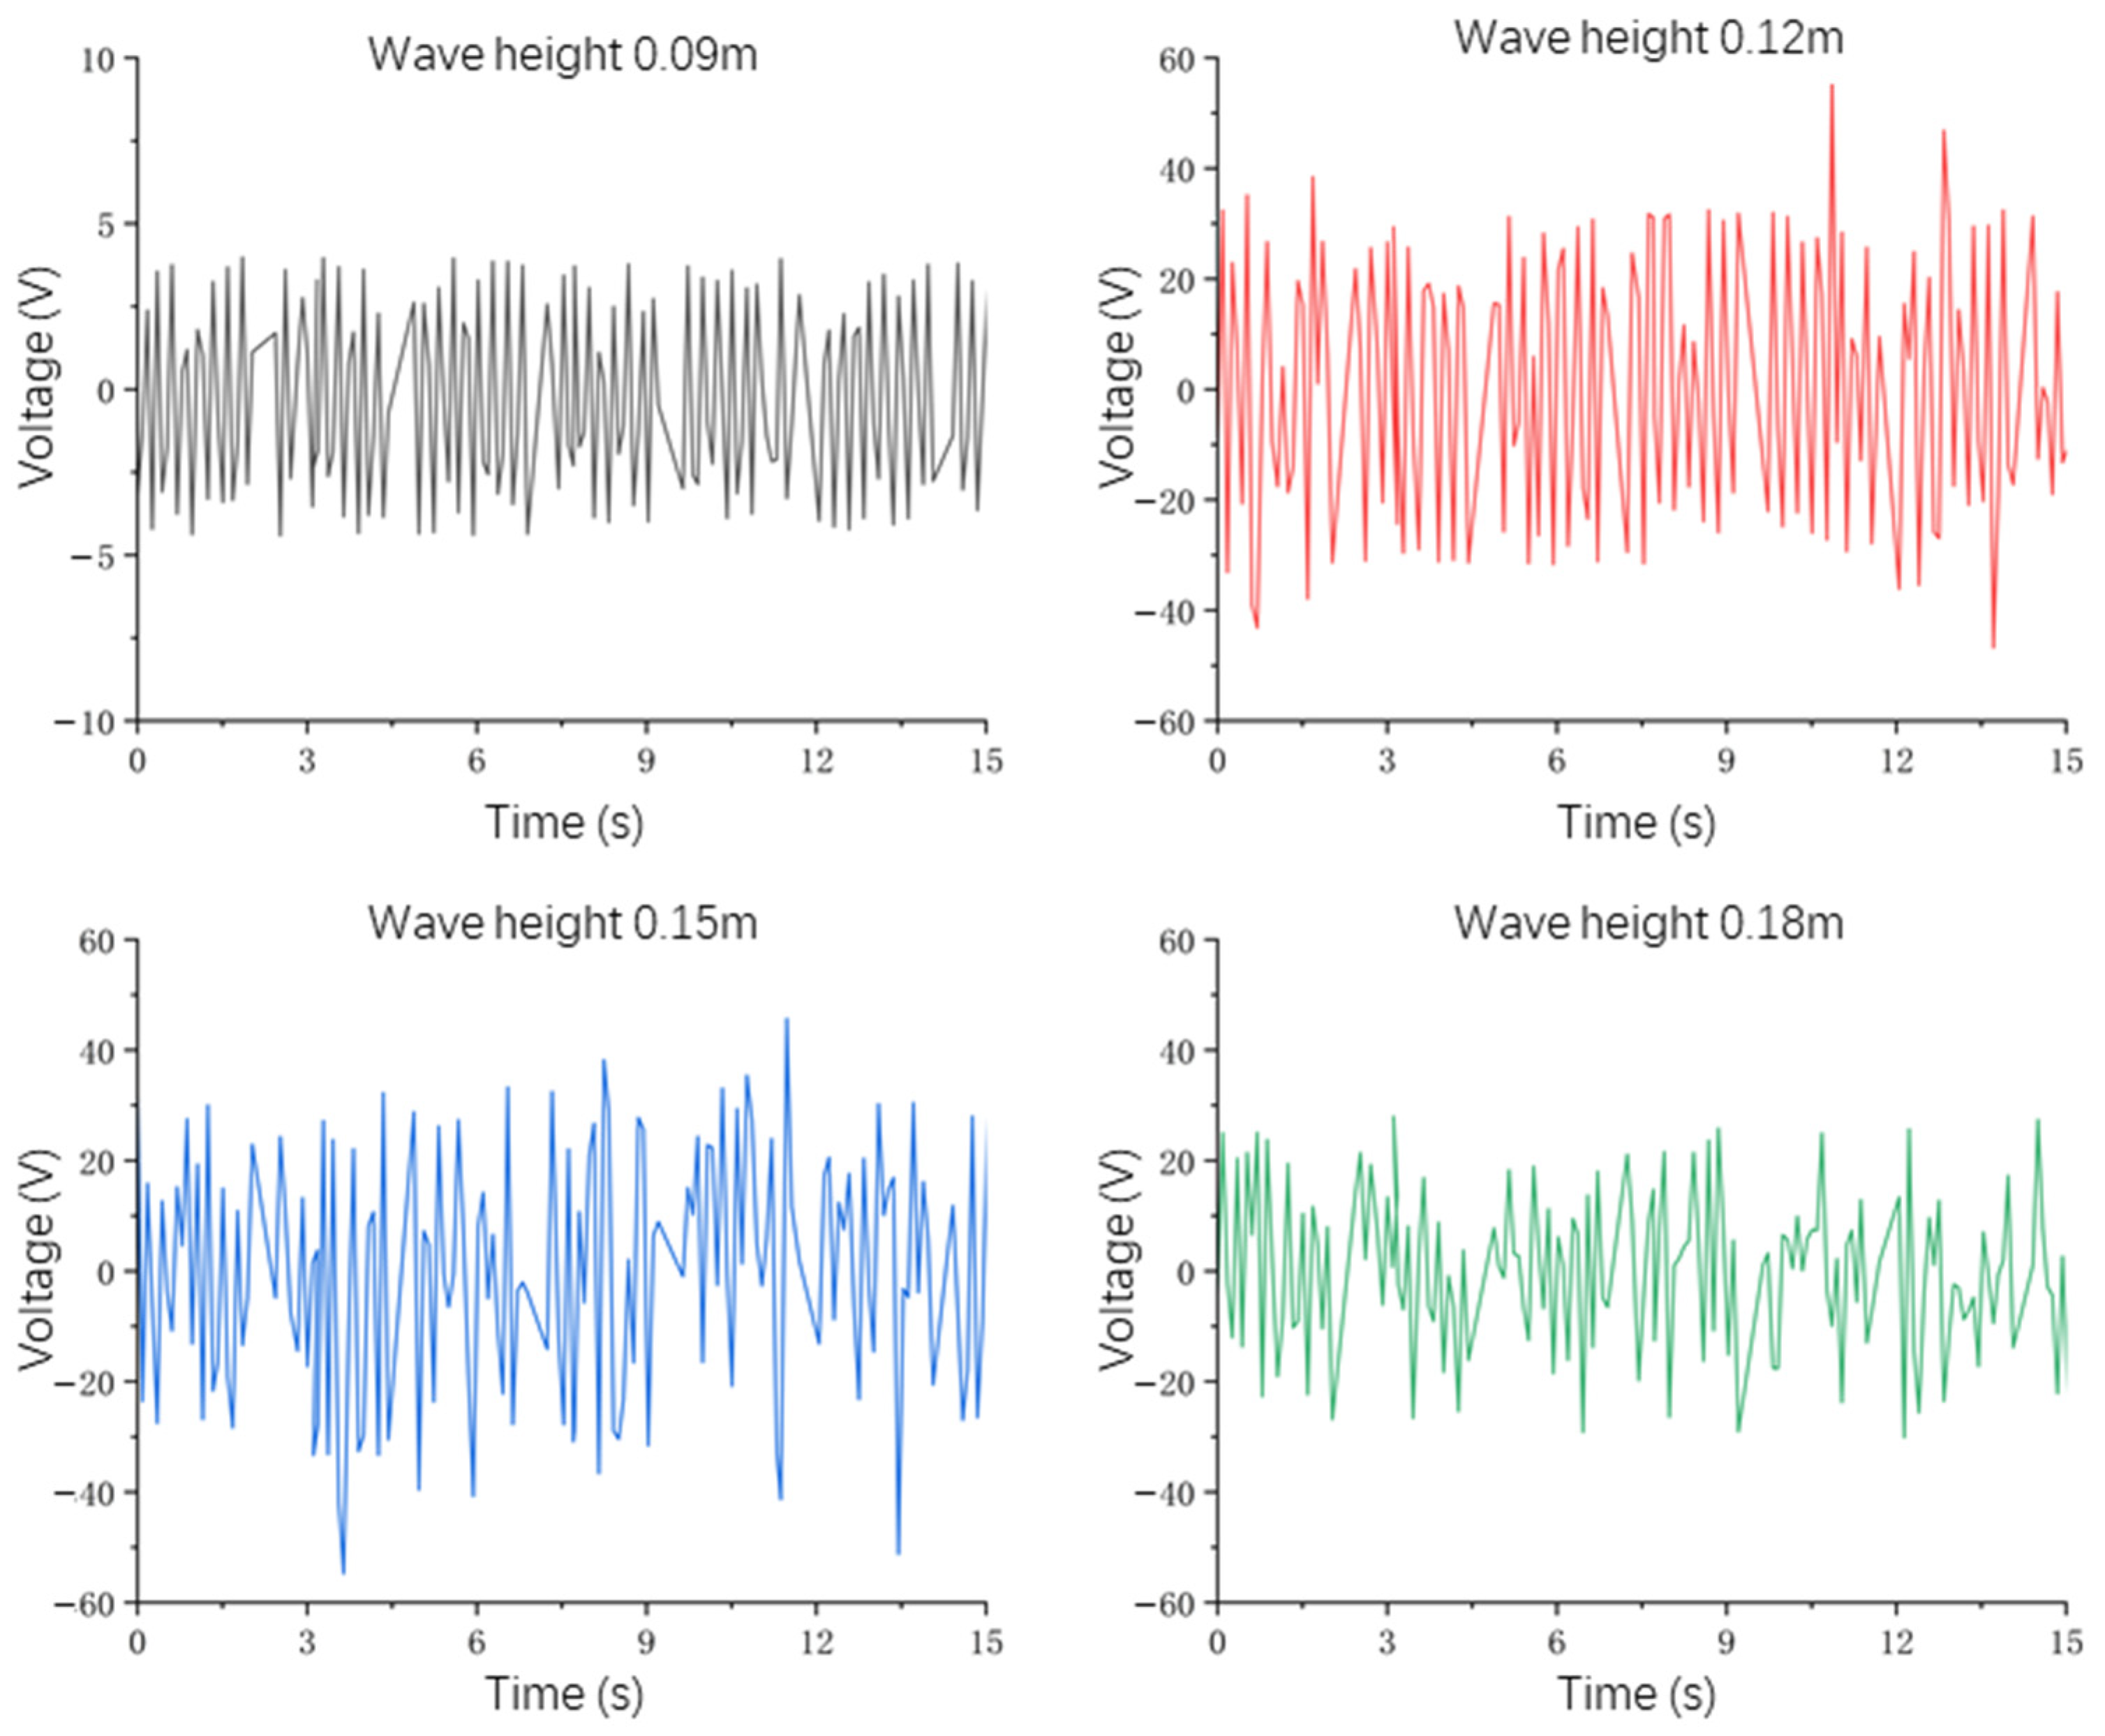
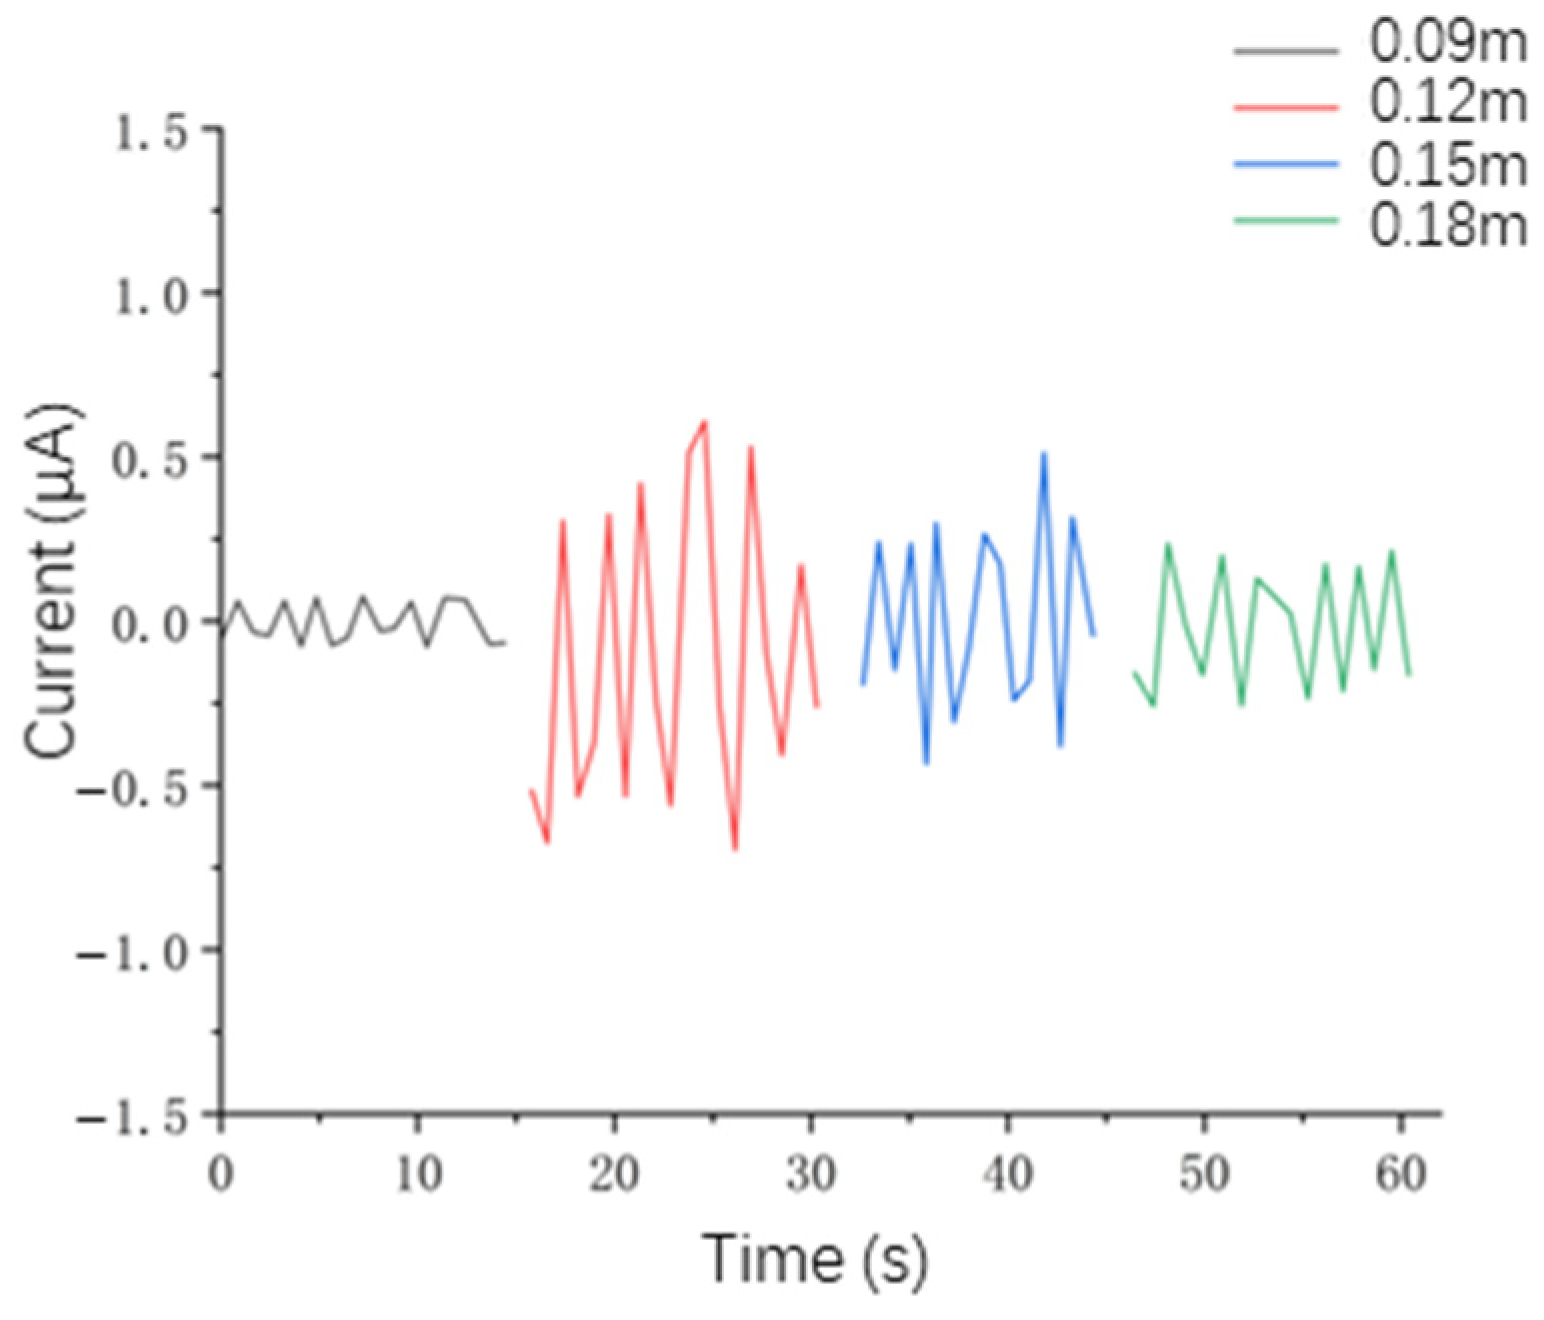
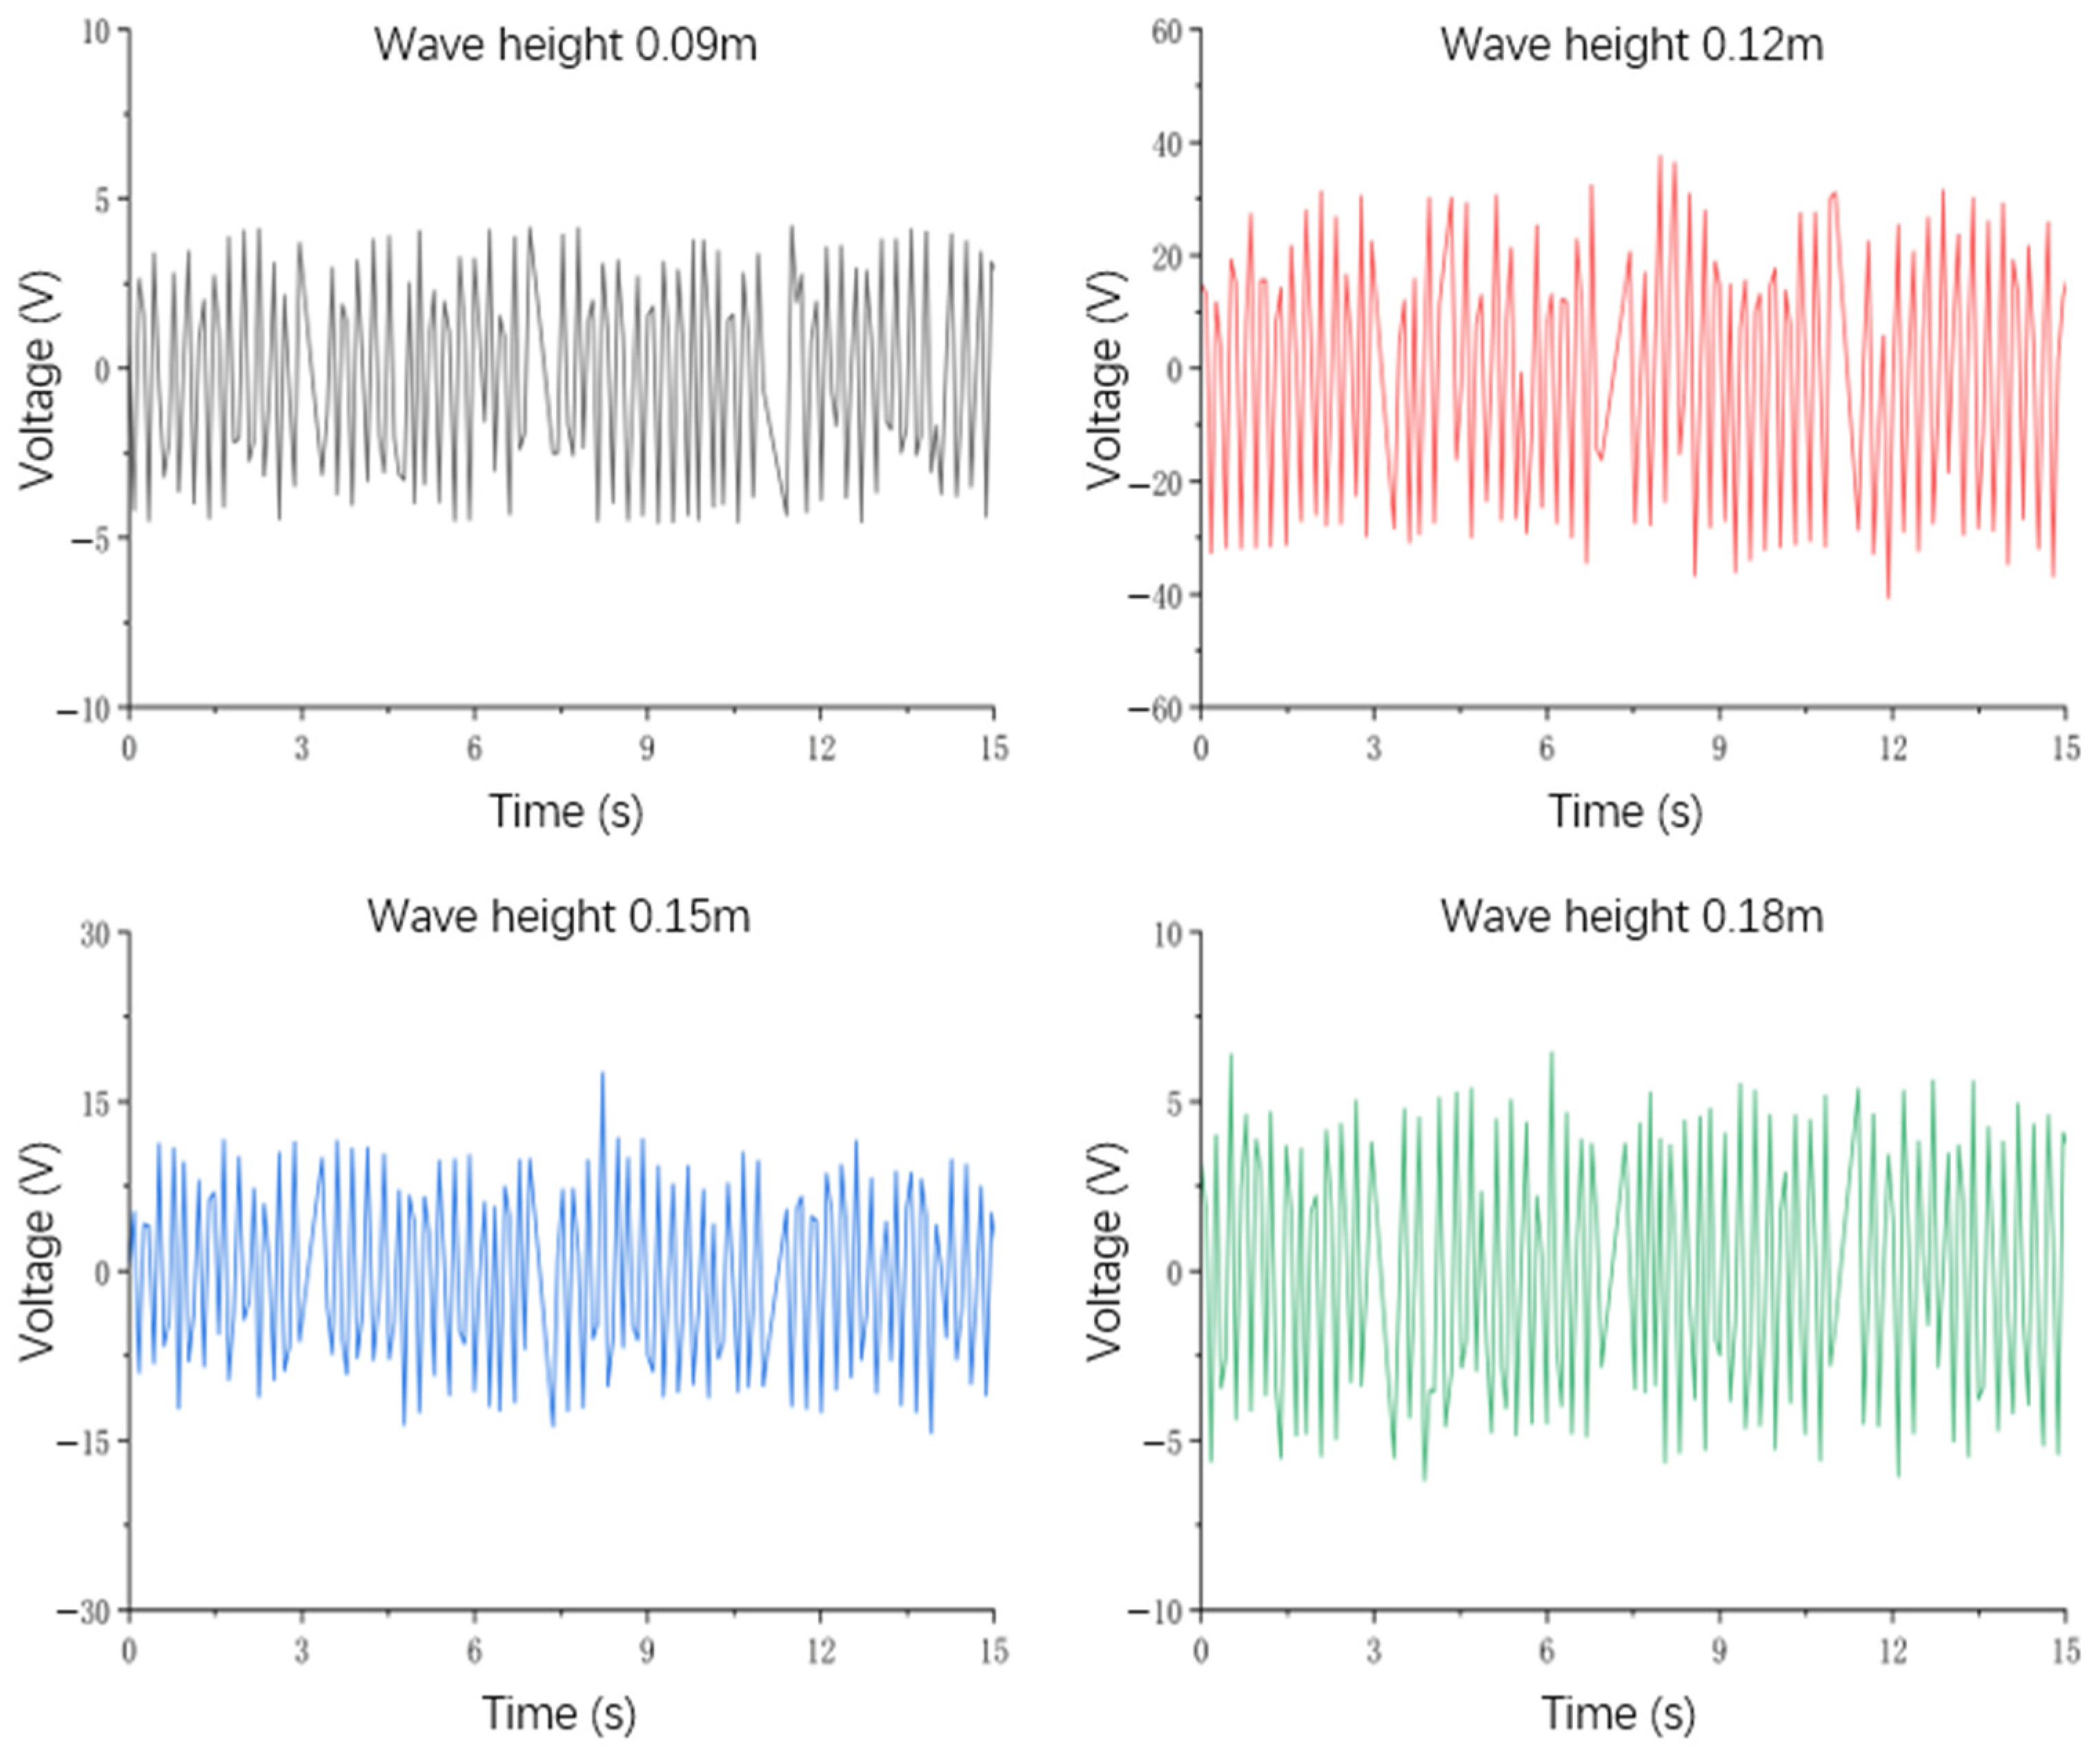
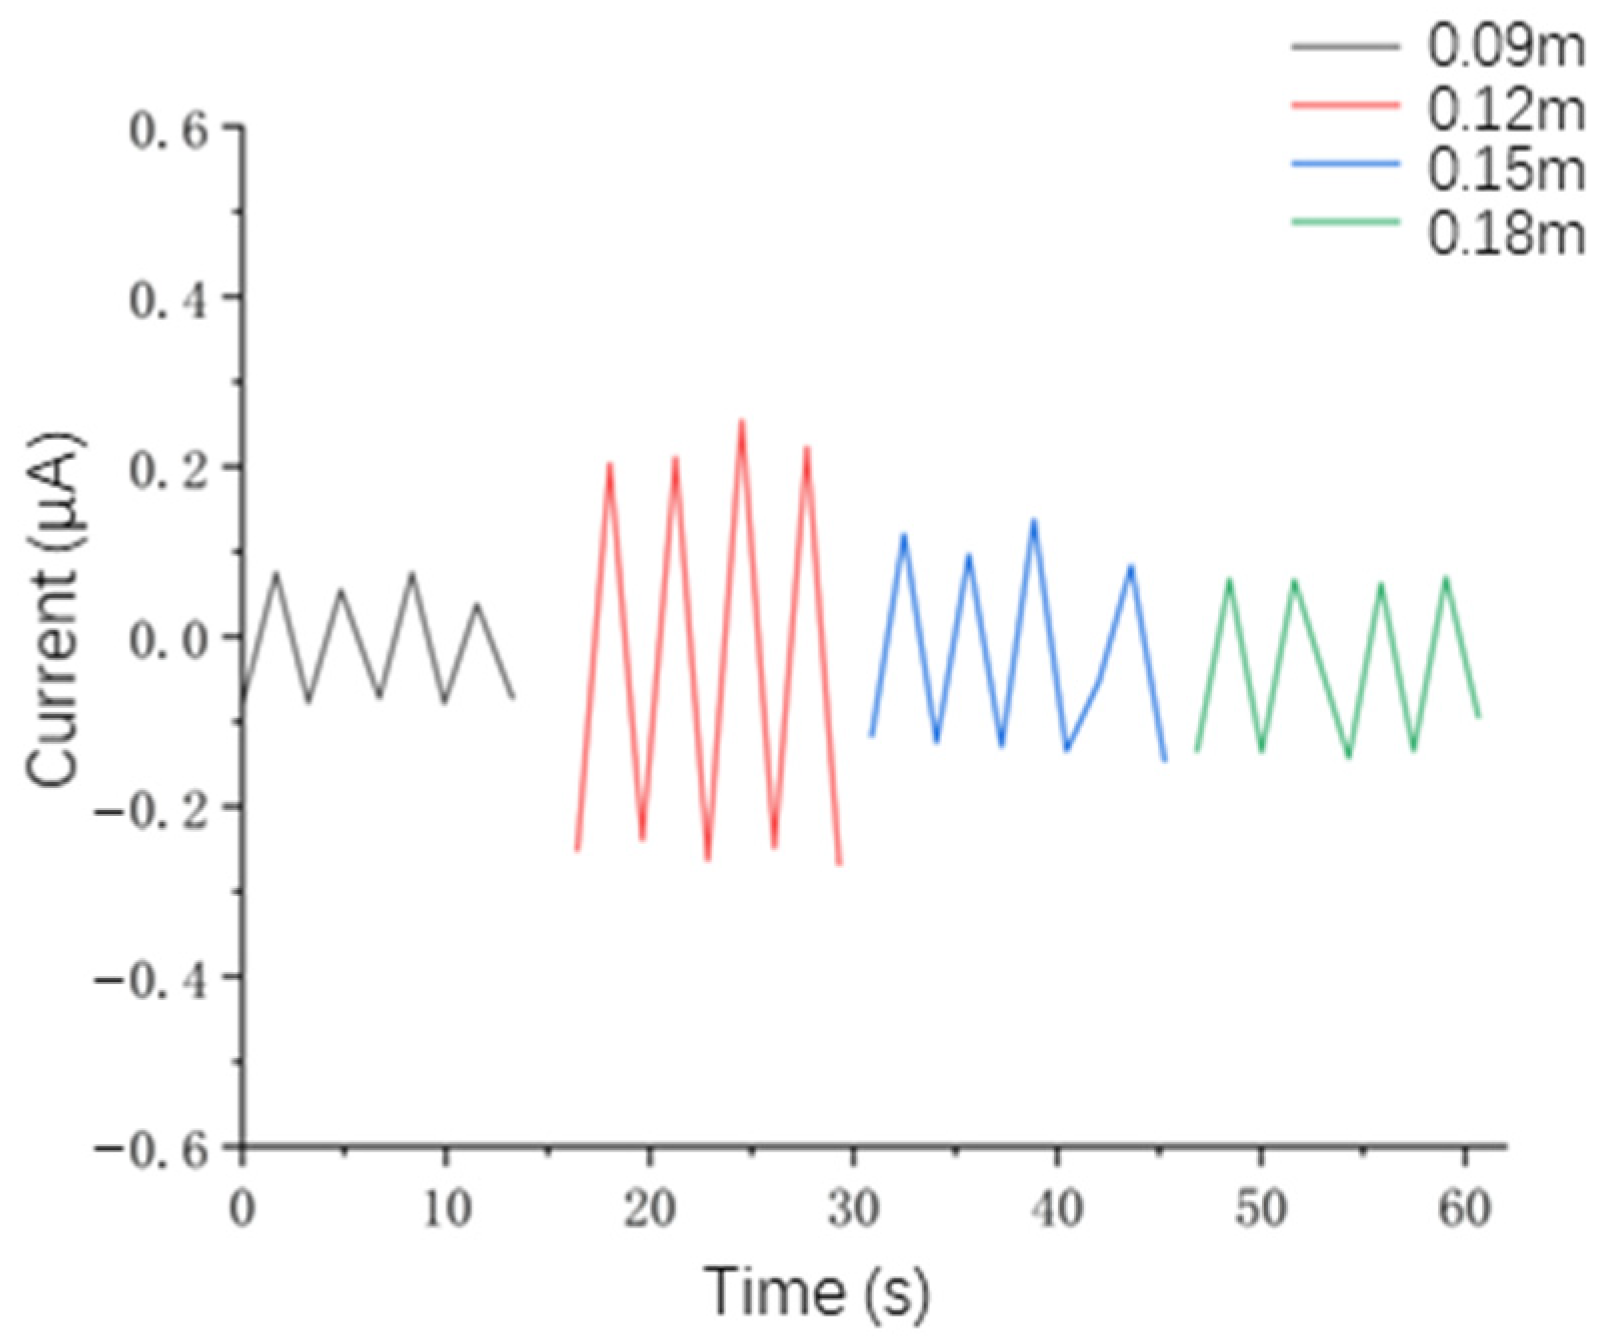
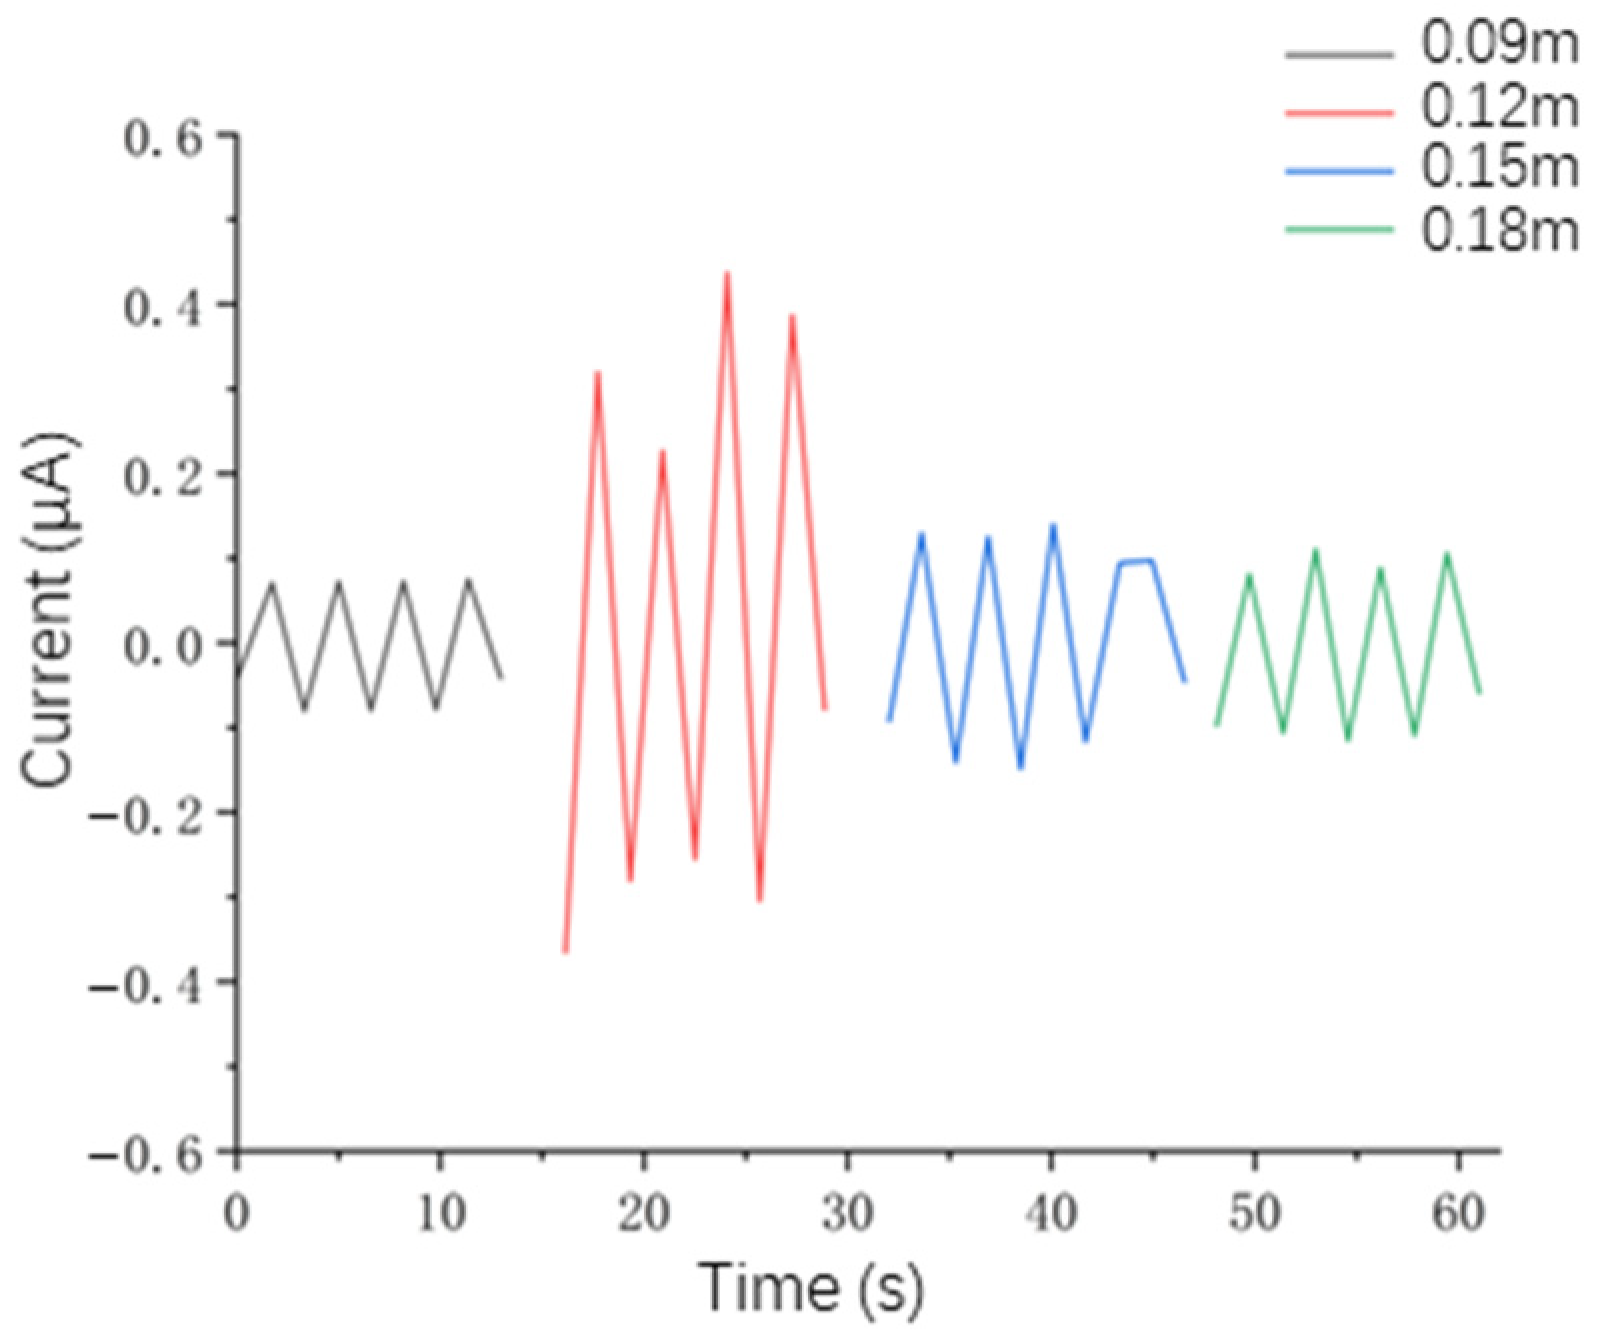
- Test and analysis of electrical output performance under regular waves
- (2)
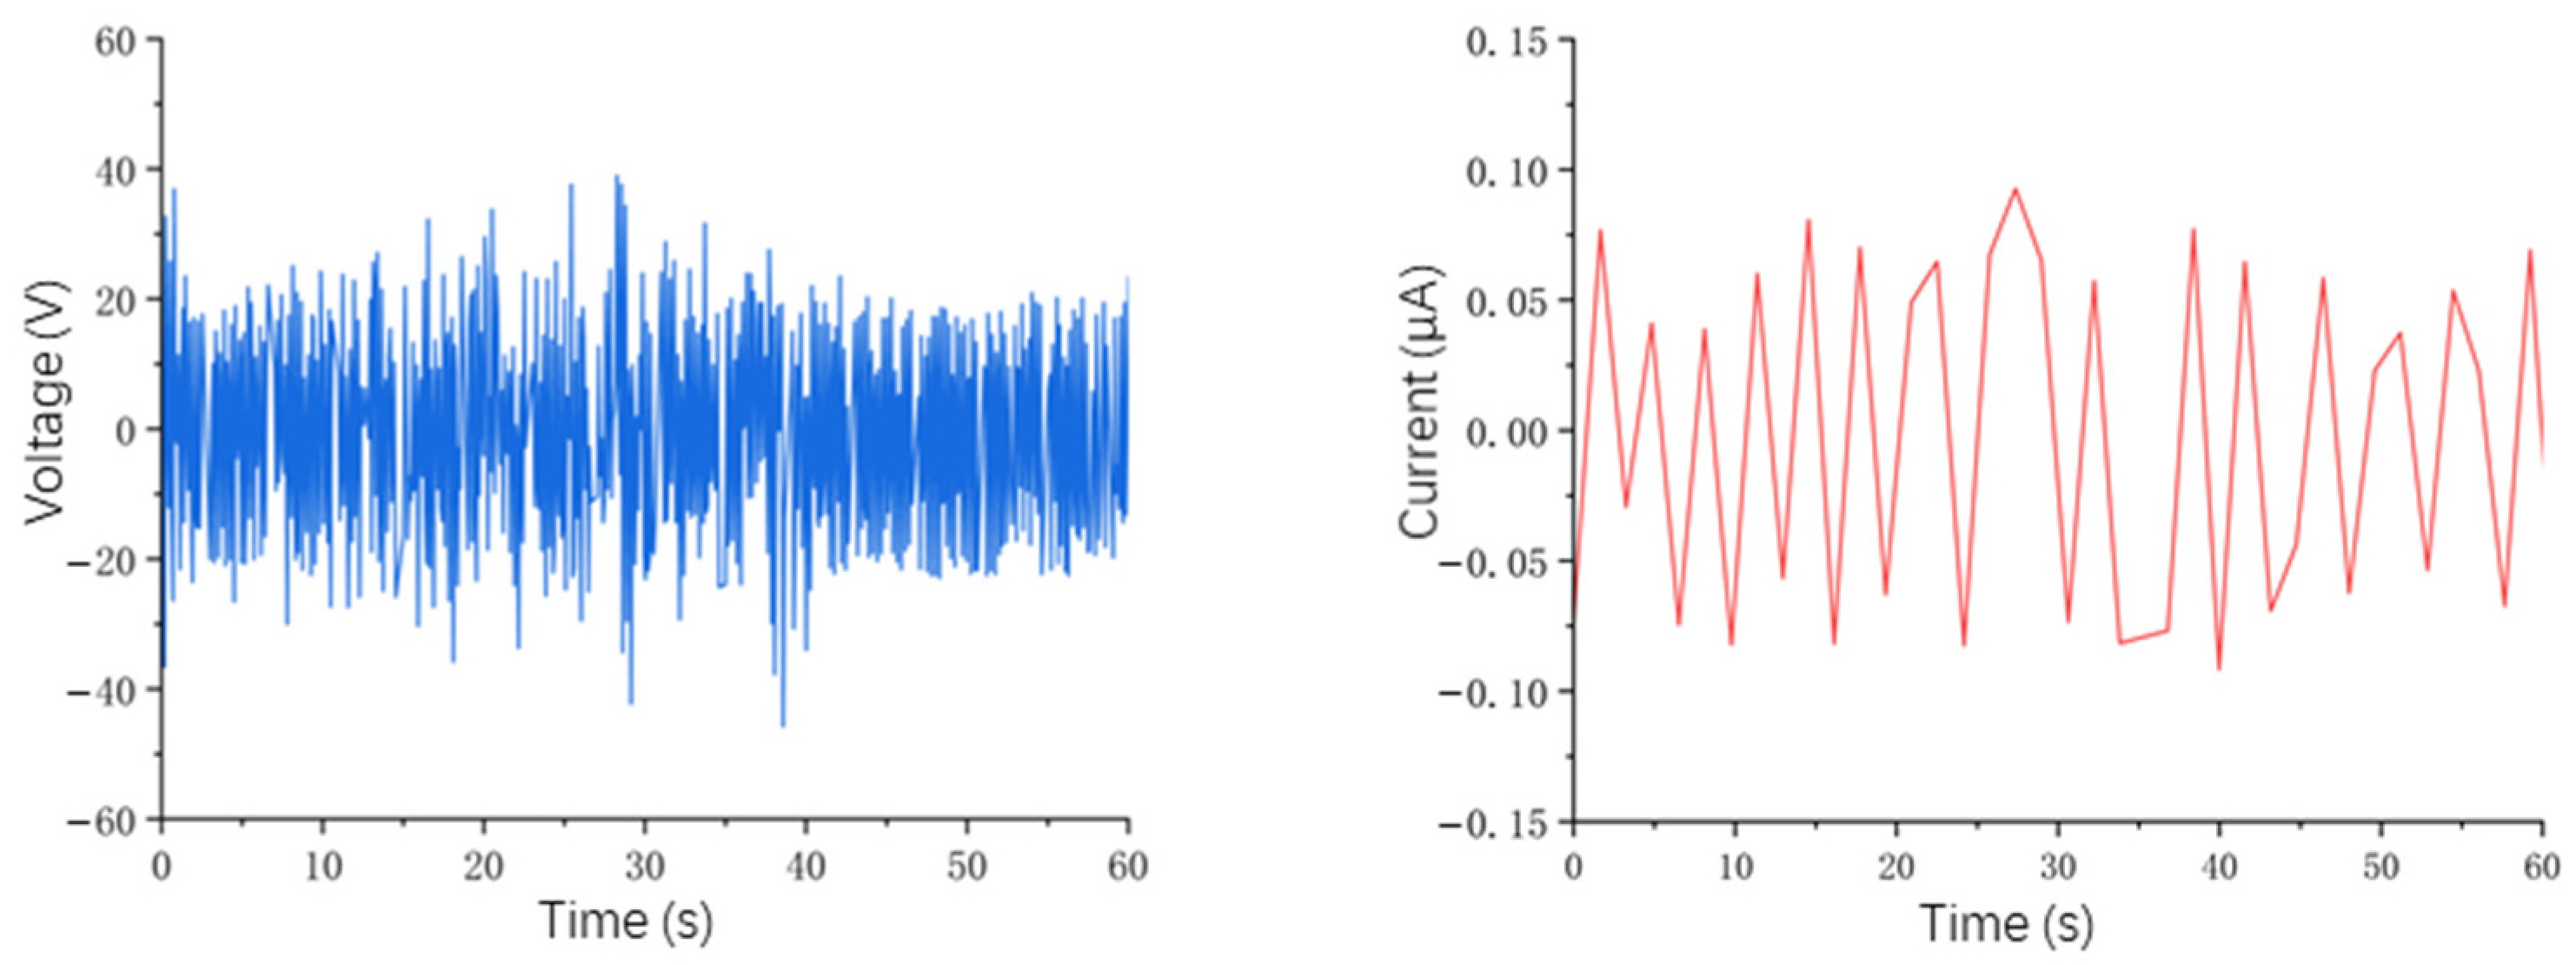
- Electrical performance output under irregular waves
- (3)
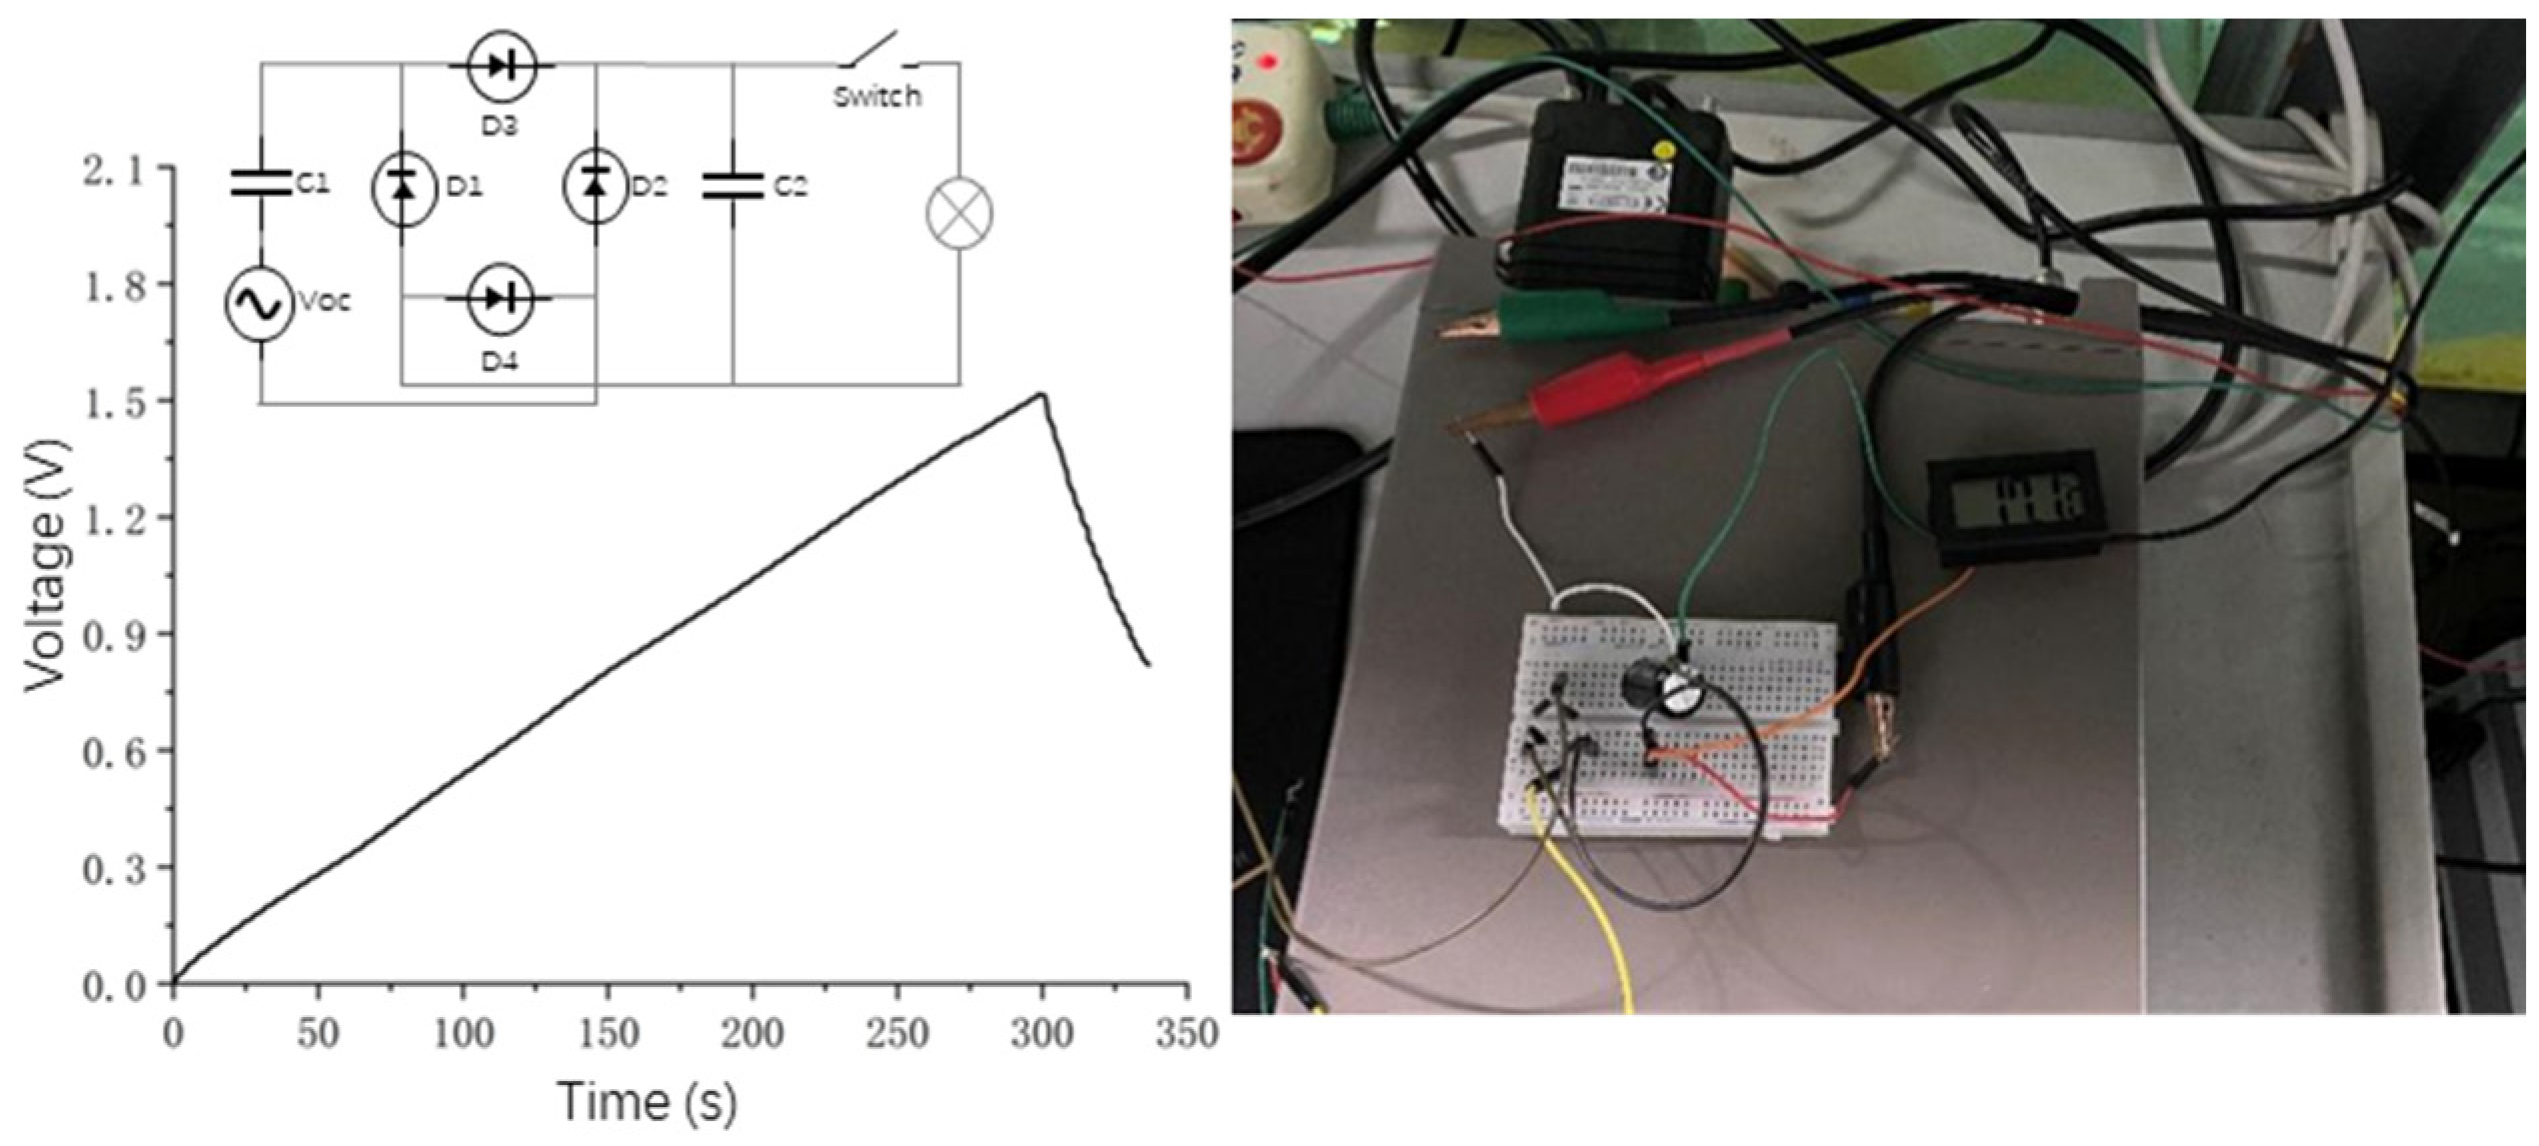
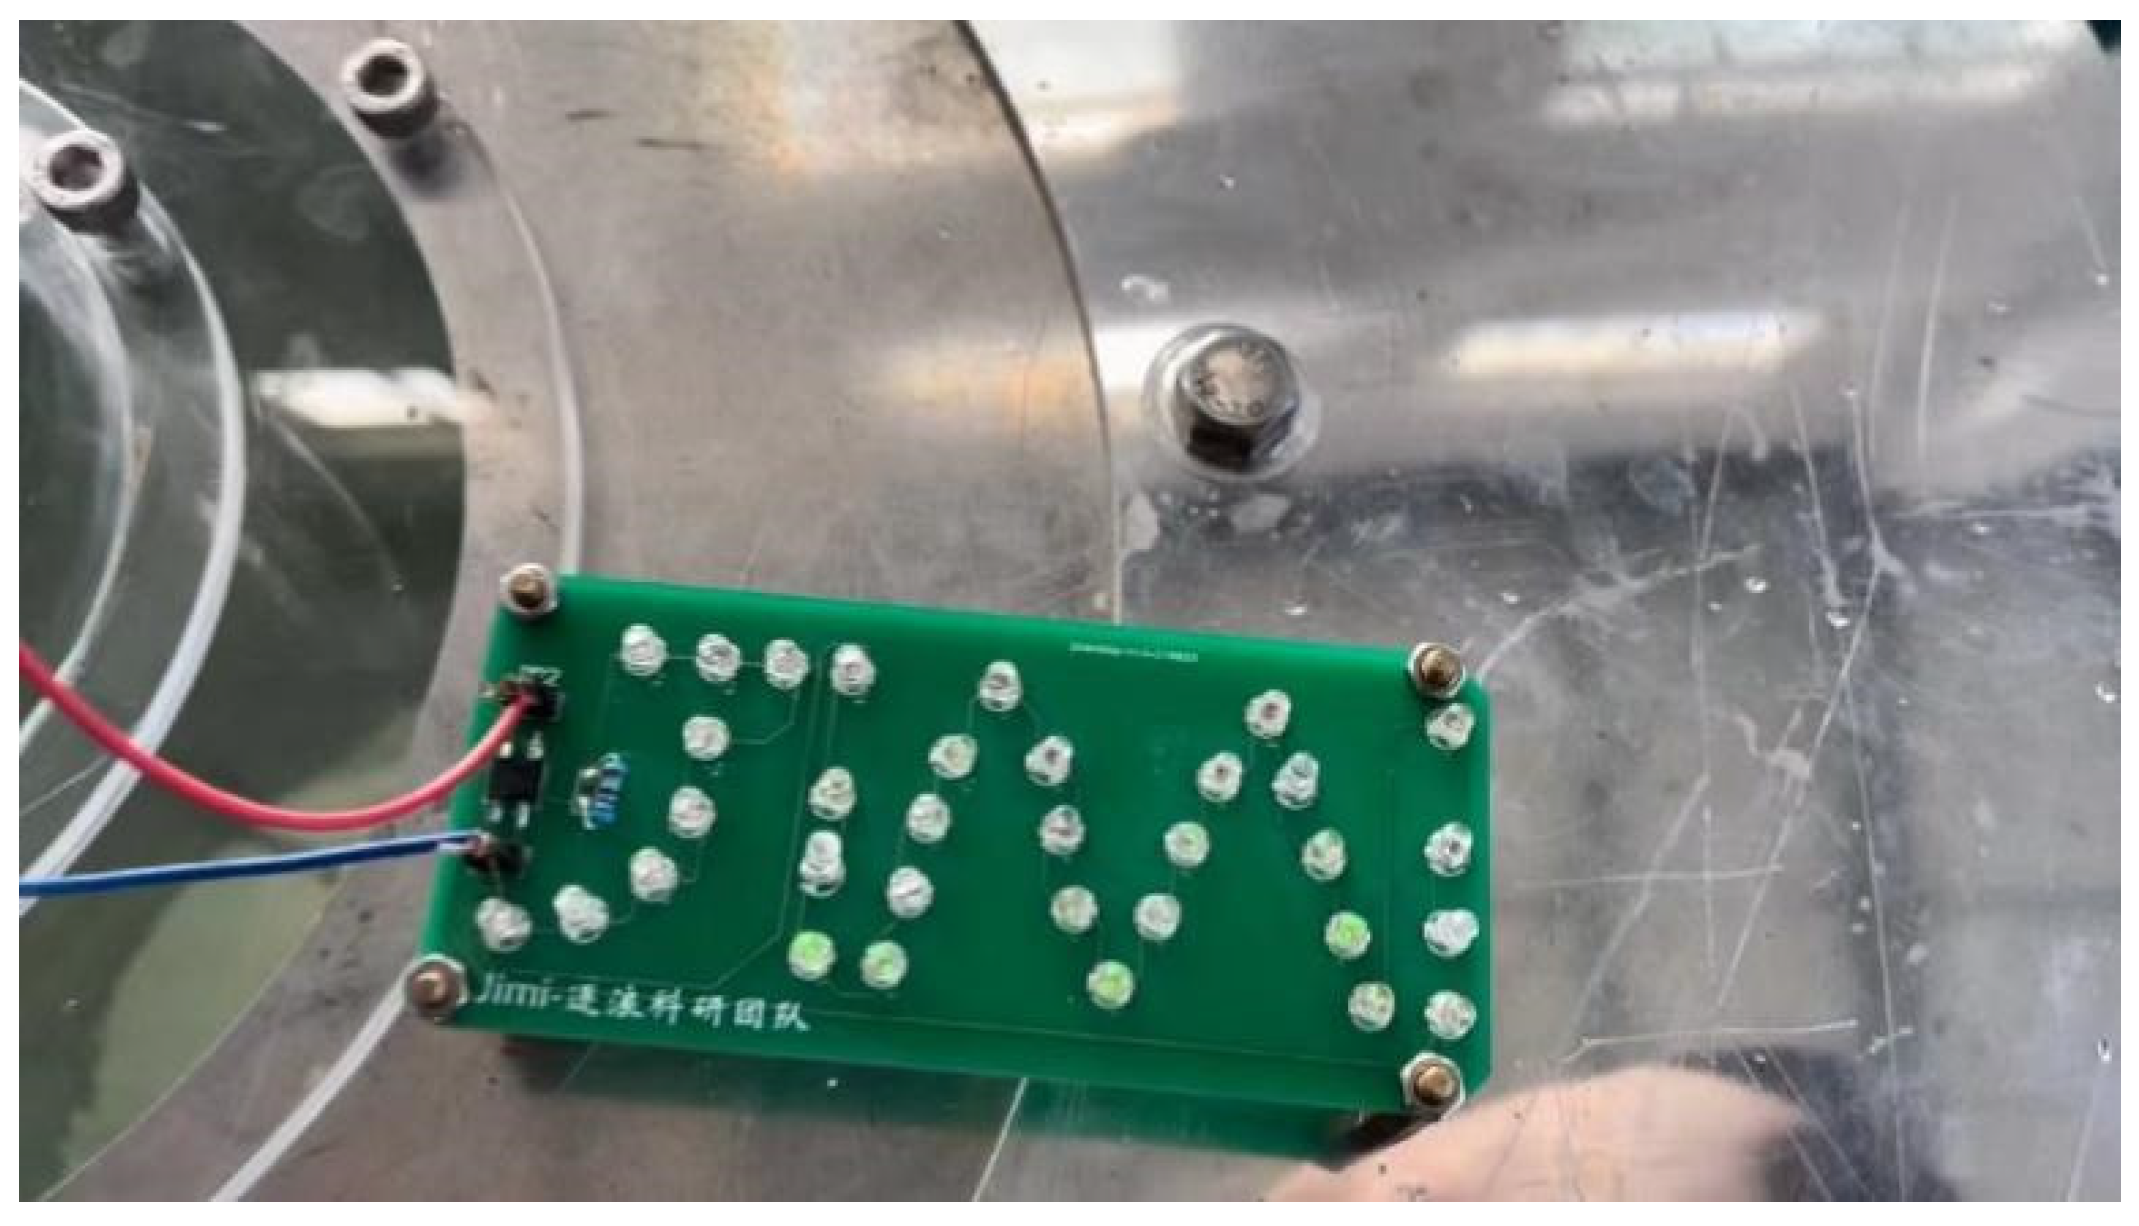
- Small electronic component self-energy application
8. Conclusions
- (1)
- A structure combining a central pipe OWC and a triboelectric nanogenerator was designed. The motion equation of the device was established, the working mode of the TENG was preliminarily designed, and its working principle was analyzed.
- (2)
- Hydrodynamic modeling, a simulation of the structure of the device, and an electrostatic field simulation of the generation mode of the TENG were carried out, and the influence of different parameters on the device were analyzed.
- (3)
- Optimized design and semi-physical experiments were carried out on the power generation performance parameters of the TENG, through which the effects of dielectric material, thickness, and electrode angle on the power generation performance were identified, and durability experiments were carried out. The results showed that the LED lamp can be successfully lit at a small wave level, verifying the capability of energy supply for small sensors.
Author Contributions
Funding
Data Availability Statement
Conflicts of Interest
References
- Jin, S.; Greaves, D. Wave Energy in the UK: Status Review and Future Perspectives. Renew. Sustain. Energy Rev. 2021, 143, 110932. [Google Scholar] [CrossRef]
- Silva, J.M.; Vieira, S.M.; Valério, D.; Henriques, J.C.C. GA-Optimized Inverse Fuzzy Model Control of OWC Wave Power Plants. Renew. Energy 2023, 204, 556–568. [Google Scholar] [CrossRef]
- Drew, B.; Plummer, A.R.; Sahinkaya, M.N. A Review of Wave Energy Converter Technology. Proc. Inst. Mech. Eng. Part A J. Power Energy 2009, 223, 887–902. [Google Scholar] [CrossRef]
- Yuan, H.; Shaohui, Y.; Hongzhou, H.; Hu, C.; Songgen, Z.; Di, Z. Modeling and Simulation Analysis of Multi-Point Hydraulic Wave Energy Desalination System. Ocean Eng. 2019, 37, 134–141. [Google Scholar]
- Son, D.; Yeung, R.W. Optimizing Ocean-Wave Energy Extraction of a Dual Coaxial-Cylinder WEC Using Nonlinear Model Predictive Control. Appl. Energy 2017, 187, 746–757. [Google Scholar] [CrossRef]
- Wu, J.; Yao, Y.; Zhou, L.; Göteman, M. Real-Time Latching Control Strategies for the Solo Duck Wave Energy Converter in Irregular Waves. Appl. Energy 2018, 222, 717–728. [Google Scholar] [CrossRef]
- López, I.; Andreu, J.; Ceballos, S.; Martínez De Alegría, I.; Kortabarria, I. Review of Wave Energy Technologies and the Necessary Power-Equipment. Renew. Sustain. Energy Rev. 2013, 27, 413–434. [Google Scholar] [CrossRef]
- Ringwood, J.V.; Bacelli, G.; Fusco, F. Energy-Maximizing Control of Wave-Energy Converters: The Development of Control System Technology to Optimize Their Operation. IEEE Control. Syst. 2014, 34, 30–55. [Google Scholar] [CrossRef]
- Yang, I.; Tezdogan, T.; Incecik, A. Numerical Investigations of a Pivoted Point Absorber Wave Energy Converter Integrated with Breakwater Using CFD. Ocean Eng. 2023, 274, 114025. [Google Scholar] [CrossRef]
- Sheng, W. Wave Energy Conversion and Hydrodynamics Modelling Technologies: A Review. Renew. Sustain. Energy Rev. 2019, 109, 482–498. [Google Scholar] [CrossRef]
- Previsic, M.; Karthikeyan, A.; Lyzenga, D. In-Ocean Validation of a Deterministic Sea Wave Prediction (DSWP) System Leveraging X-Band Radar to Enable Optimal Control in Wave Energy Conversion Systems. Appl. Ocean Res. 2021, 114, 102784. [Google Scholar] [CrossRef]
- Shadman, M.; Guarniz Avalos, G.O.; Estefen, S.F. On the Power Performance of a Wave Energy Converter with a Direct Mechanical Drive Power Take-off System Controlled by Latching. Renew. Energy 2021, 169, 157–177. [Google Scholar] [CrossRef]
- Russo, S.; Contestabile, P.; Bardazzi, A.; Leone, E.; Iglesias, G.; Tomasicchio, G.R.; Vicinanza, D. Dynamic Loads and Response of a Spar Buoy Wind Turbine with Pitch-Controlled Rotating Blades: An Experimental Study. Energies 2021, 14, 3598. [Google Scholar] [CrossRef]
- Sheng, W. Motion and Performance of BBDB OWC Wave Energy Converters: I, Hydrodynamics. Renew. Energy 2019, 138, 106–120. [Google Scholar] [CrossRef]
- Falcão, A.F.O.; Henriques, J.C.C. Oscillating-Water-Column Wave Energy Converters and Air Turbines: A Review. Renew. Energy 2016, 85, 1391–1424. [Google Scholar] [CrossRef]
- Setoguchi, T.; Takao, M. Current Status of Self Rectifying Air Turbines for Wave Energy Conversion. Energy Convers. Manag. 2006, 47, 2382–2396. [Google Scholar] [CrossRef]
- Xiao, L.; You, Y.; Zhang, Y. Experimentalstudy on Conical Central Tube Buoy. Acta Energ. Sin. 2021, 42, 8–14. [Google Scholar]
- Li, M.; Chen, T.; Wu, R. Experimental Study Onthe Influence of the Bottom Shape of Central Tube on Thewave Energy Conversion Performance of Buoy. Newenergy Prog. 2016, 4, 15–19. [Google Scholar]
- Wu, B.; Li, M.; Chen, T. An Experimental Study on Energy Conversion of the Modified Centre Pipe Buoy and the Design of Prototypes. Ocean Eng. 2017, 35, 97–104. [Google Scholar]
- Kim, W.D. On the Harmonic Oscillations of a Rigid Body on a Free Surface. J. Fluid Mech. 1965, 21, 427–451. [Google Scholar] [CrossRef]
- Wang, Z.L. On Maxwell’s Displacement Current for Energy and Sensors: The Origin of Nanogenerators. Mater. Today 2017, 20, 74–82. [Google Scholar] [CrossRef]
- Lin, Z.H.; Cheng, G.; Lin, L.; Lee, S.; Wang, Z.L. Water-Solid Surface Contact Electrification and Its Use for Harvesting Liquid-Wave Energy. Angew. Chemie—Int. Ed. 2013, 52, 12545–12549. [Google Scholar] [CrossRef] [PubMed]
- Xu, M.; Wang, S.; Zhang, S.L.; Ding, W.; Kien, P.T.; Wang, C.; Li, Z.; Pan, X.; Wang, Z.L. A Highly-Sensitive Wave Sensor Based on Liquid-Solid Interfacing Triboelectric Nanogenerator for Smart Marine Equipment. Nano Energy 2019, 57, 574–580. [Google Scholar] [CrossRef]
- Yang, Y.; Zhang, H.; Liu, R.; Wen, X.; Hou, T.C.; Wang, Z.L. Fully Enclosed Triboelectric Nanogenerators for Applications in Water and Harsh Environments. Adv. Energy Mater. 2013, 3, 1563–1568. [Google Scholar] [CrossRef]
- Wang, N.; Zou, J.; Yang, Y.; Li, X.; Guo, Y.; Jiang, C.; Jia, X.; Cao, X. Kelp-Inspired Biomimetic Triboelectric Nanogenerator Boosts Wave Energy Harvesting. Nano Energy 2019, 55, 541–547. [Google Scholar] [CrossRef]
- Sarmento, A.J.N.A.; De Falcao, A.F.O. Wave Generation by an Oscillating Surface-Pressure and Its Application in Wave-Energy Extraction. J. Fluid Mech. 1985, 150, 467–485. [Google Scholar] [CrossRef]
- Falcão, A.F.O.; Henriques, J.C.C. Model-Prototype Similarity of Oscillating-Water-Column Wave Energy Converters. Int. J. Mar. Energy 2014, 6, 18–34. [Google Scholar] [CrossRef]
- Mazzaretto, O.M.; Menéndez, M.; Lobeto, H. A Global Evaluation of the JONSWAP Spectra Suitability on Coastal Areas. Ocean Eng. 2022, 266, 112756. [Google Scholar] [CrossRef]


| Float Shape | Model 1 | Model 2 | Model 3 | Model 4 | Model 5 | |
|---|---|---|---|---|---|---|
 |  |  |  |  | ||
| Diameter of bottom (m) | 0.6 | 0.6/0.5 | 0.6/0.4 | 0.6/0.5 | 0.6/0.4 | |
| Rotational inertia (kg·m2) | Ixx | 2.54 | 2.49 | 2.41 | 2.52 | 2.47 |
| Iyy | 2.54 | 2.49 | 2.41 | 2.52 | 2.47 | |
| Izz | 2.36 | 2.34 | 2.33 | 2.35 | 2.34 | |
| Float Shape | Model 6 | Model 7 | Model 1 | Model 8 | Model 9 | |
|---|---|---|---|---|---|---|
 |  |  |  |  | ||
| Swing board width (mm) | 400 | 500 | 600 | 700 | 800 | |
| Mass (kg) | 33.53 | 34.93 | 36.65 | 38.66 | 40.99 | |
| Rotational inertia (kg·m2) | Ixx | 2.27 | 2.48 | 2.54 | 3.08 | 3.49 |
| Iyy | 2.27 | 2.48 | 2.54 | 3.08 | 3.49 | |
| Izz | 2.15 | 2.24 | 2.36 | 2.49 | 2.68 | |
| Parameter Names | Model |
|---|---|
| Total height of device, H (m) | 1.018 |
| Maximum diameter of float, D (m) | 0.6 |
| Main float height, L1 (m) | 0.6 |
| Central pipe diameter, D1 (m) | 0.4 |
| Maximum diameter of top air port, D2 (m) | 0.175 |
| Wall thickness, T1, T2 (m) | 0.003, 0.005 |
| Heave plate thickness, T (m) | 0.005 |
| Swing board height, L2 (m) | 1.01 |
| Sag board connection rod diameter, D3 (m) | 0.01 |
| Diameter of the center through hole of the swing plate, D4 (m) | 0.2 |
| Significant Wave height (m) | 0.09 | 0.12 | 0.15 | 0.18 |
| Period (s) | 2 | 2.5 | 3 | 3.5 |
Disclaimer/Publisher’s Note: The statements, opinions and data contained in all publications are solely those of the individual author(s) and contributor(s) and not of MDPI and/or the editor(s). MDPI and/or the editor(s) disclaim responsibility for any injury to people or property resulting from any ideas, methods, instructions or products referred to in the content. |
© 2024 by the authors. Licensee MDPI, Basel, Switzerland. This article is an open access article distributed under the terms and conditions of the Creative Commons Attribution (CC BY) license (https://creativecommons.org/licenses/by/4.0/).
Share and Cite
Huang, Y.; Yang, S.; Fan, J.; Du, Z.; Lin, B.; Tu, Y.; Pan, L. Study of a Center Pipe Oscillating Column Wave Energy Converter Combined with a Triboelectric Nanogenerator Device. J. Mar. Sci. Eng. 2024, 12, 100. https://doi.org/10.3390/jmse12010100
Huang Y, Yang S, Fan J, Du Z, Lin B, Tu Y, Pan L. Study of a Center Pipe Oscillating Column Wave Energy Converter Combined with a Triboelectric Nanogenerator Device. Journal of Marine Science and Engineering. 2024; 12(1):100. https://doi.org/10.3390/jmse12010100
Chicago/Turabian StyleHuang, Yan, Shaohui Yang, Jianyu Fan, Zhichang Du, Beichen Lin, Yongqiang Tu, and Lei Pan. 2024. "Study of a Center Pipe Oscillating Column Wave Energy Converter Combined with a Triboelectric Nanogenerator Device" Journal of Marine Science and Engineering 12, no. 1: 100. https://doi.org/10.3390/jmse12010100