Article

Characterization of the Mechanical Properties of Low Stiffness Marine Power Cables through Tension, Bending, Torsion, and Fatigue Testing

1
Division of Marine Technology, Department of Mechanics and Maritime Sciences, Chalmers University of Technology, 41296 Gothenburg, Sweden
2
MAST Department, Université Gustave Eiffel, 44340 Bouguenais, France
3
MV Design, NKT (Sweden) AB, 79152 Falun, Sweden
*
Author to whom correspondence should be addressed.
J. Mar. Sci. Eng. 2023, 11(9), 1791; https://doi.org/10.3390/jmse11091791
Submission received: 25 August 2023 / Revised: 8 September 2023 / Accepted: 12 September 2023 / Published: 13 September 2023

Abstract

:
The exploitation and harnessing of offshore marine renewable energy have led to an increased demand for reliable marine power cables with long service lives. These cables constitute a considerable share of the total installation cost of offshore renewable energy facilities and have high maintenance and repair costs. The critical characteristics of these power cables must be determined to reduce the risk of exceeding their ultimate strength or fatigue life, which can result in unwanted and unexpected failures. This study investigates dynamic marine power cables that are suitable for application in devices that harness energy from ocean currents, waves, and tides. Tension, bending, torsion, and fatigue tests were conducted on three dynamic power cables (1 kV, 3.6 kV, and 24 kV) that have high flexibility, i.e., low mechanical stiffness. The specimen lengths and axial pretension force were varied during the tests. The results are discussed in terms of the mechanical fatigue degradation and ultimate design load, and the key observations and lessons learned from the tests are clarified. The study’s main contribution is the results from physical component testing of the dynamic marine power cables without metallic armors, which can be used to calibrate numerical models of this type of dynamic marine power cable in the initial design of, e.g., inter-array cables between floating wave energy converters. The benefits offered by this type of cable and the importance of the results for creating reliable numerical simulation models in the future are highlighted.

1. Introduction

In recent years, the increased focus on sustainable energy production has become a driving force for harnessing offshore renewable energy, including floating solar photovoltaic power plants, ocean currents, and offshore wind, wave, and tidal energy. Consequently, the use of marine power cables has evolved from merely supplying power to isolated offshore facilities to connecting offshore array systems comprising numerous inter-connected installations, resulting in a broader range of applications [1].
Marine power cables represent a considerable share of the total installation cost of offshore renewable energy facilities. For example, in an offshore wind farm, the power cables constitute up to 10% of the total cost [2]. In addition, there are high maintenance and repair costs, as well as replacement costs owing to cable failures. According to [3], the failure of marine power cables is one of the most common reasons for downtime in energy production from offshore wind turbines. For example, the data in [4] revealed that 80% of offshore wind installations in the UK experienced cable-related incidents that resulted in downtime, leading to annual losses of GBP 22.8 million. Therefore, there is significant concern regarding the reliability and long-term serviceability of marine cables [5,6,7]. Marine cables must withstand a vast dynamic loading regime when attached to moving floating structures, subjected to waves and current, and thus, they are susceptible to fatigue failures. Some examples of their application include connecting grids internationally [8], interconnecting wind turbine generators in offshore wind farms, and connecting wave energy converters (WECs) in wave parks.
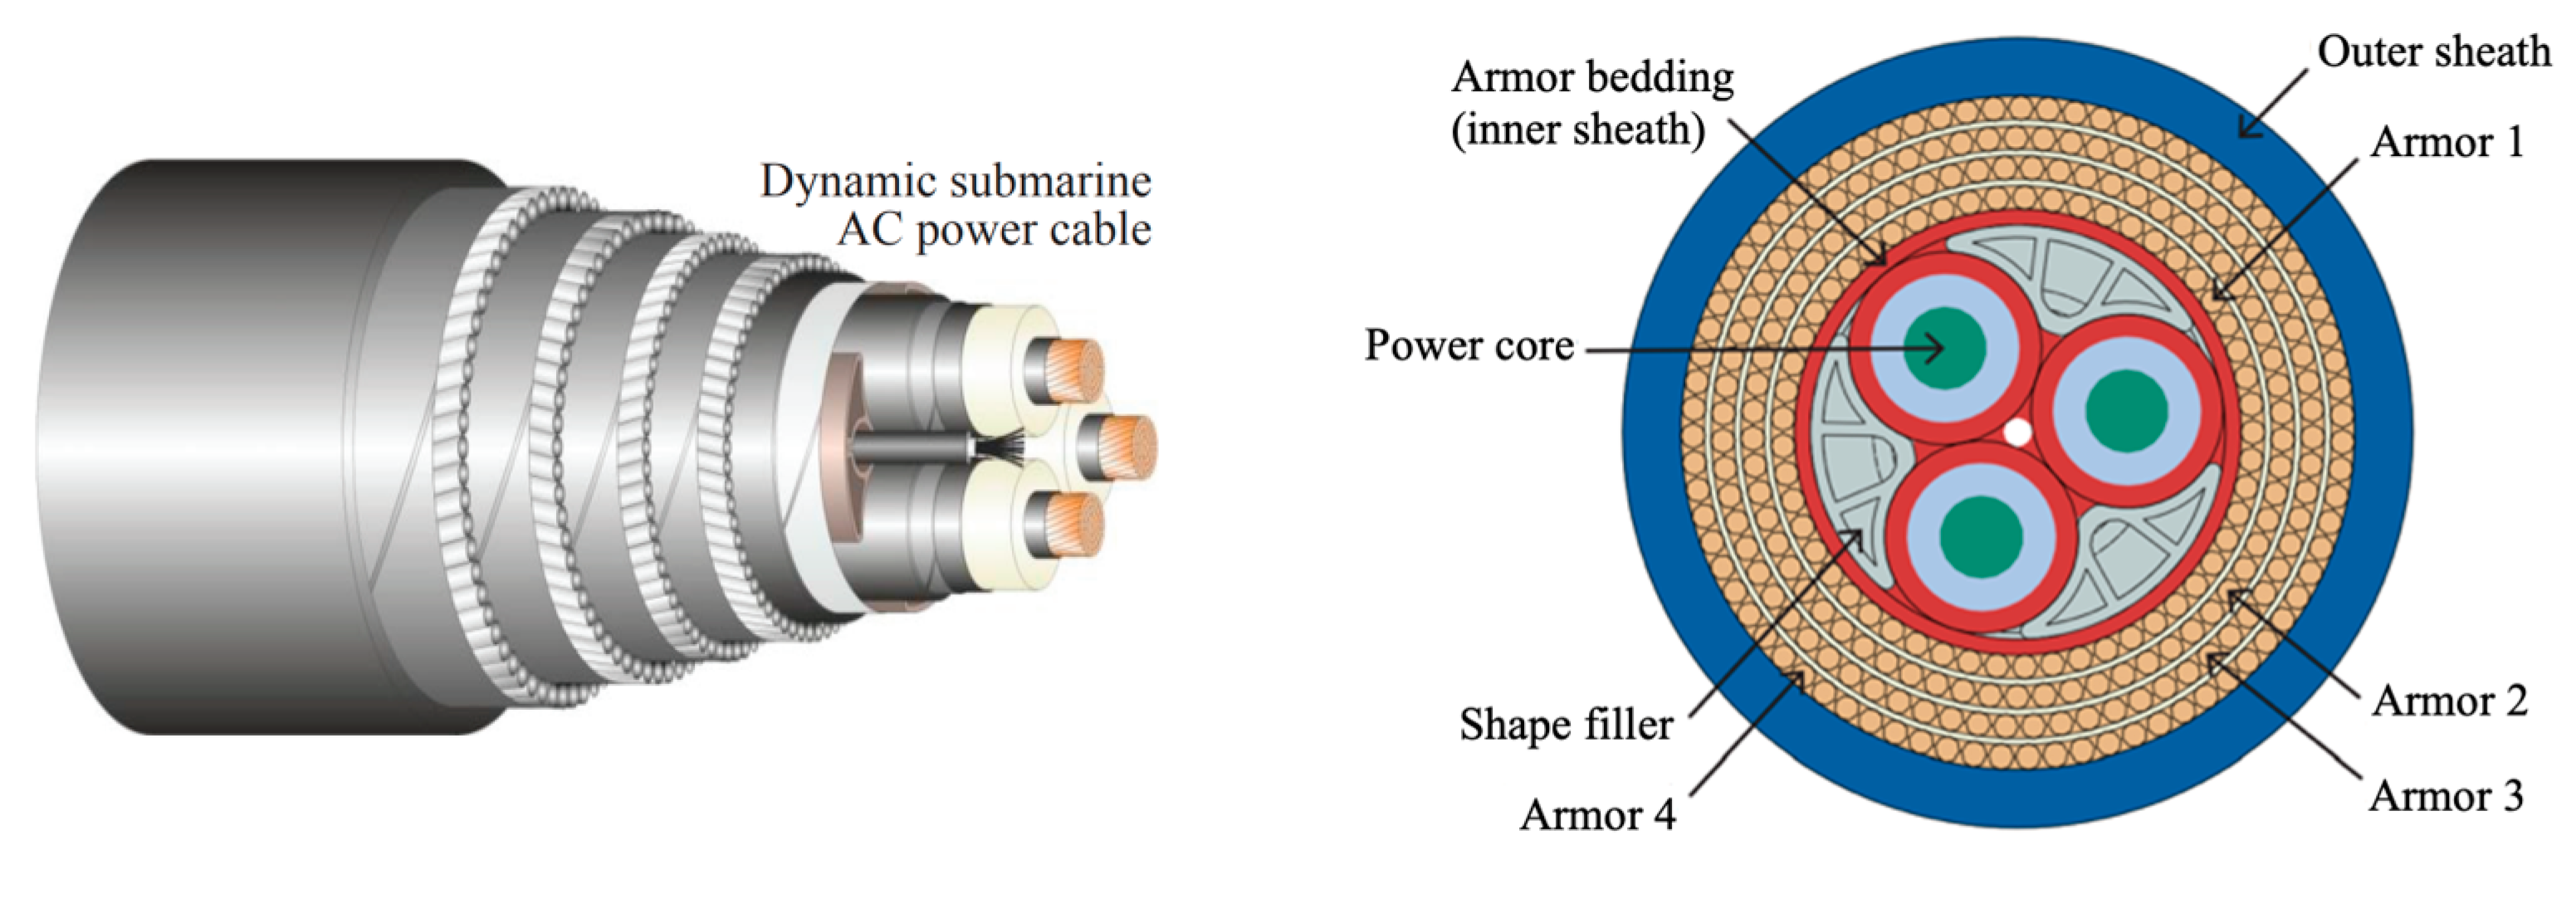
Based on their mechanical stiffness characteristics, marine power cables are typically divided into two categories: static and dynamic. Static power cables have high axial, bending, and torsion mechanical stiffnesses and are used for fixed installations offshore where the cable is placed on the seabed in a stationary condition. Dynamic power cables have significantly lower bending and torsion mechanical stiffnesses compared to static cables, i.e., they are more flexible, and therefore, they are more suitable for floating installations wherein the cable must be able to follow the installation’s motions. Trends indicate that the number of offshore renewable energy production farms will increase in the future; hence, reliable and cost-efficient designs must be developed for marine power cables [9]. For example, as offshore wind farms move into deeper waters with higher and steadier wind speeds and wave and tidal energy converters progress, the need for dynamic cables with high reliability and long-term serviceability will increase [10]. Therefore, to develop new dynamic marine power cables, a good understanding of their specific mechanical characteristics—especially the cable stiffness properties, which affect the motion-related flexibility and mechanical stress in the cable components, thereby influencing their mechanical lifetime—is essential for ensuring long-term serviceability [11].
This investigation focuses on dynamic marine power cables that are suitable for devices that harness energy from ocean currents, waves, and tides. To increase their economic viability, such devices are designed as groups of arrays [12]. Dynamic power cables transfer the generated electricity from each device to a central hub, from where it is transmitted ashore by a static cable. The dynamic cables must be able to withstand all the mechanical stresses that can occur during their manufacturing, handling, transport, installation, and operation. In contrast to static cables, the operating conditions of dynamic cables are extremely “dynamic” as the environmental loads and motions induced by the floating/moving device result in cyclic motions that induce mechanical stresses in the cable components; see Reference [11] for an example of a heaving point absorber wave energy converter. Numerical simulation models are important tools for designing, analyzing, and assessing a cable’s response and characteristics under the as-installed conditions in a virtual environment. However, to achieve a trustworthy and realistic simulation of the cable’s limit states (e.g., the ultimate and fatigue limit states), the verified mechanical properties of the cable must be included in the numerical model.
Power cables generally comprise a helically wound structure of cylindrical components and typically have a high tensile strength owing to a large axial stiffness. The bending and torsion stiffnesses are lower than the axial stiffness, which gives the cable desirable flexible properties. The cable’s flexibility can be attributed to sliding between its components. Owing to slip and stick phenomena between the components, together with fretting and two types of contacts, modeling the internal dynamics of cables with high accuracy is a significant challenge. The two types of contacts that occur within a cable are the inline and trellis (point) contacts. The inline contact occurs within each helical layer and between the core and the first helical layer, whereas the trellis contact occurs between the helical layers. A poor mechanical design may leave the cable vulnerable to damage, resulting in longer unavailability and higher repair costs [13].
The mechanical characteristics of power cables can be derived from a combination of theoretical and empirical models developed through years of experience; for an example, see [9]. Commercial software and numerical methods are used for developing the principal design of power cables by simulating the environmental loads applied on the floating offshore installations, as well as the resultant forces and stresses sustained by the connecting dynamic cables. In [9,14,15,16,17], the authors revealed that large uncertainties remain regarding the precise characterization of the forces acting on a cable structure and their effects on its stress and deformation. Many of these uncertainties are associated with the section properties and the fatigue characteristics of the cable [9,14,15]. Therefore, laboratory tests on dynamic cables are required to validate, verify, and calibrate the numerical approaches and models. Sharing the results of experiments on different types of cables is necessary to ensure the safe and reliable transmission of electricity from offshore installations ashore with long-term serviceability, which is essential to reduce the levelized cost of electricity (LCoE) from marine renewable energy harnessing devices.
Dynamic marine power cables on the market contain armor layers made of metallic materials. For floating offshore wind applications, they provide reliable mechanical protection, enabling installation and operation during rough conditions. They also provide mechanical properties that reduce the risk of structural integrity degradation if appropriately designed, such as fatigue, fretting, and wear caused by cyclic loading conditions from the cable’s motions. Many studies in the literature have presented results from numerical simulations and experiments of armored dynamic power cables [18,19,20,21,22,23]. Most of them emphasized bending-induced loading conditions and fatigue experiments since this loading mode causes wear and fretting damage to the cable’s parts and components. It was highlighted in [24] that there is a need to fully determine a cable’s mechanical properties for use in numerical models (such as an FE model). It was recommended that a cable’s global/component mechanical properties from tensile, bending, and torsion tests should always be determined. The recommendation was confirmed in the feasibility study of suspended inter-array cabling between floating offshore wind turbines presented in [25]. In their study, the bending radius of the cable design was critical for the cable installation, and to make reliable predictions using numerical models and simulations, not only the bending stiffness but also the axial and torsion stiffnesses are required to capture the motions of the cable correctly. In addition, reliability analyses of armored dynamic cables have been presented by [26,27,28,29], accounting for uncertainties in loads and geometric and material variables. Preliminary design of global cable configurations requires reliable data on design variables, e.g., mechanical stiffness properties in numerical models. It was highlighted by [28] that structured test programs with component testing are needed to reduce failure rate uncertainty, and free sharing of experimental data will benefit everyone.
This paper presents the results and observations of mechanical tests carried out on three dynamic marine power cables without metallic armor layers using the experimental facilities at the SMC/MAST laboratory in Université Gustave Eiffel (Nantes, France) as part of the EU-funded research project Seasnake (https://www.seasnake.eu; accessed on 8 September 2023). To the best of our knowledge, similar experimental data for determining the characteristics of such dynamic cables are not available in the literature. Therefore, an important goal of this study is to share the obtained test data with others to aid the design and structural performance analysis of marine power cables without metallic armor. The tested cables were part of an experimental testing program that compared reference marine cables available on the market against new innovative dynamic marine power cables without metallic armor layers. The testing program included tension, bending, torsion, and fatigue testing to determine the mechanical characteristics required by, among others, designers and researchers for simulating and analyzing the reliability of marine cables used in offshore marine renewable energy facilities. It was shown in [11] that the loading rate for marine power cables used for WECs is low. Hence, the tests presented in the current study were carried out at a low loading speed to exclude any influence from strain-rate effects on the cables’ mechanical properties. The literature review in [30] on the failure experienced by pipelines, risers, and umbilical cables revealed that the major failure modes observed in umbilical power cables occur under combinations of cyclic axial, bending, and torsion loads, which result in fatigue and wear.

2. Cables and Experiments

2.1. Dynamic Cables for Marine Renewable Energy Installations

This study focuses on low- and medium-voltage cables up to a maximum of 33 kV. These typical cables are AC cables, consisting of three power cores. The cores are helically wound with three non-metallic fillers to accomplish a circular circumference covered by sheaths. Each power core consists of a conductor made of copper or aluminum, typically covered by cross-linked polyethylene insulation (XLPE). The conductor is often stranded from round wires laid in helical layers around a center wire. Many dynamic marine power cables also contain armor layers made of metallic materials. These armor layers increase the axial, bending, and torsion stiffnesses of the cable’s cross-section. Figure 1 shows a traditional dynamic marine power cable from [31], wherein the authors numerically studied the cable’s mechanical behavior through 3D finite element simulations in which the cable was subjected to combined axial tension, radial pressure, and bending load conditions.
In this study, experiments were performed on three new dynamic marine power cables—1 kV, 3.6 kV, and 24 kV—featuring a novel design compared to that shown in Figure 1 (these cables will be used for floating installations wherein the cable must be able to follow the installation’s motions). The cables were developed and manufactured by NKT (https://www.nkt.com; accessed on 8 September 2023). The armor wire layers were removed to achieve more flexible characteristics. Removing the armor wires primarily reduces the cable’s bending stiffness, allowing the cable to follow, for example, the motions of a wave energy converter heaving point absorber without negatively affecting its motion [11]. Another advantage of removing the armor is that the cable is easier to handle during installation and maintenance compared to other cable designs. To ensure sufficient axial tensile strength, the conventional shape fillers were replaced by aramid fiber ropes with an elastic modulus of 110 GPa.
Figure 2 shows photographs and schematics of the 3.6 kV and 24 kV cables. A detailed discussion of the 3.6 kV cable design and its components’ materials is available in [15]; the 1 kV and 24 kV cables have similar designs and materials as the 3.6 kV cables, but their designs are not presented herein as they are confidential. Compared to the 1 kV and 3.6 kV cables, the 24 kV cable has six screen wires placed outside the insulations to provide an electrical fault-carrying capability.
Table 1 presents the basic dimensions of the cables. All three cables have three copper conductors. The 1 kV and 3.6 kV cables have a thermoplastic elastomer (TPE) for insulation, whereas the 24 kV cable uses an XLPE insulation material. All three cables have sheaths made of polyurethane and have the same aramid type of fibers instead of fillers.
Simulation tools and computer codes based on cable mechanics theory can be used to determine the cross-section and other cable characteristics; see [15] for an example of this approach. These values are required for finite element simulations wherein, for example, the motion responses and fatigue performance of a cable connected to a floating offshore structure are studied and evaluated [11,14,15]. Experiments on the cable components and the cable as a whole are important for calibrating numerical models and for verifying that the numerical model has the “expected” axial, bending, and torsion stiffnesses. Otherwise, the ultimate strength and fatigue assessments obtained from the numerical simulations will be unreliable owing to erroneous results. Unfortunately, the results from such experiments are often not publicly available. The subsequent section and the remainder of this paper present the results from such experiments carried out on the three cables introduced in this section.

2.2. Description of Experiments

Three static tests were performed on full cable test samples to determine the axial stiffness (EA), bending stiffness (EI), and torsion stiffness (GKv). A full cable specimen consists of many components, and the purpose of the tests was to obtain the cables’ global mechanical characteristics. Hence, reaction force–load cell displacement, reaction force–punch displacement, and reaction torque–twisting angle curves present these tests’ results.
A type of fatigue test was conducted to investigate the cables’ performance under cyclic loading conditions and determine the potential design-critical failure modes. Axial and bending tests were carried out with three different specimen lengths to investigate the influence of the lay length ratio on the results. A torsion test was carried out considering three magnitudes of the axial pretension force to study the effect of axial tensile loading on the torsion stiffness.

2.2.1. Tension Test

The tension tests were carried out using an Instron hydraulic tension test rig according to the procedure recommended by CIGRE [32]. Different load cells (250–2500 kN) were used to test the cables depending on the required capacity for the tests. Three cable lengths—400 mm, 600 mm, and 800 mm—were tested for each cable type and each test was repeated five times. Thus, a total of 45 tension tests were conducted.
The test was displacement-controlled and carried out at a low speed with a loading rate of 5 mm/min. The load cell recorded the reaction force in the test sample, and the elongation was measured using two systems—the change in distance between the grips and an image correlation measurement system supplied by ZwickRoell using non-contact video extensometers. The results recorded by the two systems were compared to ensure that there was no slip in the grips or the internal components. The grip preparations are discussed below.
The sampling frequency of the recordings was 50 Hz. Initial tests revealed that owing to the large axial stiffness of the tested cables, the standard grip devices could not offer sufficient clamping force, resulting in slippage. Therefore, a custom fixture was developed to ensure that all cable components were pulled during the test without slipping. The preparation of the grip is shown in Figure 3. Each end of the cable was prepared in four steps: (1) the outer sheath was removed and a knot was made using the aramid fiber ropes; (2) a metallic tube was placed over the exposed cable components and knot (with some of the sheath enclosed by the tube); (3) the tube was filled with a liquid expansion cement; (4) the cement was left to harden and cure over at least 4 h. Image (5) shows a close-up of the final result.
Figure 4 shows a photograph of a cable installed in the test rig before the test. It also shows a typical reaction force–load cell displacement curve, which is used to calculate the axial stiffness in the linear part of the curve according to the expression EA = kEAL, where kEA is the slope of the curve and L is the effective length of the test specimen between the fixtures. Fmin,linear and Fmax,linear represent the magnitudes of the reaction force when the reaction force–load displacement exhibits an apparent linear behavior. The nonlinear behavior below Fmin,linear is due to initial settlements and cable stretching in the early phase of the test, whereas forces larger than Fmax,linear are attributable to permanent/irreversible damage (e.g., plastic deformation, change in contact conditions between the cable’s components), which results in nonlinear behavior.

2.2.2. Bending Test

Three-point bending tests were carried out using an Instron hydraulic machine rig with a 2.5 kN load cell according to the procedure recommended by CIGRE [32], as shown in Figure 5. Each cable type was tested with three different specimen lengths between the rollers—400 mm, 600 mm, and 750 mm—and each test was repeated five times. Thus, a total of 45 bending tests were carried out.
The radii of the rollers and punch were 50 mm. The punch was pushed against the cable specimen exactly in the middle (i.e., symmetrically) between the two rollers. The test was displacement-controlled and carried out at a low speed with a loading rate of 5 mm/min. The load cell recorded the reaction force, and the machine recorded the displacement of the punch. The sampling frequency of the recordings was 50 Hz.
Figure 5 shows a typical reaction force–punch displacement curve obtained from a bending test. It is used to calculate the bending stiffness in the linear part of the curve using the expression EI = kEIL3/48, where kEI is the slope of the curve and L is the distance between the two rollers. Rmin,linear and Rmax,linear represent the magnitudes of the reaction force when the reaction force–punch displacement exhibits an apparent linear behavior. The nonlinear behavior below Rmin,linear is due to initial settlements and cable bending during the initial phase of the test, whereas forces larger than Rmax,linear are due to permanent damage in the punch–cable contact, which results in nonlinear behavior.

2.2.3. Torsion Test

Torsion stiffness measurement tests were conducted using an Instron hydraulic machine rig with a 250 kN load cell according to the procedure recommended by CIGRE [32], as shown in Figure 6. Each test specimen corresponding to each cable type had a length of 3610 mm. Three axial pretension forces of 2 kN, 4 kN, and 9 kN were tested, and each test was repeated five times. Thus, a total of 45 torsion tests were carried out.
One end of the cable was fixed, whereas the other loaded end was twisted (rotated). The test was twist-angle-controlled and carried out at a low speed with a loading rate of approximately 60°/min in the clockwise direction (i.e., positive direction of the helical angle). The load cell recorded the reaction moment, and the machine recorded the twisting angle of the loaded end. The sampling frequency of the recordings was 50 Hz.
Figure 6 shows a photograph of the cable installed in the test rig and a typical reaction torque–twisting angle curve obtained from the torsion test. The curve is used to calculate the St. Venant torsion stiffness in the linear part of the curve using the expression GKv = kGKvL, where kGKv is the slope of the curve and L is the length of the cable specimen. Tmax,linear and Tmin,linear represent the reaction torques used to define the linear part of the curve. At these points, the recorded axial force in the cable was measured and denoted as Pmax,linear and Pmin,linear, respectively. Furthermore, as shown in the figure, some parts of the curve correspond to a nonlinear response. However, the torsion stiffness that is of interest in this study occurs during the initial phase (0–360°) of the test, which corresponds to relatively linear behavior, as shown in Figure 6. It should be noted that the St. Venant stiffness is lower when the cable is twisted back in the clockwise direction.

2.2.4. Fatigue Test

The fatigue tests were conducted using an Instron hydraulic machine rig. The tests were carried out as combined traction-three-point bending fatigue tests according to the procedure recommended by DNV [33,34]; an illustration of the test setup is shown in Figure 7. The total length of the as-installed cable was 17.5 m. In the middle of the cable, two supports 2.5 m apart were positioned symmetrically. In the middle of these supports, preformed templates with a given radius that controls the bending radius were connected to a vertically moving hydraulic cylinder to achieve the three-point bending fatigue test. The bending radius used in the machine can vary from 3.5 m to 35 m, and the axial pretension force can vary from 1 kN to 10 kN. The test was displacement-controlled, and the test frequency of the vertical displacement was set to 0.5 Hz. This ensured that there was no temperature increase in the cable specimens with the preformed template at the point of contact where the bending occurred. In this type of fatigue test, different R-ratios can be tested using preformed templates of different radii on different sides of the cable specimen. In this study, R = −1 was tested, i.e., preformed templates with the same radius were used on both sides.
The three cables were tested with a 4 kN axial pretension force and a 1.1 m bending radius. The displacement amplitude of the vertically moving hydraulic cylinder was 120 mm (from −60 mm to 60 mm, i.e., R = −1). These values were chosen to fulfill the conditions of umbilical stress-based fatigue tests, i.e., a service fatigue limit state condition and not an extreme fatigue limit state condition that may occur during storms.
The optical fiber inside the cables was used as a sensor by monitoring the changes in the fiber’s conductivity (i.e., the transmission of light signals) during the test using an optical time-domain reflectometer (OTDR). Table 2 presents the number of fatigue tests and the load cycles for each cable. Owing to the low testing frequency used in this study, the number of tests and load cycles was limited. After the tests, the cable specimens were dissected to analyze the internal damage and failures due to wear, fretting, and fatigue.

3. Results

3.1. Tension Tests

The results corresponding to the linear part of the tension tests on the 1 kV, 3.6 kV, and 24 kV cables are summarized in Table 3, Table 4 and Table 5. The calculated values are based on five completed tests on three different lengths of each cable; EA, Fmin,linear, and Fmax,linear are defined in Figure 4. Each test specimen was carefully inspected after the test was completed to ensure that the grips at both ends clamped all the cable components, i.e., to ensure that there was no slip at the grips or among the individual cable components. This was achieved through ocular inspection of markers made on the specimens before the tests and by analyzing the force–displacement curve obtained from the test; see Section 2.2.1. Consequently, the results listed in Table 3, Table 4 and Table 5 are only those of successfully completed tension tests.
The cable length appears to have a minor influence on the results, which is especially evident for the 24 kV cable. The axial stiffness, EA, increases with the increase in the cable length, whereas the peak force in the linear region, Fmax,linear, decreases. This observation is related to the lay lengths and test specimen lengths. The 1 kV and 3.6 kV cables exhibited relatively similar results. This was expected because of the small difference in their principal dimensions (see Table 1) and because they have the same cable components. In contrast, the 24 kV cable has a larger diameter with additional cable components. The tension test results reveal that the 24 kV cable had the least axial stiffness among the tested cables but the highest Fmax,linear value. In contrast to the 1 kV and 3.6 kV cables, the value of Fmax,linear increased with increasing test specimen length for the 24 kV cable. The reason for this could not be explained.
All the cable specimens were pulled until they reached their breaking load, the grips could no longer sustain the axial load, or the displacement exceeded the limit value of the test machine. Figure 8 shows the typical results obtained from the tension tests for a cable length of 600 mm. The reaction force–load cell displacement curves for the 1 kV and 3.6 kV cables are initially similar; the subsequent variation corresponds to the breakage of the aramid fiber ropes in the 3.6 kV cable. For the 1 kV cable, the first aramid fiber rope generally broke at a significantly higher displacement and often just before the test had to be interrupted due to the large displacement. The 24 kV cable exhibited much less elongation compared to the other cables. Although its peak force was higher, its resistance to elongation was significantly low. Figure 8 clearly shows how the aramid fiber ropes in the 24 kV cable successively failed within a narrow displacement window between the first and last aramid fiber rope failures. In comparison, the corresponding displacement window was significantly larger for the 3.6 kV cable, and the drop in the ultimate load was not as large as that in the 24 kV cable. To conclude, the tension tests revealed that the aramid fiber ropes are essential to the cables’ structural integrity; the ultimate axial load capacity is defined as the axial load corresponding to the failure of the first aramid fiber rope.

3.2. Bending Tests

The results corresponding to the linear part of the bending tests on the 1 kV, 3.6 kV, and 24 kV cables are summarized in Table 6, Table 7 and Table 8. The calculated values are based on five completed tests on three different lengths of each cable; EI, Rmin,linear, and Rmax,linear are defined in Figure 5. The EI values of the 1 kV and 3.6 kV cables have the same order of magnitude and these values are minorly influenced by the specimen length. In contrast, the 24 kV cable has the highest bending stiffness among the tested cables and its bending stiffness increases with the increase in the specimen length. One reason for this higher bending stiffness is the larger cross-section area of the 24 kV cable and the thick screen layer used in its design to protect it against energy dissipation (i.e., transmission line loss).
Figure 9 shows the typical results obtained from the bending tests, considering a cable length of 600 mm. The curves of the reaction force–punch vertical displacement in the middle of the test specimens between the supports are similar for the 1 kV and 3.6 kV cables, whereas that of the 24 kV cable exhibits significantly higher bending stiffness characteristics.

3.3. Torsion Tests

The torsion tests were carried out using a cable specimen length of 3610 mm. The results corresponding to the linear part of the tests are presented in Table 9, Table 10 and Table 11. The calculated values are based on five completed tests on each cable at the three different values of the axial pretension force. The definition and calculation of the listed parameters are given in Section 2.2.3. The results verify the typical characteristic of umbilical cables—the St. Venant torsion stiffness increases with the increase in the axial pretension force.
Figure 10 presents examples of the representative reaction torque–twisting angle curves for the three cables, considering a 4 kN axial pretension force. The 1 kV and 3.6 kV cables exhibit similar behavior, whereas the 24 kV cable has a significantly higher torsion stiffness than the other two cables. The figure also presents the corresponding axial reaction force–twisting angle curves for the tests.

3.4. Fatigue Tests

The fatigue tests were designed and carried out in accordance with the discussion in Section 2.2.4. The tests were first performed on the 1 kV cable, followed by the 3.6 kV cable, and finally, the 24 kV cable. The fatigue tests on the 1 kV cable were run for 2,000,000 load cycles. The fiber optics sensor did not record or indicate any internal damage or fractures due to wear, fretting, and fatigue inside either of the two test samples. The fatigue tests were continued on the 3.6 kV cable with the same outcome—no recordings or indications of internal damage or fractures. The 1 kV and 3.6 kV cable samples were dissected before the fatigue tests were performed on the 24 kV cable.
Figure 11 shows photographs of a dissected 3.6 kV cable. The outer sheath has been removed in the photographs. An ocular inspection of the cable’s components was performed to search for potential damage in the insulation material. No visible damage was found in either the 1 kV or 3.6 kV cables. The fiber optic sensors and aramid fiber ropes were intact. Subsequently, all the conductors were dissected, and their insulation materials were removed. The wires of all the conductors were intact along the length of the cable except for the region wherein there was contact between the cable and the preformed templates (hereafter referred to as the “contact zone”). In this region, all the conductors had several conductor wire failures and wear debris due to combined fretting and fatigue damage leading to fracture. We concluded that this wear–fretting–fatigue failure was related to the fatigue test procedure and setup and is unlikely to occur in real installations of this type of cable considering its intended use. Therefore, an alternative and more suitable fatigue test setup should be developed and used in future studies.
The fatigue tests on the 24 kV cable were run on the same test rig and carried out in the same manner as those on the 1 kV and 3.6 kV cables despite the known shortcomings of the fatigue test setup. This is because it was deemed too late in the project to make significant changes in the fatigue test setup and no viable simple adjustments could be identified. However, as the fiber optics sensor could not be used to monitor the internal damage, we decided to divide the number of load cycles into three levels before interrupting the test. Doing so allowed us to observe the development of the internal damage with the increase in the number of load cycles through ocular inspection of the dissected cables.
The dissected 24 kV cables revealed damage in the cables’ components only in the contact zone; the fiber optics sensor did not record this damage in any of the tests. The dissected cables revealed that some wires of the conductors in the contact zone fractured at the least number of load cycles, which is similar to the observations made for the 1 kV and 3.6 kV cables. As the number of load cycles increased, a larger proportion of the wires in the conductors fractured. For the highest number of load cycles—1,000,000—the aramid fiber ropes were also damaged, as shown in Figure 12.

4. Discussion

The 1 kV cable tested in this study has several similarities in its cable design with the 1.2 kV cable studied by the lead author in [11,15]. The two major differences between these two cables are the difference in the lay angle and the lack of a fiber optic cable in the center of the 1.2 kV cable. Comparing the mechanical stiffnesses—EA, EI, and GKv—of the two cables, the 1 kV cable generally has higher axial and torsional stiffnesses, whereas the 1.2 kV cable has a higher bending stiffness. The differences between these values are statistically reliable and can be attributed to the differences in the cables’ designs.
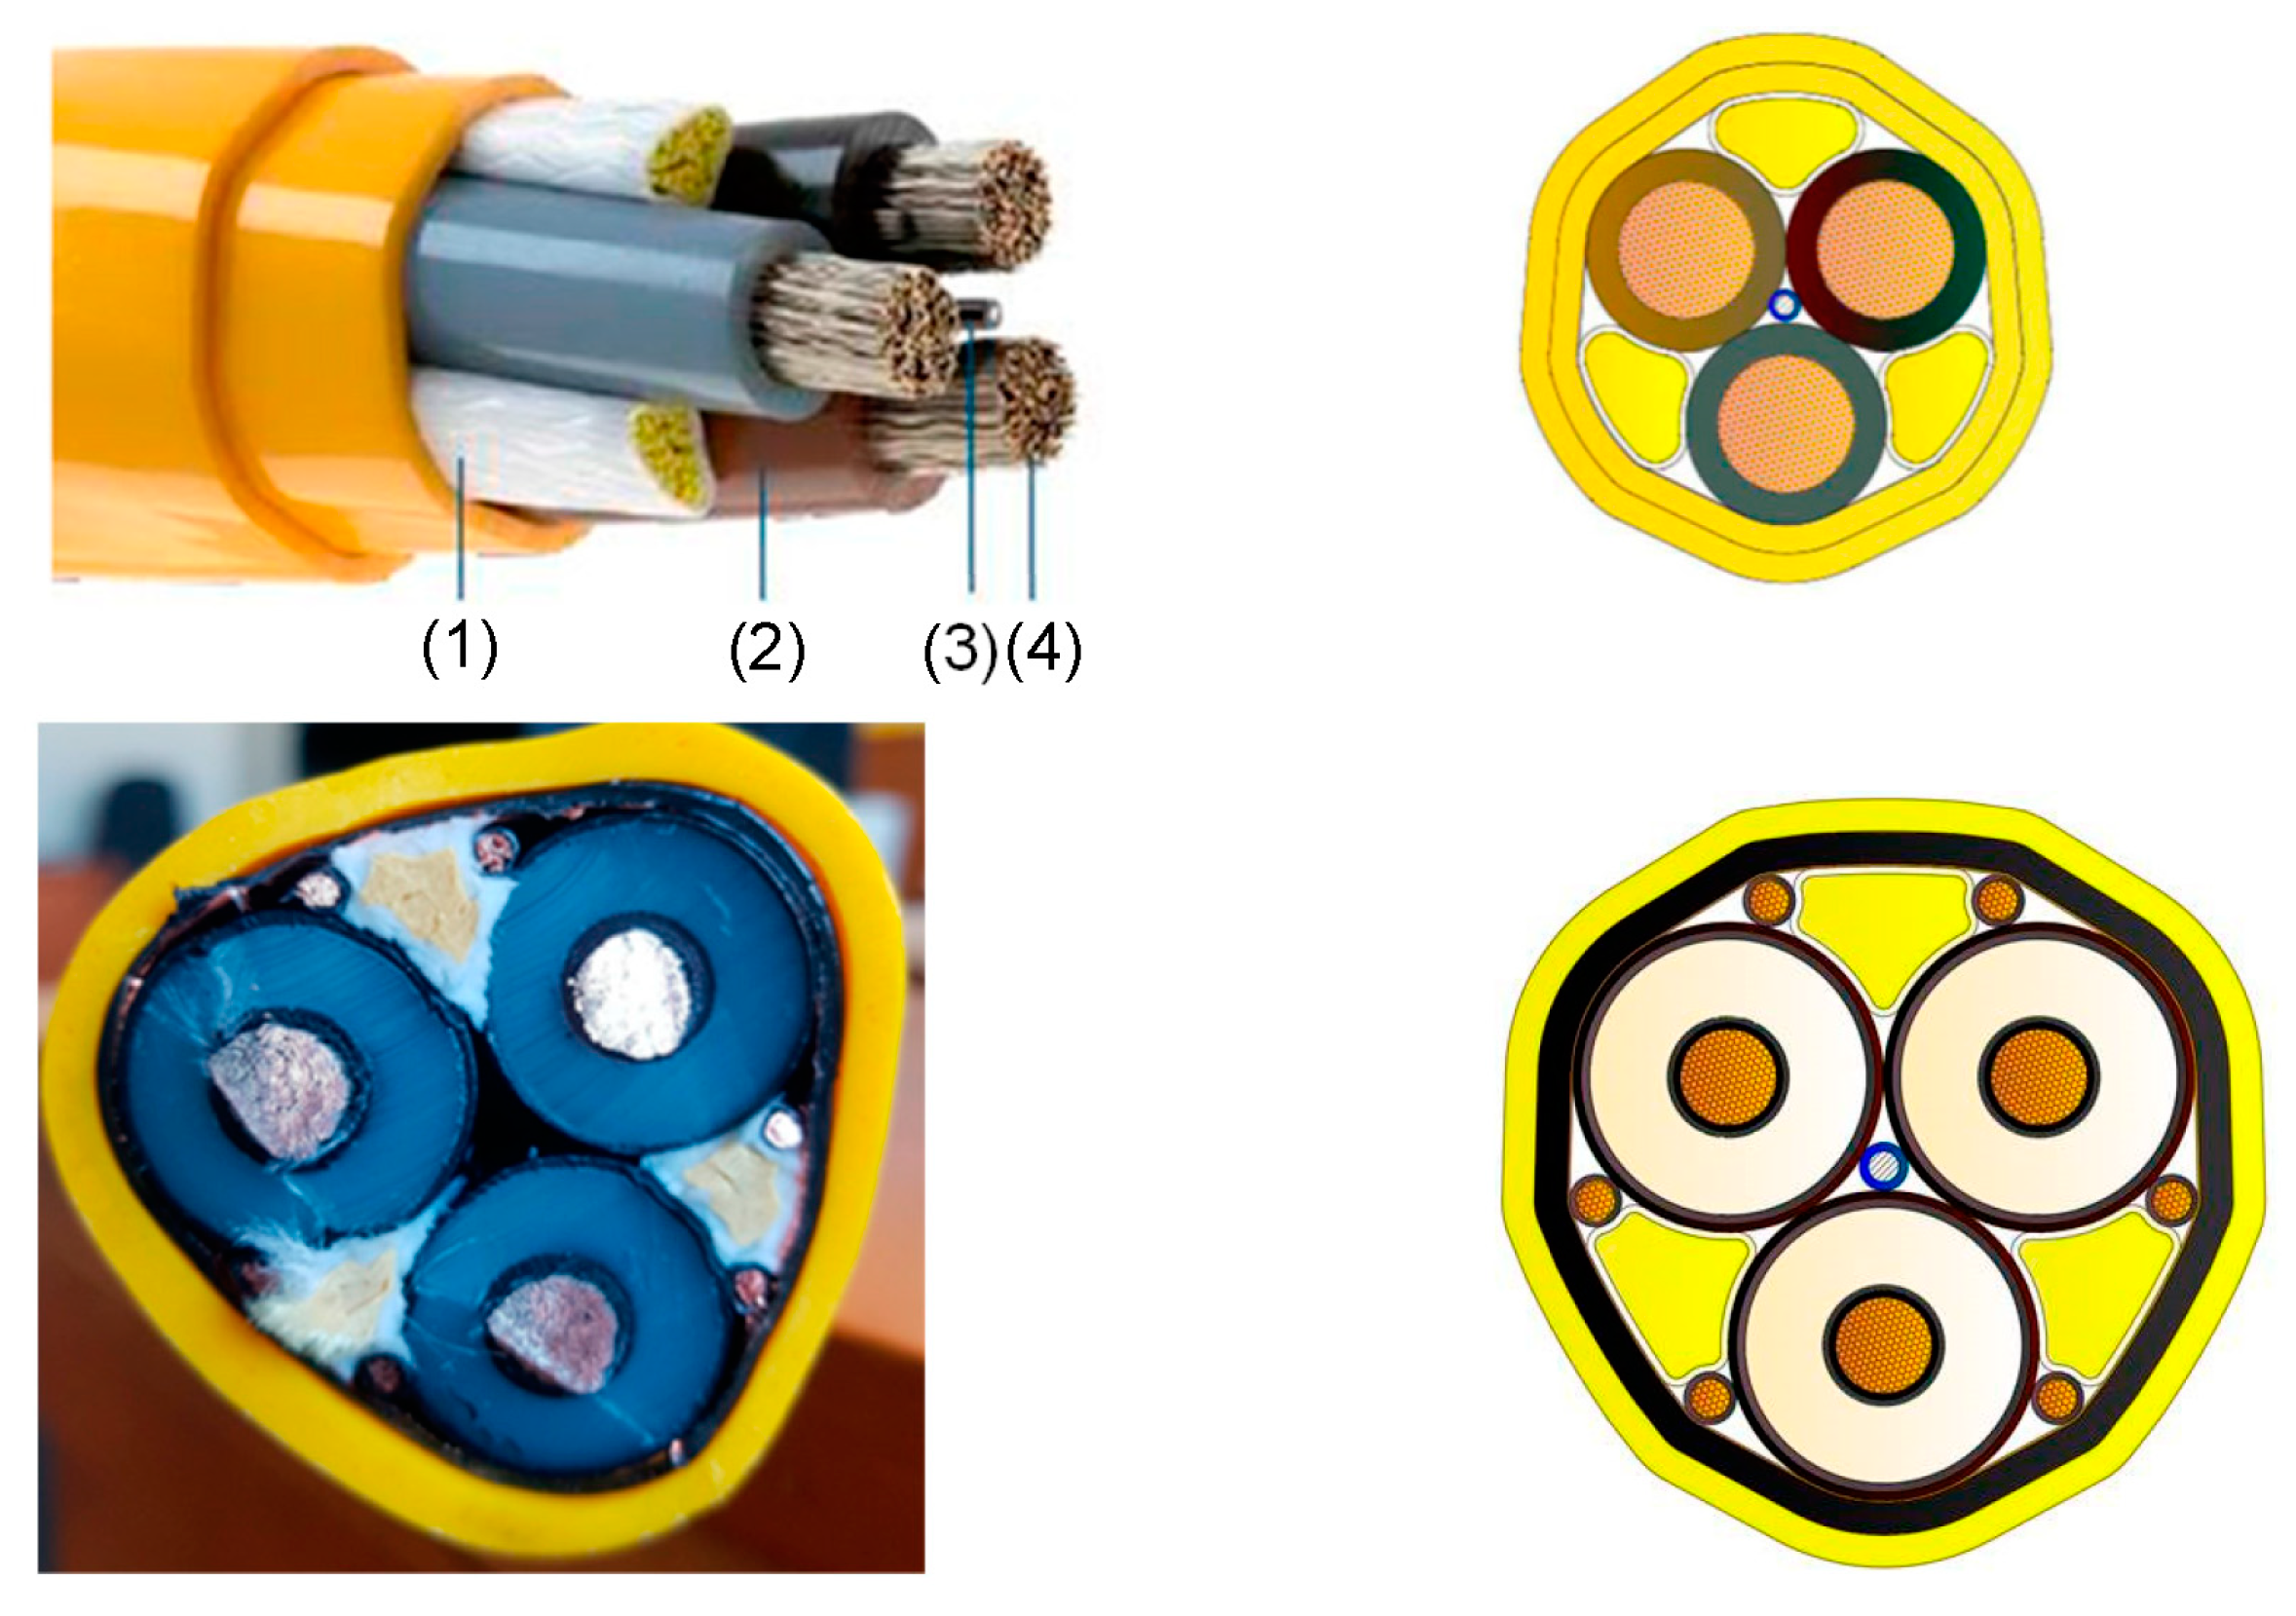
The three cables presented and tested in this study have unconventional designs compared to most dynamic marine power cables. Typically, marine power cables have armor layers made of metallic materials, whereas the cables in this study lack such metallic armor. The aramid fiber ropes substitute the metallic armor layers, and by integrating them into the helically wound cable structure, they simultaneously contribute to sufficient mechanical stiffness and flexibility. The test results indicate that this cable design will be necessary for future offshore installations of devices harnessing marine renewable energy, which require dynamic power cables.
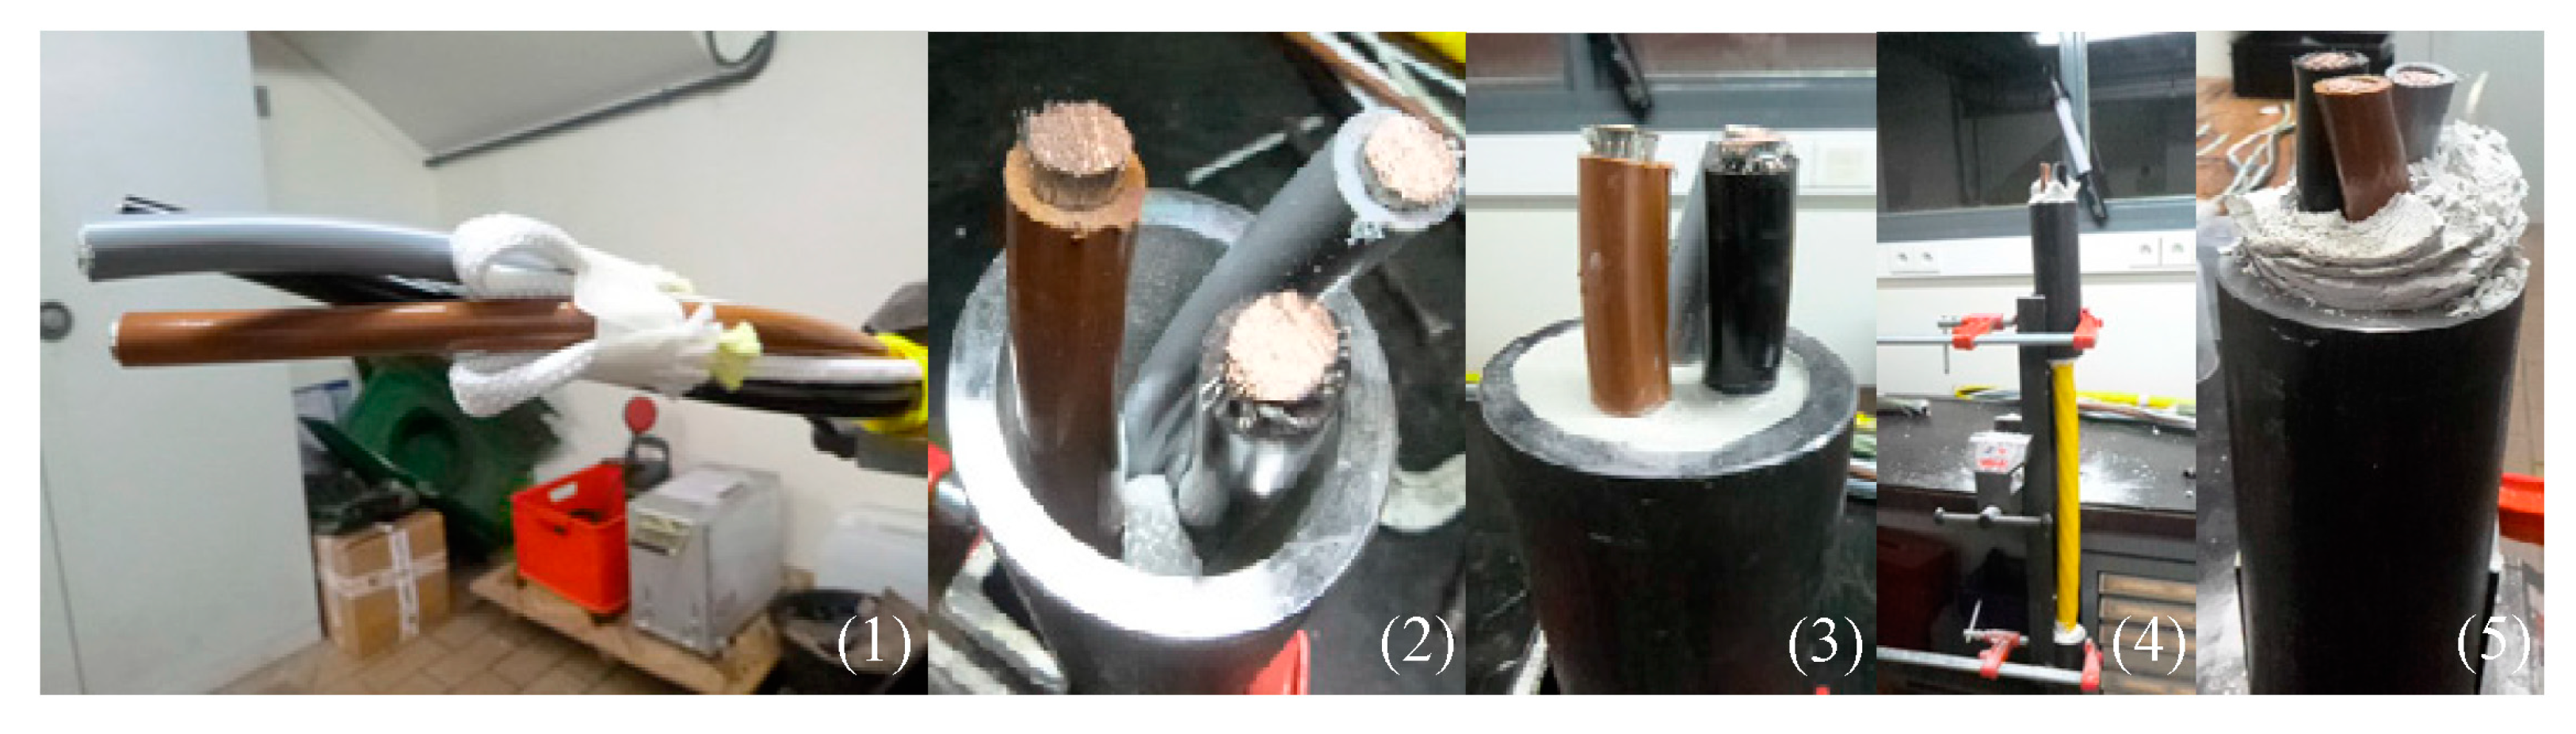
All three cables have a fiber optic cable in their centers to meet the technical requirements of dynamic marine power cables. Before the tension, bending, torsion, and fatigue tests were carried out on the whole cable specimens, separate mechanical tests were conducted on the individual fiber optic cables. The primary purpose of these tests was to obtain the mechanical properties of the fiber optic cables to determine whether they could be used as sensors in the fatigue tests. The results from the fiber optic cable tests revealed that their ductility and flexibility characteristics were sufficient to avoid damage during the cyclic loading of the fatigue tests. Unfortunately, as discussed in Section 3.4, the measurement approach described in Section 2.2.4 failed to capture the mechanical degradation (wear, fretting, and fatigue) observed during the ocular inspection of the dissected cables.
The results of rotational–bending tests on a similar 1.2 kV cable were presented in [16]. In that study, the authors designed a test procedure to perform fatigue tests on umbilical cables at 2 Hz to allow fatigue testing with a large number of load cycles in a short time. The setup allowed a variation in the bending radius of the cable but did not include an axial pretension force. During the tests, the cable’s conductors were connected to measuring equipment that measured the electrical conductivity and temperature on the surface of the cable at three points in the middle of the cable. After each test, the cable was dissected for a detailed analysis of its mechanical degradation. Each test was run until a predefined interruption criterion—a 15% drop in electrical conductivity—was reached or after a given number of load cycles (8.6 million) were completed, in which case the test was judged as a run-out test. Similar to the experimental results obtained in the present study, the measurement method used in [16] faced challenges in indicating and monitoring the mechanical degradation inside the cables. The dissected cables exhibited damage to the conductors’ wires—a combination of wear, fretting, and fatigue damage that could not be differentiated. Although the ocular inspection of the dissected cables showed a complete separation of a large proportion of the conductors’ wires, the electrical conductivity of the cable was only marginally affected.
Fretting and wear damages to the conductors’ wires, caused primarily by cyclic bending loads, have been recognized as a challenge for marine cables with metallic armor [18,19,20,21,22,23]. The current study showed that this is also challenging for marine cables without metallic armor. Due to their high flexibility (low bending stiffness), fretting and wear will dominate the structural degradation of the conductors’ wires. More research is needed to cope with this advanced contact mechanics problem to reduce the internal damage to the power cables and offer long-lasting, reliable cable designs without metallic armor.
The results of the tests conducted in this study may be used by scholars to develop numerical simulation models of offshore installations that harness marine renewable energy. As described in Section 1, marine power cables are a vital component of such installations; therefore, they must be considered as important as all the other components and modeled and designed accordingly. The test data and results of the three cables are required to describe and model the cable’s characteristics and structural response in finite element models. As such information is scarce in the available literature for marine cables without metallic armor, the results presented herein can contribute to further developing new cables and analyzing their properties. Moreover, the results can form a basis for parameter sensitivity studies in cable structural response assessments to develop or propose new cable designs. They may also be used to redesign cable connections (e.g., bending restrictors) or to identify positions between the cable connection locations that may require submerged floaters to create lazy-Z structures below the sea surface, thereby reducing the axial forces and cable motions that can affect the long-term fatigue life of the cable.

5. Conclusions

Dynamic marine power cables without external metallic armor have been developed in recent years for offshore installations of floating devices that harness renewable energy. The armor is replaced by mechanically strong synthetic aramid fiber ropes that are integrated into the cable’s helically wound structure to simultaneously provide the required mechanical stiffness and flexibility. These types of cables have several advantages for application in cable systems in offshore installations comprising several devices. Such cables are mainly applied as free-hanging cables below the sea surface that do not make contact with the seabed. A proper cable design with suitable mechanical characteristics can provide cost-efficient solutions with lower installation, maintenance, and repair costs compared to other types of cables with metallic armor.
The study’s main contribution is the results from conducted mechanical tests on marine cables without external metallic armor, which are scarce in the literature. The results can be used to calibrate numerical models of this type of dynamic marine power cable in the initial design of, e.g., inter-array cables between floating wave energy converters.
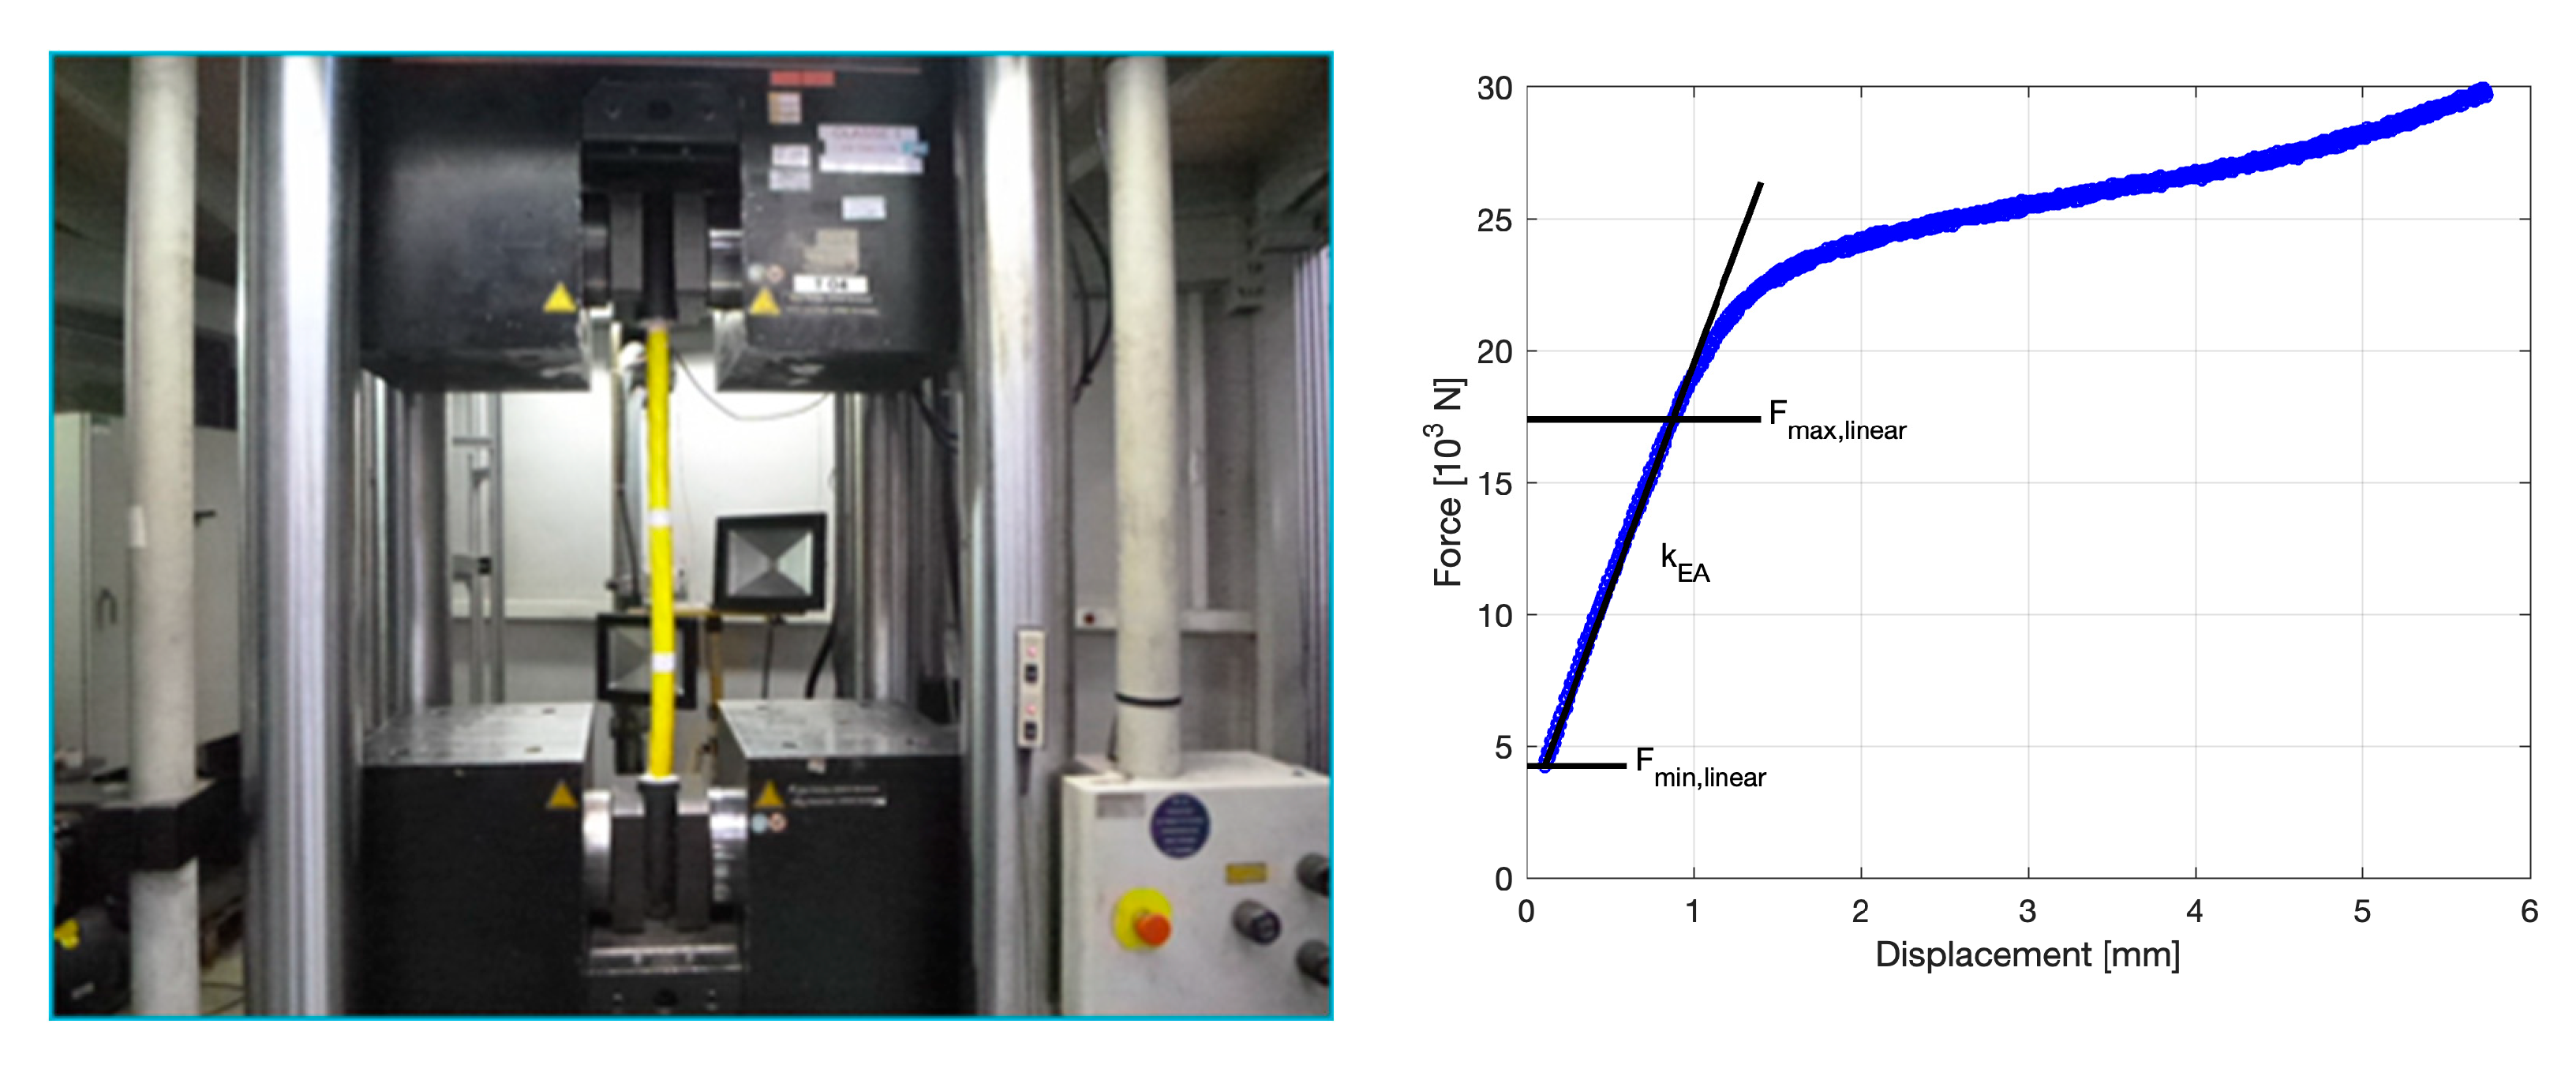
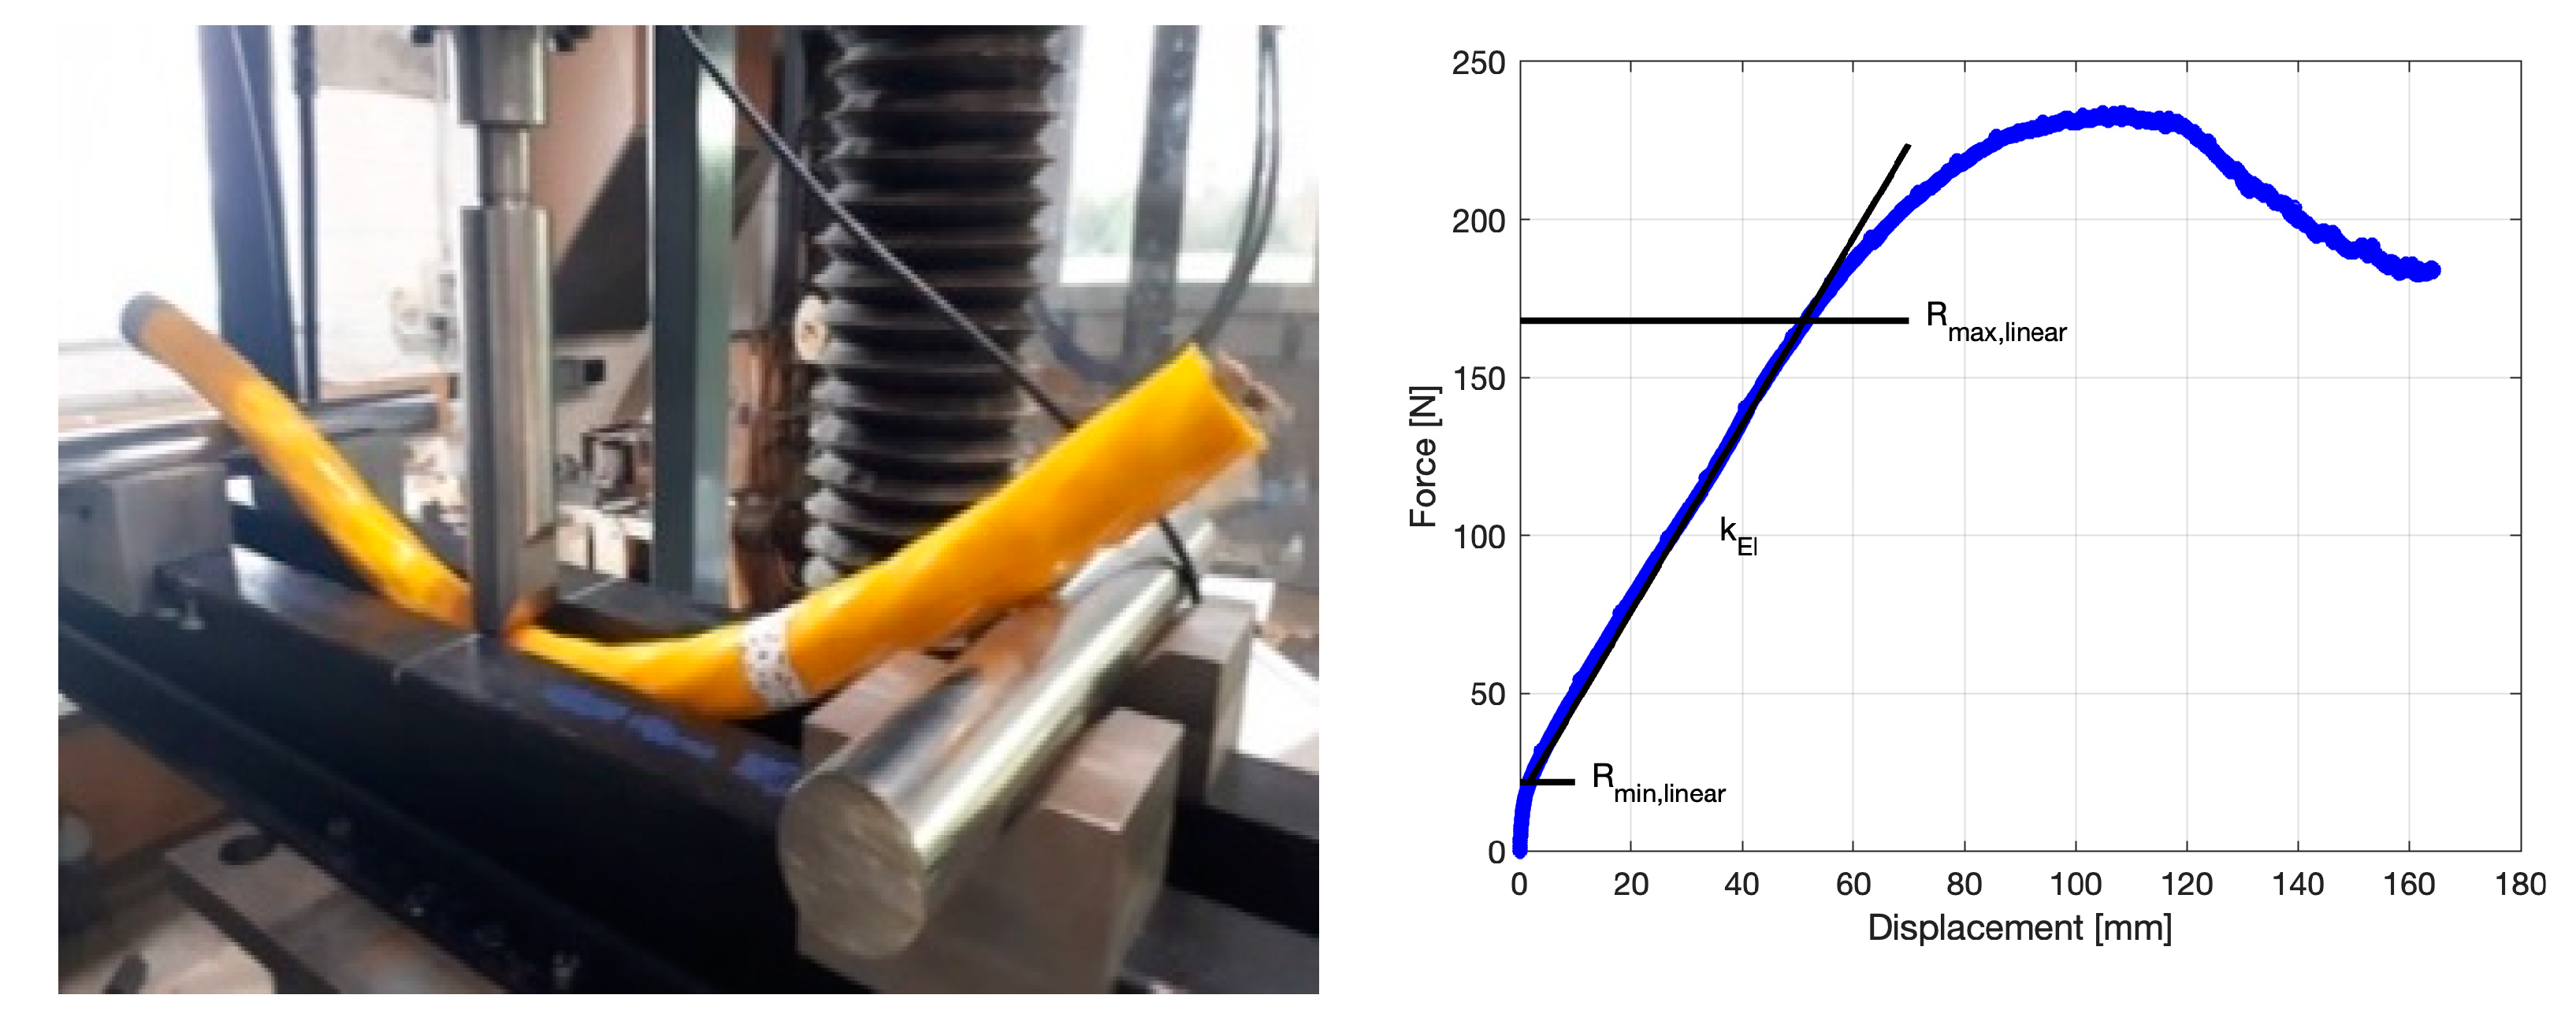
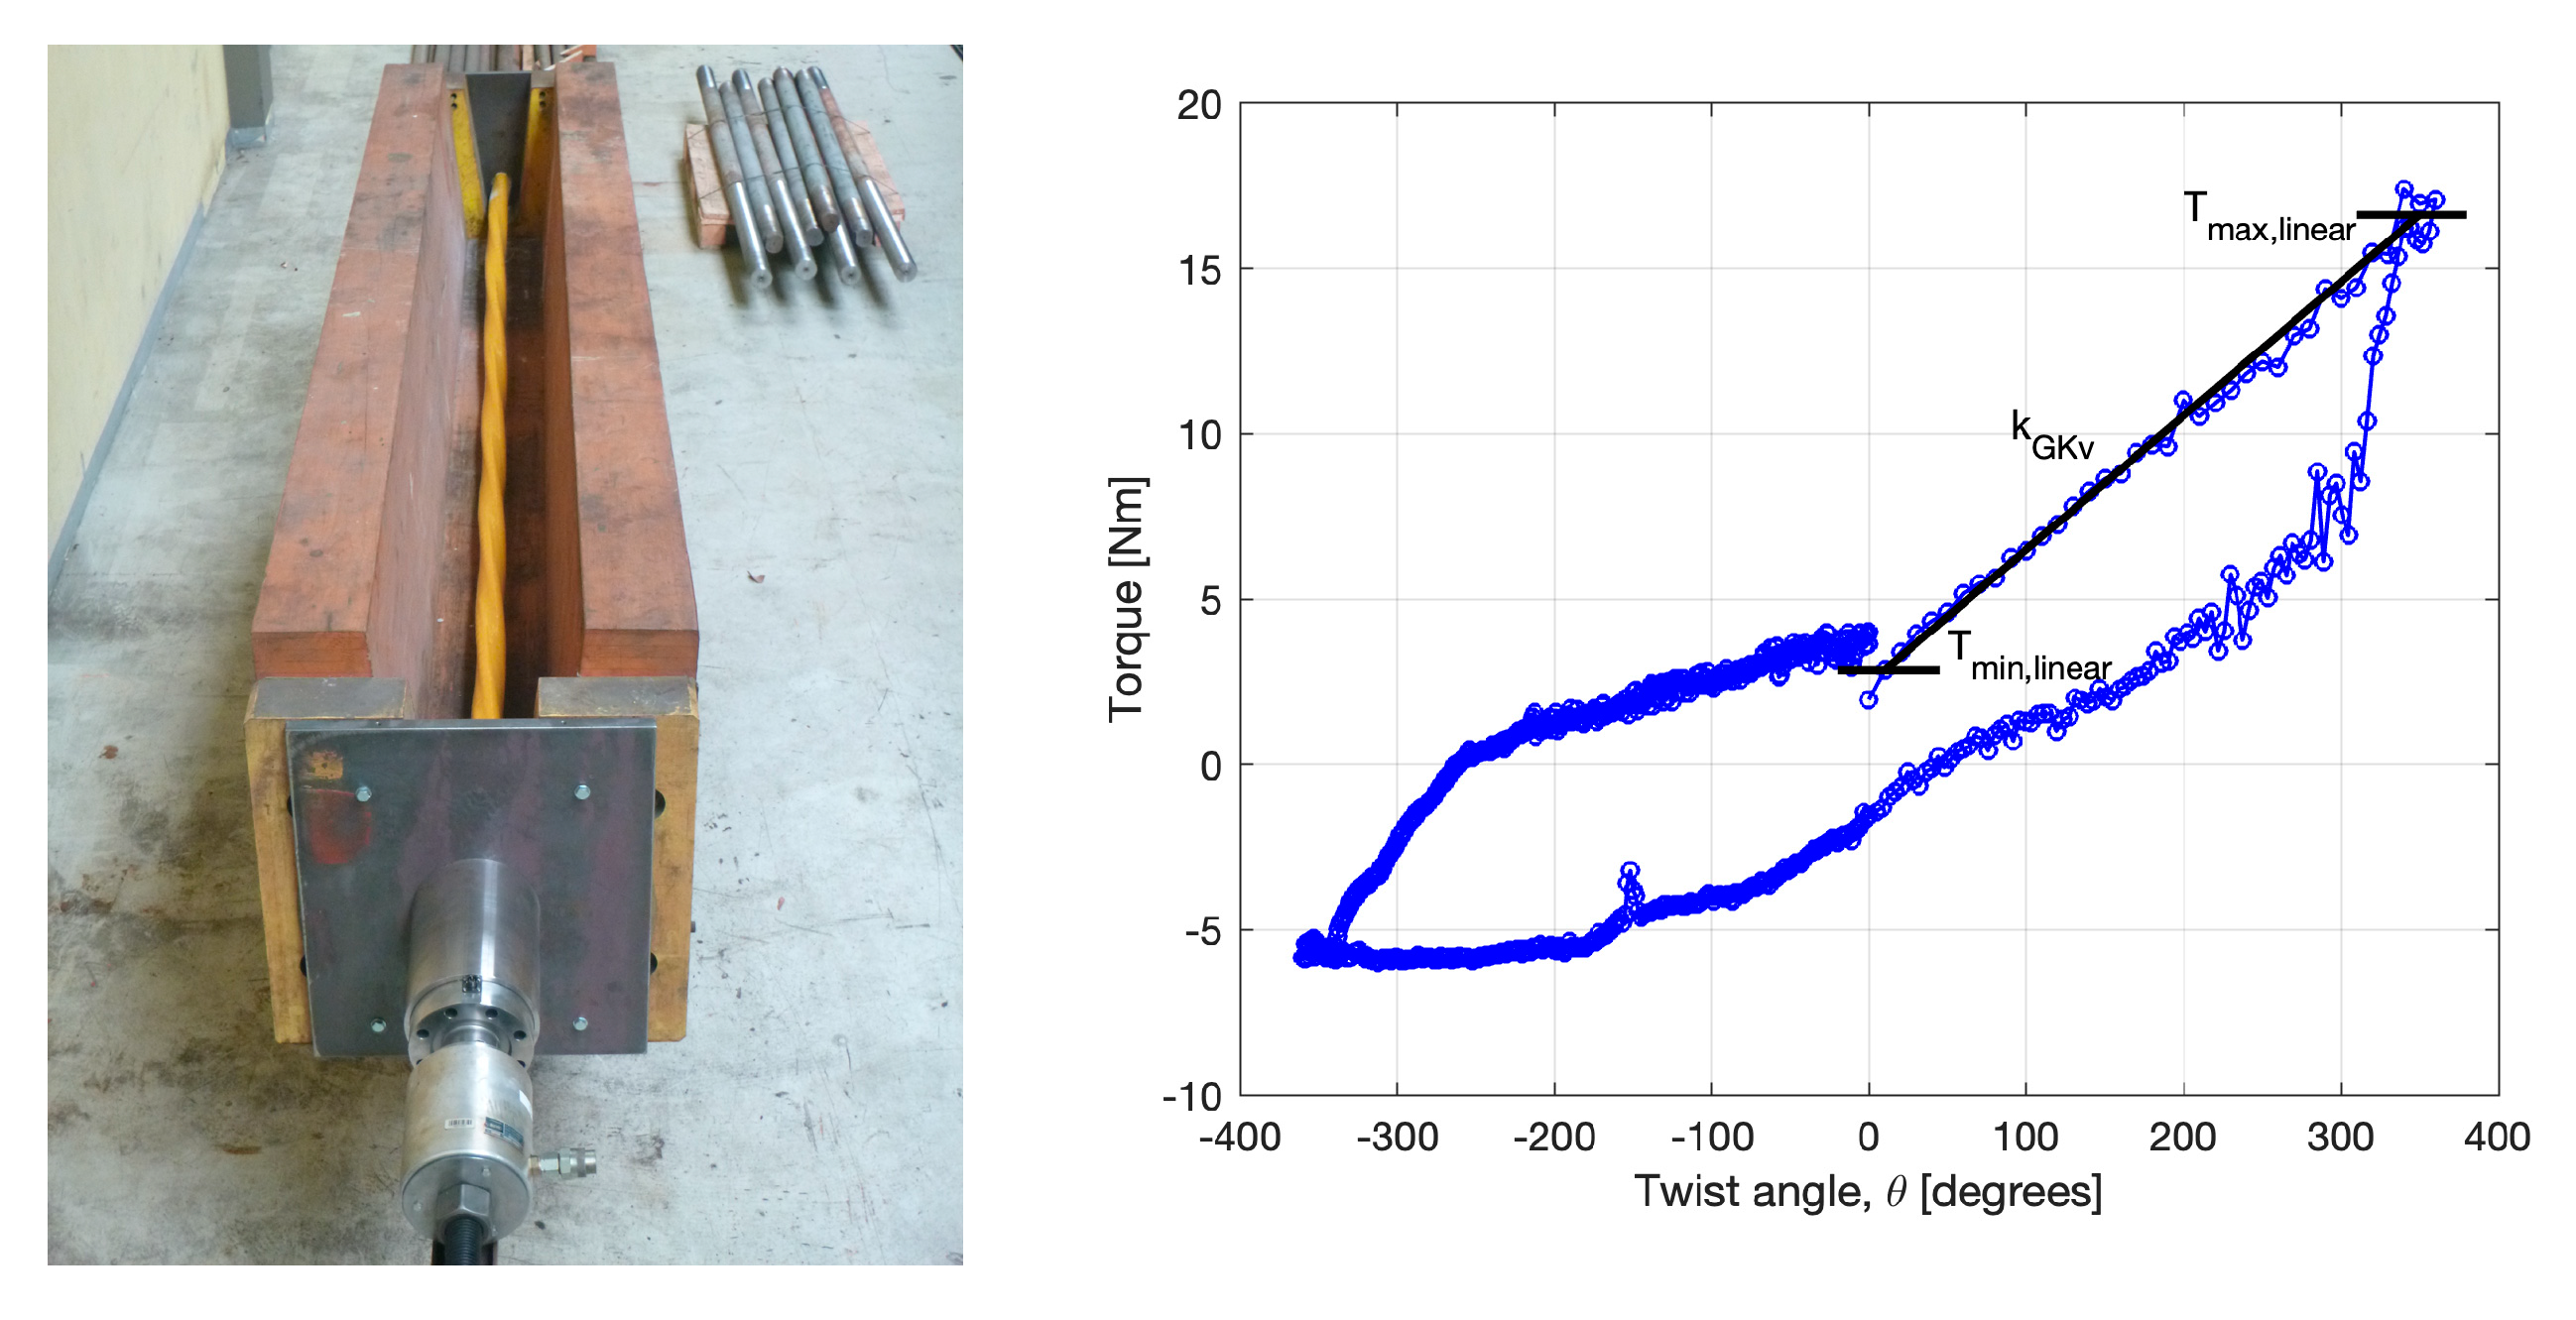
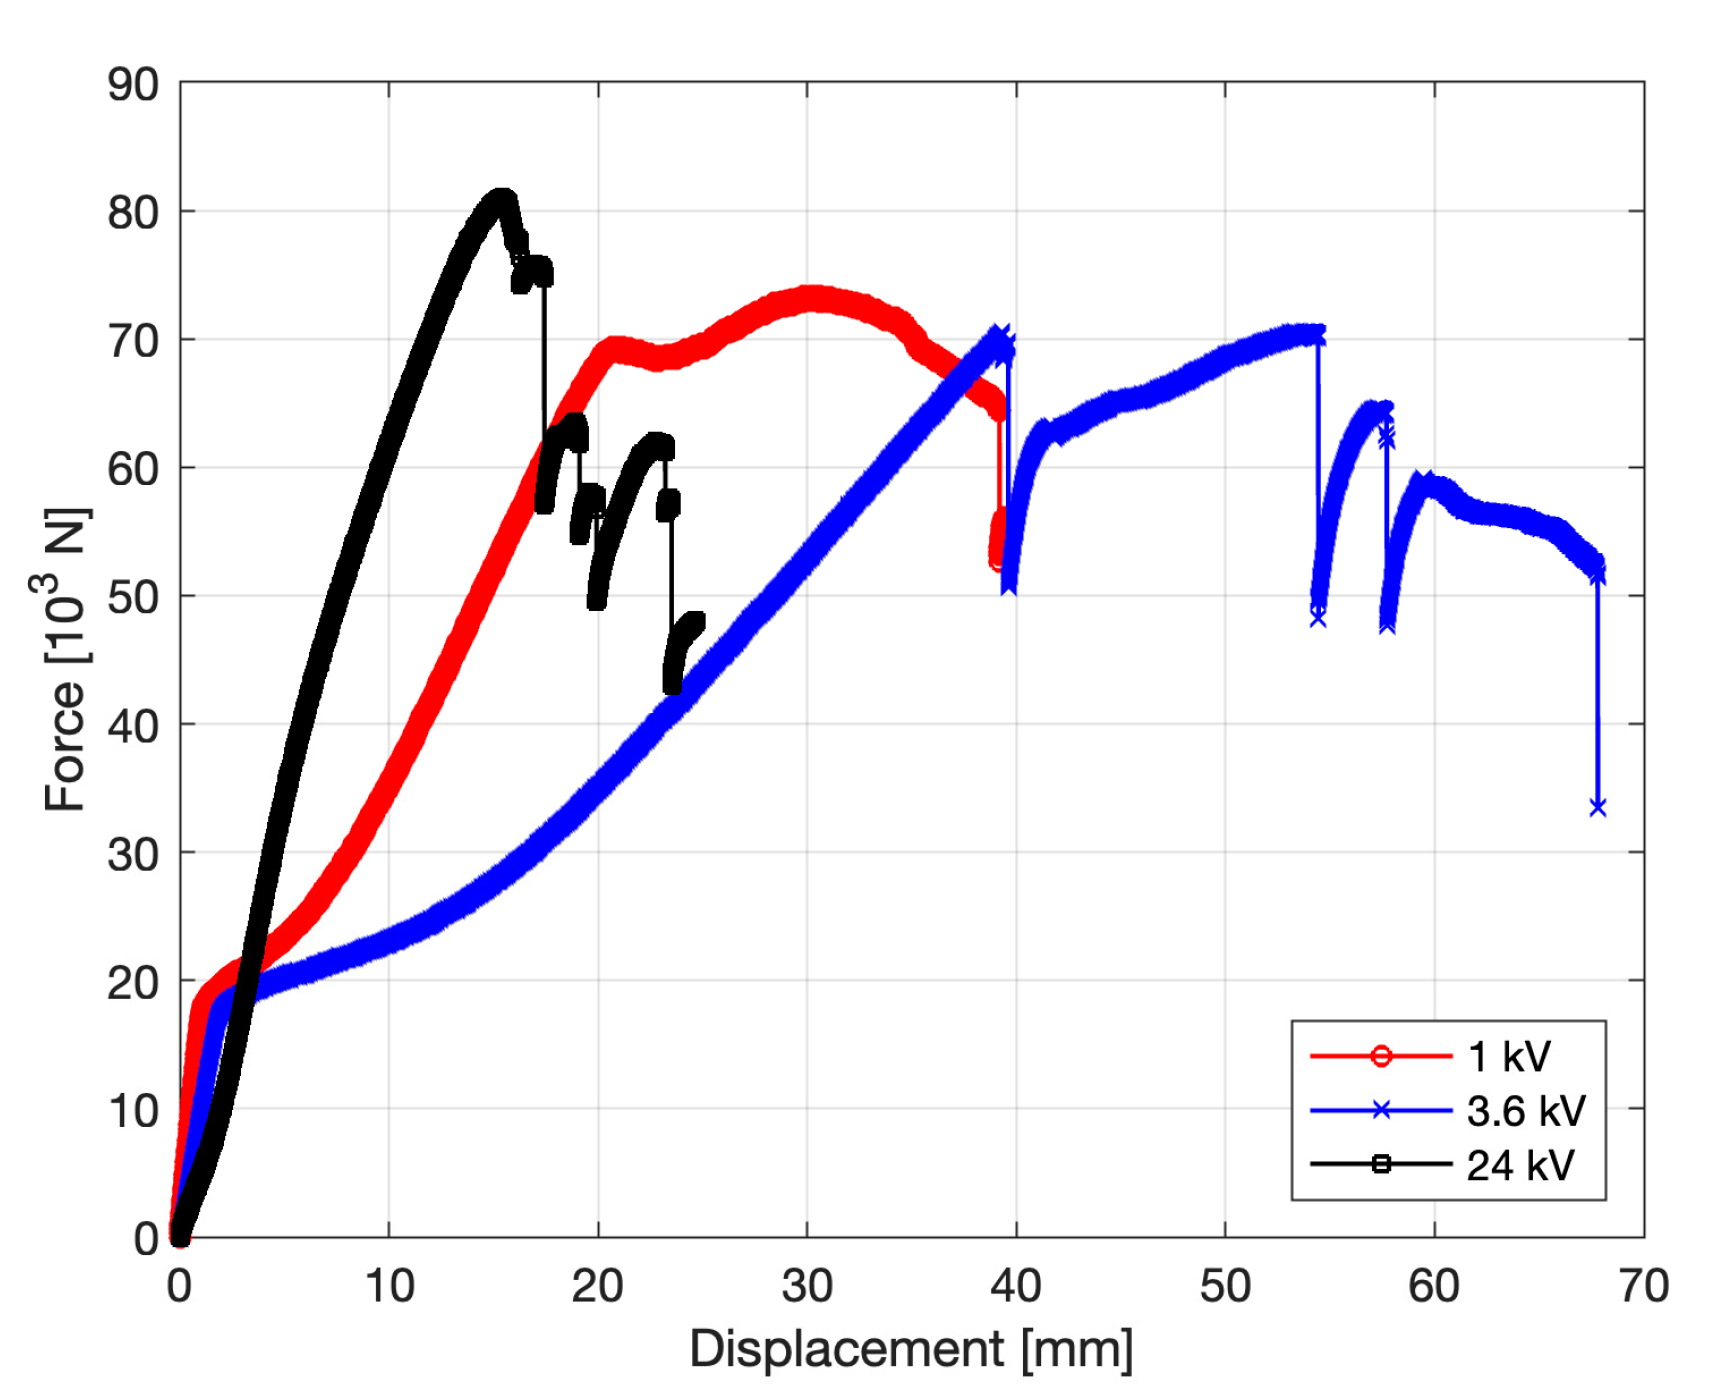
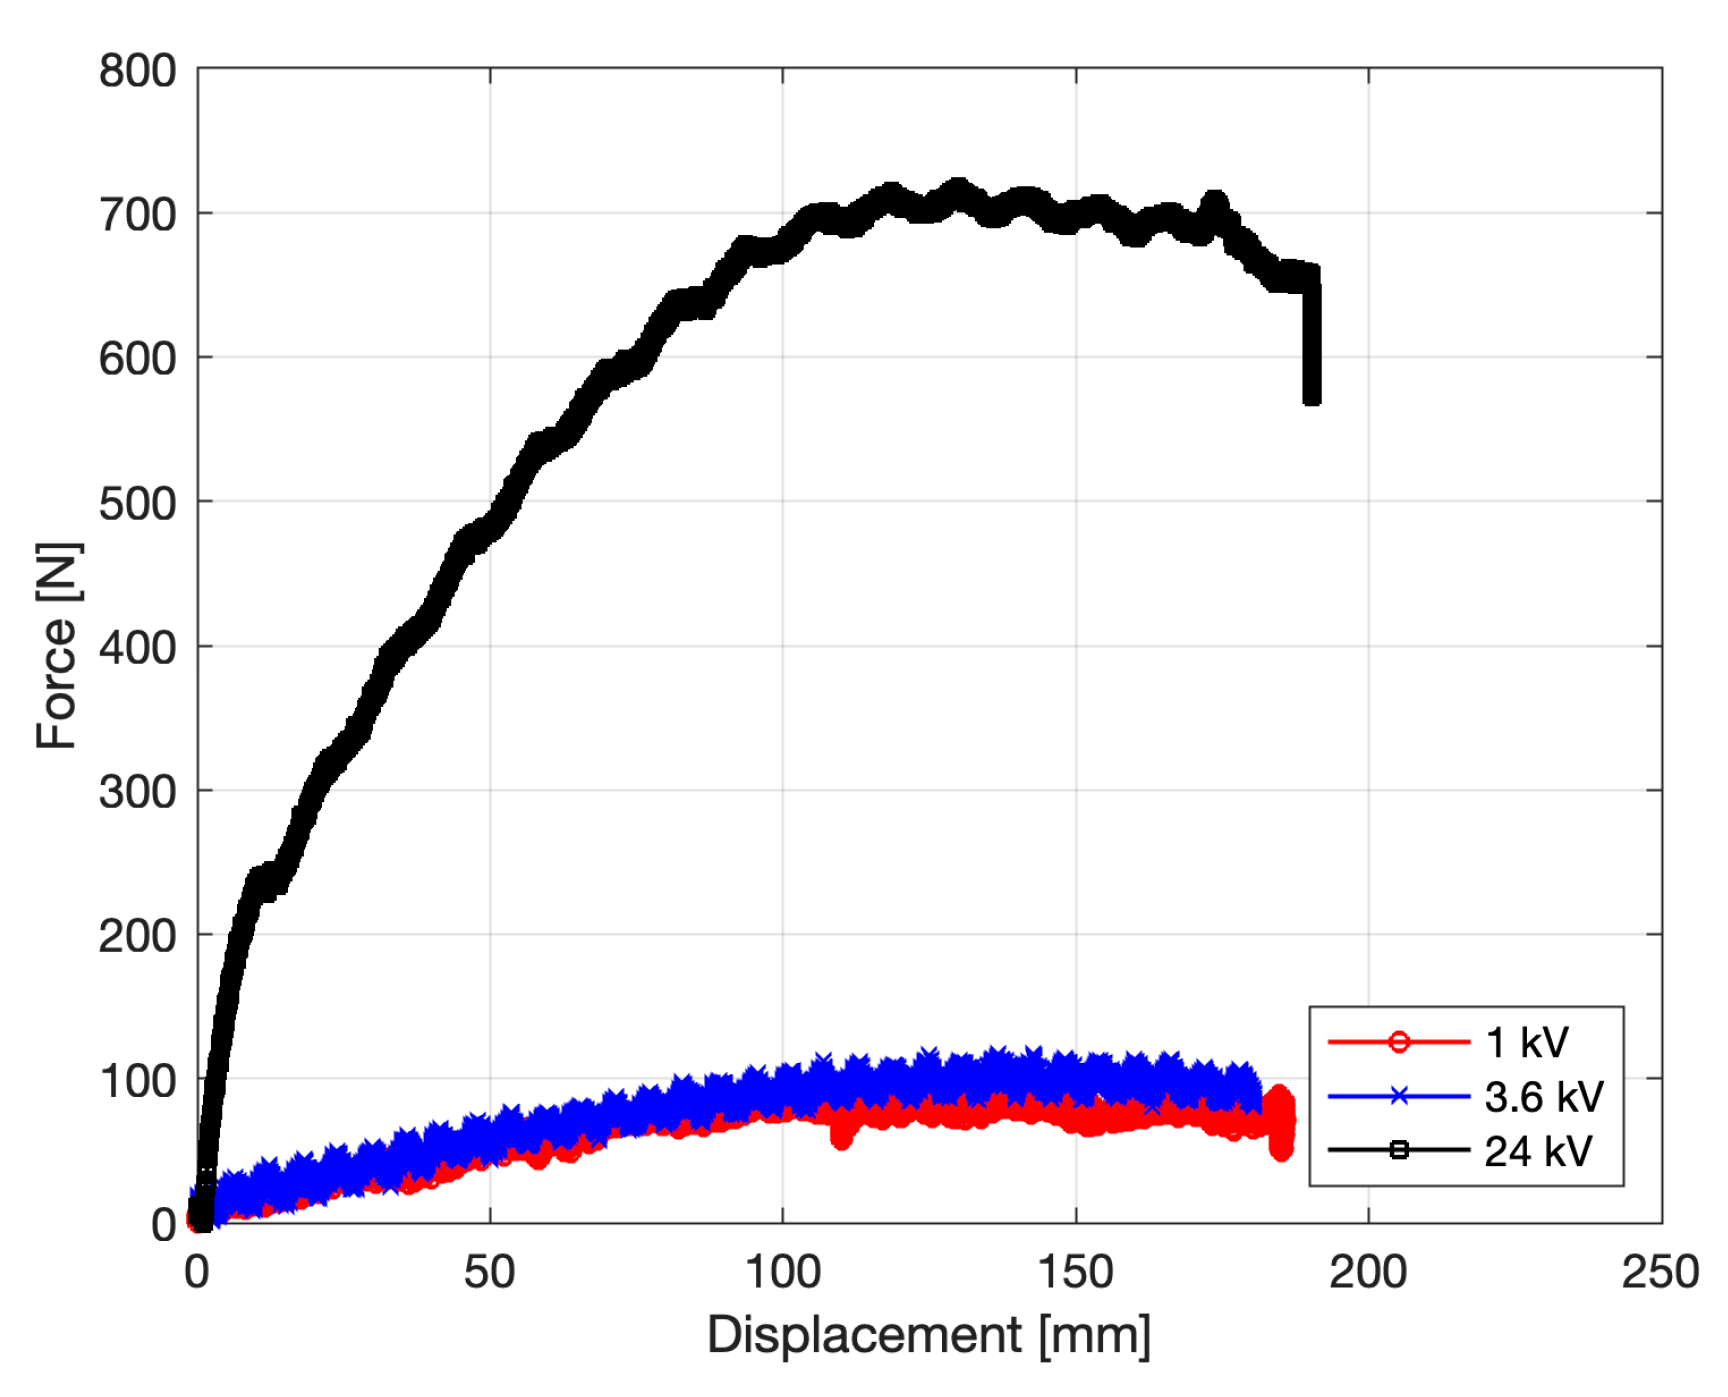
In this study, we conducted extensive mechanical tests on three dynamic marine power cables without metallic armor (1 kV, 3.6 kV, and 24 kV) to be used for floating installations wherein the cable must be able to follow the installation’s motions such as WECs and floating offshore wind installations. Tension, bending, torsion, and fatigue tests were performed to obtain the axial stiffness (EA), bending stiffness (EI), torsion stiffness (GKv), and fatigue performance of the cables under fully reversed (R = −1) cyclic bending loading conditions. The tension, bending, and torsion test results exhibited low standard deviations for the mechanical stiffnesses EA, EI, and GKv. Therefore, there is good repeatability in the preparation of the specimens and the execution of the tests.
The specimen length was varied for the tension and bending tests. The tension test results revealed that the length of the specimen influences the value of the axial stiffness. The longer the specimen, the higher its axial stiffness. This trend was observed for all three cables. Thus, it is essential to be aware of this dependence when the axial stiffness of umbilical cables is determined through tension tests. In contrast, the bending test results did not exhibit the same trend for the 1 kV and 3.6 kV cables, whereas the specimen length had only a minor influence on the results for the 24 kV cable.
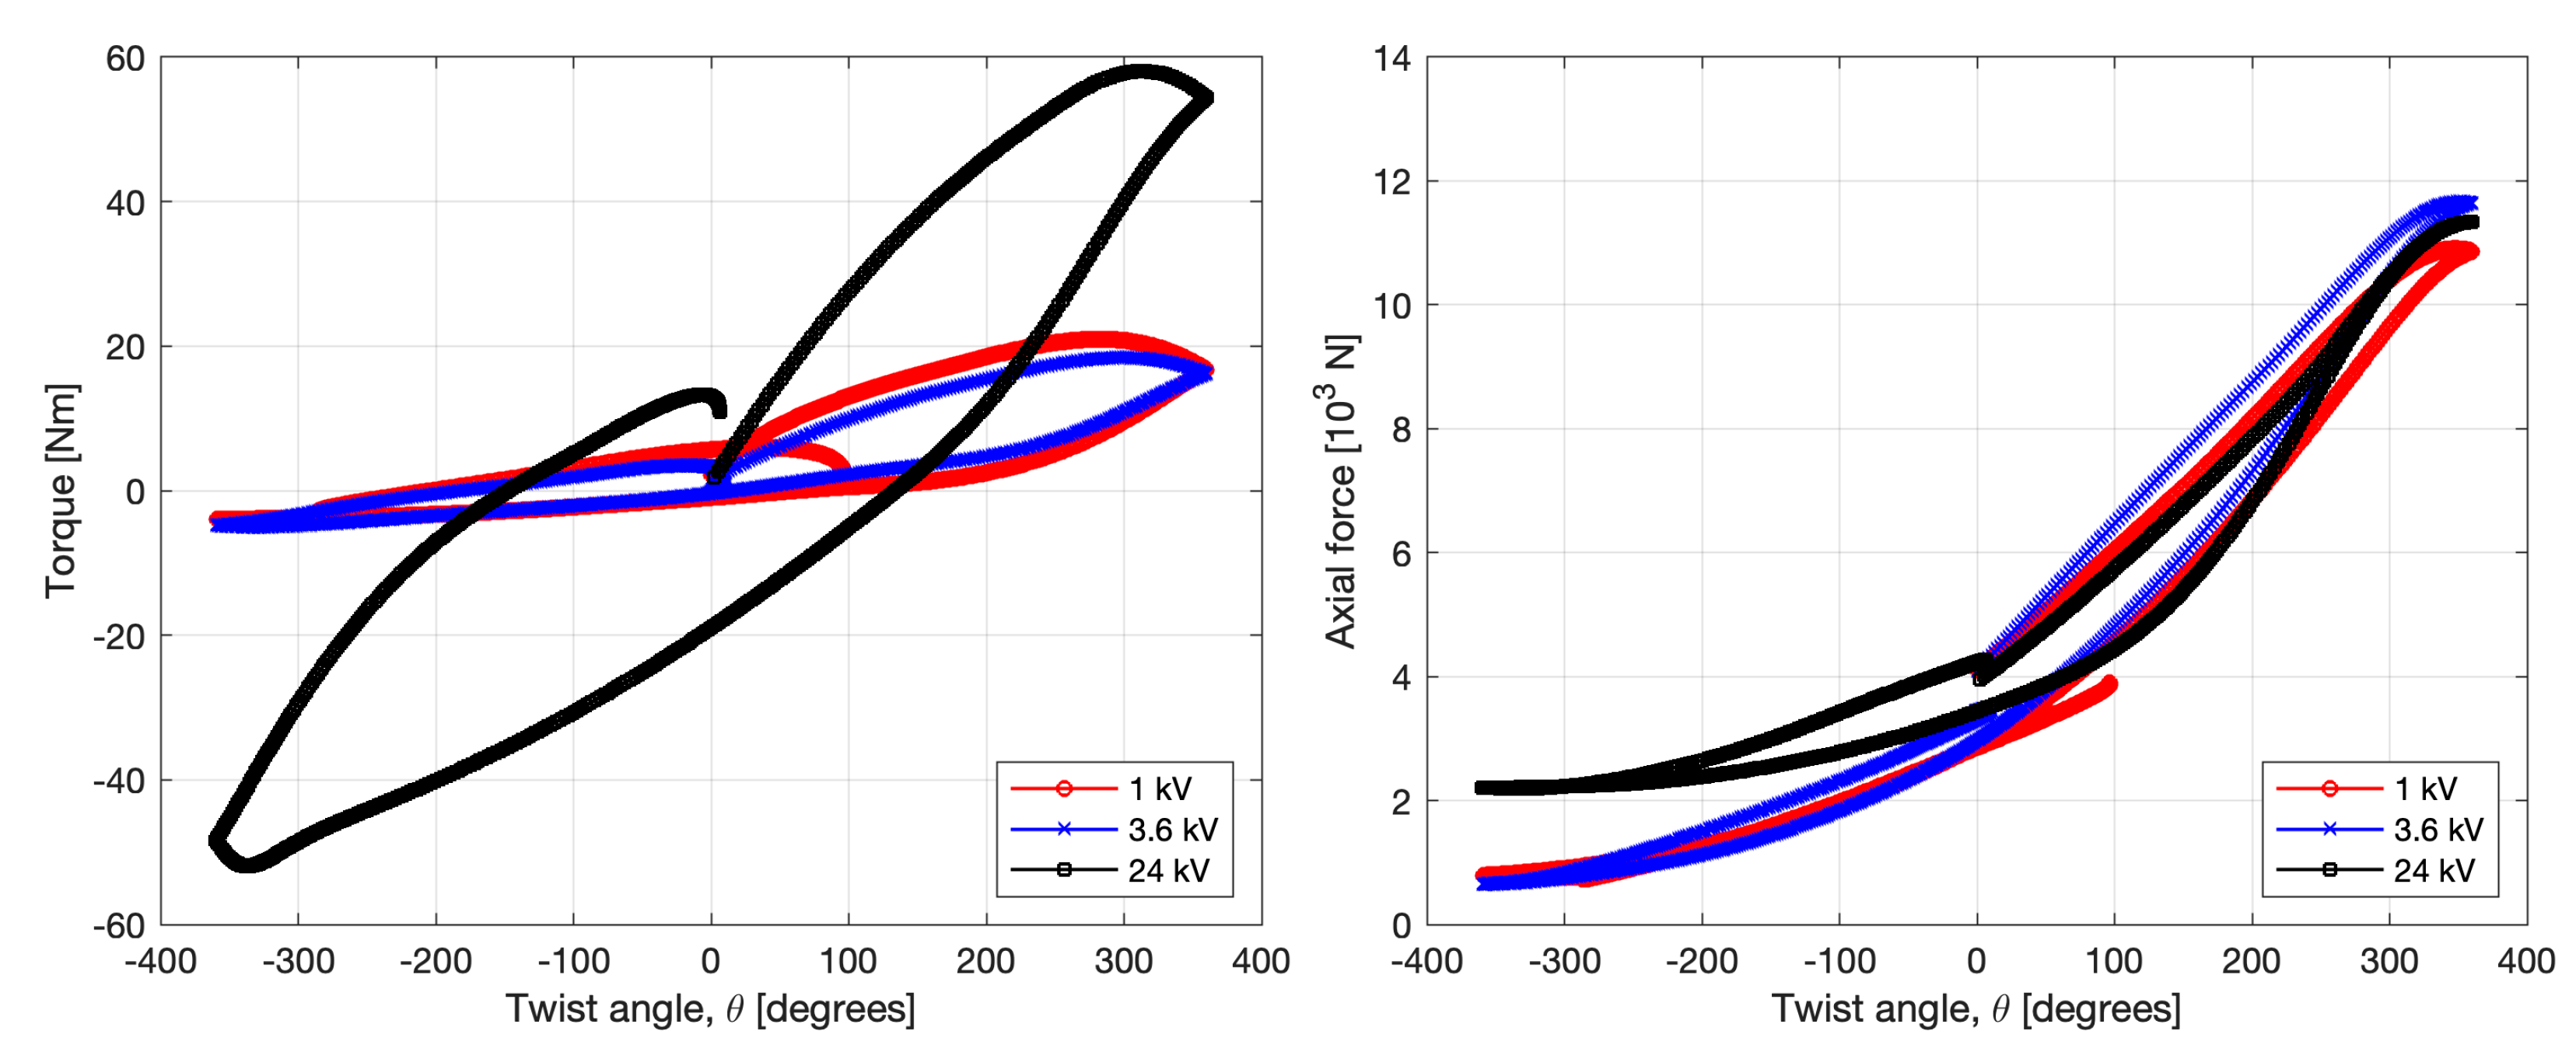
The torsion tests were carried out at three magnitudes of the axial pretension force. The results revealed that the higher the pretension force, the higher the torsion stiffness of the cables. As dynamic marine power cables are installed as free-hanging cables between offshore devices or between an offshore device and a power-collecting hub, axial forces will always act on the cable. Over time, marine biofouling will attach to the cable and increase the axial force acting on the cable. From a long-term perspective, considering the structural integrity of the cable, as the axial force changes with time, the torsion stiffness of the cable will change as well. This should be considered while designing the cable and monitored to ensure that the cable’s motions and torsion-induced mechanical stresses will not significantly reduce the fatigue life of the cable.
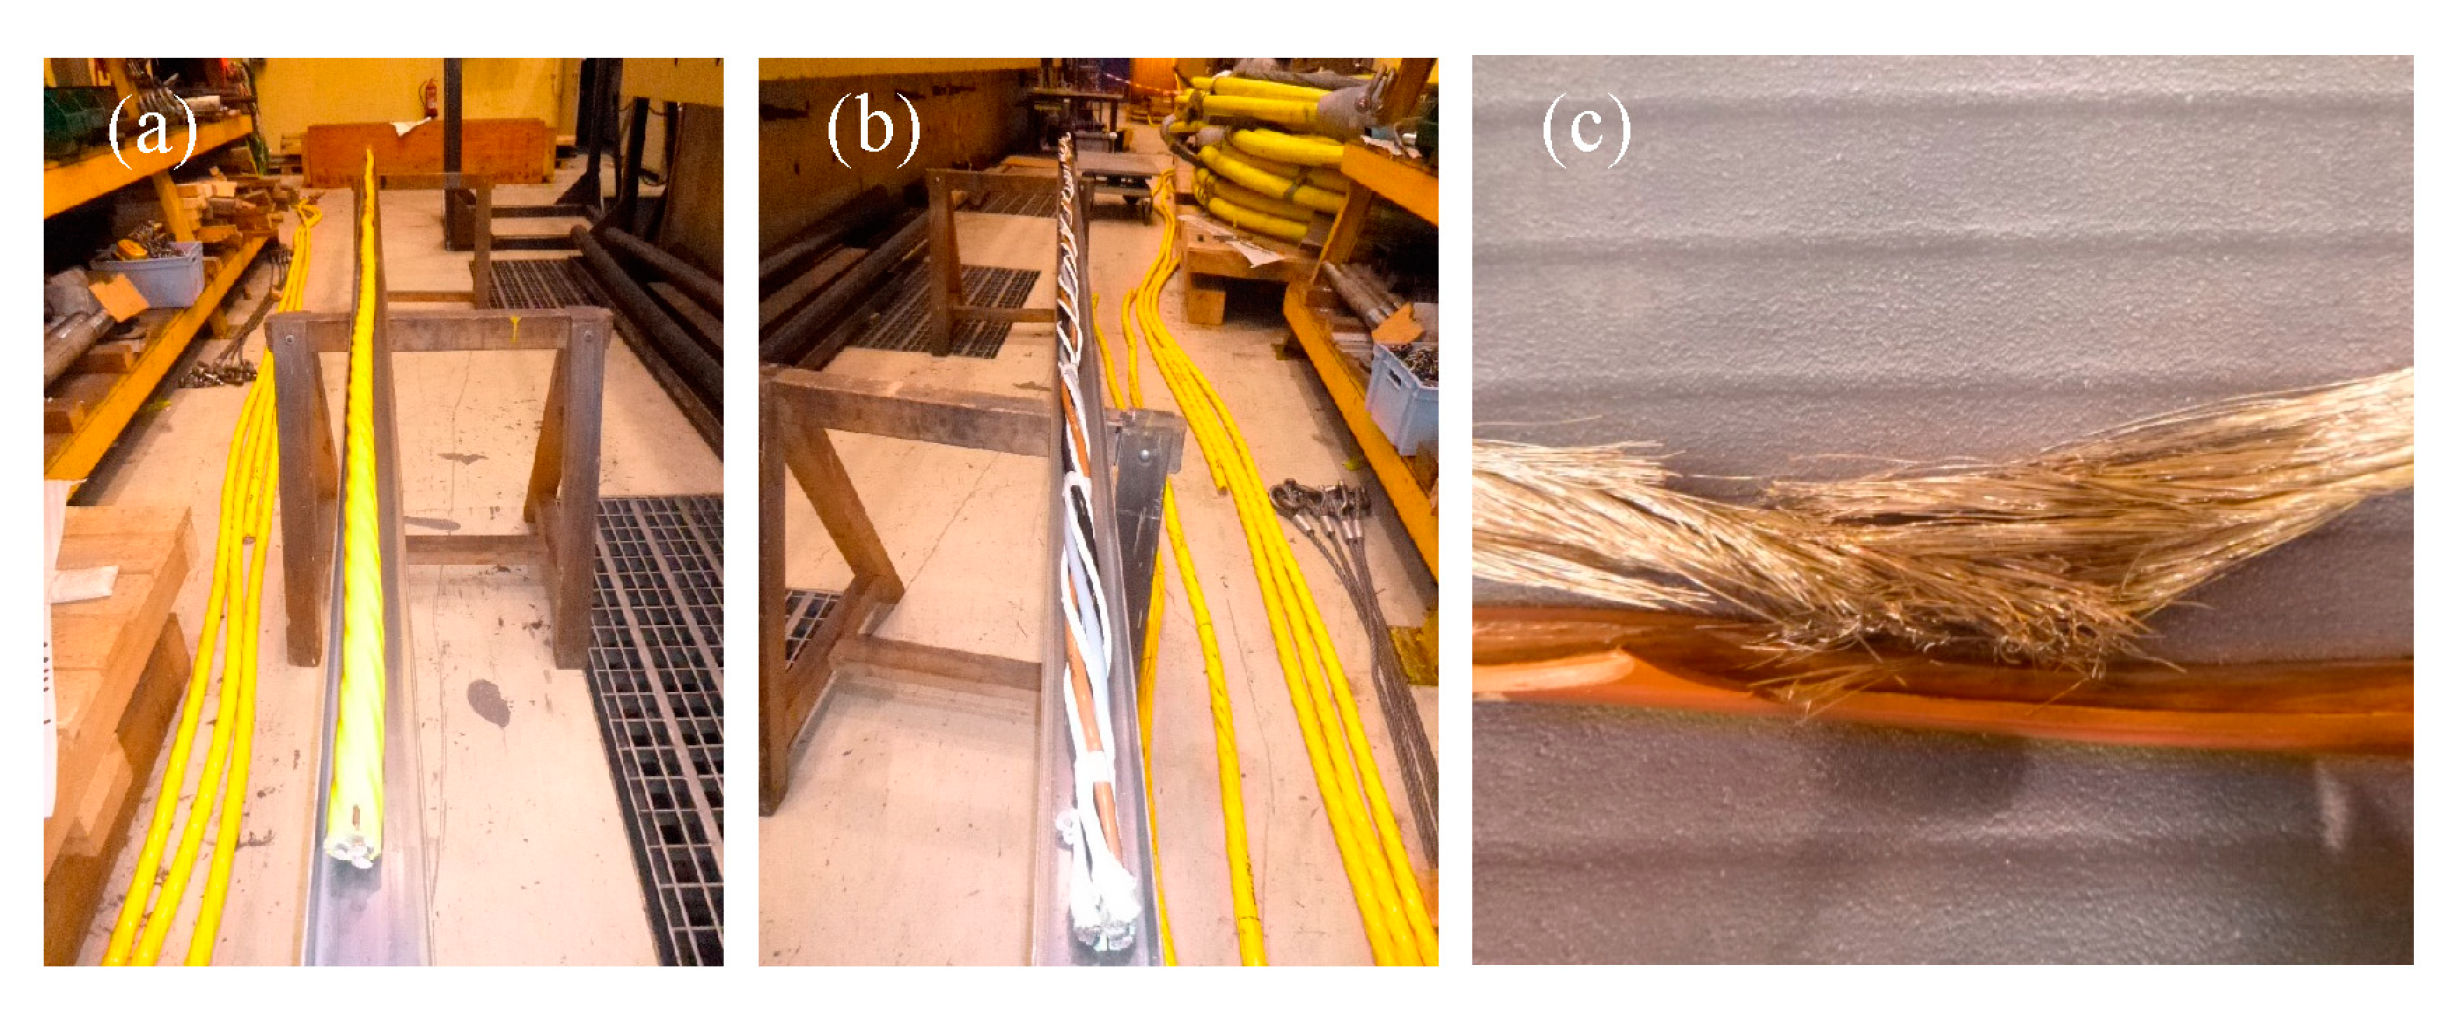
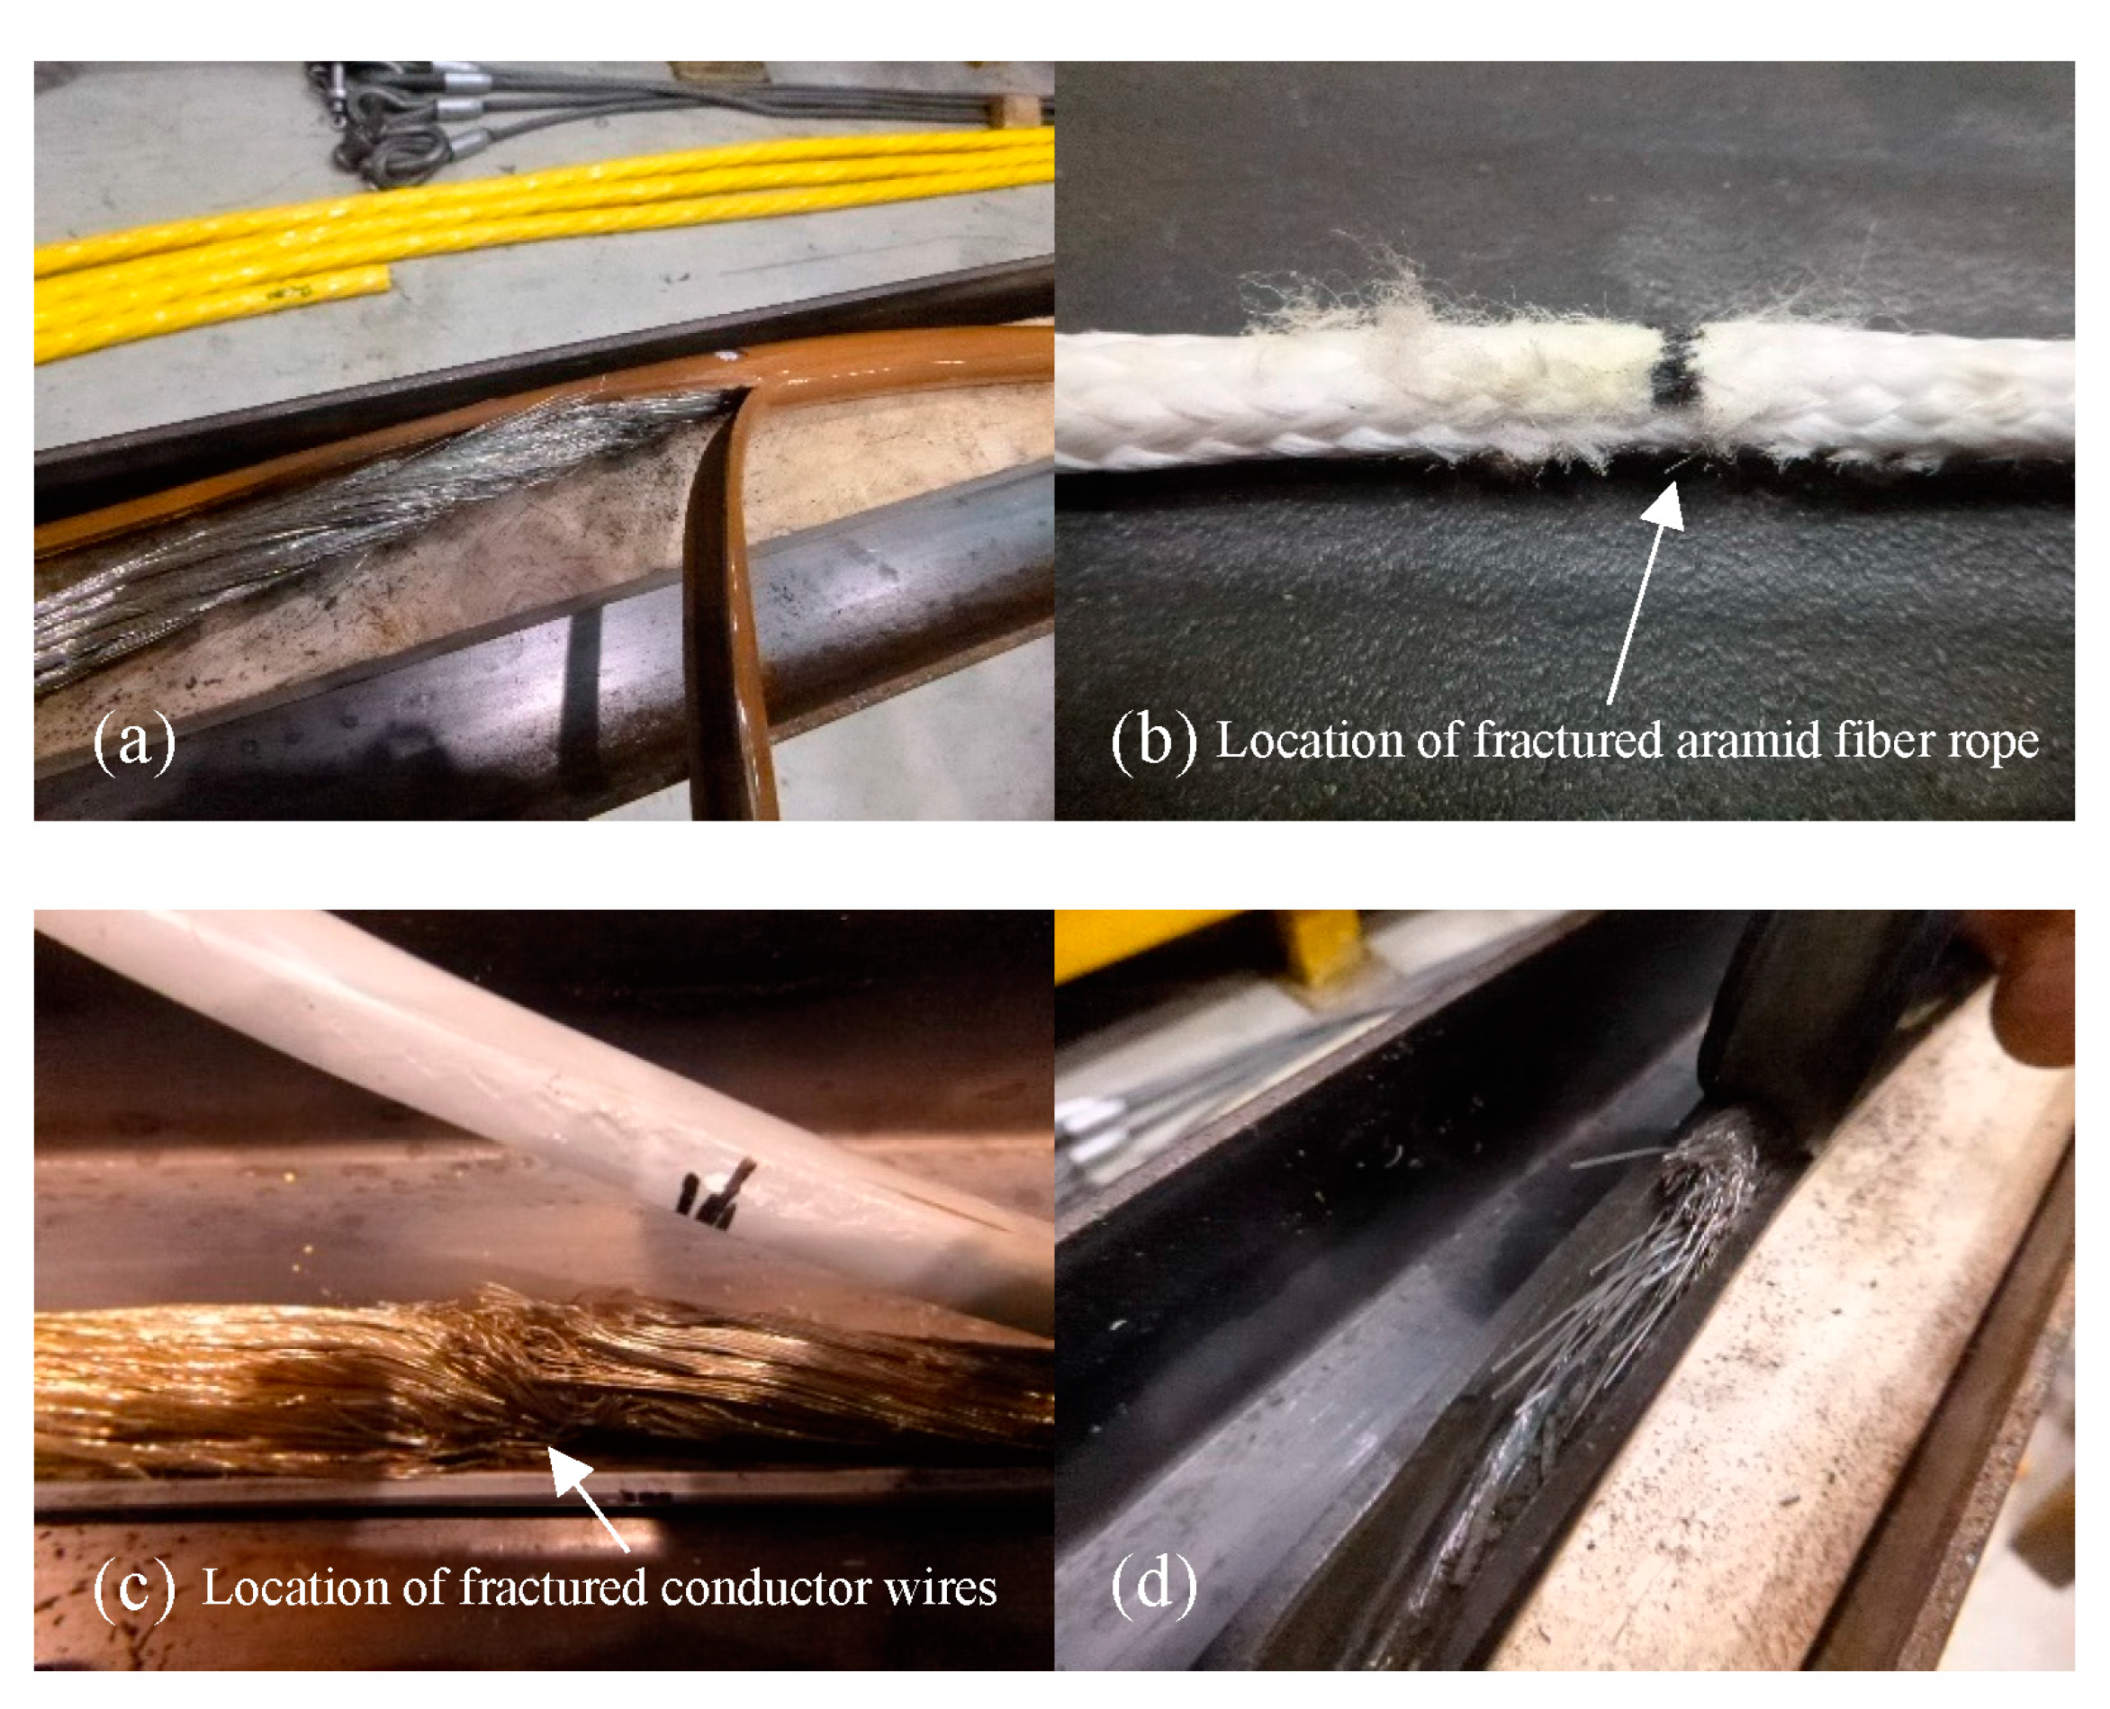
The fatigue monitoring method used in the fatigue tests could not detect or record the mechanical degradation of the components inside the cable during the fatigue tests. However, ocular inspections of the dissected cables after the fatigue tests revealed localized damage to the conductors’ wires in the contact zone between the preformed bending template and the cable. The wires in this zone were worn and fractured owing to a combination of wear, fretting, and fatigue. In the 24 kV cable, some of the aramid wire ropes also suffered significant mechanical damage that almost resulted in the complete fracture of the ropes. However, it should be noted that this damage would be unrealistic in real-world conditions as the load condition that caused the damage will not occur in an actual cable installation—the damage is simply due to the test setup and its loading conditions.
Fatigue testing of umbilical marine power cables is challenging. The complex loading on the cable when it is installed offshore, which includes cyclic axial, bending, and torsion loading conditions that are often out-of-phase, and its impact on the mechanical degradation of the cable’s components during its long service life must be understood better. The test method applied in this study followed the recommendations in a test standard. However, the results indicate that the combined traction-three-point bending fatigue test is not suitable for fatigue testing; the method and test rig proposed by the authors in a former study (see Section 4) also had similar shortcomings. Hence, considering the future need and applications of dynamic marine power cables offshore, the test methods used for this type of marine power cable must be developed further. Additionally, new monitoring techniques that can measure the mechanical degradation in installed marine power cables must be developed. This would allow the monitoring of different mechanical and electrical degradations inside the cable, thereby enabling timely inspection, maintenance, and repair planning to improve the cost-efficiency of such installations.

Author Contributions

Conceptualization, J.W.R., L.D., Z.L. and I.H.; methodology, J.W.R., L.D., Z.L. and I.H.; software, J.W.R. and L.D.; formal analysis, J.W.R. and L.D.; investigation, J.W.R., L.D. and Z.L.; resources, L.D. and I.H.; data curation, J.W.R. and L.D.; writing—original draft preparation, J.W.R. and L.D.; writing—review and editing, J.W.R., L.D., Z.L. and I.H.; visualization, J.W.R. and L.D.; project administration, J.W.R., L.D., Z.L. and I.H.; funding acquisition, J.W.R., L.D. and I.H. All authors have read and agreed to the published version of the manuscript.

Funding

This work was performed as part of project Seasnake (https://www.seasnake.eu; accessed on 8 September 2023) funded by EU OceanERA-NET 2019–2023. The Swedish authors received national funding from the Swedish Energy Agency, contract 48845-1, and the French author received national funding from Agence Régionale Pays de la Loire, contract RP2-J21095.

Institutional Review Board Statement

Not applicable.

Informed Consent Statement

Not applicable.

Data Availability Statement

Not applicable.

Acknowledgments

The authors wish to acknowledge the support received from NKT (Sweden) for providing the cables for testing and extending their cooperation throughout the work. The authors also acknowledge the assistance of Nicolas Séjourné and Romain Vannier from Université Gustave Eiffel, who realized the experimental tests.

Conflicts of Interest

The authors declare no conflict of interest. The funders had no role in the design of the study, in the collection, analyses, or interpretation of data, in the writing of the manuscript, or in the decision to publish the results.

References

  1. Worzyk, T. Application of Submarine Power Cables—Design, Installation, Repair, Environmental Aspects, 1st ed.; Springer: Berlin/Heidelberg, Germany, 2009. [Google Scholar] [CrossRef]
  2. O’Keeffe, A.; Haggett, C. An investigation into the potential barriers facing the development of offshore wind energy in Scotland: Case study–Firth of Forth offshore wind farm. Renew. Sustain. Energy Rev. 2012, 16, 3711–3721. [Google Scholar]
  3. GCube. Down to the Wire: An Insurance Buyer’s Guide to Subsea Cabling Incidents. GCube Insurance Services (June 2016 Report). Available online: https://www.gcube-insurance.com (accessed on 8 September 2023).
  4. De Wild, F. Offshore Wind Industry Joins Forces to Reduce Costs of Cable Failures. Det Norske Veritas (DNV). (April 2018 Article). Available online: https://www.dnv.com/news/offshore-wind-industry-joins-forces-to-reduce-costs-of-cable-failures-117811 (accessed on 8 September 2023).
  5. Offshore Wind Programme Board. Export Cable Reliability Description of Concerns. (July 2017 Report). Available online: https://www.transmissionexcel.com/wp-content/uploads/2017/07/Export-Cable-Reliability-Step-1-v7-UPDATE-Jul-17.pdf (accessed on 8 September 2023).
  6. 4COffshore. Joint Industry Project Looks to Reduce Cable Failures. 2018. Available online: https://www.4coffshore.com/news/joint-industry-project-looks-to-reduce-cable-failures-nid7457.html (accessed on 8 September 2023).
  7. Marazzato, H.; Barber, K.; Jansen, M.; Graeme, B. Cable Condition Monitoring to Improve Reliability. Available online: https://docplayer.net/5210519-Cable-condition-monitoring-to-improve-reliability.html (accessed on 8 September 2023).
  8. Hammons, T.J.; Woodford, D.; Loughtan, J.; Chamia, M.; Donahoe, J.; Povh, D.; Bisewski, B.; Long, W. Role of HVDC transmission in future energy development. IEEE Power Eng. Rev. 2000, 20, 10–25. [Google Scholar] [CrossRef]
  9. Marta, M.; Mueller-Schuetze, S.; Ottersberg, H.; Isus, D.; Johanning, L.; Thies, P.R. Development of dynamic submarine MV power cable design solutions for floating offshore renewable energy applications. In Proceedings of the 9th International Conference on Insulated Power Cables (Jicable’15), Versailles, France, 21–25 June 2015. [Google Scholar]
  10. Magagna, D.; Uihlein, A. 2014 JRC Ocean Energy Status Report. EUR 26983. Luxembourg (Luxembourg): Publications Office of the European Union; 2015. JRC93521. Available online: https://op.europa.eu/en/publication-detail/-/publication/359b9147-ab4e-4639-b9db-17a6011a255f/language-en (accessed on 8 September 2023).
  11. Yang, S.-H.; Ringsberg, J.W.; Johnson, E. Parametric study of the dynamic motions and mechanical characteristics of power cables for wave energy converters. J. Mar. Sci. Technol. 2018, 23, 10–29. [Google Scholar] [CrossRef]
  12. Folley, M.; Whittaker, T.J.T. The effect of sub-optimal control and the spectral wave climate on the performance of wave energy converter arrays. Appl. Ocean Res. 2009, 31, 260–266. [Google Scholar] [CrossRef]
  13. Svensson, G.; Sævik, S.; Ringsberg, J.W. Fatigue damage analysis of dynamic power cables by laboratory testing and FE analysis. In Developments in the Analysis and Design of Marine Structures—Proceedings of the 8th International Conference on Marine Structures (MARSTRUCT 2021); Amdahl, J., Guedes Soares, C., Eds.; CRC Press, Taylor & Francis Group: Oxford, UK, 2021; pp. 477–484. [Google Scholar]
  14. Johannesson, P.; Lang, X.; Johnson, E.; Ringsberg, J.W. Mechanical reliability analysis of flexible power cables for marine energy. J. Mar. Sci. Eng. 2022, 10, 716. [Google Scholar] [CrossRef]
  15. Kuznecovs, A.; Ringsberg, J.W.; Yang, S.-H.; Johnson, E.; Anderson, A. A methodology for design and fatigue analysis of power cables for wave energy converters. Int. J. Fat. 2019, 122, 61–71. [Google Scholar] [CrossRef]
  16. Nasution, F.P.; Sævik, S.; Gjøsteen, J.K. Finite element analysis of the fatigue strength of copper power conductors exposed to tension and bending loads. Int. J. Fat. 2014, 59, 114–128. [Google Scholar] [CrossRef]
  17. Thies, P.R.; Johanning, L.; Smith, G.H. Assessing mechanical loading regimes and fatigue life of marine power cables in marine energy applications. Proc. Inst. Mech. Eng. O J. Risk Reliab. 2012, 226, 18–32. [Google Scholar] [CrossRef]
  18. Poon, C.T.; Barrett, R.A.; Leen, S.B. Global and local modeling for inter-wire fretting in multi-wire copper conductors. Fatigue Fract. Eng. Mater. Struct. 2022, 45, 1618–1634. [Google Scholar] [CrossRef]
  19. Poon, C.T.; O’Halloran, S.M.; Connolly, A.; Barrett, R.A.; Leen, S.B. Fretting wear and fatigue in submarine power cable conductors for floating offshore wind energy. Tribol. Int. 2023, 186, 108598. [Google Scholar] [CrossRef]
  20. Hu, H.; Yan, J.; Sævik, S.; Ye, N.; Lu, Q.; Bu, Y. Nonlinear bending behavior of a multilayer copper conductor in a dynamic power cable. Ocean Eng. 2022, 250, 110831. [Google Scholar] [CrossRef]
  21. Ménard, F.; Cartraud, P. A computationally efficient finite element model for the analysis of the non-linear bending behaviour of a dynamic submarine power cable. Mar. Struct. 2022, 91, 103465. [Google Scholar] [CrossRef]
  22. Zhao, S.; Cheng, Y.; Chen, P.; Nie, Y.; Fan, K. A comparison of two dynamic power cable configurations for a floating offshore wind turbine in shallow water. AIP Adv. 2021, 11, 035302. [Google Scholar] [CrossRef]
  23. Sobhaniasl, M.; Petrini, F.; Karimirad, M.; Bontempi, F. Fatigue life assessment for power cables in floating offshore wind turbines. Energies 2020, 13, 3096. [Google Scholar] [CrossRef]
  24. Chang, H.-C.; Chen, B.-F. Mechanical behavior of submarine cable under coupled tension, torsion and compressive loads. Ocean Eng. 2019, 189, 106272. [Google Scholar] [CrossRef]
  25. Schnepf, A.; Lopez-Pavon, C.; Ong, M.K.; Yin, G.; Johnsen, Ø. Feasibility study on suspended inter-array power cables between two spar-type offshore wind turbines. Ocean Eng. 2023, 277, 114215. [Google Scholar] [CrossRef]
  26. Yan, J.; Su, Q.; Li, R.; Xu, J.; Lu, Q.; Yang, Z. Optimization design method of the umbilical cable global configuration based on representative fatigue conditions. IEEE J. Ocean. Eng. 2023, 48, 188–198. [Google Scholar] [CrossRef]
  27. Okpokparoro, S.; Sriramula, S. Reliability analysis of floating wind turbine dynamic cables under realistic environmental loads. Ocean Eng. 2023, 278, 114594. [Google Scholar]
  28. Thies, P.R.; Johanning, L.; Karikari-Boateng, K.A.; Ng, C.; McKeever, P. Component reliability test approaches for marine renewable energy. Proc. Inst. Mech. Eng. O J. Risk Reliab. 2015, 229, 403–416. [Google Scholar] [CrossRef]
  29. Thies, P.R.; Johanning, L.; Dobral, C. Parametric sensitivity study of submarine power cable design for marine renewable energy applications. In Proceedings of the ASME 2017 36th International Conference on Ocean, Offshore and Arctic Engineering (OMAE 2017), Trondheim, Norway, 25–30 June 2017. Paper No: OMAE2017-62208. [Google Scholar] [CrossRef]
  30. Drumond, G.P.; Pasqualino, I.P.; Pinheiro, B.C.; Estefen, S.F. Pipelines, risers and umbilicals failures: A literature review. Ocean Eng. 2018, 148, 412–425. [Google Scholar] [CrossRef]
  31. Tjahjanto, D.D.; Tyrberg, A.; Mullins, J. Bending mechanics of cable cores and fillers in a dynamic submarine cable. In Proceedings of the ASME 2017 36th International Conference on Ocean, Offshore and Arctic Engineering (OMAE 2017), Trondheim, Norway, 25–30 June 2017. Paper No: OMAE2017-62553. [Google Scholar] [CrossRef]
  32. CIGRE. Recommendations for Mechanical Testing of Submarine Cables for Dynamic Applications—TB 862. (June 2022 Report). Available online: https://www.cigre.org/event/webinar/2022/FR/paris/recommendations-for-mechanical-testing-of-submarine-cables-for-dynamic-applications---tb-862 (accessed on 8 September 2023).
  33. Det Norske Veritas (DNV). Subsea Power Cables in Shallow Water, DNV-RP-0360. (October 2021 Recommended Practice). Available online: https://www.dnv.com/energy/standards-guidelines/dnv-rp-0360-subsea-power-cables-in-shallow-water.html (accessed on 8 September 2023).
  34. Det Norske Veritas (DNV). Electrical Power Cables in Subsea Applications, DNV-RP-F401. (September 2021 Recommended Practice). Available online: https://www.dnv.com/oilgas/download/dnv-rp-f401-electrical-power-cables-in-subsea-applications.html (accessed on 8 September 2023).
Figure 1. Example of the design of a traditional dynamic marine power cable (reproduced from [31]).
Jmse 11 01791 g001
Figure 2. Photographs and schematics of the components of (upper) the 3.6 kV and (lower) the 24 kV dynamic marine power cables tested in this study: (1) aramid fiber rope, (2) insulation material, (3) optical fiber, and (4) copper conductor.
Jmse 11 01791 g002
Figure 3. Photographs of the preparation of the end parts of the cables to achieve sufficient grip and clamping force on all the cable components during tension testing; refer to the text for details.
Jmse 11 01791 g003
Figure 4. (Left) Photograph of a cable specimen installed in the tension test rig in an unloaded condition before testing, and (right) an example of the reaction force–load cell displacement curve for a 400 mm 3.6 kV cable.
Jmse 11 01791 g004
Figure 5. (Left) Photograph of a cable specimen installed in the three-point bending test rig under loaded conditions, and (right) an example of reaction force–punch displacement curve for a 400 mm 3.6 kV cable.
Jmse 11 01791 g005
Figure 6. (Left) Photograph of a cable specimen installed in the torsion test rig in the unloaded condition, and (right) an example of reaction torque–twisting angle curve for a 3610 mm 3.6 kV cable with a 2 kN axial pretension force.
Jmse 11 01791 g006
Figure 7. Illustration of the combined traction-three-point bending fatigue test rig with a close-up of the three-point bending region with preformed templates.
Jmse 11 01791 g007
Figure 8. Reaction force–load cell displacement curves for the 1 kV, 3.6 kV, and 24 kV cables (cable length = 600 mm) until the tension tests were interrupted; refer to the text for details and analysis of the results.
Jmse 11 01791 g008
Figure 9. Curves of the reaction force–punch displacement in the middle of the 1 kV, 3.6 kV, and 24 kV cable specimens between the supports (cable length = 600 mm).
Jmse 11 01791 g009
Figure 10. (Left) Reaction torque–twisting angle curves and (right) axial reaction force–twisting angle curves obtained from the torsion tests using a cable specimen length of 3610 mm and a 4 kN axial pretension force.
Jmse 11 01791 g010
Figure 11. Photographs of a dissected 3.6 kV cable: (a) before removing the outer sheath, (b) after removing the outer sheath, and (c) failed and worn conductor wires in one of the conductors.
Jmse 11 01791 g011
Figure 12. (a) Removal of the insulation material from one of the conductors, note the damaged wires; (b) an example of a damaged aramid fiber rope; (c) a close-up of fractured conductor wires; (d) the left part of the wires in (c) removed to illustrate the proportion of the fractured wires.
Jmse 11 01791 g012
Table 1. Principal dimensions of the cables and their components.
Cable Component1 kV3.6 kV24 kV
Copper conductor diameter (mm)9.39.37.5
Total conductor insulation thickness (mm)2.02.56.5
Total outer sheathing thickness (mm)3.43.44.2
Outer diameter (mm)38.039.753.3
Lay length * (mm)300–600 *400–800 *1000–1500 *
Mass/length (kg/m)2.22.33.1
* Remark: To maintain confidentiality, the lay lengths are provided as a range of values instead of the target design values for the manufactured cables.
Table 2. Details of the fatigue tests conducted in this study.
CableNumber of TestsLoad Cycles: Test 1Load Cycles: Test 2Load Cycles: Test 3
1 kV22,000,0002,000,000-
3.6 kV22,000,0002,000,000-
24 kV3250,000500,0001,000,000
Table 3. Results of tension tests on 1 kV cable.
Cable Length (mm)400600800
EA, mean value (×106 N)8.708.268.92
EA, standard deviation (×106 N)0.220.090.63
Fmax,linear, mean value (×103 N)18.1517.3316.01
Fmax,linear, standard deviation (×103 N)1.601.001.10
Fmin,linear, mean value (×103 N)4.253.763.97
Fmin,linear, standard deviation (×103 N)0.160.200.30
Table 4. Results of tension tests on 3.6 kV cable.
Cable Length (mm)400600800
EA, mean value (×106 N)7.478.268.42
EA, standard deviation (×106 N)0.280.190.43
Fmax,linear, mean value (×103 N)17.1516.3315.12
Fmax,linear, standard deviation (×103 N)1.801.300.90
Fmin,linear, mean value (×103 N)4.443.202.90
Fmin,linear, standard deviation (×103 N)0.920.380.13
Table 5. Results of tension tests on 24 kV cable.
Cable Length (mm)400600800
EA, mean value (×106 N)4.025.196.01
EA, standard deviation (×106 N)0.280.240.04
Fmax,linear, mean value (×103 N)78.8267.0089.12
Fmax,linear, standard deviation (×103 N)2.306.703.10
Fmin,linear, mean value (×103 N)1.120.920.88
Fmin,linear, standard deviation (×103 N)0.090.020.05
Table 6. Results of bending tests on 1 kV cable.
Cable Length (mm)400600750
EI, mean value (×106 Nmm2)3.603.483.68
EI, standard deviation (×106 Nmm2)0.150.120.09
Rmax,linear, mean value (N)164.3279.1838.12
Rmax,linear, standard deviation (N)12.500.750.95
Rmin,linear, mean value (N)5.034.633.96
Rmin,linear, standard deviation (N)0.630.150.22
Table 7. Results of bending tests on 3.6 kV cable.
Cable Length (mm)400600750
EI, mean value (×106 Nmm2)4.724.864.86
EI, standard deviation (×106 Nmm2)0.200.250.25
Rmax,linear, mean value (N)167.9683.440.32
Rmax,linear, standard deviation (N)9.171.501.70
Rmin,linear, mean value (N)5.635.124.98
Rmin,linear, standard deviation (N)0.330.150.09
Table 8. Results of bending tests on 24 kV cable.
Cable Length (mm)400600750
EI, mean value (×106 Nmm2)63.9866.1775.18
EI, standard deviation (×106 Nmm2)1.235.974.02
Rmax,linear, mean value (N)46.76165.72140.81
Rmax,linear, standard deviation (N)81.2938.2135.47
Rmin,linear, mean value (N)19.4617.1210.07
Rmin,linear, standard deviation (N)2.303.093.11
Table 9. Results of torsion tests on 1 kV cable.
Axial Pretension Force (kN)249
GKv, mean value (Nm/rad)8.0310.3212.04
GKv, standard deviation (Nm/rad)0.510.062.12
Tmax,linear, mean value (Nm)18.56 18.33 19.01
Tmax,linear, standard deviation (Nm)0.270.602.12
Tmin,linear, mean value (Nm)−4.42−4.11−4.46
Tmin,linear, standard deviation (Nm)0.030.910.15
Pmax,linear, mean value (×103 N)7.7811.2815.65
Pmax,linear, standard deviation (×103 N)0.270.370.70
Pmin,linear, mean value (×103 N)0.480.801.39
Pmin,linear, standard deviation (×103 N)0.030.150.15
Table 10. Results of torsion tests on 3.6 kV cable.
Axial Pretension Force (kN)249
GKv, mean value (Nm/rad)8.0310.3210.32
GKv, standard deviation (Nm/rad)0.190.120.81
Tmax,linear, mean value (Nm)16.6221.4924.48
Tmax,linear, standard deviation (Nm)0.300.850.44
Tmin,linear, mean value (Nm)−6.54−5.49−6.13
Tmin,linear, standard deviation (Nm)0.050.180.22
Pmax,linear, mean value (×103 N)8.5811.8815.79
Pmax,linear, standard deviation (×103 N)0.200.440.59
Pmin,linear, mean value (×103 N)0.480.651.28
Pmin,linear, standard deviation (×103 N)0.070.490.18
Table 11. Results of torsion tests on 24 kV cable.
Axial Pretension Force (kN)249
GKv, mean value (Nm/rad)68.7979.6862.48 *
GKv, standard deviation (Nm/rad)2.872.876.88
Tmax,linear, mean value (Nm)57.7960.6361.56
Tmax,linear, standard deviation (Nm)3.762.490.64
Tmin,linear, mean value (Nm)−43.19−52.57−57.51
Tmin,linear, standard deviation (Nm)3.530.811.28
Pmax,linear, mean value (×103 N)6.5711.8517.71
Pmax,linear, standard deviation (×103 N)0.340.471.50
Pmin,linear, mean value (×103 N)1.172.195.01
Pmin,linear, standard deviation (×103 N)0.230.230.69
* Remark: This value was expected to be higher in magnitude than the corresponding value under the 4 kN pretension force. This lower value cannot be explained by the measurement data. Furthermore, no errors or observations made during the testing of the five samples can explain this lower value.
Disclaimer/Publisher’s Note: The statements, opinions and data contained in all publications are solely those of the individual author(s) and contributor(s) and not of MDPI and/or the editor(s). MDPI and/or the editor(s) disclaim responsibility for any injury to people or property resulting from any ideas, methods, instructions or products referred to in the content.

