Article

Heavy Metals in Sediments of Subarctic Meromictic Lakes of the White Sea as Possible Tracers of Environmental Changes

by
Dmitry F. Budko
1,
Liudmila L. Demina
1,*,
Elena D. Krasnova
2 and
Dina P. Starodymova
1
1
Shirshov Institute of Oceanology, Russian Academy of Sciences, 36 Nakhimovsky Prospekt, 117997 Moscow, Russia
2
Biological Faculty, Lomonosov Moscow State University, 1/12 Leninskie Gory St., 119234 Moscow, Russia
*
Author to whom correspondence should be addressed.
J. Mar. Sci. Eng. 2023, 11(9), 1753; https://doi.org/10.3390/jmse11091753
Submission received: 28 July 2023 / Revised: 4 September 2023 / Accepted: 5 September 2023 / Published: 7 September 2023
(This article belongs to the Topic Aquatic Environment Research for Sustainable Development)

Abstract

:
Meromictic lakes of the marine coast, quite widely distributed in the northern hemisphere, are the result of climate changes and glacier retreat. The bottom sediments of these lakes serve as a geological chronicle of the history of marine basin’s development with the geochemical occurrence forms of elements indicate various processes of their accumulation. This paper presents research results concerning the occurrence of forms of heavy metals in lake sediments along the coast of the White Sea. These results are based on a sequential seven step leaching procedure, followed by ICP-MS analysis and subsequent statistical data processing. To determine differences among the examined geochemical parameters, Pearson’s correlation analysis and Ward’s cluster analysis were utilized. The total content of Cr, Mn, Fe, Co, Ni, Zn, V, and Pb in the sediments did not exhibit significant differences based on their degree of isolation from the sea. The major contribution to deposition of these metals in sediments of the meromictic lakes studied is the residual form, encompassing the mineral matrix of the sediment. At the same time, the elevation of mobile forms for all the metals examined corresponds to an increase in the isolation of lakes from the White Sea. In the meromictic lake sediments, concentrations of Cu, Mo, and U demonstrated significant increases in forms tightly bound to organic matter, while Cd exhibited an association with Fe-Mn oxyhydroxides. Notably, a significant difference in the occurrence forms of Cu, Cd, Mo, and U was evident in the reduced sediments of meromictic lakes when compared to those of open sea bays. The meromictic lakes along the White Sea coast, positioned at various stages of isolation, hold promise for investigating the migration of metals in response to environmental changes.

1. Introduction

The contemporary catchment area of the White Sea, situated at the eastern edge of Fennoscandia, undergoes an ongoing glacial-isostatic uplift that ensued after the retreat of the ice sheet during the late Pleistocene [1]. Various estimates suggest that the rate of uplift for the Fennoscandian territory ranges from 2 to 7 mm per year [2,3]. In the context of historical timescales, when considering rates of uplift in coastal zones, coastal bays undergo a transformation into enclosed lakes.
The increasing isolation of these lakes from the sea gives rise to alterations in temperature, salinity, pH, and redox potential (Eh) within the aquatic environment [4,5]. The surface waters in the lakes are undergoing desalination, whereas in the lower layers of the water column remnants of seawater persist. This leads to the establishment of a sustained, long-term vertical stratification in the water mass according to its physicochemical properties (miromixis), promoting the ongoing process of sulfate reduction in the anaerobic environment of the lower water layers. Reduction of dissolved sulphates to sulfides and the consequent production of hydrogen sulfide (H2S) intensifies as lakes become more isolated from the sea. In one of the water bodies studied (Lake Trekhtsvetnoe), H2S content in near-bottom waters reached 957 mg/L, which is higher than the values found in most of the known lakes of marine origin [6].
The isolation of lakes from the sea might be manifested in the characteristics of bottom sediments, which function as a natural recorder of processes unfolding across the entire aquatic ecosystem [7]. It is established that modifications in the sedimentation environment are mirrored in the distribution of geochemical fractions (forms of occurrence) of metals within bottom sediments. These fractions are associated with diverse mobile and inert sediment components, such as Fe and Mn oxyhydroxides, carbonates, organic matter, sulfides, clay, and clastic minerals [8]. Certain heavy metals, including Fe, Mn, Mo, and U, are responsive to alterations in redox conditions [9,10,11]. Notably, an essential aspect influencing the behavior of metals under anoxic conditions is their co-precipitation with sulfides [12].
In a prior study, we have revealed an increase in the content of Hg, Cu, Mo, Cd, and U in reduced sediments from meromictic lakes along the White Sea coastline compared to the oxidized sediments of sea bays [13]. Within that study, noticeable correlations between the distribution of total metal contents and total sulfur and organic carbon were observed. However, the precise significance of geochemical carriers in the processes of sediment deposition of heavy metals remained somewhat unclear. The aim of this study was to assess the effect of environmental changes on the geochemical behavior of twelve heavy metals (Cu, Cd, Co, Cr, Fe, Mn, Mo, Ni, Pb, U, V, and Zn) in bottom sediments from various lakes at distinct stages of separation from the White Sea coast. To achieve this objective, the study addressed the following tasks: (1) quantification of the partitioning of these metals among seven co-existing geochemical phases (exchangeable ions, carbonates, Fe-Mn oxyhydroxides, weakly bound organic matter, strongly bound organic matter, sulfides, residual mineral matrix) using a sequential extraction procedure; (2) identification of the main distribution characteristics of these metals in bottom sediments across areas characterized by different environmental conditions; and (3) evaluation of discrepancies in the distribution patterns of heavy metals between the examined lakes.

2. Materials and Methods
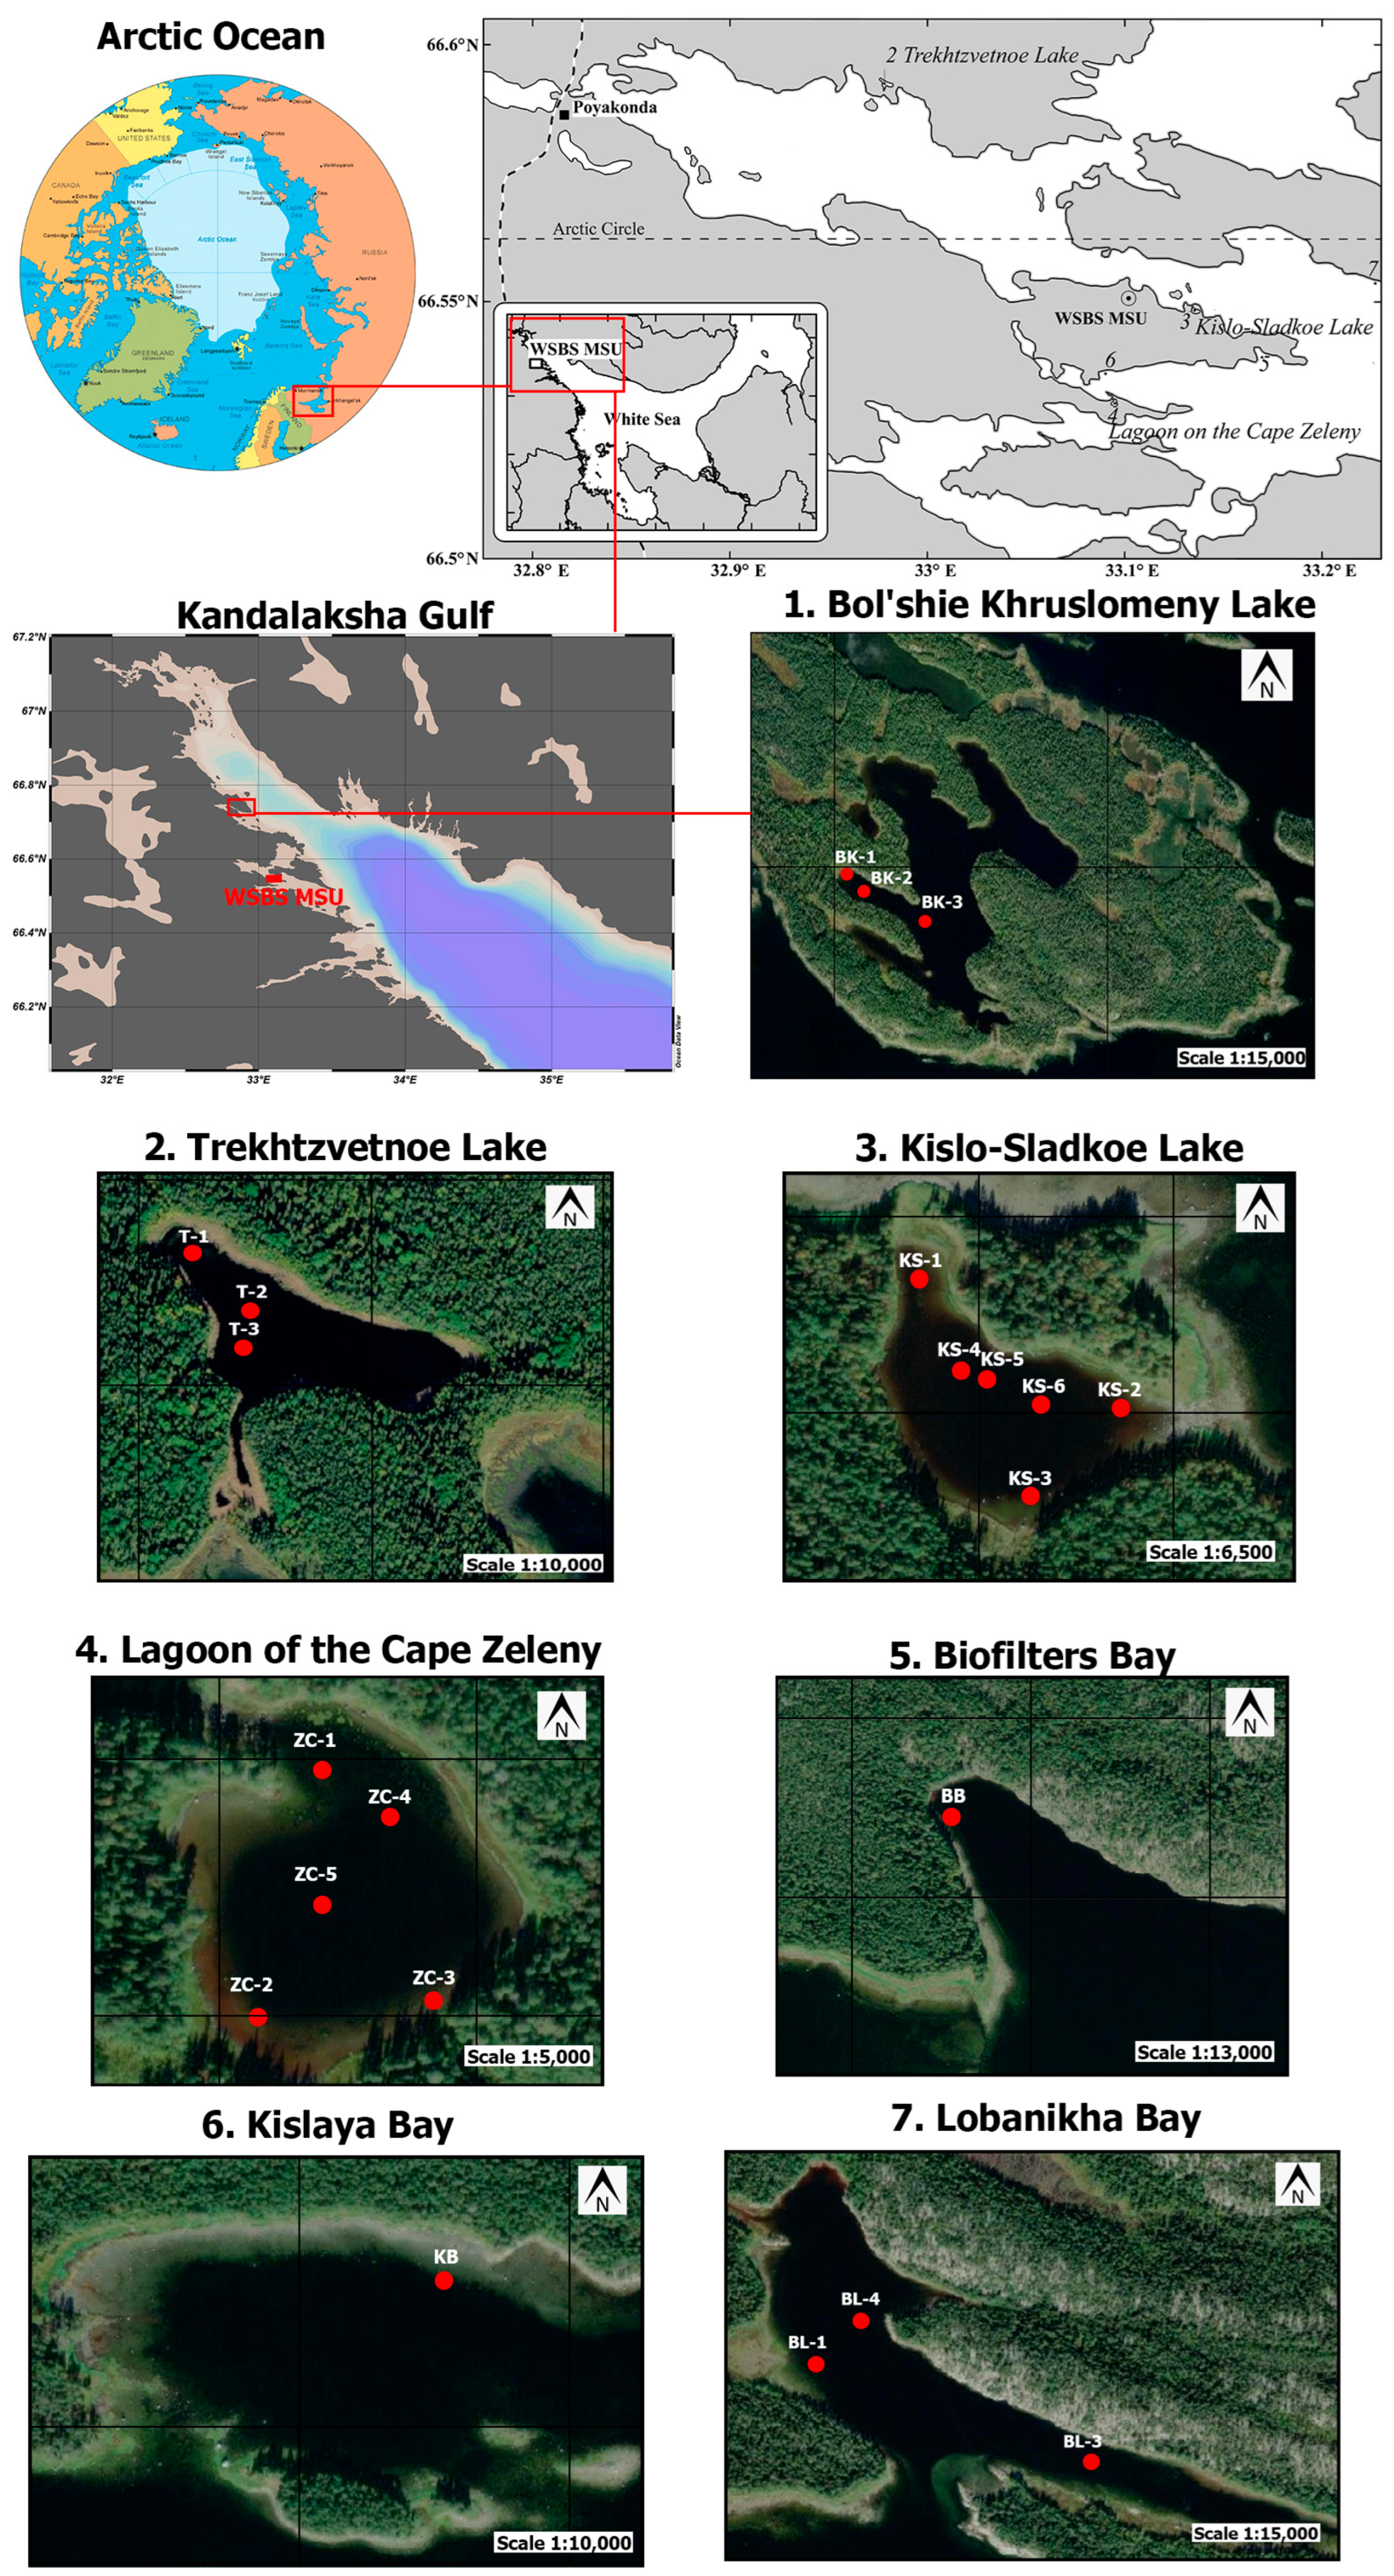
2.1. Study Area

The investigated lakes are located along the Karelian coast of the Kandalaksha Bay in the White Sea, adjacent to the White Sea Biological Station of Moscow State University (Figure 1; coordinates provided in Table 1).
The humid subarctic climate of the study area is influenced by the tempering effect of Atlantic cyclones and frequent incursions of air masses from the Arctic [14]. The basement of the Kandalaksha Bay’s seabed is composed of Archean rocks from the Belomorian Domain of the Baltic Shield [15,16]. In regions like the Kindo Peninsula, Zeleny Peninsula, and Velikiy Island, where the studied lakes are located, the geological formations consist of plagioclase-biotite orthogneiss and amphibole-plagioclase schist [17]. These rock complexes from the Baltic Shield also contribute significantly to the mineral composition of the surface bottom sediments of the White Sea, resulting in a generally homogeneous composition [18]. Quartz and feldspars dominate the mineral composition of the Kandalaksha Bay sediments, constituting at least 90%. The heavy minerals include amphiboles (predominantly hornblende), garnet, epidote, and clinopyroxene. Carbonate minerals represent a minority, making up no more than 2% of the overall mineral composition of the sediments [18].
The seabed of the Kandalaksha Bay features a block structure with an intricate network of faults of varying orders and orientations. This results in a complex shoreline configuration characterized by numerous rugged bays and small rocky islands (skerries) that expose the bedrock [19]. The contemporary topography of the Karelian coast of the White Sea bears the imprint of Quaternary glaciations, evident in a variety of glacial relief forms including morainic ridges and lake basins [20]. Isostatic uplift, initiated after the retreat of theLate Pleistocene glaciation and ongoing to the present day, continues to shape the relief of the Karelian coast [1]. Within the study area of the Kandalaksha Bay, the coastal zone’s uplift rate is estimated to be approximately 3 mm per year [21]. This phenomenon has led to the formation of relict lakes along the coastline that were formerly sea bays.
The Kindo Peninsula and its surrounding experience relatively cold climatic conditions, and the presence of nutrient-depleted acidic crystalline rocks contributes to the low productivity of terrestrial ecosystems [22]. In terms of biogenic components (P-PO4−, 0–56 μg/L; N-NH4+, 0–20 μg/L; Si, 0.02–2 mg/L), the upper layer of the water column (myxolimnion) in the studied lakes (Cape Zeleny lagoon, Kislo-Sladkoe, Trekhtzvetnoe Lake) can be classified as oligotrophic. However, productivity experiences a sharp increase in the chemocline zone due to the proliferation of unicellular phototrophs, while in the anoxic zone, a substantial concentration of nutrients was observed [23].
The process of lakes detaching from the sea can be delineated into distinct stages, each characterized by specific sill height relative to sea level and a decline in the influx of seawater into the lake [24]. Along the Karelian coast of the Kandalaksha Bay, the separation of scoop-like sea bays from the sea occurs due to underwater sill, which complicate water exchange in the lower layers, potentially resulting in euxinic conditions (Stage I). During this stage, the typical tidal range (approximately 2 m) for the Kandalaksha Bay of the White Sea remains operative. The first separation stage encompasses Kislaya Bay (without bottom anoxia), Lobaniha Bay (occasionally experiencing bottom anoxia), and Biofilters Bay (persistently under sulfide anoxia). Proceeding to the second stage, a lagoon is formed with restricted interaction with the sea. If the underwater sill elevates above low water levels but has yet to reach the point of hight water level, tidal amplitude reduces, and tides become asymmetrical (short high tide and extended low tide), as observed in the Lagoon on Cape Zeleny and Bol’shie Khruslomeny Lake. When the sill surpasses the hight water levels, the daily influx of tidal waves into the lake ceases. However, for a period, seawater can still enter due to intense wind surges or syzygial tides (Lake Kislo-Sladkoe). Stage III signifies the cessation of seawater inflow, leading to the lake’s surface layer becoming fresh, while relict seawater lingers in the lake’s depths, resulting in the formation of a meromictic lake. In such lakes, seawater inflow might only occur sporadically, coinciding with syzygial tides and powerful storm surges (Lake Trekhtzvetnoe). Finally, at stage IV, desalination extends to the bottom layer, rendering the lake fully fresh. It should be noted that lakes at this stage are not within the scope of this study.
Trekhtzvetnoe Lake, with an area of approximately 32,500 m2 and a maximum depth of about 7.5 m, is a representative meromictic lake fully separated from the sea [4,24]. Its three-layer water column comprises an upper freshwater layer, a lower saline sulfide layer, and an intermediate gradient layer that functions as both a halocline and a redox boundary, collectively forming a chemocline [25]. An exceptional feature of this meromictic lake is the substantial concentration of hydrogen sulfide (H2S) in its lower waters, reaching levels of 500–957 mg/L, surpassing the concentrations observed in many analogous anaerobic water bodies [26].
Lake Kislo-Sladkoe, spanning an area of approximately 12,600 m2 with a maximum depth of roughly 4 m, is separated from the White Sea by a wide rocky sill [24,27]. Unlike Trekhtzvetnoe Lake, seawater enters Lake Kislo-Sladkoe during spring tides and strong wind surges, while freshwater runoff remains negligible. Consequently, surface waters with low salinity are established, reaching minimum values (6–7 PSU) after snow and ice melting, and peaking during winter (20–25 PSU). Waters below a depth of 2 m exhibit salinity levels approximately equivalent to or higher than those in the sea (24 PSU), a result of salt crystallization during winter freezing [28]. The maximum recorded H2S concentration in this lake was 20 mg/L [26].
Lake Bol’shie Khruslomeny, with a maximum depth of approximately 18 m, is the largest known lake separated from the Kandalaksha Gulf [29]. Unlike other lakes under study, Lake Bol’shie Khruslomeny was artificially separated from the sea. Over 130 years ago, in response to the freshwater needs of the village of Lesozavodsky, a stone embankment was constructed across a narrow strait that reached deep into the land from the nearest sea bay. This alteration aimed to supply fresh water to the wood-processing factory. Despite this intervention, seawater persisted within the reservoir, preventing complete desalination of the lake. As a consequence, a desalinated surface layer (approximately 4–7 PSU) formed, while the lower waters retained a salinity comparable to that of the sea (about 24 PSU) [30]. Consequently, a meromictic structure emerged in this lake. Beneath the halocline, situated at a depth of 2–3 m, a sulfide water mass developed around 4–4.5 m deep [29].
The Lagoon on Cape Zeleny is connected to the sea through a rocky isthmus, enabling seawater to enter during each tidal cycle. Its surface area is 20,000 m2, and it has a maximum depth of 6.5 m [4,24]. The amplitude of tidal in the lagoon is estimated at 10–15 cm. Anoxic conditions solely manifest in the near-bottom water layer (beyond 5 m depth) of the lagoon. The highest recorded H2S content in the lagoon was 120–160 mg/L, and the bottom waters experienced a salinity of 29 PSU due to salt crystallization during winter freezing [26].
Lobanikha, a scoop-like bay located on Velikiy Island, features a depth of 13.5 m at low tide and maintains a continuous connection to the sea through a narrow shallow strait. This bay sporadically develops an anoxic zone, with a maximum H2S content of 0.61 mg/L, as first documented in the summer of 2020 [31]. Biofilters Bay is a small scoop-type bay with maximum depths ranging from 14 to 16 m (depending on tidal phase), permanently linked to the sea. However, the bottom sill at the bay entrance hampers efficient mixing of the bottom waters. Consequently, oxygen-depleted conditions prevail below 8–9.5 m depth, with a maximum H2S concentration of 25 mg/L [31]. The apex part of Kislaya Bay also possesses a scoop-like configuration. Unlike other studied sea bays, the water column in this area remains unstratified, and euxinic conditions have not yet been observed. All three bays share salinity levels of approximately 24–25 PSU [31].

2.2. Sampling

Samples of the surface layer (0–5 cm) from the bottom sediments were collected in September 2020 using the Ekman bottom grab. The sampling procedure encompassed a range from the water’s edge to the deep-water area. At each sampling site, the pH and redox potential (Eh) of both the bottom water and sediments were measured employing the Anion 7050 portable ionomer (Anion, Russian Federation). In total, 22 sediment samples were meticulously collected. A comprehensive depiction of each sample site and various sediment characteristics for each site are comprehensively presented in Table 1.

2.3. Sample Preparation

When investigating the occurrence forms of metals in sediments, especially the reduced forms, it becomes crucial to employ appropriate methods for primary sample preparation. The drying process of reduced sediments in the presence of oxygen can adversely affect the occurrence forms of metals [32]. Of particular concern is air drying at room temperature and oven drying [33]. In this study, immediately after sampling, sediments were carefully placed in hermetic plastic zip-bags and then stored in a portable cooler-bag for transport to the stationary laboratory. Upon arrival, the sediment samples were stored in a refrigerator at a temperature of minus 18 °C. In the stationary laboratory, the sediments underwent the freeze-drying method for desiccation. Subsequently, the dried samples were finely ground using an agate mortar to achieve a powdered state.

2.4. Analytical Procedures

The grain-size composition of the wet sediments was determined using the water-mechanical analysis method [34]. The determination of total carbon (TC), total organic carbon (TOC), and total sulfur (Stot) was performed using a EuroEA300 CHNS-O analyzer (EuroVektor SPA, Pavia, Italy) at the analytical laboratory of the Shirshov Institute of Oceanology RAS. The calculation of total inorganic carbon (TIC) was achieved by subtracting TOC from TC. To analyze the occurrence forms of metals in sediments, a sequential leaching method was employed based on two schemes proposed by [35,36]. The first scheme facilitated the differentiation of easily adsorbed compounds (exchangeable ions held by weak electrostatic bonds) from carbonates and other specifically adsorbed metals. Meanwhile, the second scheme allowed the separation of elements bound to organic matter from those associated with sulfides. The latter differentiation is crucial when studying highly reduced sediments. Since the reagent used to extract Fe and Mn oxyhydroxides was consistent across both schemes, the more readily leachable forms (exchangeable ions and carbonates) were extracted following the scheme proposed by [35], followed by the extraction of more stable compounds according to the scheme proposed by [36].
A depiction of the ultimate sequential chemical extraction scheme is provided in Table 2. A total of seven distinct occurrence forms of metals were identified: ion exchangeable (F-1), carbonates (F-2), iron and manganese oxyhydroxides (F-3), weakly bonded to organic matter (F-4) (including fulvic acids and other labile organic compounds), strongly bonded to organic matter (F-5) (encompassing humic acids and other stable organic compounds), sulfides (F-6), and residual (F-7) (resulting from complete acid digestion).
The first two fractions are regarded as the most labile and bioavailable, while forms F-3, F-4, F-5, and F-6 exhibit lower mobility but possess the potential for mobilization under diverse environmental conditions [38]. Form F-7, referred to as the residual, encompasses metals immobilized within mineral crystal lattices, rendering them geochemically inert. Following each leaching step, solution, and solid phases unaffected by reagents were separated using centrifugation (3500 rpm) for 30 min. Subsequently, the solution was decanted and filtered through syringe filter nozzles (SEP, 0.45 µm). The remaining residue was rinsed with 5 mL of deionized water, with the washings combined into the final solution, which was then diluted to 50 mL using 3% nitric acid.
For the determination of total metal content in sediment samples (100 mg dry weight), a conventional technique involving complete digestion was employed. This digestion employed a mixture of 1.5 mL of nitric and fluoric acids (in a 5:1 volume ratio) within an MWS Speed Wave microwave system (Berghof Products, Heusden-Solder, Belgium). Detailed information on this procedure can be found in previous works [12]. Ultra high-grade HNO3, as well as HF and HCl double distilled using a Berghof BSB-939-IR acid purification system (Berghof Products, Heusden-Solder, Belgium), were utilized. Upon completion of digestion, vials were subjected to triple evaporation at 70 °C, supplemented with 1 mL of HCl to dissolve fluorides formed during HF decomposition. In cases involving samples with substantial organic matter content, perchloric acid was incorporated into the mixture of HNO3 and HCl for digestion. This same acid combination was applied for the blank analysis of such samples.
Concentrations of V, Cr, Mn, Co, Ni, Cu, Zn, Mo, Cd, Pb, and U in obtained leachates of metal forms and total content were determined using an Agilent 7500a ICP-MS (Agilent Technologies, Danta Clara, CA, USA) with an internal standard solution of indium (10 µg/g in each sample). Iron was determined by atomic absorption spectrometry (AAV) on a KVANT-2A spectrophotometer (Kortek, St.-Petersburg, Russian Federation). The accuracy of analyses was controlled by using NIST 2702 standard reference material (Inorganics in Marine Sediment) [39], and BCR 667 and BCR 277R (both—Trace Elements in Estuarine Sediment) [40]. The average recovery of the measured values relative to the certified values in the NIST 2702 standard was for V 121%, Cr 135%, Mn 94%, Co 126%, Ni 120%, Cu 117%, Zn 102%, Mo 115%, Cd 93%, Pb 107%, and U 110%. For the BCR 667 standard, the average recovery was for Cr 98%, Mn 74%, Co 102%, Ni 100%, Cu 95%, Zn 100%, Cd 100%, Pb 101%, and U 102%. For the BCR 227R standard, the average recovery was for Cr 135%, Co 115%, Ni 117%, Cu 104%, Zn 109%, and Cd 123%. The reproducibility of the ICP-MS method was estimated as a relative standard deviation (RSD) obtained for three repeated measurements of the standard sample. The reproducibility of the method within 10% was obtained for Mn, Co, Ni, Cu, Zn, Mo, Cd, and Pb. Reproducibility values were as follows: for V 11%, for U—12%, for Cr—19%.
To assess the efficacy of the sequential extraction procedure, the total metal content was compared with the cumulative content of its various forms (Table S1). Favorable recoveries (ranging between 80–120%) were achieved for V, Fe, Co, Ni, Pb, and U at most sites. Approximately half of the sites exhibited satisfactory recoveries for Cr, Cu, and Mo (below 80% or above 120%). However, the total Mn content was often underestimated in comparison to the sum of its forms. In the cases of Zn and Cd, the combined forms were lower compared to the total content across most sites.

2.5. Statistical Data Processing

Statistical data processing employed the Statistica 10.0 software. Prior to analysis, the data underwent preliminary assessment for normal distribution using the Kolmogorov–Smirnov test (K–S test), which was corrected through the Lilliefors test and the Shapiro-Wilk (W test). Samples not conforming to a normal distribution were subjected to a logarithmic transformation.
Pearson’s correlation analysis (at p < 0.01) and Ward’s cluster analysis with the measurement of the distance between clusters (using 1-Pearson r) were employed to evaluate relationships between total metal content, occurrence forms of metals, as well as TOC, TIC, and Stot.
To group the studied sites based on the similarity of metal distribution (total content and occurrence forms of metals) in bottom sediments, a Ward’s cluster analysis was conducted, employing the Euclidean distance between clusters. Subsequently, differences in metal form content within sediments across different groups of sites in water bodies were assessed using the nonparametric Kruskal–Wallis test (Kruskal–Wallis ANOVA) based on the identified clusters.

3. Results

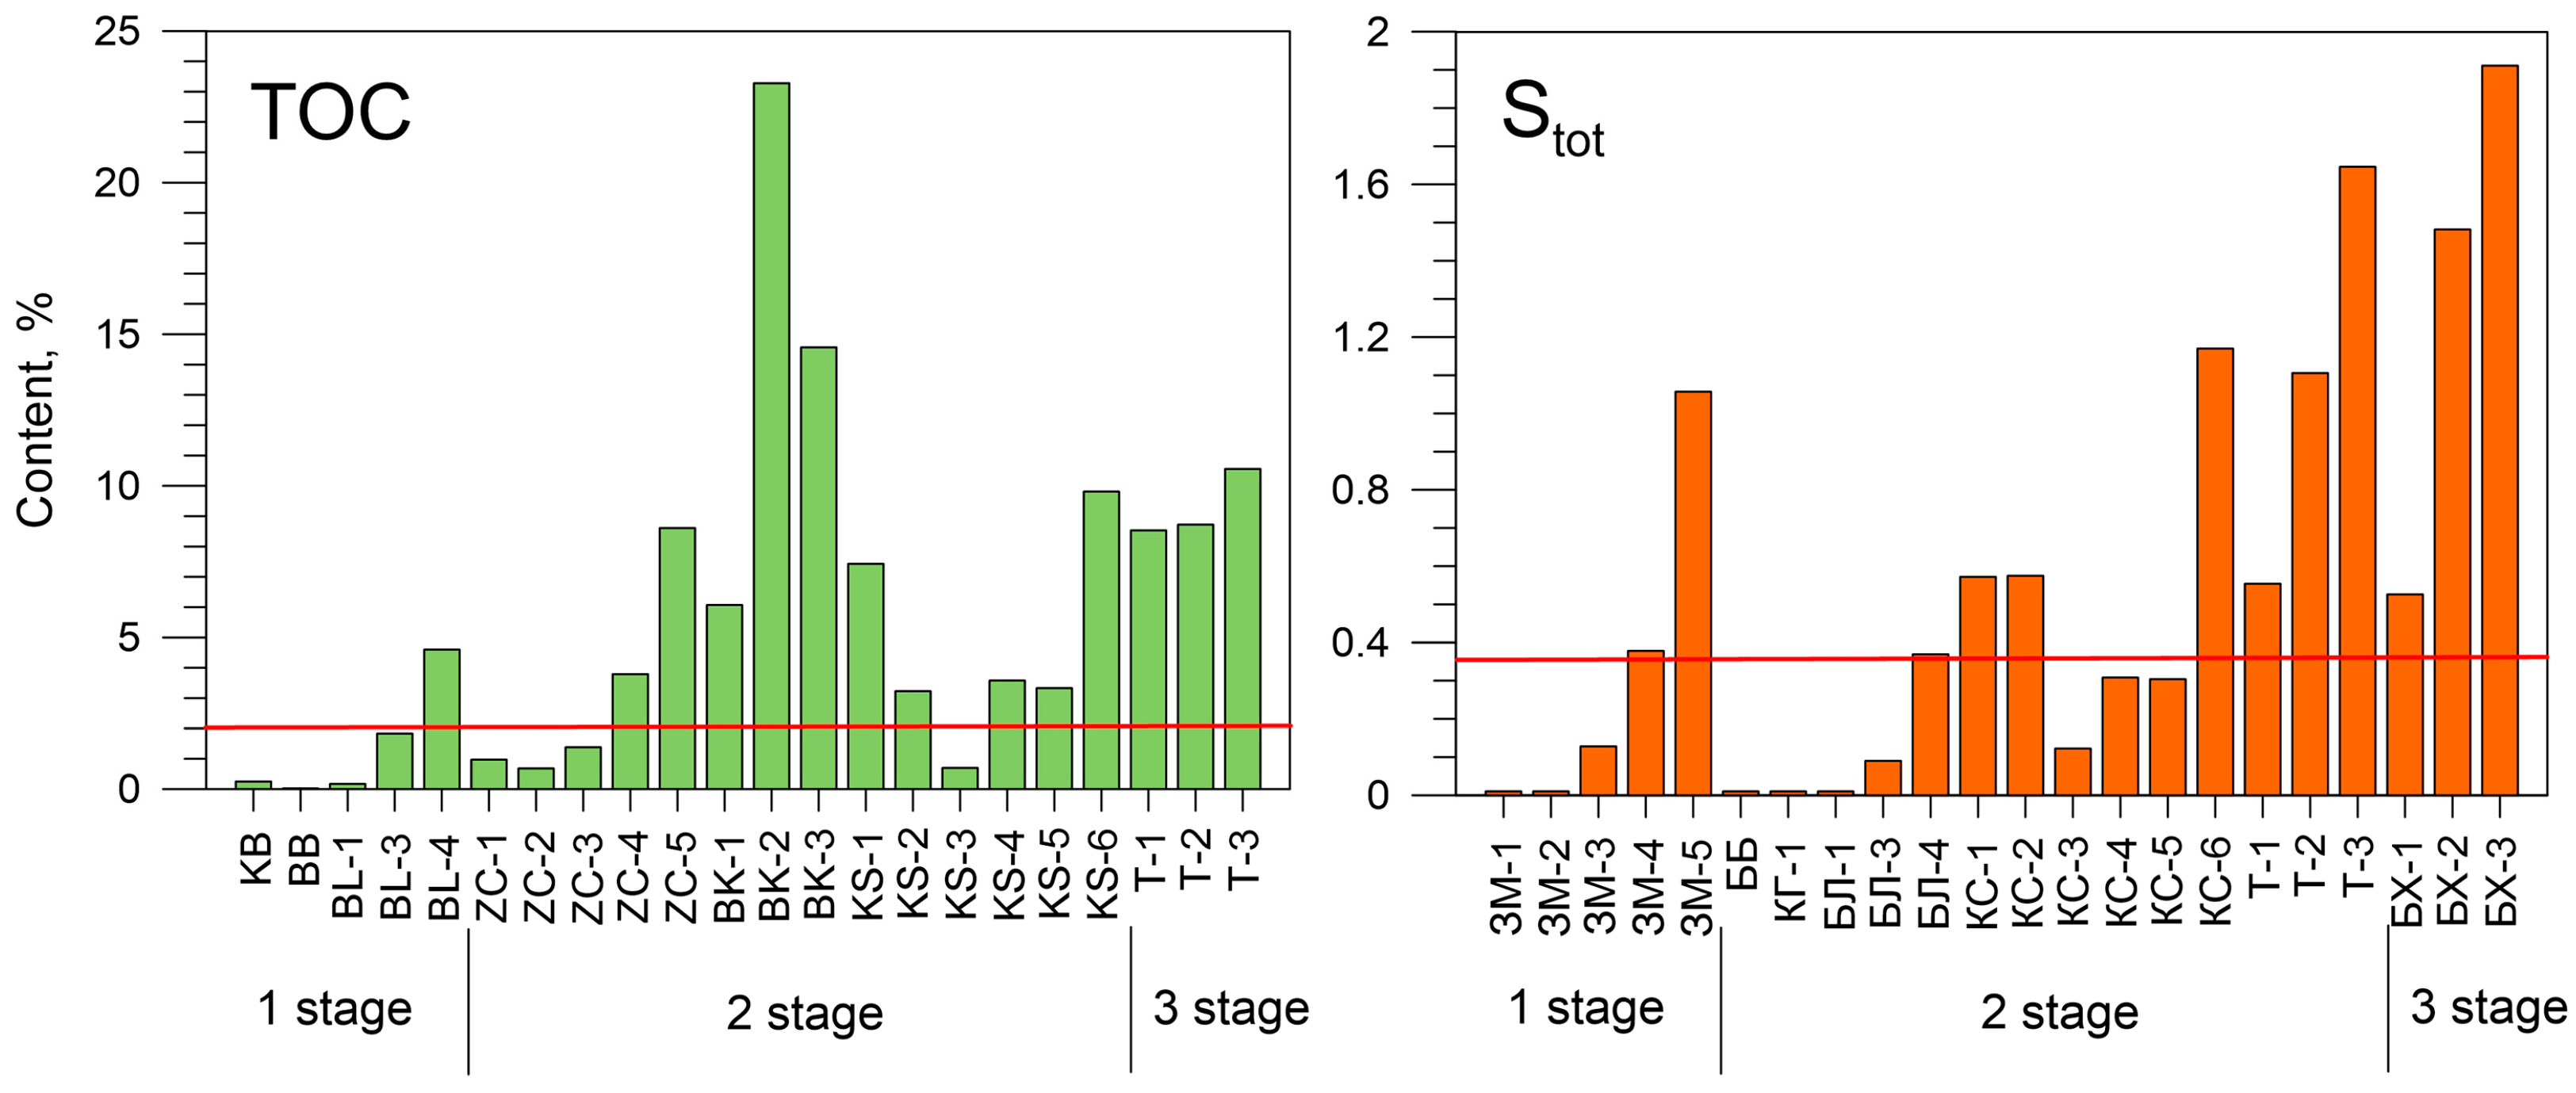
3.1. Lithological and Geochemical Chatracyteristics of Sediments

Some lithological and geochemical properties of meromictic lakes sediments of the White Sea coast are presented in Table 1.
The examined sediments were characterized by a strong variability in the grain-size composition, depending on the depth of the sampling site. The sediments in the shallow part (depth of 0.1–0.3 m) of the Kislaya, Biofilters and Lobanikha bays (Sts. KB, BB, BL-1) were composed of beige-green fine sand (~60–70% of the sand fraction). The sediments in the shallow sites (0.2–0.3 m depth) of the lagoon on the Cape Zeleny (ZC-1, ZC-2, ZC-3) and at one site in Kislo-Sladkoe Lake (KS-3) were represented by silty sand of grey colour. According to the grain-size analysis, the proportion of sand decreases to 27–59% at these sites. An increase in the pelitic fraction of the sediment is observed with increasing site depth. In the intermediate depth areas (0.9–3 m) in Lobanikha Bay (St. BL-3), lagoon on the Cape Zeleny (St. ZC-4) and Bol’shie Khruslomeny Lake (St. BK-1), beige-green silty pelitic mud was formed. The predominant grain-size fraction in these sediments was pelite (42–80%). Silty pelitic mud of a green-brown colour was also found at most sites in Kislo-Sladkoe Lake (KS-1, KS-2, KS-4, KS-5). Pelitic mud of black colour with an H2S smell was revealed in the sediments of the deep-water sites of the lagoon on the Cape Zeleny (ZC-5), Bol’shie Khruslomeny Lake (BK-3), and Kislo-Sladkoe Lake (KS-6). The sediments with such features were exposed in all three sites (T-1, T-2, T-3) of Trekhtzvetnoe Lake, and also at site BK-2 with shallower depths (3.2 m) of Bol’shie Khruslomeny Lake. Over 93% of these sediments comprised pelite. Sediments with a smell of H2S were found at the deep-water site (BL-4) in Lobanikha Bay. However, the pelite content of these sediments was reduced to 77%.
There was negligible variation in sediment pH between the lake sites studied. Sediments with weakly acid medium (pH 6.47–6.98) were the most common. Weak alkaline medium (pH 7.12–7.39) was found in sediments of Trekhtzvetnoe (Sts. T-2, T-3), Bol’shie Khruslomeny (all sites) lakes and Biofilter Bay. In most samples, the Eh values varied in the range of negative values: from –10 to –406 mV, except for the shallow sites in the Bay Lobanikha (BL-1) and Kislay Bay (KB), where Eh reached slightly positive values of +36 and +96 mV, respectively. At the same time, euxinic conditions (Eh < 0) developed also in the bottom water layers (hereinafter referred to as anaerobic sites) in the deep-water part of Trekhtzvetnoe (Sts. T-2, T-3), Kislo-Sladkoe (St. KS-6), Bol’shie Khruslomeny (St. BK-3) lakes, lagoon on the Cape Zeleny (St. ZC-5), and Lobanikha Bay (St. BL-4). The highest TOC content was detected in the meromictic lakes Trekhtzvetnoe (8.5–10.6%) and Bol’shie Khruslomeny (6.1–23.3%) (Figure 2).
Besides, a rather high TOC content was found in the anaerobic sites KS-6 in the Kislo-Sladkoe Lake (9.8% TOC), and ZC-5 in the lagoon on the Cape Zeleny (8.6% TOC), while in the sediment of the anaerobic sites of the Lobanikha bay the content of TOC was much lower (4.6%). In the sandy sediments of the shallow areas of the Kislo-Sladkoe Lake and the lagoon on the Cape Zeleny, the TOC content decreased to ~1–4%. The lowest TOC content (~0.1–0.2%) was found in the sands of the Biofilters and Lobanikha bays. In general, the sediments studied were characterized by low carbonate content. The average TIC content was 2.1% (Table 1). There was a weak correlation between the distribution of TIC and TOC (r = 0.36). Although maximum TIC contents were also found in deep water parts of meromictic lakes: KS-6—8.1%, ZC-5—4.0%, BK-3—3.8%, T-3—3.2%. The sediments of Lobanikha Bay contained up to 2.1% TIC. The lowest TIC content was found in the sediments of Biofilter Bay and Kislaya Bay (0.1–0.3%).
The distribution of Stot in the sediments exhibited a direct correlation with that of TOC (r = 0.89). The highest Stot content (1.9%) was detected in the Bol’shie Khruslomeny Lake (Figure 2). For all anaerobic sites (T-2, T-3, BX-3, KS-6, ZC-5) the sulpfur content exceeded 1%, except for St. BL-4 in Lobanikha Bay (0.4% Stot). In the sandy sediments of the sea bays (Sts. BB, KB, BL-1, BL-2), and the lagoon on Cape Zeleny (Sts. ZC-1 and ZC-2), the sulpfur content was below the detection limit of 0.01%. In the sediments of the other sites, the content of Stot varied in the range of 0.1–0.6%.

3.2. Distribution of Total Metal Contents

The distribution of the total metal content in the sediments of the examined aquatic environments has been elucidated in the prior investigation [12] and is also outlined in Table S1. Given the high degree of comparability between the total metal content and the cumulative sum of metal occurrence forms in the majority of instances (refer to Section 2.4), the distribution of the total metal content can be effectively characterized by the aggregation of metal forms displayed in Figure 3. The order of sites distribution in Figure 3 is indicated taking into account the stages of lake separation from the sea.
The total iron (Fe) content within the examined sediments exhibited variability within the range of 9.8–47.1 mg/g, with its highest values being observed in sediments of separation stage III (Sts. T-2, T-3) and the anaerobic site ZC-5. Conversely, manganese (Mn) demonstrated a maximal content (up to 1159 µg/g) within sediments of separation stage I (Sts. BB, KB, BL-1). Vanadium (V) and chromium (Cr) exhibited closely similar contents across the studied sediments, ranging from 31.1–82.5 µg/g and 35.7–98.5 µg/g, respectively. The highest level of these metals’ content was discerned in sediments originating from the anaerobic site BL-4 of Lobanikha Bay and Kislo-Sladkoe Lake. Elevated content of cobalt (Co) (up to 14.1 µg/g) and nickel (Ni) (up to 47.5 µg/g) was noted in lake sediments within the later stages of separation, especially in Kislo-Sladkoe and Trekhtsvetnoye lakes. The lowest content of these metals was recorded within Lake Bol’shie Khruslomeny sediments (Sts. BK-2, BK-3).
Copper’s (Cu) total content ranged from 2.4 µg/g in sediments of water bodies during separation stage I to 33.2 µg/g in lake sediments of separation stage III. Conversely, total zinc (Zn) exhibited an increased content (up to 113.8 µg/g) within sediments of the anaerobic site ZC-5 and Trekhtzvetnoe Lake, the latter being in the III stage of separation from the sea. In other locations, the distribution of total Zn displayed a relatively uniform pattern. The total molybdenum (Mo) content within the examined sediments exhibited variation from 0.3 to 44.2 µg/g. Notably, the peak Mo content was recognized at sites of water bodies during separation stage II (ZC-4, ZC-5, BK-3, KS-1, KS-6). Total lead (Pb) (4.6–16.9 µg/g) and cadmium (Cd) (0.05–0.62 µg/g) contents demonstrated relatively even dispersion within the studied sediments, with a few exceptions. Elevated Cd content was prominently present in separation stage III sediments, exhibiting peaks at St. ZC-5 and KS-1. Lead exhibited elevated content in Lake Bol’shie Khruslomeny sediments. Uranium (U) showed a minimum content (0.86–1.41 µg/g) within sediments of separation stage I (excluding the anaerobic site BL-4), while maximum content was apparent in sediments from Kislo-Sladkoe Lake during separation stage II (1.57–8.66 µg/g).

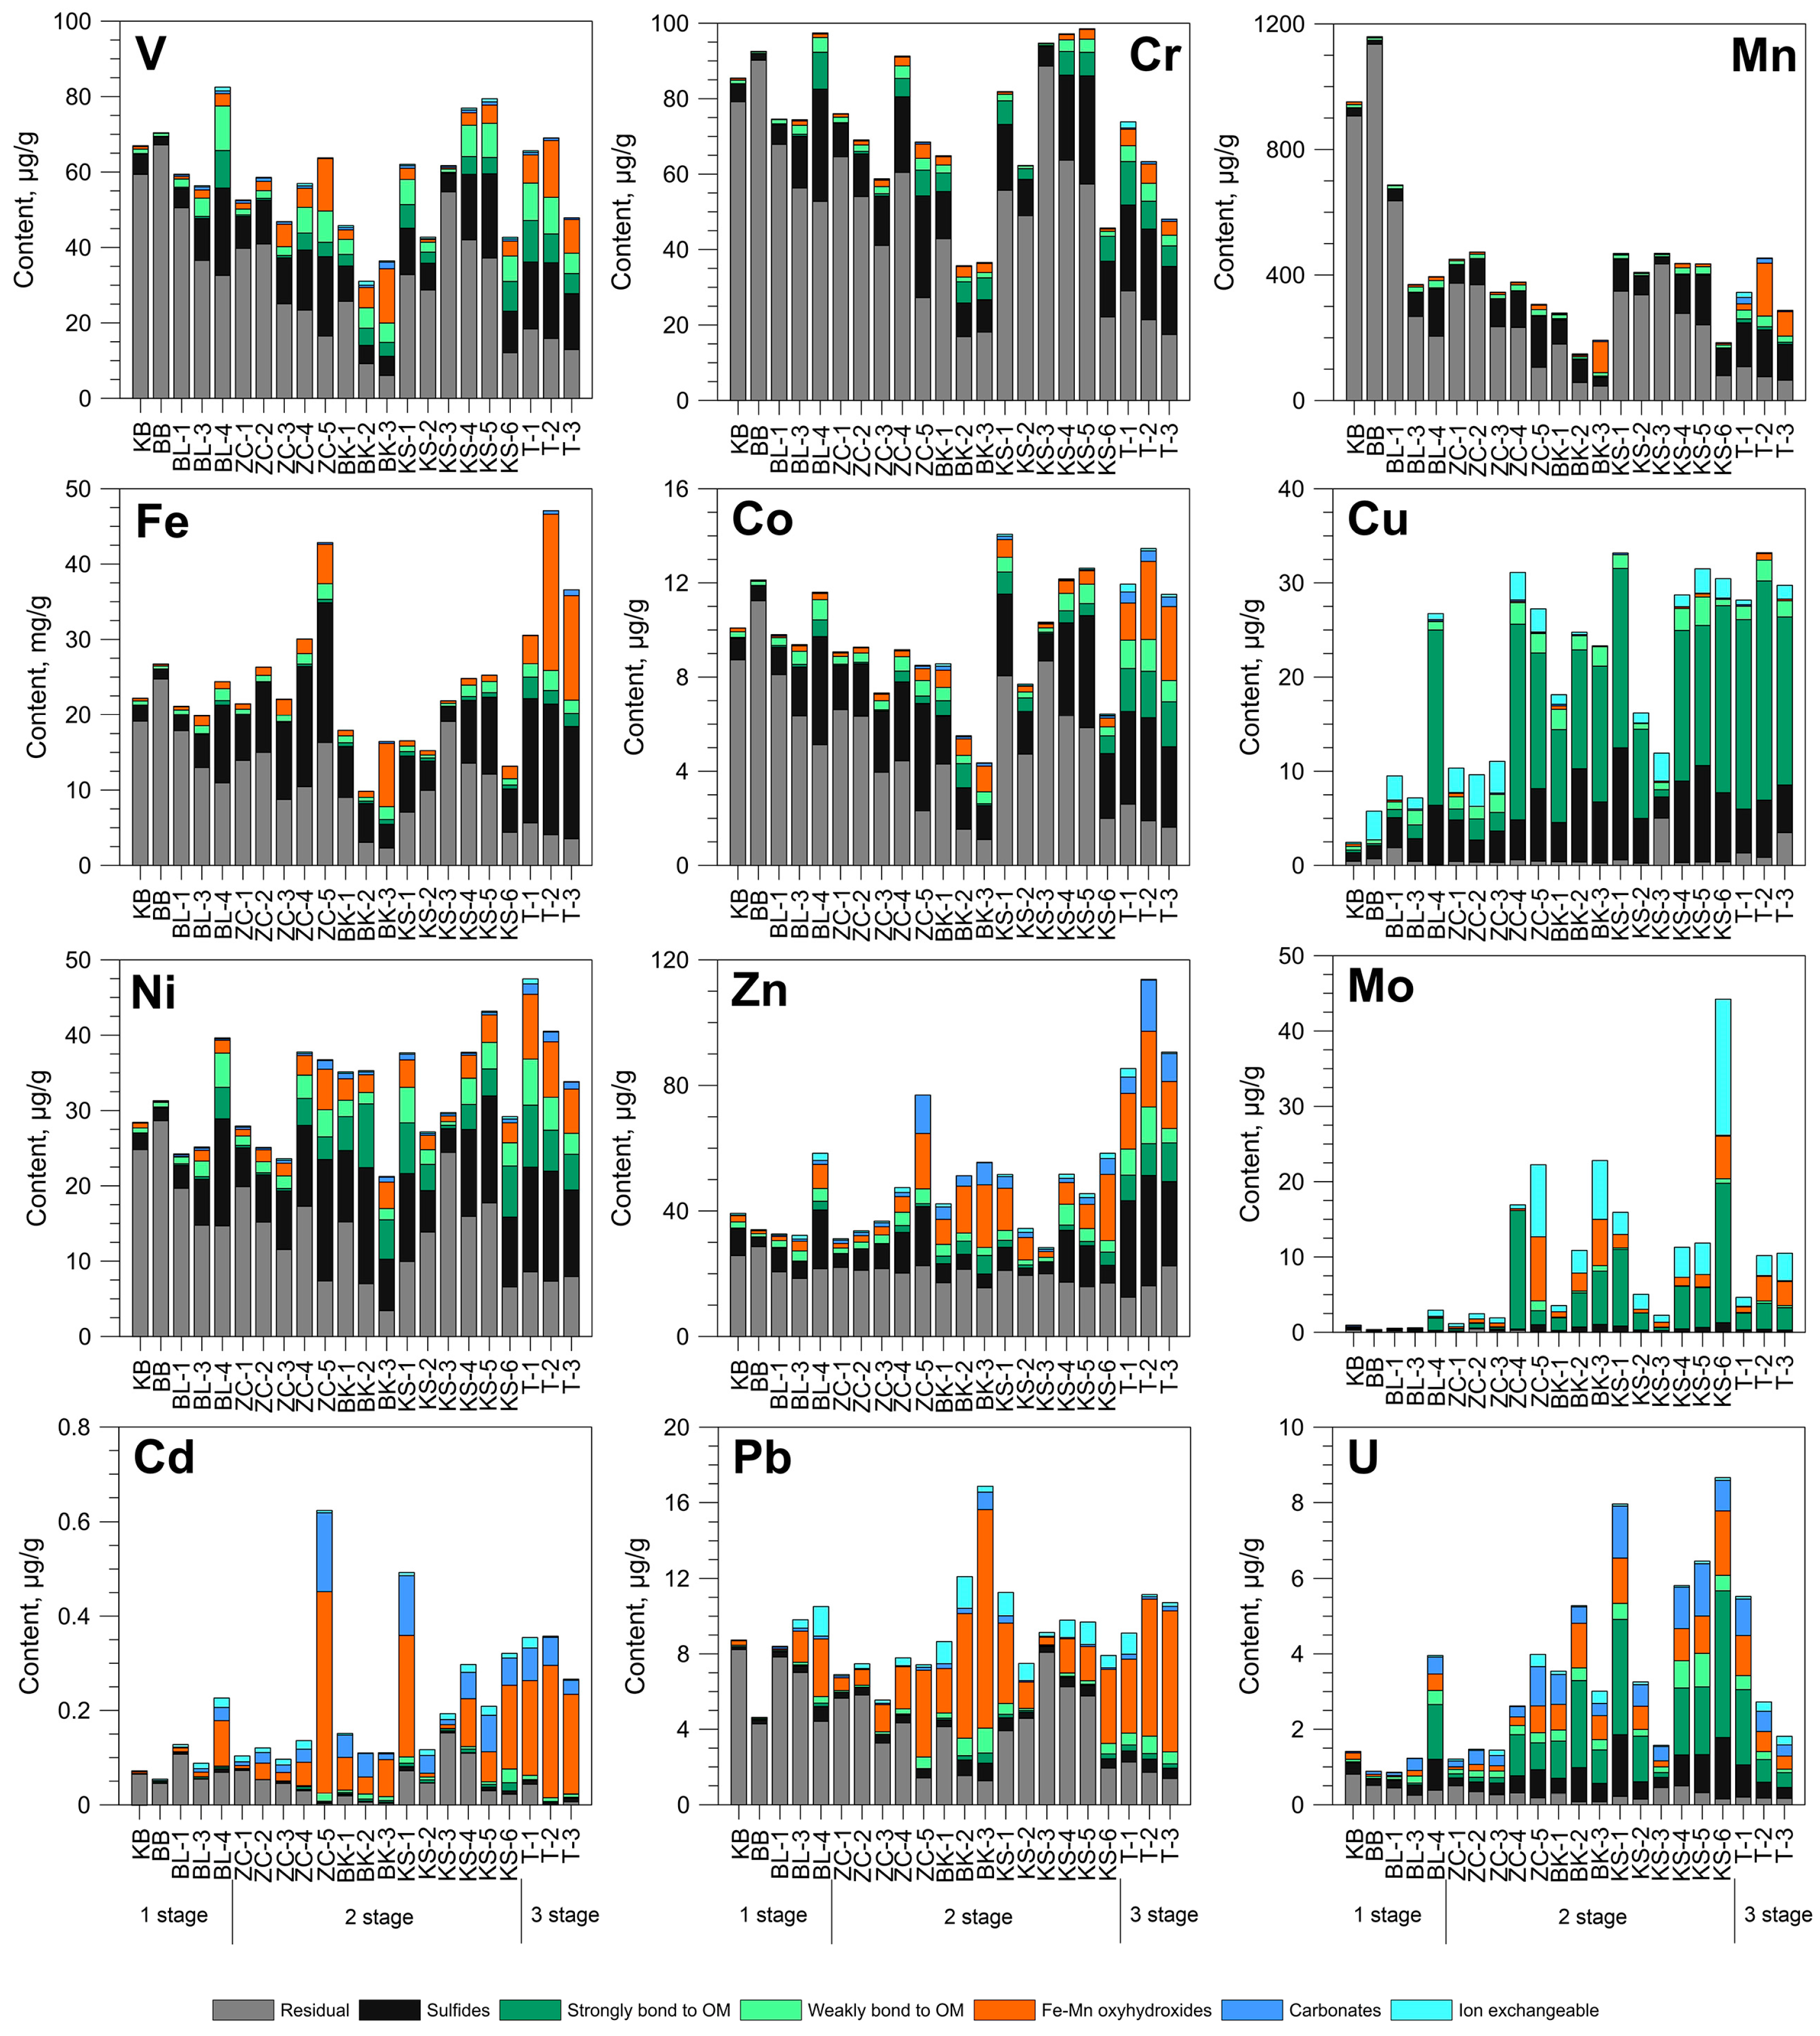
3.3. Forms of Heavy Metal Occurrence in Sediments

In Figure 3, the distribution of seven occurrence forms of heavy metals in the lake sediments of the White Sea coast is displayed.
Manganese has the largest proportion of the residual form F-7. The percentage of this Mn form varied from 97.9% in the sediments of Stage I separated lakes to 16.7% in the sediments of Stage III separated lakes, averaging at 62.1% of the sum of forms. The second most important form of Mn was F-6 (sulfides). The Mn-6, contrary to the residual form, represented the lowest percentage in sediments of Stage I separated lakes, which increased to 53.1% of the total Mn in the sediments of Stage II and III (especially at anaerobic sites). The average percentage of the Mn-6 was 25.7% of the sum of forms. Among the other forms of Mn, the F-3 form (oxyhydroxides) was significant at only three sites: BK-3 (51.4%), T-2 (37.1%), and T-3 (27% of the total Mn).
Chromium like to Mn, demonstrated predominance of residual F-7, which exceeded 60% of the forms sum on average. The association with sulfide F-6 was the second significant form for Cr, with a proportion varied from 2% to 39.3% of the forms sum. The F-5 form (strongly bound to OM) also represented more than 10% of the total Cr in sediments from anaerobic sites.
For metals such as V, Co, Fe, Ni, Zn and Pb, the proportion of the residual form decreased on average to about half of the total content. With the exception of Pb, the association with sulfides (F-6) was also of secondary importance among the forms of these metals. Iron had the largest portion of F-6 among all studied metals with more than 30% of its total content on average (Figure 3). Iron occurred mainly in the form F-3 (oxyhydroxides), which ranged from 17.9 to 51.1% of the forms sum in sediments from anaerobic sites (ZC-5, BK-3, KS-6, T-2, T-3). The other forms of Fe made a negligible contribution to the total content.
The form associated with sulfides (F-6) related to V, Co, Ni, and Zn was about a quarter of their total content, but the proportion of more labile forms (F-3, F-4, and F-5) was elevated for these metals. At the anaerobic site in the lagoon on Cape Zeleny (ZC-5), the maximum proportion of the F-6 form was recorded for V, Co, Ni, and Zn (28 to 56% of the forms sum).
Increased proportions of F-4 (weakly bound to OM) and F-5 (strongly bound to OM) were found in sediments of lakes at separation stages II and III for V and Ni. The proportion of the F-3 increases to 39.5% and 18.1%, respectively, for V and Ni in sediments from anaerobic sites. In the distribution of Co forms, a substantial increase in the proportion of F-3, F-4, and F-5 was observed in the sediments of Lake Trekhtzvetnoe (III stage of separation). The F-1 and F-2 forms represented only 1–2% of the total content of these metals.
The distribution of Zn forms was significantly contributed by the form F-3, accounting for 2.5 to 36.2% of the sum of forms. This form of Zn was predominantly higher in the sediments of lakes with II and III stages of separation compared to water bodies of I stage of separation. Among the metals studied, Zn exhibited increased proportions of F-2 (carbonates) and F-4 (weakly bound to OM) forms. Regardless of the lake separation stage, the F-4 form for Zn is found consistently in all sites, accounting for 3.0–12.9% of the total forms. Form F-2 for Zn varied from 0.5% in sediments of water bodies of stage I of separation to 10% in lake sediments of stage III of separation. The proportion of this Zn form increases to 12.7–15.9% of the total metal content in three anaerobic sites (ZC-5, BK-3, and T-2).
For Pb, the F-3 associated with oxyhydroxides was of secondary importance (on average 30% of the forms sum). Form F-3 was the predominant for Pb speciation at 8 sites, accounting for 38–70% of the total metal content. The Pb-1 (ion-exchangeable form) was also distinguished, constituting 11–15% of the sum of forms at seven sites belonging to lakes of II and III stages of separation.
Regarding Cu, Mo, Cd, and U, the mobile fractions (F1 to F6) were dominant in comparison to the residual form F-7. Copper and Mo were the most labile metals, wherein the sum of the mobile forms dominated, even in the sediments of lakes in I stage of separation (constituting over 75% of the sum of forms).
Copper exhibited the greatest proportion of forms bound to organic matter (F-4 and F-5) compared with other metals. On average, the F-5 and F-4 fractions contained 43.3% and 8.8% of the total Cu, respectively. The content of Cu in the F-5 form increased from stage I to stage III of lake separation, reaching a maximum of 71.4% of the sum of forms in the sediments of Lake Trekhtzvetnoe. In contrast, the sediments of the I stage of separation displayed accumulation of Cu in the F-4 form, with a maximum value of 21.6% of the sum of forms in Lobanikha Bay. Form F-6 played a secondary role in Cu speciation in the studied sediments. At the same time, at all sites, regardless of the stage of lake separation, form F-6 constituted a significant proportion of the total Cu content, ranging from 13.6% to 42.5% of the sum of forms. Overall, about 80% of the total Cu content was associated with the OM-sulfide component of bottom sediments (forms F4-F6) in the lakes separating from the White Sea. An increased proportion of the ion exchangeable form F-1 was also found for Cu, but only in the lake sediments of I stage separation and some other sites with sandy sediments (ZC-1, ZC-2, ZC-3, KS-3). At site BB, the main form of Cu was F-1, accounting for 52.7% of total Cu.
A significant amount of Mo and U was also bound to organic compounds. The F-5 form was significantly identified with Mo almost everywhere and, on average, constituted 32.1% of the total forms. At 12 out of 22 sites, the F-5 form was the dominant form for Mo. Among the studied metals, Mo was characterized by the highest proportion of the F-1 form. On average, the F-1 form comprised 28.1% of total Mo, and at seven sites, it became the predominant fraction by making up 43% of the sum of metal forms. The proportion of residual form F-7 for Mo is generally not significant (average value 8.8% of the sum of forms). Increase in the F-7 form for Mo was observed only in water bodies of stage I of separation (13.7–37.6% of the sum of forms).
The F-5 form was the predominant fraction of U at most of the sites (13 out of 22), averaging 23% of the sum of U forms. Only in the sediments of water bodies of stage I of separation is the proportion of this form of U insignificant. The residual form (F-7) of U averaged 17.2% of the sum of forms and was predominant at 5 sites where it reached about half of the total metal content. A significant proportion (on average 16.1% of the sum of forms) in the distribution of U forms belonged to the F-2 form. It was dominant at three sites and accounted for about a quarter of the total U content. Form F-6 represented on average 17.7% of the sum of U forms and was dominant at only one site (ZC-3). The other three U forms were not dominant at any site, although they also had a percentage in the total metal content. Uranium forms F-3 and F-4 were generally evenly distributed across the investigated sites, averaging 14.2% and 8.5% of the total metal content, respectively. Form F-1 averaged only 3.4% of the sum of U-forms but increased to 8.1–12.6% of the sum of forms in the sediments of some anaerobic sites (ZC-5, BK-3, T-3).
For Cd, similar to Pb, the predominant forms of metal speciation were F-3 and F-7. These forms had a comparable average proportion of total Cd content (about 35%) and were the majority at about half of the sites each. Moreover, Cd exhibited a higher proportion of the F-2 form. This form was predominant at two sites and accounted for an average of 17.7% of the total Cd. An increased proportion of the F-1 form of Cd was also found at some sites (up to 13% at the ZC-4 sites).

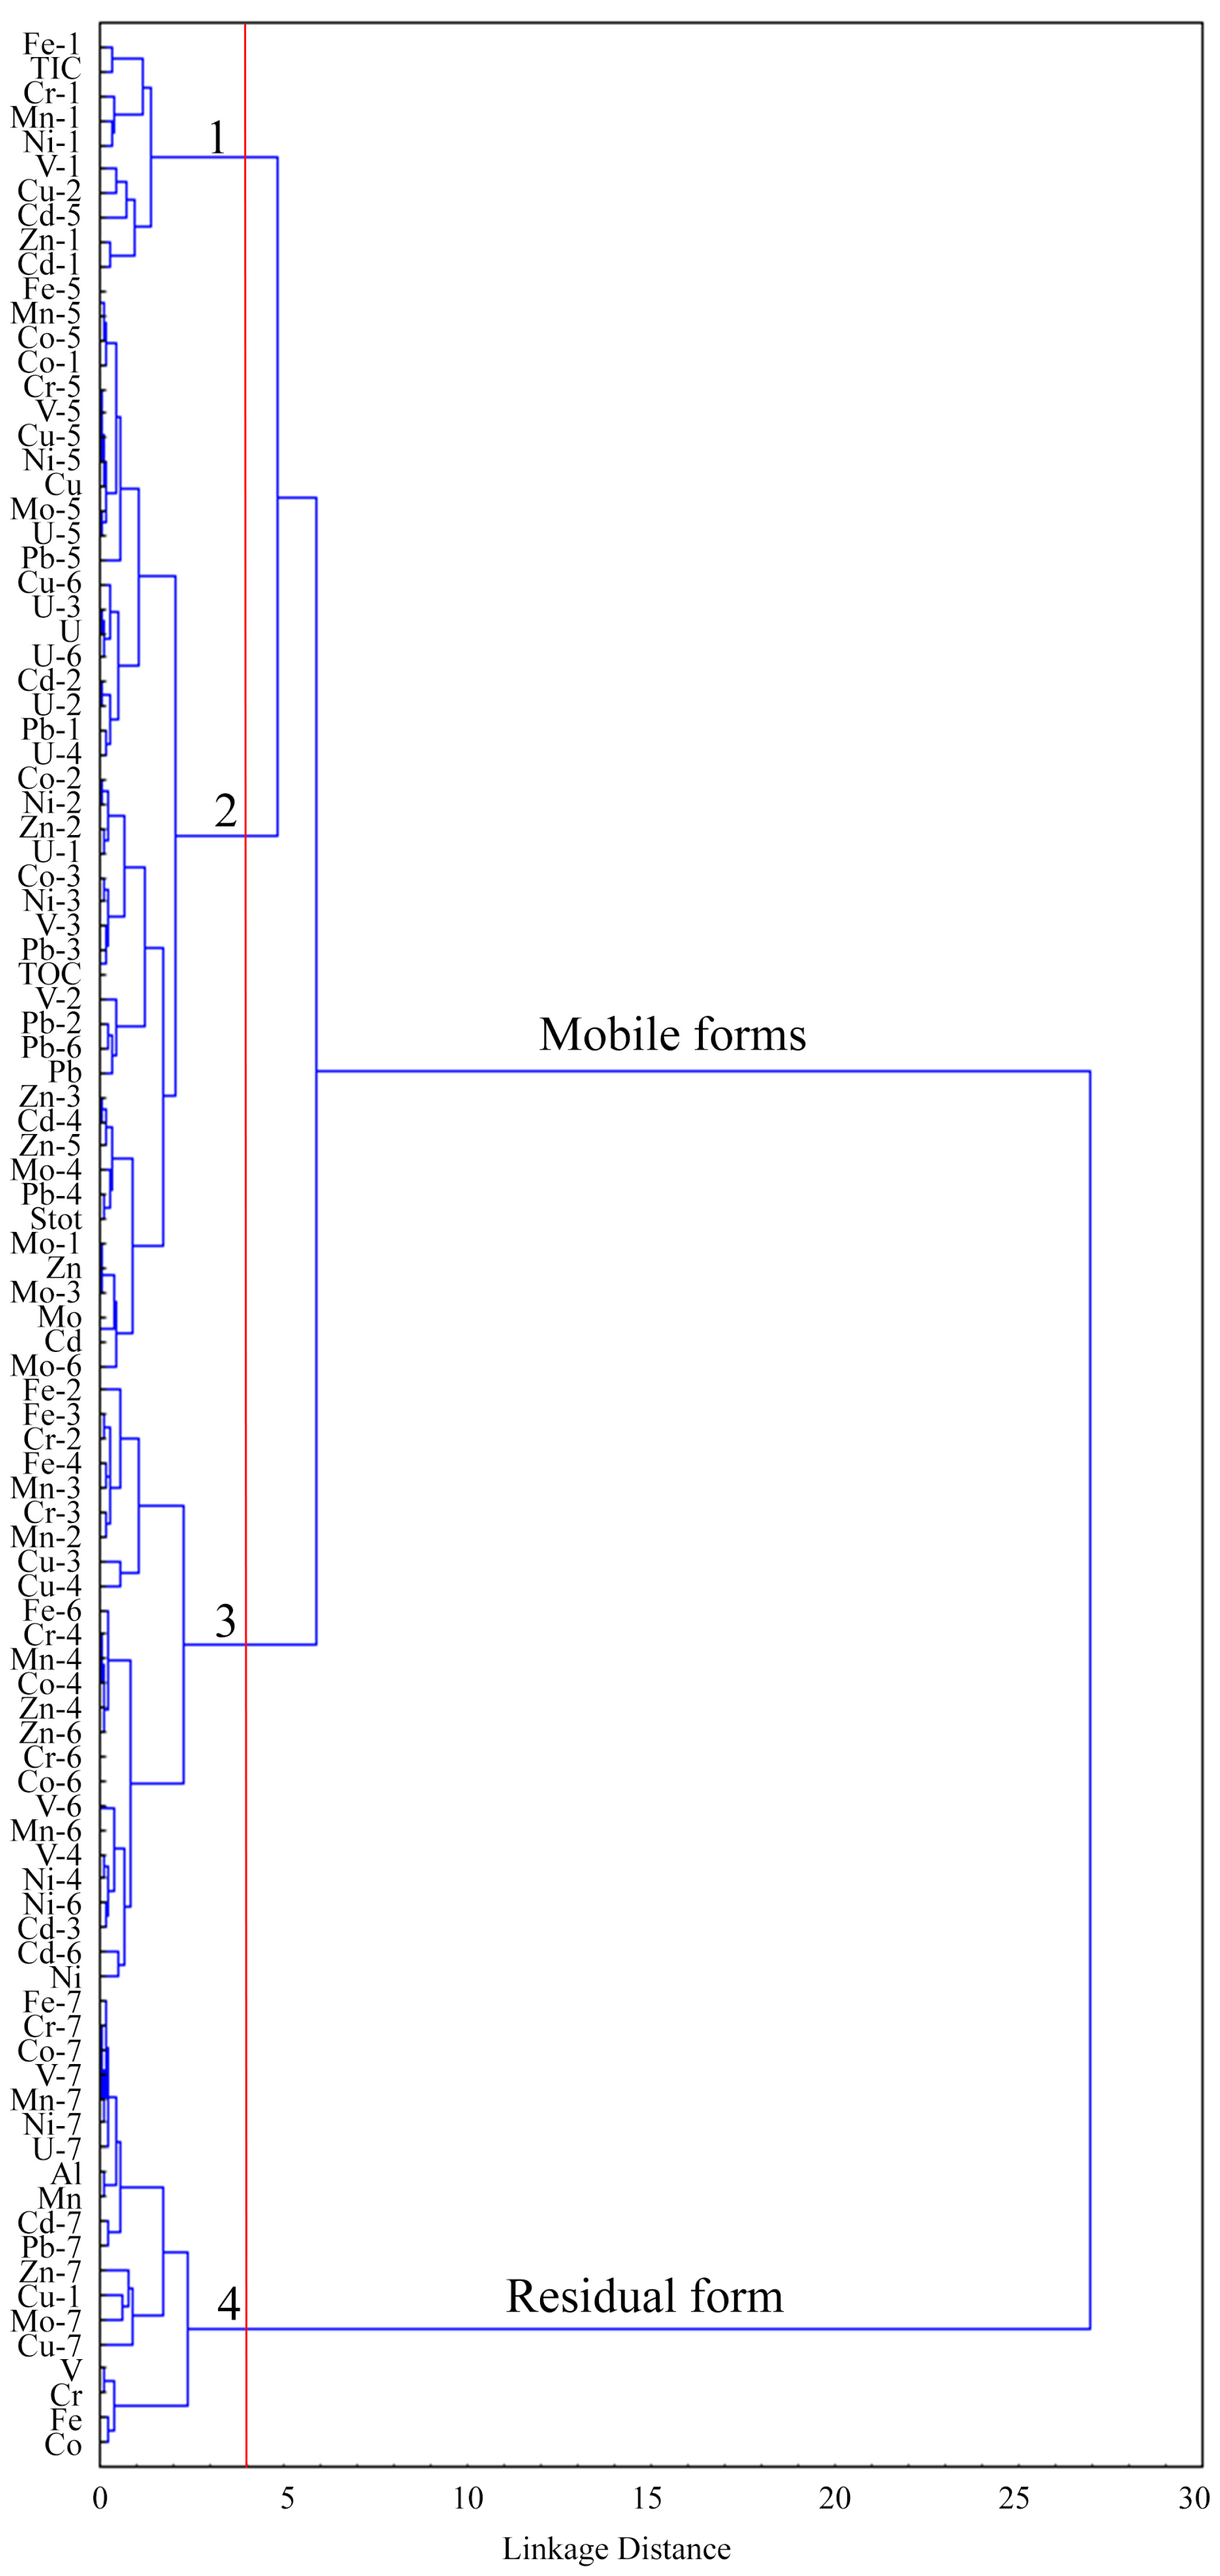
3.4. Metal Relationships

The correlation matrix encompassing the occurrence forms and total concentrations of V, Cr, Mn, Fe, Co, Cu, Ni, Zn, Mo, Cd, Pb, and U, along with Al, TOC, TIC, and Stot, can be found in the Supplementary Materials (Table S2). Additionally, the relationships between the analyzed parameters are visualized as a dendrogram generated through cluster analysis (using Ward’s method, 1—Pearson’s r) in Figure 4.
Cluster 1 primarily comprises metals in F-1 (ion exchangeable form) and TIC, characterized by weak connections with other metal forms. Nonetheless, U and Fe in F-1 demonstrated correlations with TIC and forms F-2 and F-3. Form F-1 for Mn, Co, Mo, and Pb exhibited a strong correlation with form F-5, while form Cu-1 correlated with elements in form F-7. The other metals in form F-1 correlated mainly with each other.
Cluster 2 contains two subgroups. The first subgroup includes total Cu, U, most metals in F-5 form, and various forms of U (F-2, F-3, F-4, F-6). The second subgroup comprises TOC, Stot, total Zn, Mo, Cd, and Pb, most metals in F-2 form, several metals in F-3 form (V, Co, Ni, Zn, Mo, and Pb), and some other forms (F-4 for Mo, Cd, and Pb; F-6 for Mo and Pb). Generally, metals in forms F-2, F-3, F-4, F-5, and F-6 exhibit a positive correlation with each other, as well as with TOC, TIC, and Stot.
Cluster 3 is composed of metals in F-6 form (excluding Mo and Pb) and F-4 (V, Cr, Fe, Mn, Co, Ni, Cu and Zn), total Ni, some metals in F-3 (Cr, Fe, Mn, Cu, and Cd).
According to correlation analysis, a significant connection with Stot is identified solely for the sulfide form F-6 for Mo and Pb. Form F-6 for Ni, Cu, and U also exhibits a weak correlation (r approximately 0.5) with Stot. Conversely, all metals except Cu in F-3 (oxyhydroxides) manifest a correlation with sulfur. For F-3 of Fe, Co, Zn, Mo, and Pb, this bond is particularly robust (r > 0.7, at p < 0.01). The correlation between form F-6 for Fe and other metals is established for most elements except Cu, Mo, Pb, and U. Unlike sulfur, TOC displays a strong correlation with the organic-bound form of metal (F-4 and F-5). In the case of the F-5 form, the correlation coefficients between V, Cr, Mn, Fe, Co, Ni, Cu, Zn, Mo, and U, on the one side, and TOC, on the other, range from 0.7 to 0.9. Cadmium and Pb correlate with TOC via the form F-4 (weakly bound to OM). Among all the metals studied, only U in the form of carbonates (F-2) exhibits a significant relationship with TIC (r = 0.54, at p < 0.01).
Cluster 4 consists of the residual F-7 of heavy metals and the total content of Al, V, Cr, Fe, Mn, and Co. Metals in the F-7 form demonstrate a positive pairwise correlation with each other, whereas their correlation with the mobile forms is either absent or negative.
The examined sites were further grouped using cluster analysis (Ward’s method, Euclidean distance) based on metal speciation distribution features in the sediments (Figure 5).
Four clusters have been identified, grouping sites based on their degree of isolation from the sea. Cluster 1 includes sites from sea bays: Kislaya (st. KB), Biofilters (st. BB), and Lobanikha (st. BL-1). This cluster also includes st. KS-3 from the aerated part of Kislo-Sladkoe Lake with fine sand sediments. Clusters 2 and 3 comprise anaerobic sites from the meromictic lakes Tritsvetnoye (sts. T-2, T-3), Bol’shie Khruslomeny (st. BK-3), Kislo-Sladkoye (KS-6), the lagoon on Cape Zeleny (st. ZC-5), and Bay Lobanikha (st. BL-4). This cluster also includes several sites from the oxygenated areas of the studied lakes (sts. T-1, KS-5, BK-2) with pelitic reduced sediments (Eh < –100 mV). Simultaneously, Cluster 3 encompasses sites BK-2, BK-3, KS-6, and T-3, characterized by the highest content of organic carbon and sulfur (TOC > 10%; Stot > 1.2%). Cluster 4 combines shallow areas of lakes with aerated water conditions and a higher proportion of silt-sandy grain-size fraction in sediments.
Subsequently, differences between the selected clusters were determined using nonparametric Kruskal-Wallis ANOVA test. For this analysis, three sediment groups were considered: (A) oxic sediments of sea bays’ sites (Cluster 1), (B) sediments of shallow sites in meromictic lakes (Cluster 4), and (C) sediments of deep-water sites in anaerobic areas of meromictic lakes (combined Clusters 2 and 3) (Table 3).
There were no differences in the content of Cr, V, Zn, Cu, Ni, Cd in form F-1, as well as in the form F-7 for Cu, Zn, Mo, and some other forms including F-2 for Fe, F-6 for Zn, F-3 for Cu, F-5 for Cd between the selected groups of water bodies. Notably, the absence of differences in the total content between sea bays (group A) and different parts of meromictic water bodies (groups B and C) is typical only for V, Cr, Fe, Co, and Pb.
On the contrary, significant differences were observed in the distribution of TOC, Stot, total contents of Cu, Mo, and most metals in F-5 (V, Fe, Cr, Mn, Co, Ni, Cu) and F-3 (V, Fe, Co, Ni, Zn, Cd, and Pb) among all three groups of water bodies studied. An increase in the content of these compounds was observed in the following order: anaerobic part of meromictic lakes (Group C) > aerobic part of meromictic lakes (Group B) > sea bays (Group A).
Some metals (V, Cr, Mn, Co, and Ni) also showed significant differences between the three groups of lakes in terms of F-7 form. However, unlike mobile forms, sediments of Group A (sea bays) were reliably enriched in form F-7 compared to various parts of meromictic lakes (Groups B and C). Significant differences between the three groups of water bodies were also found for some other metal forms (F-1 for Pb, F-2 for Mn and Zn, F-4 for V and Fe F-6 for Ni, Cu, and Pb), although without regularity. For some metals in the F-4 and F-6 forms (V, Cr, Fe, Mn, Co, Ni, Cu, U) the following pattern was observed. There were no differences between the aerated and anaerobic areas of meromictic lakes, but significant differences were observed in relation to the sediments of sea bays.

4. Discussion

In order to evaluate the processes of metal deposition and their transformation under environmental conditions, it is essential to ascertain the geochemical forms in which metals coexist within bottom sediments [7,43,44,45,46]. The catchment areas of the investigated lakes are characterized by the low productivity of subarctic terrestrial ecosystems and organically poor acidic stony soils [22]. Despite these characteristics, the meromictic lakes isolated from the White Sea exhibit contrasting features from other subarctic ecosystems, as they display an elevated accumulation of organic matter. In the open regions of the White Sea, where biological productivity is relatively low, the TOC content in sediments rarely exceeds 1.5%. This limitation arises from the degradation and alteration of organic matter in both the sinking particles and the sediment matrix under aerobic conditions [41]. Even in the more productive Barents Sea, situated to the north of the White Sea, the TOC content does not surpass 2.6% [47,48]. Meromictic lakes, isolated from marine influence, generally exhibit an increased supply of terrigenous organic matter through freshwater runoff. This material, coupled with autochthonous organic matter, is deposited within the anaerobic zone, bypassing complete degradation. Furthermore, increased productivity occurs within the chemocline zone of these lakes, driven by bacterial contributions [23]. Consequently, the TOC content in the anaerobic segments of the examined water bodies reaches up to 23%. Additionally, sediment samples from meromictic lakes demonstrate a pronounced increase in sulfur content (from <0.05% to 1.07%) in comparison to sediments from the open areas of the White Sea (average Stot of 0.366%) [40]. The manifestation of euxinic conditions within the studied sediments is substantiated by [49], who reveal that pyrite sulfur constitutes a significant portion of the reduced sulfur forms within the sediment cores of Lake Trekhtzvetnoe. The concentration of pyritic sulfur varies from about 10% in the 0–5 cm layer to 60–80% in the deeper layers of the core. The overall pyritic sulfur contents in this lake sediments range from 0.045% to 1.165% [47]. The low TIC content in the sediments of meromictic lakes along the White Sea coast corresponds to the low carbonate content of the Arctic and Subarctic marine basins [50].
It is natural to hypothesize that organic matter and sulfide formation might play pivotal roles in influencing the behavior of metals within meromictic lake sediments. However, each of the examined metals exhibits distinctive distribution characteristics within these sediments. Based on the established metal speciation and relationships between their different forms and total content, the primary processes contributing to metal sediment deposition have been identified (Table 4).
The significant contribution to the accumulation of most studied metals, excluding Cu and Mo, arises from the residual form F-7, which is represented by the mineral matrix of the sediment. The F-7 form is particularly influential in the variability of V, Cr, Mn, Fe, and Co in the sediments of meromictic lakes along the White Sea coast. This relationship was substantiated by cluster analysis, indicating a connection between the residual form F-7 and total metal content, as well as with total Al content (cluster 4). In particular, Mn and Cr emerge as prominent tracers of lithogenic material within the lakes, being predominant in the residual form of F-7. In regions with an aerated sedimentary environment such as the White, Barents, and Kara Seas, the proportion of the lithogenic form of Cr can reach up to 90% of its total content in sediments [43,44,45,46]. Under anoxic conditions, Cr (IV) oxyanions are reduced to Cr (III), which can readily form complexes with the humic or fulvic acids or scavenging by Fe and Mn oxyhydroxides [51,52]. It is believed that Cr (III) remains unreactive towards sulfides and is not incorporated into pyrite [12]. Our results suggest that organic matter (OM) plays a limited role in Cr deposition in the sediments studied (the F-5 form accounts for up to 16% of the sum of forms at BK-2 and BK-3 sites with the highest TOC content). Nonetheless, on average, about a quarter of Cr is present in the F-6 (sulfides) form, with this percentage increasing to 30% in sediments from anaerobic sites. This suggests that in euxinic environments, the significant presence of organic matter and sulfide influence even lithophile metals like Cr, where the residual form averages about 65% of the forms sum. This assertion is supported by the following context.
The behavior of Mn is intricately linked to the redox potential of the environment [53,54,55]. Even in the midst of terrigenous sedimentation in Arctic seas, Mn demonstrates considerable geochemical mobility under oxygen-rich conditions, precipitating as amorphous oxyhydroxides particles [43,44,45,46,54,55]. For instance, in the well-aerated central deep-water region of the White Sea, elevated Mn content (up to 50 mg/g) accumulates, with more than 90% in the form of oxyhydroxides [43,56]. Upon decreasing oxygen levels, Mn (III, IV) oxyhydroxides are rapidly reduced below the redox boundary, releasing dissolved Mn (II) that diffuses cyclically within this layer. This diffusion is due to its limited interaction with organic matter or sulfides [51,52]. Manganese (II) can precipitate with carbonates [57,58]. While the proportion of the Mn form F-2 (carbonates) in the meromictic lake sediments of the White Sea remains relatively low (averaging about 1% of the sum of forms), it increases to 6% in Trekhtzvetnoe Lake sediments, which have high hydrogen sulfide content [26]. Additionally, Mn can be partially adsorbed onto Fe-sulfide phases and become incorporated into pyrite [12]. This corresponds to the detection of about 25% of Mn in the sulfide form F-6 in the sediments of meromictic lakes along the White Sea coast. In general, under euxinic conditions, Mn demonstrates a more lithophilic behavior during deposition in bottom sediments. Similar examples occur where Mn in marine sediments mainly exists in the lithogenic form. Coastal sediments of Antarctic Ross Sea, for instance, contain over 80% of the total Mn in the residual form [59].
Despite the development of euxinic environments, the presence of the F-6 form (sulfides) exerts only a secondary influence on the behavior of metals such as V, Cr, Fe, Mn, Co, Ni, Cu, and Zn in the lake sediments studied. Conversely, the contribution of the F-6 form on the Mo, Cd, Pb, and, to some extent, U speciation in the sediments studied are minimal. The F-6 fraction plays a more prominent role for Fe, averaging 31.5% of the total forms and increasing to 54% in the anaerobic sediments of the III stage of separation (Trekhtzvetnoe Lake). The presence of sulfide phases (authigenic pyrite and hydrotroillite) was detected in the reduced sediments of the meromictic Trekhtzvetnoe Lake, formed by the interaction of Fe oxyhydroxides with hydrogen sulfide as a result of environmental changes [49]. The White Sea catchment area receives a substantial load of colloidal Fe and organic particles from rivers draining acidic podzolic and peaty soils [60]. Within the chemocline zone, Fe coagulates with organic compounds, precipitating and depositing onto bottom sediments [61]. Additionally, the Fe-3 (oxyhydroxides) can be generated at the redox boundary, where dissolved Fe(II) from the anoxic zone interacts with the oxygenated water [62]. We can suppose that during the continuous influx of sinking particles from the oxidized zone of the water column to reduced bottom sediments, the Fe oxyhydroxides can be partially preserved. Specifically, the surface sediment layer of Trekhtzvetnoe Lake is dominated by the oxidized form of Fe (III) (comprising 75% of the reactive Fe forms) [49]. Down the sediment core, this form of Fe decreases to 8.4% of the sum of the reactive Fe forms, with a notable increase in pyritic Fe [49]. This corresponds to our findings of a high proportion of the F-3 form (ranging from 12.4% to 51.1% of the forms sum) for Fe in anaerobic sediment sites of the studied meromictic lakes. It can suggest the coexistence of weakly soluble oxyhydroxides of Fe and H2S during the early stages of diagenesis.
The influence of the F-3 form on Mn deposition in the examined sediments is less pronounced than that of Fe. This form of Mn is observed solely at three anaerobic sites (T-2, T-3, and BK-3). The slower reduction kinetics of Fe oxyhydroxides compared to Mn could explain the persistence of oxidized Fe (III) even in the presence of sulfides [56,63,64]. This could also elucidate the increased content of certain metals, especially Cd and Pb, in the F-3 form (oxyhydroxides) in the reduced sediments studied.
A notable pattern emerged in the correlation between the speciation of different metals and sulfur. Within the F-6 sulfide fraction of metals, only Pb and Mo exhibited a significant relationship with Stot (r = 0.71 and 0.56, respectively, at p < 0.01), whereas Cu, Ni, Cd, and U showed weak correlations with Stot (0.3 < r < 0.5, at p < 0.01). The other metals in the sulfide form F-6 (V, Mn, Fe, Cr, Co, and Zn) demonstrated no correlation with sulfur distribution (r < 0.3). A strong correlation with sulfur was observed for almost all metals except Cu and Cd in the F-3 oxyhydroxides form (r = 0.57–0.82, at p < 0.01). As previously described, the precipitation of Fe oxyhydroxides and the formation of Fe sulfides (form F-6) are interconnected processes.
Among the total metal contents, a significant relationship with the F-6 fraction was observed only for the total Ni content (Cluster 3), revealing the influence of sulfides on the variability of metal distribution within the examined sediments. Nevertheless, the F-7 residual phase of Ni predominated at the majority of sites (14 out of 22).
Our research indicated that, among the metals studied, Cu, Mo, Cd, and U exhibited the highest geochemical mobility. Copper serves as the most indicative tracer of organic matter in the sediments of meromictic lakes along the White Sea coast. The distribution of organically bound forms of Cu displayed the following traits: 5–10% of the total Cu exists in the F-4 form, weakly bound to OM (acidic extraction targeting fulvic acids), while a notable portion (32–65% of the total Cu) exists in the F-5 form, strongly bound to OM (alkaline extraction focusing on humic acids). This observation is supported by the evidence that among organic ligands in sediments, humic acids act as the primary adsorbents for Cu [65,66,67].
The behavior of Mo in anoxic conditions was elucidated by the reduction of MoO42− oxyanions to MoOxS4-x2−, forming thiomolybdates that can be adsorbed onto sulfides and organic particles [68,69]. However, it has been shown that Mo deposition in reduced sediments is likely to involve a more intricate behavioral model [70]. In addition to molybdate adsorption, it could be associated with processes such as precipitation with oxyhydroxides, complexation with organic compounds, incorporation into Fe-sulfide minerals, and the formation of its own mineral associations with sulfidic S.
Within the sediments of meromictic lakes along the White Sea coast, Mo exhibits diverse forms of occurrence with significant variability in different parts of the water bodies, depending on the environmental properties. Concurrently, organic matter seems to play a key role in the deposition of Mo in these sediments. Notably, the F-5 form (strongly bound to OM), averaging 35% of the sum of the forms, was significant for Mo in a few samples (ZC-2, ZC-4, T-1, T-2, T-3). The pronounced contribution of OM to Mo variability in the studied sediments is supported by the correlation between total Mo and the F-5 form for this metal. Furthermore, adsorption processes also play a critical role in Mo binding within the bottom sediments. The ion exchangeable F-1 form of Mo accounted for an average of 28.1% of its total content, predominating in 7 of 22 sediment samples. A reliable relationship was observed between the F-1 form of Mo with F-5 and F-3 forms of metals, implying Mo adsorption onto the surface of organic matter and oxyhydroxides. In some sites with anaerobic sediments (sts. ZC-5, T-2, T-3), a considerable amount of Mo (32–38% of the forms’ sum) was detected in the F-3 form associated with oxyhydroxides. The Mo content in the sulfide fraction was minimal, averaging 6.3% of the forms’ sum. Since the sulfide form F-6 of Mo exhibited a correlation with Stot, in contrast to the absence of a similar correlation with Fe, it could be inferred that Mo generates its own sulfide fraction without co-precipitation during pyrite formation.
Uranium exhibited the most diverse distribution of speciation, with significant variation between different parts of the lakes. It is the only metal among those studied to receive substantial contributions from all seven fractions. This is reflected in the close correlation between total U content and most of its forms. However, total U is clustered together with the metals in the F-5 form (Figure 4). This correlation is suggested by the prevalence of the F-5 form of U in 13 of the 22 sites, accounting for an average of 23% of the sum of forms. Thus, it can be assumed that the distribution of U in lake sediments is controlled by organic matter. In lakes of the I stage of separation, the U residual form F-7 predominates. The enrichment of U in reduced marine sediments with high organic matter content has also been demonstrated [71]. In the sediments of Canadian meromictic mine pit lakes, U predominantly associated with carbonates, Fe-Mn oxyhydroxides, and fixation in clastic minerals [72]. According to our data, U also has an elevated carbonate form F-2 compared to other metals, averaging 14% of the sum of forms. This corresponds to the binding of U in carbonate minerals [73]. At some sites (ZC-3, ZC-5, BL-3), a significant portion of U was observed in the F-3 form of oxyhydroxides (over 25% of the sum of forms). It is known that U can be adsorbed and incorporated into crystalline Fe oxides like hematite [74]. It is plausible that Fe oxides could be partially preserved in the reduced sediments of the studied water bodies.
With increasing isolation of water bodies from the sea, a significant increase in the content of TOC and Stot in bottom sediments is shown, especially for anaerobic sites (refer to Figure 2). In regard to the total metal content, only Cu and Mo showed a significant increase in sediments between three categories of water bodies: sea bays < aerobic part of meromictic lakes < anaerobic part of meromictic lakes (Table 3). As a rule, the most mobile forms showed a significant growth in the Trekhtzvetnoe Lake (III stage of separation). This is expressed in forms F-3 (oxyhydroxides), F-5 (strongly bond with OM), and F-6 (sulfides). The residual F-7, on the contrary, acts as an indicator of the first stage of separation of lakes from the sea, so that the maximum content of many metals (V, Cr, Mn, Co, and Ni) was significantly higher in the sediments of scoop-like sea bays (Table 3). Although a general trend towards an increase in the total content of most metals (except Mn) in the sediments of anaerobic areas of lakes at separation stages II and III.

5. Conclusions

A comparison of the heavy metal speciation in sediments from meromictic lakes with different stage of isolation from the White Sea resulted in the following conclusions:
1. Progress of isolation leads to auxinic conditions and a significant increase in organic carbon and sulfur contents in lakes sediments.
2. The residual form F-7, which is represented by the mineral matrix of the sediment, is the main contributor to the deposition of most of the metals studied, with the exception of Cu and Mo. The largest proportion of F-7 was detected for Mn and Cr (about 65% of the forms sum for each, on average). The strong relationship between F-7 and the total content of Mn and Cr lets to consider these metals as the most relevant tracers for the lithogenic source in the sediments of the studied lakes. The variability of total contents of V, Fe, Co, and Zn is also influenced by F-7, although the proportion of their mobile forms is higher compared to Cr and Mn.
3. Despite anoxic conditions in the sediments (Eh < 100 mV), the form F-6 (sulfides) was not predominant for any of the metals studied, although it had a noticeable share in the total content of V, Cr, Fe, Mn, Co, Ni, Cu, and Zn. On the other hand, the impact of euxinic condition on the precipitation of Mo, Cd, Pb, and, to a certain degree, U in these sediments is negligible.
4. Cadmium and Pb were mainly associated with the Fe and Mn oxyhydroxides which seem to remain partly undissolved in the surface layer of the reduced sediment. In turn, organic matter provides the primary contribution to the distribution of Cu, Mo, and U in the sediments of meromictic lakes. A strong relationship was found between the Cu F-5 form (strongly bound to OM) and its total content. This corresponded to a predominance of the organic fraction of Cu forms (F-4 and F-5), with an average of over 50% of the sum of forms, reaching a maximum value of 76.5%. It may indicate that Cu is a more reliable tracer of biogenic processes in the sediment of meromictic lakes than other metals.
5. Molybdenum displayed varying behavior in the sediment of the studied lakes. Besides the F-5 form, the ion exchangeable processes (F-1) and association with Fe and Mn oxyhydroxides (F-3) are noteworthy factors contributing to the high total Mo content in sediments of meromictic lakes under euxinic conditions.
6. The most complex differentiation was found for U speciation. All seven forms showed varying contributions to U deposition in the bottom sediment. In addition to organic matter, the residual F-7, carbonates F-2, and sulfides F-6 are prominent.
7. A significant difference between water bodies at different stage of isolation from the White Sea was confirmed primarily by metal forms associated with oxyhy-droxides (F-3) and strongly bound to organic matter (F-5). These were reflected in the enrichment in the total content of Cu, Mo, Cd, and U of sediments in anoxic areas of meromictic water bodies, as previously identified in our study [13]. Form F-6 metals (sulfides) are rather evenly distributed in the sediments of the investigated lakes. However, in the sediments of Lake Trekhtzvetnoe (III stage of isolation) a sharp increase in F-6 was found. Conversely, the content of metals in the residual form F-7 tends to be significantly higher in the sediments of water bodies in I stage of separation.
Considering the established diversity of heavy metal occurrence forms and evidenced significance of some of them in the bottom sediments of meromictic lakes, it is possible to use them as tracers of environmental change.

Supplementary Materials

The following supporting information can be downloaded at: https://www.mdpi.com/article/10.3390/jmse11091753/s1, Table S1: Lithological and geochemical properties of meromictic water bodies sediments separated from the White Sea. Table S2. The correlation matrix (p < 0.99) for the total content and forms of metals, TOC, TIC, and Stot in the bottom sediments from the meromictic lakes separated from the White Sea.

Author Contributions

Conceptualization, L.L.D. and D.F.B.; methodology, L.L.D. and D.F.B.; software, D.F.B.; validation, D.F.B. and D.P.S.; formal analysis, D.F.B. and D.P.S.; investigation, D.F.B.; resources, D.F.B. and E.D.K.; data curation, D.F.B.; writing—original draft preparation, D.F.B.; writing—review and editing, L.L.D., D.F.B., E.D.K. and D.P.S.; visualization, D.F.B.; supervision, D.F.B.; project administration, D.F.B. and E.D.K.; funding acquisition, D.F.B. All authors have read and agreed to the published version of the manuscript.

Funding

This research was carried out in the framework of State Agreement of Ministry of Science and High Education, Russia, program no. FMWE-2021-0006; treatment and investigation of field material were supported by the Russian Science Foundation (http://www.rscf.ru) project no. 22-77-00097; preparation of the final version of manuscript was completed with support of the Russian Science Foundation (http://www.rscf.ru) project no. 19-17-00234-P.

Institutional Review Board Statement

Not applicable.

Informed Consent Statement

Not applicable.

Data Availability Statement

Not applicable.

Acknowledgments

We are grateful to the head and collaborators of Pertsov White Sea Biological Station for the opportunity to conduct field works and sampling in meromictic lakes of the White Sea coast. The authors thank all colleagues that helped with analytical works: T.N. Alekseeva for the analysis of the grain-size composition and E.A. Kudryavtseva for CNHS-analysis.

Conflicts of Interest

The authors declare no conflict of interest.

References

  1. Kolka, V.V.; Korsakova, O.P.; Shelekhova, T.S.; Lavrova, N.B.; Arslanov, K.A. The White Sea level change and glacioisostatic land uplift during the Holocene near the settlement of Kuzema, North Karelia region. Dokl. Earth Sci. 2012, 442, 139–143. [Google Scholar] [CrossRef]
  2. Scherneck, H.-G.; Johansson, J.M.; Koivula, H.; van Dam, T.; Davis, J.L. Vertical crustal motion observed in the BIFROST project. J. Geodyn. 2003, 35, 425–441. [Google Scholar] [CrossRef]
  3. Ekman, M.; Makinen, J. Recent postglacial rebound, gravity change and mantle flow in Fennoscandia. Geophys. J. Int. 2017, 126, 229–234. [Google Scholar] [CrossRef]
  4. Krasnova, E.D.; Pantyulin, A.N.; Belevich, T.A.; Voronov, D.A.; Demidenko, N.A.; Zhitina, N.S.; Ilyash, L.V.; Kokryatskaya, N.M.; Lunina, O.N.; Mardashova, M.V.; et al. Multidisciplinary studies of the separating lakes at different stage of isolation from the White Sea performed in March 2012. Oceanology 2013, 53, 639–642. [Google Scholar] [CrossRef]
  5. Nemirovskaya, I.A. Content and composition of organic compounds in separating lakes in Antarctica and Arctica. Arct. Antarct. Res. 2017, 114, 76–85. Available online: https://www.elibrary.ru/item.asp?id=30780920 (accessed on 4 September 2023). (In Russian). [CrossRef]
  6. Krasnova, E.D.; Mardashova, M.V. Evolution of water bodies of marine origin under isolation from the sea. Priroda 2020, 1, 16–27. Available online: https://www.elibrary.ru/item.asp?id=42396951 (accessed on 4 September 2023). (In Russian).
  7. Lisitzin, A.P. Oceanic Sedimentation: Lithology and Geochemistry; Kennet, J., Ed.; American Geophysical Union: Washington, DC, USA, 1996; 411p. [Google Scholar]
  8. Calvert, S.E.; Pedersen, T.F. Elemental proxies for palaeoclimatic and palaeoceanographic variability in marine sediments: Interpretation and application. Dev. Mar. Geol. 2007, 1, 568–643. [Google Scholar] [CrossRef]
  9. Calvert, S.; Pedersen, T. Geochemistry of the recent oxic and anoxic marine sediments: Implication to the geological record. Mar. Geol. 1993, 113, 67–88. [Google Scholar] [CrossRef]
  10. Neretin, L.N.; Pohl, C.; Jost, G.; Leipe, T.; Pollehne, F. Manganese cycling in the Gotland Deep, Baltic Sea. Mar. Chem. 2003, 82, 125–143. [Google Scholar] [CrossRef]
  11. Algeo, T.J.; Tribovillard, N. Environmental analysis of palaeoceanographic systems based on molybdenum-uranium covariation. Chem. Geol. 2009, 268, 211–225. [Google Scholar] [CrossRef]
  12. Morse, J.W.; Luther, G.W. Chemical influences on trace metal-sulfide interactions in anoxic sediments. Mar. Chem. 2006, 102, 111–123. [Google Scholar] [CrossRef]
  13. Budko, D.F.; Nemirovskaya, I.A. Organic Compounds and Metals in the Sediments of Meromictic Lakes Separated from the Kandalaksha Gulf of the White Sea. Geochem. Int. 2023, 61, 184–202. [Google Scholar] [CrossRef]
  14. Tchesunov, A.V.; Kalyakina, N.M.; Bubnova, E.N. A Catalogue of Biota of the White Sea Biological Station of the Moscow University; KMK Scientific Press: Moscow, Russia, 2008; 384p, Available online: https://wsbs-msu.ru/wp-content/uploads/2022/09/biota_bbs.pdf (accessed on 4 September 2023). (In Russian)
  15. Shurkin, K.A. Precambrian of the White Sea Area; Nauka Press: Leningrad, Russia, 1984; 49p. (In Russian) [Google Scholar]
  16. Amantov, A.V. Geological Structure of the Sedimentary Cover of the Basins of the North-West Russia. Sedimentary Cover of the Glacial Shelf of the North-West Seas of Russia. St. Petersburg: Collection of Scientific Papers, 1992, 25–47. Available online: https://www.elibrary.ru/item.asp?id=36302049 (accessed on 4 September 2023). (In Russian).
  17. Baluev, A.S.; Zhuravlev, V.A.; Terekhov, E.N.; Prahiyalgovsky, E.S. Tectonics of the White Sea and Adjacent Areas (The Explanatory Notes to “the Tectonic Map of the White Sea and Adjacent Areas”, at a Scale of 1:1500 000; GEOS: Moscow, Russia, 2012; 104p, Available online: https://www.elibrary.ru/item.asp?id=35544741 (accessed on 4 September 2023). (In Russian)
  18. Gusakova, A.I. Mineral composition of the modern bottom sediments of the White Sea. Oceanology 2013, 53, 223–232. [Google Scholar] [CrossRef]
  19. Naumov, A.D.; Fedyakov, V.V. The Ever-Living White Sea; Izd-vo GDTU: St. Petersburg, Russia, 1993; 334p. (In Russian) [Google Scholar]
  20. Rybalko, A.E.; Zhuravlev, V.A.; Semenova, L.R.; Tokarev, M.Y. Quaternary sediments of the White Sea and the history of development of the modern White Sea basin in the Late Neopleistocene-Holocene. In White Sea System. Vol. IV. Sedimentation Processes, Geology and History; Nauchny Mir: Moscow, Russia, 2017; pp. 77–120. [Google Scholar]
  21. Romanenko, F.A.; Shilova, O.S. The postglacial uplift of the Karelian Coast of the White Sea according to radiocarbon and diatom analyses of lacustrine-boggy deposits of Kindo Peninsula. Dokl. Earth Sci. 2012, 442, 242–246. [Google Scholar] [CrossRef]
  22. Babeshko, K.V.; Shkurko, A.; Tsyganov, A.N.; Severova, E.E.; Gałka, M.; Payne, R.J.; Mauquoy, D.; Mazei, N.G.; Fatynina, U.A.; Krasnova, E.D.; et al. A multi-proxy reconstruction of peatland development and regional vegetation changes in subarctic NE Fennoscandia (the Republic of Karelia, Russia) during the Holocene. Holocene 2021, 31, 421–432. [Google Scholar] [CrossRef]
  23. Krasnova, E.D.; Matorin, D.N.; Belevich, T.A. The characteristic pattern of multiple colored layers in coastal stratified lakes in the process of separation from the White Sea. J. Oceanol. Limnol. 2018, 36, 1962–1977. [Google Scholar] [CrossRef]
  24. Krasnova, E.D. Ecology of meromictic lakes of Russia. 1. Coastal marine waterbodies. Water Resour. 2021, 48, 427–438. [Google Scholar] [CrossRef]
  25. Krasnova, E.; Voronov, D.; Frolova, N.; Pantyulin, A.; Samsonov, T. Salt lakes separated from the White Sea. EARSeL Eproceedings 2015, 14, 8–22. [Google Scholar] [CrossRef]
  26. Losyuk, G.N.; Kokryatskaya, N.M.; Krasnova, E.D. Hydrogen sulfide contamination of coastal lakes at different stages of isolation from the White Sea. Oceanology 2021, 61, 351–361. [Google Scholar] [CrossRef]
  27. Shilova, O.S.; Leontiev, P.A.; Vakhrameeva, E.A.; Losyuk, G.N.; Grigoriev, V.A.; Krasnova, E.D.; Repkina, T.Y.; Kublitskiy, U.A. From the lagoon to the meromictic lake: A case study of lake-bottom sediments of Lake Kislo-Sladkoe (the Karelian Coast of White Sea, Russia). Limnol. Freshw. Biol. 2020, 4, 490–491. [Google Scholar] [CrossRef]
  28. Krasnova, E.D. Lake Kislo-Sladkoe. Travelling on the Cape Kindo, 2008; Grif and C, Tula. 144p. (In Russian) [Google Scholar]
  29. Savvichev, A.S.; Kadnikov, V.V.; Rusanov, I.I.; Beletsky, A.V.; Krasnova, E.D.; Voronov, D.A.; Kallistova, A.Y.; Veslopolova, E.F.; Zakharova, E.E.; Kokryatskaya, N.M.; et al. Microbial processes and microbial communities in the water column of the polar meromictic lake bol’shie khruslomeny at the White Sea coast. Front. Microbiol. 2020, 11, 1945. [Google Scholar] [CrossRef] [PubMed]
  30. Savvichev, A.S.; Kadnikov, V.V.; Kallistova, A.Y.; Rusanov, I.I.; Voronov, D.A.; Krasnova, E.D.; Ravin, N.V.; Pimenov, N.V. Light-dependent methane oxidation is the major process of the methane cycle in the water column of the Bol’shie Khruslomeny Polar Lake. Microbiology 2019, 88, 370–375. [Google Scholar] [CrossRef]
  31. Krasnova, E.D. The White Sea basins separated from the sea: On nature of meromixis. Geology of Oceans and Seas. In Proceedings of the 24th International Conference (School) on Marine Geology, GEOS, Moscow, Russia, 15–19 November 2021; Volume 2, pp. 234–238. (In Russian). [Google Scholar]
  32. Baeyens, W.; Monteny, F.; Leermakers, M.; Bouillon, S. Evalution of sequential extractions on dry and wet sediments. Anal. Bioanal. Chem. 2003, 376, 890–901. [Google Scholar] [CrossRef] [PubMed]
  33. Huang, G.; Chen, Z.; Sun, J.; Liu, F.; Wang, J.; Zhang, Y. Effect of sample pretreatment on the fractionation of arsenic in anoxic soils. Environ. Sci. Pollut. Res. 2015, 22, 8367–8374. [Google Scholar] [CrossRef]
  34. Petelin, V.P. Grain-Size Analysis for Marine Bottom Sediments; Nauka: Moscow, Russia, 1967. (In Russian) [Google Scholar]
  35. Tessier, A.; Campbell, P.G.C.; Bisson, M. Sequential extraction procedure for the speciation of particulate trace metals. Anal. Chem. 1979, 51, 844–851. [Google Scholar] [CrossRef]
  36. Campanella, L.; D’Orazio, D.; Petronio, B.M.; Pietrantonio, E. Proposal for a metal speciation study in sediments. Anal. Chim. Acta 1995, 309, 387–393. [Google Scholar] [CrossRef]
  37. Nikolaeva, I.Y.; Fyaizullina, R.V.; Bychkova, Y.V.; Bychkov, A.Y.; Bychkov, D.A. Methods of Geochemical Studies. A Handbook; Kniga–Memuar: Moscow, Russia, 2019. (In Russian) [Google Scholar]
  38. Fedotov, P.S.; Spivakov, B.Y. Fractionaion of elements in soils, sludges and sediments: Batch and dynamic methods. Russ. Chem. Rev. 2008, 77, 649–660. [Google Scholar] [CrossRef]
  39. Zeisler, R. New NIST sediment SRM for inorganic analysis. Anal. Bioanal. Chem. 2004, 378, 1277–1283. [Google Scholar] [CrossRef] [PubMed]
  40. Muntau, H.; Kramer, K.J.M.; van het Groenewoud, H.; Quevauviller, P.; de Haan, E.P.M.; Dorten, W.; Kramer, G.N. Certified reference materials for the quality control of rare earth element determinations in the environment. Trends Anal. Chem. 2002, 21, 762–773. [Google Scholar] [CrossRef]
  41. Nemirovskaya, I.A. Hydrocarbons in the water, particulate matter, seston, and bottom sediments of the White Sea in the late summer. Water Res. 2009, 36, 64–75. [Google Scholar] [CrossRef]
  42. Kokryatskaya, N.M.; Volkov, I.I. Sulphur compounds in bottom sediments of the deep-water area of the White Sea. In White Sea System. Vol. IV. Sedimentation Processes, Geology and History; Nauchny Mir: Moscow, Russia, 2017; pp. 696–707. (In Russian) [Google Scholar]
  43. Budko, D.F.; Demina, L.L.; Lisitzin, A.P.; Kravchishina, M.D.; Politova, N.V. Occurrence forms of trace metals in recent bottom sediments from the White and Barents Seas. Dokl. Earth Sci. 2017, 474, 552–556. [Google Scholar] [CrossRef]
  44. Demina, L.L.; Levitan, M.A.; Politova, N.V. Speciation of some heavy metals in bottom sediments of the Ob and Yenisei estuarine zones. Geochem. Int. 2006, 44, 182–195. [Google Scholar] [CrossRef]
  45. Demina, L.L.; Budko, D.F.; Novigatsky, A.N.; Alexseeva, T.N.; Kochenkova, A.I. Occurrence forms of heavy metals in the bottom sediments of the White Sea. In Sedimentation Processes in the White Sea: The White Sea Environment Part II; Lisitzin, A.P., Demina, L.L., Eds.; V. 82. Hand Book of Environmental Chemistry; Springer: Berlin, Germany, 2018. [Google Scholar] [CrossRef]
  46. Demina, L.L.; Dara, O.M.; Aliev, R.A.; Alekseeva, T.; Budko, D.F.; Novichkova, E.; Politova, N.; Solomatina, A.; Bulokhov, A. Elemental and mineral composition of the Barents Sea recent and late Pleistocene Holocene sediments: A correlation with environmental conditions. Minerals 2020, 10, 593. [Google Scholar] [CrossRef]
  47. Agatova, A.I.; Lapina, N.M.; Torgunova, N.I. Organic matter of the Barents Sea. Arct. Antarct. A Collect. Artic. 2007, 5, 156–175. Available online: https://www.elibrary.ru/item.asp?id=47843602 (accessed on 4 September 2023). (In Russian).
  48. Carroll, J.; Zaborska, A.; Papucci, C.; Schirone, A.; Carroll, M.L.; Pempkowiak, J. Accumulation of organic carbon in western Barents Sea sediments. Deep-Sea Res. II 2008, 55, 2361–2371. [Google Scholar] [CrossRef]
  49. Losyuk, G.N.; Kokryatskaya, N.M.; Vakhrameeva, E.A.; Aliev, R.A. Reduced sulphur compounds in bottom sediments of the water bodies at different stage of separation from the Kandalaksha Gulf of the White Sea (meromictic lake Trekhtzvetnoe). Oceanology 2023, 63, 1–12. [Google Scholar]
  50. Astakhov, A.S.; Gusev, E.A.; Kolesnik, A.N.; Shakirov, P.B. Conditions of the organic matter and metal accumulation in the Chukchi Sea bottom sediments. Geol. Geophisics 2013, 54, 1348–1365. [Google Scholar] [CrossRef]
  51. Algeo, T.J.; Maynard, J.B. Trace element behavior and redox facies in core shales of Upper Pennsylvanian Kansas-type cyclotherms. Chem. Geol. 2006, 206, 289–318. [Google Scholar] [CrossRef]
  52. Tribovillard, N.; Algeo, T.J.; Lyons, T.; Riboulleau, A. Trace metals as paleo-redox and paleo-productivity proxies: An update. Chem. Geol. 2006, 232, 12–32. [Google Scholar] [CrossRef]
  53. Schippers, A.; Neretin, L.N.; Lavik, G.; Leipe, T.; Pollehne, F. Manganese(II) oxidation driven by lateral oxygen intrusions in the western Black Sea. Geochim. Cosmochim. Acta 2005, 69, 2241–2252. [Google Scholar] [CrossRef]
  54. Löwemark, L.; Jakobsson, M.; Mörth, M.; Backman, J. Arctic Ocean manganese contents and sediment colour cycles. Polar Res. 2008, 27, 105–113. [Google Scholar] [CrossRef]
  55. Marz, C.; Stratmann, A.; Matthiessen, J.; Meinhardt, A.-K.; Eckert, S.; Schnetger, B.; Vogt, C.; Stein, R.; Brumsack, H.-J. Manganese-rich brown layers in Arctic Ocean sediments: Composition, formation mechanisms, and diagenetic overprint. Geochim. Cosmochim. Acta 2011, 75, 7668–7687. [Google Scholar] [CrossRef]
  56. Rozanov, A.G.; Volkov, I.I. Bottom sediments of Kandalaksha Bay in the White Sea: The phenomenon of Mn. Geochem. Int. 2009, 47, 1004–1020. [Google Scholar] [CrossRef]
  57. Span, D.; Gaillard, J.-F. An investigation of a procedure for determining carbonate-bound trace metals. Chem. Geol. 1986, 56, 135–141. [Google Scholar] [CrossRef]
  58. Bottcher, M.E. Manganese (II) partitioning during experimental precipitation of rhodochrosite-calcite solid solutions from aqueous solutions. Mar. Chem. 1998, 62, 287–297. [Google Scholar] [CrossRef]
  59. Ianni, C.; Magi, E.; Soggia, F.; Rivaro, P.; Frache, R. Trace metal speciation in coastal and off-shore sediments from Ross Sea (Antarctica). Microchem. J. 2010, 96, 203–212. [Google Scholar] [CrossRef]
  60. Pokrovsky, O.; Viers, J.; Shirokova, L.S.; Shevchenko, V.P.; Filipov, A.S.; Dupré, B. Dissolved, suspended, and colloidal fluxes of organic carbon, major and trace elements in the Severnaya Dvina River and its tributary. Chem. Geol. 2010, 273, 136–149. [Google Scholar] [CrossRef]
  61. Kostka, J.E.; Luther, G.W. Partitioning and speciation of solid phase iron in saltmarsh sediments. Geochim. Cosmochim. Acta 1994, 58, 1701–1710. [Google Scholar] [CrossRef]
  62. Pokrovsky, O.; Schott, J. Iron colloids/organic matter associated transport of major and trace elements in small boreal rivers and their estuaries (NW Russia). Chem. Geol. 2002, 190, 141–179. [Google Scholar] [CrossRef]
  63. Davison, W. Iron and manganese in lakes. Earth-Sci. Rev. 1993, 34, 119–163. [Google Scholar] [CrossRef]
  64. Naeher, S.; Gilli, A.; North, R.P.; Hamann, Y.; Schubert, C.J. Tracing bottom water oxygenation with sedimentary Mn/Fe ratios in Lake Zurich, Switzerland. Chem. Geol. 2013, 352, 125–133. [Google Scholar] [CrossRef]
  65. Buck, K.N.; Ross, J.R.M.; Flegal, A.R.; Bruland, K.W. A review of total dissolved copper and its chemical speciation in San Francisco Bay, California. Environ. Res. 2007, 105, 5–19. [Google Scholar] [CrossRef] [PubMed]
  66. De la Rosa, J.M.; Santos, M.; Araújo, M.F. Metal binding by humic acids in recent sediments from the SW Iberian coastal area. Estuar. Coast. Shelf Sci. 2011, 93, 478–485. [Google Scholar] [CrossRef]
  67. Li, L.; Liu, J.; Wang, X.; Shi, X. Dissolved trace metal distributions and Cu speciation in the southern Bohai Sea, China. Mar. Chem. 2015, 172, 34–45. [Google Scholar] [CrossRef]
  68. Helz, G.R.; Bura-Nakic, E.; Mikac, N.; Ciglenečki, I. New model for molybdenum behavior in euxinic waters. Chem. Geol. 2011, 284, 323–332. [Google Scholar] [CrossRef]
  69. Scott, C.; Lyons, T.W. Contrasting molybdenum cycling and isotopic properties in euxinic versus non-euxinic sediments and sedimentary rocks: Refining the paleoproxies. Chem. Geol. 2012, 324, 19–27. [Google Scholar] [CrossRef]
  70. Phillips, R.; Xu, J. A critical review of molybdenum sequestration mechanisms under euxinic conditions: Implications for the precision of molybdenum paleoredox proxies. Earth-Sci. Rev. 2021, 221, 103799. [Google Scholar] [CrossRef]
  71. Chase, Z.; Anderson, R.F.; Fleisher, M.Q. Evidence from authigenic uranium for increased productivity of the glacial subantarctic ocean. Paleoceanography 2001, 16, 468–478. [Google Scholar] [CrossRef]
  72. von Gunten, K.; Bishop, B.; Enriquez, I.P.; Alam, M.S.; Blanchard, P.; Robbins, L.J.; Feng, R.; Konhauser, K.O.; Alessi, D.S. Colloidal transport mechanisms and sequestration of U, Ni, and As in meromictic mine pit lakes. Geochim. Cosmochim. Acta 2019, 265, 292–312. [Google Scholar] [CrossRef]
  73. Abdelouas, A.; Lutze, W.; Nuttall, E. Chemical reactions of uranium in ground water at a mill tailings site. J. Contam. Hydrol. 1998, 34, 343–361. [Google Scholar] [CrossRef]
  74. Duff, M.C.; Coughlin, J.U.; Hunter, D.B. Uranium coprecipitation with iron oxide minerals. Geochim. Cosmochim. Acta 2002, 66, 3533–3547. [Google Scholar] [CrossRef]
Figure 1. Location of the study region. The map on the top left presents the Arctic Ocean. The map on top right presents the vicinity of the White Sea Biological station of Moscow state university (WSBS MSU), wherein the most of the research lakes are located. The map on the left in the second row presents the Kandalaksha Gulf of the Whire Sea including the location of WSBS MSU and the island of Oleniy where the Bol’shie Khruslomeni Lake is located. The other seven figures represent satellite images showing the water bodies studied with indicating the sampling sites (red circles).
Jmse 11 01753 g001
Figure 2. The total organic carbon (%) and total sulfur (%) distribution in the bottom sediments of meromictic lakes of the White Sea coast. The red lines indicate the maximum content of TOC (2%) and Stot (0.366%) in offshore area sediments of the White Sea according to [41,42].
Jmse 11 01753 g002
Figure 3. Distribution of seven occurrence forms of heavy metals in the lake sediments of the White Sea coast.
Jmse 11 01753 g003
Figure 4. Clustering of Total Content and Occurrence Forms of Heavy Metals, Total Organic and Inorganic Carbon, and Sulfur in Bottom Sediments of Meromictic Lakes along the White Sea Coast. The red line indicates the linkage distance, which divides the dendrogram into 4 equal clusters. Numeric notations indicate occurrence forms of heavy metals: F-1 Exchangeable; F-2 Carbonates; F-3 Fe/Mn oxyhydroxides; F-4 Weakly bound to OM; F-5 Strongly bound to OM; F-6 Sulfides; F-7 Residual.
Jmse 11 01753 g004
Figure 5. Clustering of Sites Based on Total Content and Occurrence Forms of Heavy Metals in Sediments of Meromictic Lakes along the White Sea Coast. The red line indicates the linkage distance, which divides the dendrogram into 4 equal clusters.
Jmse 11 01753 g005
Table 1. Lithological and geochemical properties of White Sea meromictic lake sediments.
SitesPositionsSediment DescriptionDepth,
M
Sand, %Silt, %Pelite, %Moisture, %pHEhbw 1, mVEhsed 2,
mV
TOC, %TIC,
%
Stot, %
Trekhtzvetnoe Lake (III stage of separation 3)
T-1N66.59325000
E32.97688333
Watered light beige pelite mud with
inclusions of dark green and black interlayers with macrophyte filaments
1.31.35.892.986.06.78+120−1088.52.500.55
T-2N66.59275000
E32.97800000
Watered black pelitic mud with light black spots, strong H2S smell3.501.498.683.27.26−342−4068.70.901.11
T-3N66.59242000
E32.97807000
Watered black pelitic mud with light black spots, strong H2S smell6.001.198.983.17.17−392−39010.63.201.65
Kislo-Sladkoe Lake (II stage of separation)
KS-1N66.54903333
E33.13398333
Green-brown silty pelitic mud0.44.68.087.486.06.84+102−1167.44.10.57
KS-2N66.54823333
E33.13720000
Dark green-brown silty pelitic mud with admixture of coarse sand0.310.12.485.356.46.81+138−783.25.20.58
KS-3N66.54775000
E33.13548333
Gray–bluish silty sand0.259.227.313.337.96.90+139−3070.70.70.12
KS-4N66.54850000
E33.13461667
Dark green-brown silty pelitic mud with admixture of coarse sand211.022.364.465.96.47+70−2603.61.20.31
KS-5N66.54850000
E33.13486667
Green-biege silty pelitic mud2.5n.d. 4n.d.n.d.n.d.6.88+60−3263.31.60.30
KS-6N66.54840000
E33.13530000
Black pelitic mud with thin dark brown inter layer, H2S smell3.7n.d.n.d.n.d.n.d.6.95−99−4059.88.11.17
Bol’shie Khruslomeny Lake (II stage of separation)
BK-1N66.71798333
E32.85085000
Beige-green silty pelitic mud with admixture of fine sand with black spots and H2S smell0.99.111.179.864.37.19+90−3606.12.80.53
BK-2N66.71771667
E32.85240000
Dark green pelitic mud with black spots and H2S smell3.22.40.996.686.37.31+270−37023.301.48
BK-3N66.71683333
E32.85701667
Light black pelitic mud with dark green inclusions, jellylike texture, with strong H2S smell12.540.71.098.393.87.39−360−39614.63.81.91
Lagoon on the Cape Zeleny (II stage of separation)
ZC-1N66.53161667
E33.09598333
Dark gray poorly sorted silty sand with mud0.331.86.660.234.77.09+126−2711.01.00
ZC-2N66.52971667
E33.09370000
Gray poorly sorted silty sand with mud0.227.510.161.642.56.68+88−3200.70.90
ZC-3N66.52968333
E33.09591667
Gray poorly sorted silty sand0.33831.929.469.06.9+110−2211.41.20.13
ZC-4N66.53060000
E33.95166667
Beige green silty pelitic mud with fine sand3.027.215.056.962.67.04+155−843.82.00.38
ZC-5N66.53022000
E33.09466667
Light black pelitic mud, H2S smell6.22.93.993.291.26.98−333−3688.64.01.06
Lobanikha Bay (I stage of separation)
BL-1N66.55615000
E33.23388333
Green-beige coarse- and medium-grained silty sand with shell debris and H2S smell0.157.525.116.521.46.81+151+360.20.20
BL-3N66.55477000
E33.24561667
Light beige silty pelitic mud with admixture of sand2.524.333.342.448.86.91+181−251.80.70.09
BL-4N66.55663333
E33.23578333
Light brown silty-pelitic mud with an admixture of fine sand with inclusions of black lenses and H2S smell9.59.013.877.265.76.81−30−3054.62.10.37
Biofilters Bay (I stage of separation)
BBN66.54066667
E33.16496667
Beige green silty sand with
grey inclusions
0.361.07.817.510.17.12+85−2370.020.30
Kislaya Bay (I stage of separation)
KBN66.53661666
E33.09300000
Fine-grained beige green sand with admixture of silty-pelitic fraction, black inclusions and shell debris0.269.419.310.721.06.91+92+960.20.10
1 Ehbw—redox potential of bottom waters; 2 Ehsed—redox potential of sediments; 3 Stage of water body separation: I—Scoop-like marine bay with full tides; II—Coastal semi-isolated euxinic meromictic lake; III—Completely separated euxinic meromictic lake with fresh epilimnion; 4 n.d.—not data. Bold is marked an anaerobic sites with Eh < 0 in bottom waters.
Table 2. Description of the sequential extraction procedure.
FormReagentExtraction ConditionsSource
F-1
(Exchangeable)
1 M NaOAc1 h at room temperature under stirring; pH 8.2[35]
F-2
(Carbonates)
1 M NaOAc + HOAc24 h at room temperature under stirring; pH 5[35]
F-3
(Fe/Mn oxyhydroxides)
1 M NH2OH ∙ HCl + 25% CH3CO2H24 h at room temperature
under stirring; pH 2
[35,36]
F-4
(Weakly bound to OM)
0.1 M HCl24 h at room temperature under stirring; pH 1[36]
F-5
(Strongly bound to OM)
0.5 M NaOH24 h at room temperature under stirring; then the solutions dried by an IR lamp at 60 °C and digested
by using 4 mL of HNO3 (65%) and 2 mL HF
(40%) at 115 °C during 30 min
[36]
F-6
(Sulfides)
8 M HNO33 h at 85 °C under stirring[36]
F-7
(Residual)
HNO3 conc. + HCl conc. + HF conc.microwave oven[37]
Table 3. Median values for occurrence forms and total contents of heavy metals (Al, Fe—mg/g, others—μg/g), TOC (%), and Stot (%) in three Groups of sites (Group A: sites in open sea bays; Group B: shallow sites with oxic sediments of meromictic lakes; Group C: anoxic sites of meromictic lakes), as well as results of Kruskal-Wallis ANOVA Test assessing differences in element contents among these three groups. Elements marked in red indicate significantly different values among all three Groups; underlined values indicate no significant differences between Groups; bold font indicates no significance among all three groups; “n” refers to the number of analyzed sites. For Co-1, Mo-6, Pb-2, and U-3, Groups 1 and 3 display significant differences (marked in red), while differences between Groups 1 and 2, and between Groups 2 and 3, are not significant (underlined).
ElementGroup 1
n = 4
Group 2
n = 9
Group 3
n = 9
Hp-Value
Fe-10.0010.0030.0036.140.046
Fe-20.0370.0160.0352.530.283
Fe-30.310.863.7212.550.002
Fe-40.480.831.7111.410.003
Fe-50.0350.3130.62013.610.001
Fe-62.07.410.29.870.007
Fe-719.110.54.411.830.003
Cr-10.0380.0510.0471.150.563
Cr-20.100.190.249.640.008
Cr-301.122.7912.560.002
Cr-40.681.883.139.480.009
Cr-50.122.876.6314.290.001
Cr-65.013.122.811.200.004
Cr-783.955.722.114.620.001
Mn-10.160.400.7010.220.006
Mn-20.250.832.3014.060.001
Mn-33.55.814.38.470.015
Mn-48.413.019.96.170.046
Mn-50.331.113.8012.650.002
Mn-6248314010.580.005
Mn-77722788016.410.000
Co-10.0130.0210.0596.640.036
Co-20.0270.0370.1068.360.015
Co-30.110.240.7012.720.002
Co-40.210.560.8210.810.005
Co-50.050.460.7510.240.006
Co-61.02.23.911.010.004
Co-78.76.32.014.960.001
V-10.150.340.433.200.202
V-20.260.660.647.150.028
V-30.522.547.4714.960.001
V-41.04.08.312.960.002
V-50.22.95.313.670.001
V-65.011.617.77.720.021
V-757.132.815.914.290.001
Zn-10.460.990.432.120.347
Zn-20.371.325.2013.940.001
Zn-31.65.017.615.790.000
Zn-41.693.154.129.510.009
Zn-50.131.014.2211.390.003
Zn-65.76.818.74.420.110
Zn-723.220.217.03.040.218
Ni-10.090.180.124.620.100
Ni-20.150.300.678.880.012
Ni-30.361.903.6413.380.001
Ni-40.642.073.5210.830.005
Ni-50.163.325.2412.010.003
Ni-62.67.814.213.980.001
Ni-724.615.27.413.620.001
Cu-12.81.30.63.270.195
Cu-20.0130.1350.0676.190.045
Cu-30.1430.0120.0880.430.809
Cu-40.581.531.727.430.024
Cu-50.59.517.812.060.002
Cu-61.84.26.511.540.003
Cu-71.300.390.385.370.068
Mo-10.080.703.6511.600.003
Mo-30.060.503.1911.490.003
Mo-40.050.020.2811.730.003
Mo-50.131.673.459.080.011
Mo-60.070.160.547.570.023
Mo-70.180.140.095.750.057
Cd-10.0040.0120.0052.000.367
Cd-20.0010.0280.05810.590.005
Cd-30.0060.0350.17811.700.003
Cd-40.0010.0020.00811.370.003
Cd-50.0040.0040.0030.100.952
Cd-60.0030.0010.0076.680.036
Cd-70.0860.0530.0079.930.007
Pb-10.0330.4450.6557.050.030
Pb-20.0300.0720.1588.880.012
Pb-30.151.654.6115.660.000
Pb-40.060.140.6316.030.000
Pb-50.0270.0620.2338.700.013
Pb-60.240.410.5914.970.001
Pb-77.964.581.7111.250.004
U-10.0110.0490.0759.860.007
U-20.080.370.546.980.030
U-30.110.230.719.130.010
U-40.070.190.349.340.009
U-50.020.991.459.410.009
U-60.230.410.829.190.010
U-70.480.290.1810.590.005
TOC0.213.238.7215.330.001
Stot0.010.311.1112.230.002
Al68.045.531.57.690.021
V63.452.154.01.480.476
Cr91.769.466.84.610.100
Mn5172752487.150.028
Fe23.718.224.35.700.058
Co10.68.711.01.740.419
Ni31.632.538.96.750.034
Cu5.216.027.915.500.000
Zn106809512.360.002
Mo0.61.711.512.360.002
Cd0.20.20.410.290.006
Pb7.99.110.35.390.068
U1.31.94.89.960.007
Table 4. Total contribution of major forms to metal deposition in sediments of meromictic lakes separating from the White Sea (based on sequential chemical extraction data).
MetalPrincipal Form
VF-7 > F-6 > F-5 = F-4 = F-3
CrF-7 > F-6 > F-5
FeF-7 > F-6 > F-3
MnF-7 > F-6 > F-3
CoF-7 > F-6 > F-5 = F-4 = F-3
NiF-7 = F-6 > F-5 = F-4 = F-3
CuF-5 > F -6 > F-4 = F-1 > F-7
ZnF-7 > F-6 > F-3 > F-4 > F-2
MoF-5 > F-1 > F-3 > F-7
CdF-7 = F-3 > F-2 > F-1
PbF-7 = F-3 > F-1
UF-5 > F-7 = F-2 > F-6 > F-3 > F-4 > F-1
Disclaimer/Publisher’s Note: The statements, opinions and data contained in all publications are solely those of the individual author(s) and contributor(s) and not of MDPI and/or the editor(s). MDPI and/or the editor(s) disclaim responsibility for any injury to people or property resulting from any ideas, methods, instructions or products referred to in the content.

