1. Introduction
The rapid development of the shipping industry has significantly contributed to the growth of global trade, but it has also posed challenges to maritime safety [
1]. The safety of routes has emerged as a critical domain of emphasis for the shipping sector and its associated enterprises. As the southward economic channel of the ‘21st Century Maritime Silk Road’, the China–Australia and New Zealand route has gained significant attention for its transportation function and significance. However, according to a report by the International Maritime Organization, the safety situation of maritime transportation along this route is not optimistic. Nevertheless, as per a report published by the International Maritime Organization, the safety status of maritime transportation along this course is not sanguine. How to scientifically and reasonably build the risk assessment model of the route is an important premise and calls for mastering the risk status of the route and identifying the influencing factors in the risk scenario.
From 2010 to 2023, very serious levels of maritime casualties and accidents accounted for 60–70% of the total number of accidents along the China–Australia and New Zealand route, highlighting the seriousness of safety risks along the route. For example, on 17 May 2023, a fishing vessel from China to Australia capsized in the Indian Ocean. The vessel with 39 crewmembers onboard is still missing. To ensure the sustainable development of the shipping industry, preventing maritime accidents and ensuring safety at sea should be the primary goal of the International Maritime Organization. Therefore, describing various risks and developing a quantitative evaluation model for the risk of LNG maritime transportation on this route to accurately predict and prevent risks that have not yet occurred can guide the safety of maritime transportation activities to a certain extent [
2].
Previous studies have demonstrated that due to the numerous influencing factors involved in the indicator system, the diverse types and complex structures of indicators, as well as the participation of experts, maritime safety risk assessment problems have uncertainties brought about by the diverse types of indicators, structural uncertainties brought about by complex system structures, and cognitive uncertainties brought about by human cognitive limitations. Taking into account various uncertainties, risk factors including cargo characteristics, ship conditions, environmental conditions, human error, and management issues ensure that the safety of maritime transport is a complex task [
3]. Addressing these challenges requires the collection and investigation of the latest data from recent maritime accidents, analysis of the causes of such accidents, identification of key risk influential factors (RIFs) under different scenarios, and the prediction of associated risks.
While classical risk analysis methods, including Failure Mode and Effects Analysis, Analytic Hierarchy Process, Markov Model, Human Factors Analysis and Classification System, and Fault Tree Analysis (FTA), have been widely used to identify critical factors for enhancing maritime safety, they are not practical for uncertain risk analysis with changing environmental conditions [
4]. Among these models, Failure Mode and Effects Analysis with transparent and simple features [
5] and Analytic Hierarchy Process with the ability to assign different weights to indicators [
6] are widely used. However, both methods require experts to make evaluations in highly complex assessment environments [
7]. Professional level, personality traits, and subjective judgment can all affect the ability to make accurate evaluations, leading to ambiguity and uncertainty in the final results, which cannot be used for risk assessment under multiple indicators. Human Factors Analysis and Classification System is designed to analyze different degrees of human factors in accidents. Celik M [
8] introduced the Human Factors Analysis and Classification System model for water traffic accidents and identified the lowest level human factors in the model through a fuzzy analytic hierarchy process. However, its shortcomings are obvious. This method is only applicable to risk assessment caused by human factors in smaller models and cannot express other relevant factors. These limitations have necessitated the development of advanced risk analysis methods, such as Fuzzy Logic (FL) and the Bayesian Network.
Among the advanced methods used for maritime risk analysis, BN has gained significant attention due to its ability to explain the relationships among multiple variables under uncertainty, based on probabilistic information for risk assessment. Risk analysis using BN has become a promising technique in complex and uncertain shipping scenarios [
9]. For example, Fan et al. [
10] used the Naïve Bayesian Network (NBN) to model maritime accident risk analysis and identified 16 RIFs based on the analysis of 161 accident reports collected from 2012 to 2017. Similarly, Jiang and Lu [
11] proposed a dynamic Bayesian network (DBN) model to assess dynamic contingencies in the Indian Ocean sea lanes based on incident data from 2007 to 2018.
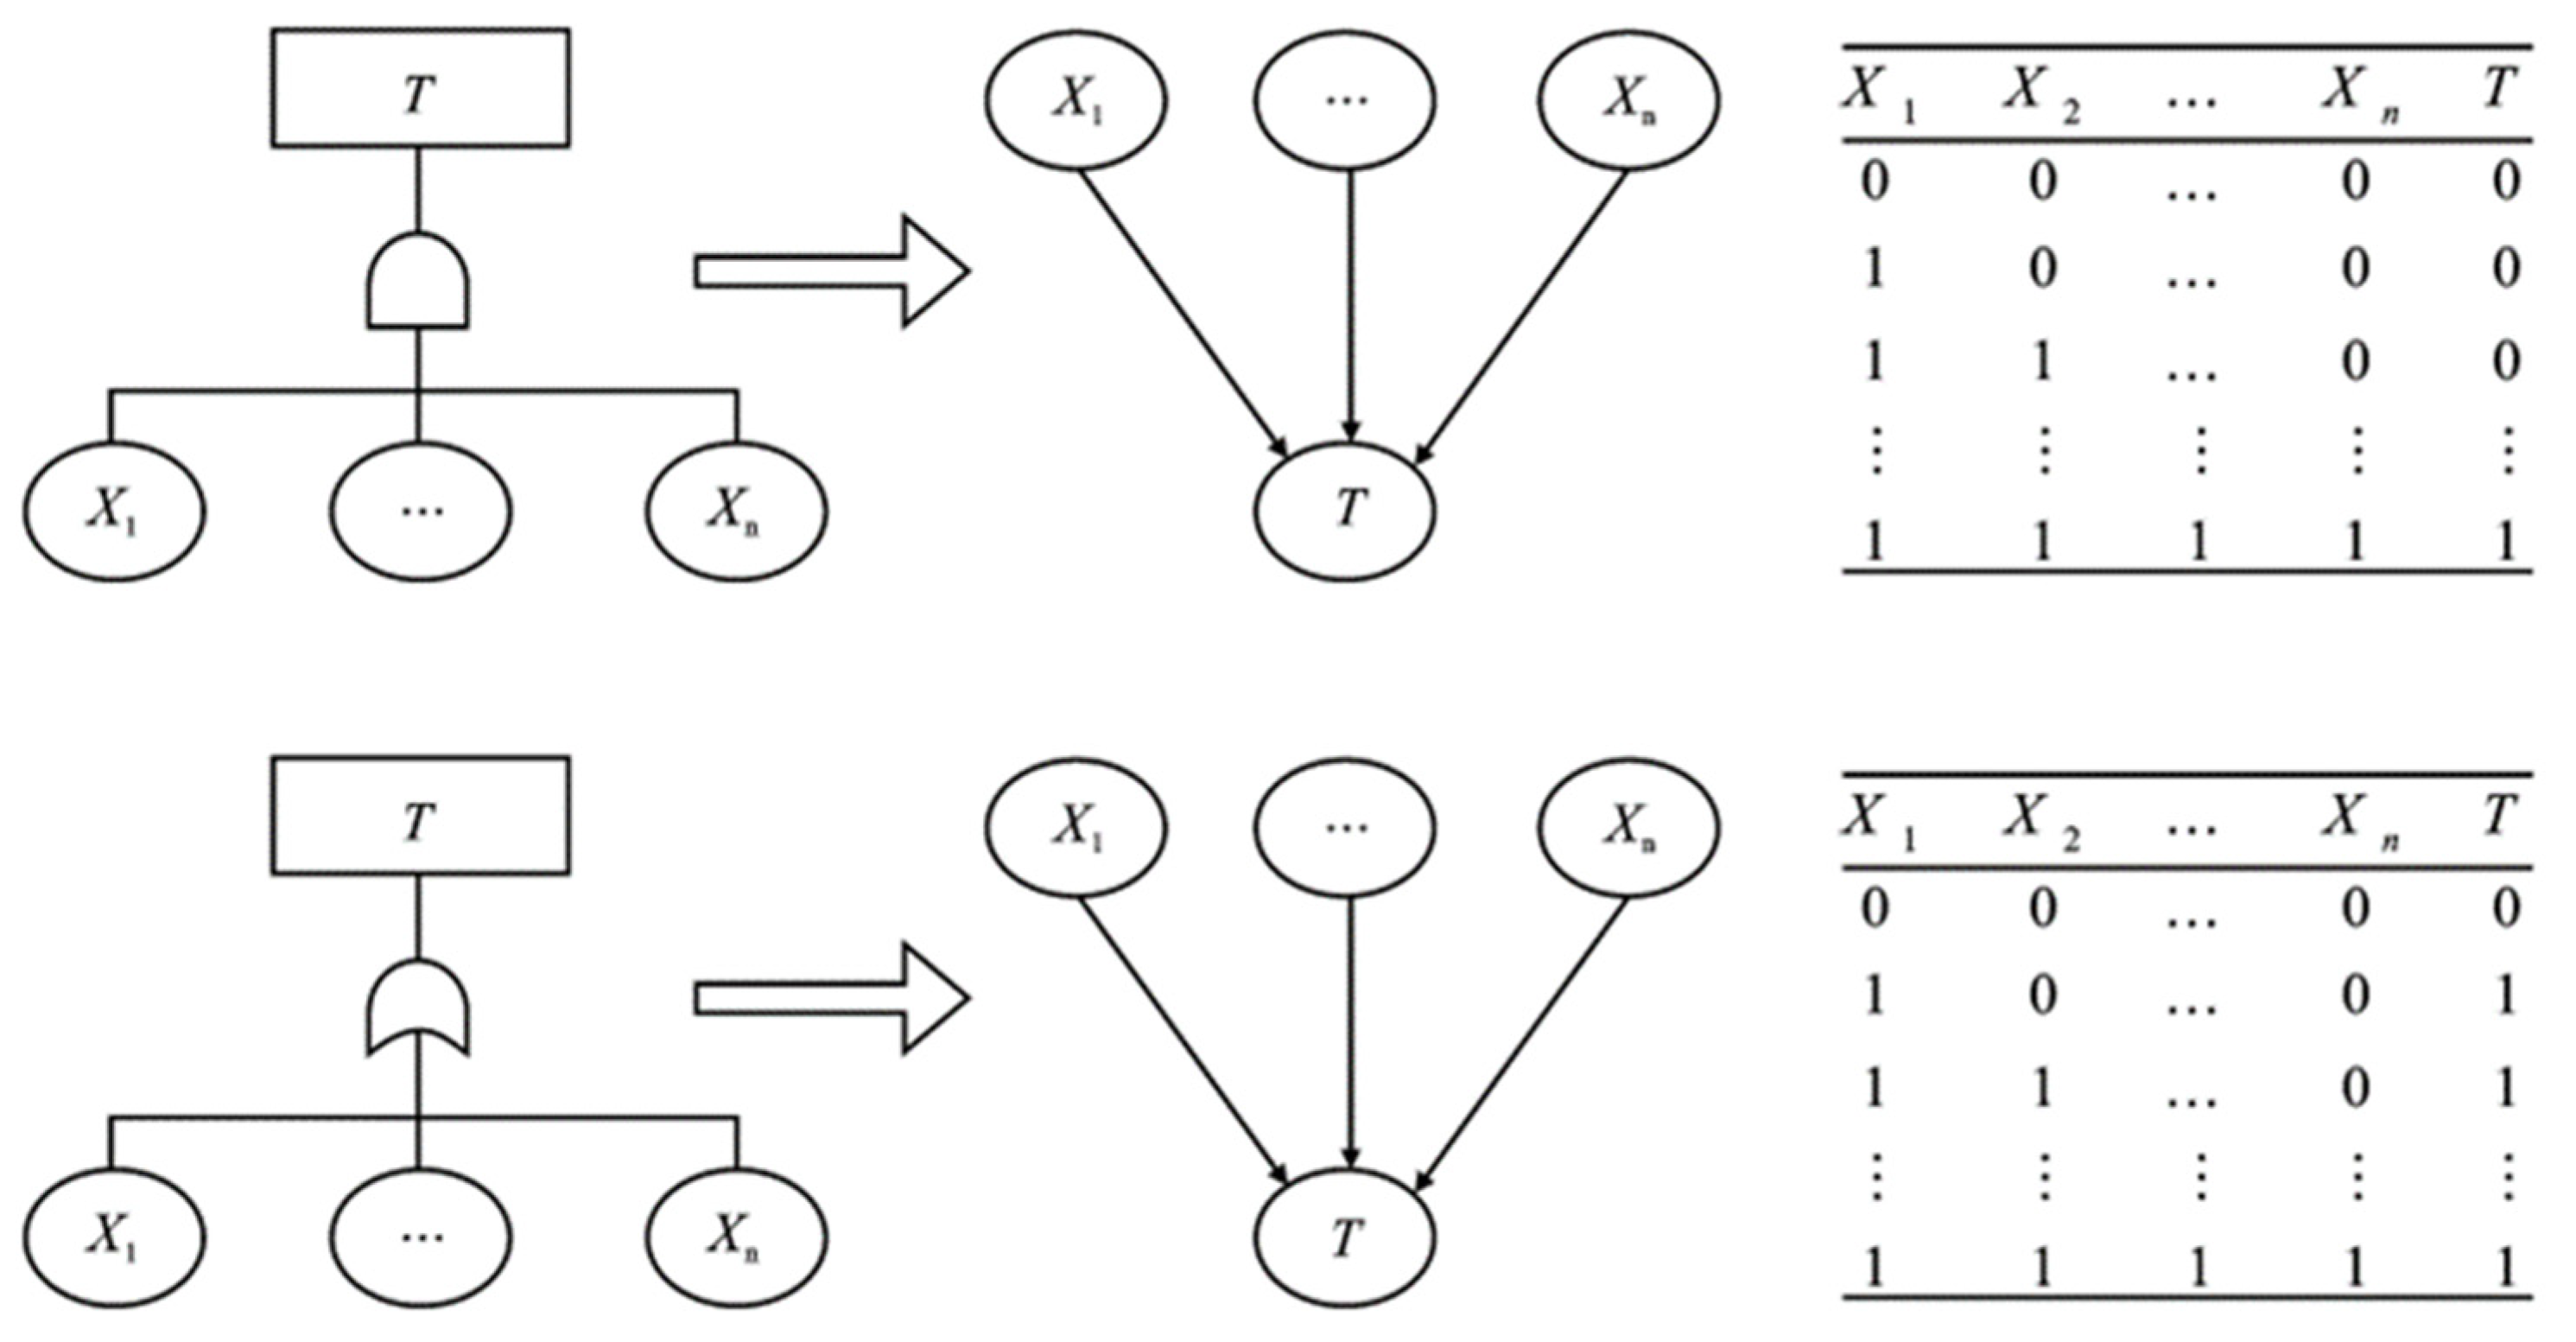
However, the Bayesian network faces some challenges when capturing the conditional probability tables (CPTs) among the influencing factors and make it hard to determine a rations structure among the nodes: (1) when determining the CPT, the traditional method is expert scoring or data-driven, but these two methods require a high number of data samples, consuming time and energy; and (2) regarding structural learning, expert judgment is usually introduced, which can lead to strong subjectivity and bias, especially when multiple nodes are involved. Zhao [
8] has shown that FTA can cleverly solve this problem, and combining FTA and BN can be used for maritime risk analysis under complex environmental impacts, which can be beneficial in compensating for their respective shortcomings. They use fuzzy fault tree analysis and noise or gate Bayesian network to estimate the probability of navigation accidents. The fault tree analysis is constructed from the navigation accident investigation report, and then the fault tree analysis is transformed into a Bayesian network using Noisy-OR gate. Finally, the model was applied to Qinzhou Port and reasonable conclusions were drawn by comparing it with the calculation results of other waterways.
This paper endeavors to rectify the aforementioned shortcomings by presenting the following measures. The primary objective of this paper is to propose a two-stage model framework for evaluating the risk of LNG maritime transport on the China–Australia route. The first stage involves constructing a fault tree based on the influencing factors identified from the related literature and accident reports, followed by calculating the prior probability of basic events using the expert comprehensive evaluation method and fuzzy set theory. In the second stage, the fault tree is transformed to a BN model, and the results of FTA in the first stage are input into the BN model in the second stage as initial values. After completing the BN model validation, the next step is to predict, prevent, and diagnose the risk of LNG maritime transport, and introduce a risk matrix to analyze the risks from the perspectives of importance and frequency. This paper offers three significant contributions: (1) the introduction of fuzzy set theory and expert voting mechanism addresses the challenges associated with handling conflicts in expert opinions and the inherent fuzziness in the expert scoring process and enriches the application of expert scoring methods in the field of risk assessment; (2) the probability importance degree and key importance degree obtained from the fault tree analysis are regarded as two inputs of the risk matrix. This enables decision-makers to clearly perceive the frequency and severity of risks, as well as their interrelationships, and assigns them priority levels, expanding the application and development of traditional risk management theory where risk is directly multiplied by frequency and importance; and (3) the richness of influencing factors in the LNG maritime transportation process leads to the complexity and uncertainty of the indicator system structure. Through the transformation of FTA to BN, a rational and scientific Bayesian risk assessment model has been constructed, expanding the application of LNG risk transportation under uncertain factors.
The remainder of this paper is organized as follows.
Section 2 reviews the literature related to maritime accident research and the application of BN and FTA in maritime risk analysis and explores relevant research gaps.
Section 3 proposes a risk assessment framework for LNG maritime transportation. This includes an illustration of the basic theory, identification of influencing factors in the risk assessment model, and explanation of the voting mechanism and risk matrix used in the subsequent analysis. In
Section 4, the methodology is applied to evaluate the risk of LNG maritime transport on the China–Australia route.
Section 5 proposes improvement measures for risks with a high impact on the model output.
2. Literature Review
2.1. Risk Assessment of LNG Maritime Transport
LNG maritime transportation belongs to high-risk cargo transportation, and there is rich research in the academic community on the risks of LNG maritime transportation. Vanem et al. [
12] conducted a high-risk assessment of the global navigation of LNG ships. The analysis collects and combines information from multiple sources and available information from different sources has been structured in the form of event trees for different generic accident categories. Five different types of LNG-related risks have been identified, namely collision, grounding, contact, fire and explosion, and accidents that occur during loading and unloading at the dock. The results showed that the highest risk is collision. On the basis of traditional evaluation models, Martins [
13] proposed a complete quantitative risk analysis method (QRA) for potential risk accidents that may occur during the offshore terminal loading and unloading processes of LNG ships. By comparing it to traditional models, the advantages and limitations of the new model are pointed out. Marroni et al. [
14] developed a simplified method for the risk assessment of LNG ships in port areas. Based on the standard characteristics of the ship, a set of reference accident scenarios that need to be considered in risk assessment has been determined, providing specific guidance for determining hazards, estimating frequency of occurrence, and consequences. Finally, a customized risk matrix was adopted to support decisions on prevention and mitigation measures. Abdussamie et al. [
15] proposed a fuzzy set method to deal with the uncertainty in expert opinions used in qualitative risk assessment research (such as a risk matrix). The risk parameters are modeled using fuzzy set, and the fuzzy risk values of several dangerous scenarios at different stages of the ship berthing operation are calculated.
Among the existing methods for quantitative risk analysis, fault tree analysis (FTA) and Bayesian network (BN) are conventional tools. For example, Zhou [
16] took the loading and unloading process of a ship as an example, constructed a modified FTA for ship accident leakage, and introduced human reliability analysis (HRA) to predict human errors in the loading and unloading processes of LNG ships. Finally, the results of FTA and human reliability analysis are combined, and a Monte Carlo simulation (MCS) is used to evaluate the risk. Additionally, Zhao et al. [
17] used Bayesian network to identify potential risks, calculate accident probability, and evaluate the severity of consequences for the safe anchoring system of LNG ships. Yeo [
18] analyzed and identified potential hazardous events that may occur during the unloading process of LNG transport vessels at floating terminals. They use Bayesian networks to dynamically analyze the safety of LNG ships during loading and unloading to identify the most likely types of accidents. The result is similar to Vanem: collision is the most probable accident to occur during the offloading process of an LNG carrier at berth, which may have catastrophic consequences. Li et al. [
19] proposed a process risk-based decision-making method for LNG ships colliding with Arctic Sea ice or obstacles based on the dynamic Bayesian network (DBN) risk assessment model, indicating that the decision-making process of ship navigation is dynamically related to time. Additionally, Melani et al. [
20] combined the two methods, using FTA to analyze the failure of the unloading equipment of LNG ships. They combined it with pre-hazard analysis and causality diagram to calculate the probability of various accidents through Bayesian probability. Finally, they used the risk matrix for risk analysis and provided corresponding improvement measures and suggestions.
2.2. FTA and BN in Maritime Risk Analysis
In this section, the advantages of FTA and BN in risk modelling are further demonstrated by a systematic review of its applications in maritime accident/risk analysis. FTA and BN models have been extensively applied in the field of maritime transport risk assessment and have yielded several notable results. FTA aims to determine the root cause by using a top-down method to build the accident chain and evaluate its impact on the accident. Fu et al. [
21] proposed a fuzzy event tree method for Frank copula, which evaluated the risk of major ship accidents in Arctic waters under the consideration of uncertainty. Ugurlu [
22] used FTA for qualitative and quantitative analysis to determine the root causes of ship-to-ship collisions statistically. Results show that the violation of the COLREG Rules is the most important and effective factor for collision accidents.
A Bayesian network model is used for quantitative assessment of risks under certain conditions. For instance, Wan et al. [
23] develop a novel model to assess the risk factors of maritime supply chains by incorporating a fuzzy belief rule approach with Bayesian networks. The new model, compared to traditional risk analysis methods, has the capability of improving result accuracy under a high uncertainty in risk data. In another study, Baksh et al. [
24] employed BN to assess the transport risks during navigation in the Arctic Sea. The researchers first discussed the causes of maritime accidents and calculated the prior probability of Bayesian network nodes based on historical data and expert judgment. Subsequently, the possibility of accidents was determined through a sensitivity analysis of the model. The results revealed that sea ice was the main influencing factor of the accident, and appropriate management measures were proposed accordingly. Additionally, Chen et al. [
25] proposed an evidence-based fuzzy Bayesian network method to build a maritime accident Statistical model. Using maritime accident reports, the Bayesian network was constructed from a systematic perspective and its reliability was verified by three axioms.
FTA can establish a linear or sequential relationship between events leading to an accident and provide a known conditional probability table and a clear model structure for the Bayesian network. For example, Sakar et al. [
26] mapped FTA to BN to analyze the causes of grounding accidents and found that navigation factors had the most significant impact on grounding accidents. Sokukcu et al. [
27] considered the limitations of Fault tree analysis in terms of conditional dependence and stationarity, proposed a Bayesian network mapping method based on Fault tree analysis to overcome this limitation, and conducted a probabilistic risk analysis on collision events. Kaushik et al. [
28] proposed a comprehensive method based on intuitionistic fuzzy fault tree and Bayesian network to evaluate the fault probability of a system in cases of imprecise and insufficient fault data. The results indicate that when the statistical failure data of components are inaccurate, this method can be used as an alternative method for reliability probability assessment.
Based on the literature review presented above, two research gaps have been identified: (1) regarding structural learning, most studies use data-driven TAN or traditional BN models, which require expert guidance or data-driven development, leading to high energy and time consumption. Additionally, when multiple evaluation indicators are involved, determining the causal relationship between nodes and CPT in the network can be challenging. To address these issues, a FTA transformation method can be applied to remedy the structural defects of a traditional BN model and (2) when obtaining the quantitative value of the prior probability of the root nodes, most studies use the method of expert questionnaire. However, the possible deviations in the questionnaire results are not handled, resulting in a large deviation in the prior probability of some root nodes. By introducing an expert voting mechanism, we consider screening and retaining the expert opinions with significant deviations. Thus, the accurate prior probability value can be obtained.
In order to address the aforementioned gaps in the research, this study employs a comprehensive, multi-step framework. First, we identify risk factors that may lead to hazards in LNG maritime transport by reviewing relevant literature and develop a fault tree model accordingly. Next, the probability of failure of basic events is calculated according to the fuzzy set theory and expert scoring method. W also introduce a voting mechanism into expert scoring results to handle results with significant differences in opinions. For example, when experts have similar ratings for the frequency of events, their opinions are taken into consideration for subsequent analysis. However, when most experts give a relatively unified opinion on the frequency of an event, while very few experts have opposite opinions, the opinions of the very few experts are discarded, and the unified opinions of other experts are retained.
Then, the fault tree is transformed into a Bayesian network, and the risk prediction, prevention, and diagnosis are carried out in turn. The novelty of this research lies in integrating the fault tree with the Bayesian network, where FTA analyzes the causal relationship between risk factors, compensating for the challenge of determining the causal relationship of nodes in the Bayesian network model. After establishing the Bayesian network model, we can perform forward prediction and backward diagnosis, which overcome the limitation of the fault tree’s inability to carry out probabilistic quantitative analysis.
4. Case Study
4.1. Description of the China-Australia Route
The China–Australia route, starting from China, passes through Southeast Asian countries such as the Philippines and Indonesia, as well as the South China Sea, Banda Sea and other sea areas, and finally reaches Australia and South Pacific island countries. As China’s offshore route, this route is a route channel with intensive and busy economic and trade exchanges with Australia and other countries, and it is also an important maritime transport channel for national strategic energy. China imports a large amount of energy and goods such as LNG and iron ore from Australia, which is the lifeline of China–Oceania import and export trade. Therefore, the shipping activities such as container transportation, LNG, iron ore, asphalt, and other bulk cargo transportation on the China–Australia route are active and frequent.
Due to the uncertainty of risks along the China–Australia route, there are certain impacts and losses along the route due to risks, providing a certain warning for the safe operation of the route. According to the statistics on maritime casualties and accidents released by the IMO, the statistics on maritime casualties and accidents along the route can be divided into three levels: very serious, serious, and not very serious. During 2006–2020 (the global shipping industry was impacted and affected by the global COVID-19 from 2020 to 2023, so there were fewer casualties and accidents at sea), the proportion of the very serious marine casualties and accidents along the line was basically 60–70%. The proportion of serious maritime casualties and accidents is second, ranging from 20% to 30%. The proportion of less serious maritime casualties and accidents is the smallest, around 10%. This indicates that the consequences of maritime safety accidents caused by safety risks along the route are relatively serious. Therefore, the risk issues of the China–Australia route need to be taken seriously and security risk control along the route should be strengthened. In addition, according to a series of reports on Safety and Transportation Review issued by IMO, among the top ten loss areas in 2012–2019, southern China, Indonesia, and the Philippines have always been the key areas and focuses of ship losses. Among these key areas, the areas along the China–Australia route account for the vast majority, and the proportion of ship losses along the route remains around 20–30% globally. The significant safety risk losses indicate that the results caused by safety risks along the route are not optimistic and urgently need to be taken seriously by relevant parties.
4.2. Risk Prediction
In the realm of risk analysis, the utilization of expert evaluation via questionnaires is widely regarded as a reliable approach to supplement the inadequacies inherent in incomplete data, thereby affording the opportunity to procure prior probabilities of greater precision. When selecting multiple experts to score the probability of failure of basic events, the judgment ability of each expert () may be distinguished according to their working years.
The flowchart of the refinement stage of the voting mechanism is shown in step 3 of
Figure 1. Firstly, each expert needs to choose a probability based on their own experience and research objectives. The five probabilities given by experts are all located in “very low (VL), low (L), medium (M), high (H), and very high (VH)”. In the second step, expert opinions will be processed to further identify voting results with scores far below the average score for each factor. After discussion, it is believed that this situation was an accidental situation encountered by a certain expert and could not be symbolically summarized. Therefore, the excessive biased opinions in this situation are removed and the common opinions of the majority of experts are retained. The third step is to process and calculate the retained opinions into fuzzy set theory, converting them into probability values within the range of (0, 1). The prior probability of each basic event is obtained.
In this study, six experts were invited to conduct the expert judgements.
Table 3 shows the allocation of experts according to their years of work experience, and the specific questionnaire survey results can be found in
Appendix B.
It can be observed from the questionnaire results that the scoring results of most basic events are relatively average. The Mean
corresponding to each fuzzy language is averaged, and the error between the scoring results of six experts under 22 basic events and the average value is calculated, respectively. Five experts are involved, so a ratio of 0.2 is used for screening. We believe that scores exceeding the average value by 20% conflict with the opinions of most experts, so we have manually removed this situation to ensure consistency in expert judgment. If the error is within 0.2, it is considered reasonable, and the scoring result error table is shown in
Table 4. If the score error of four Basic events is higher than 0.2, the expert opinion with a larger error in this case will be discarded and the other average expert opinions will be retained. In this way, the fairness of expert scoring opinions has been reasonably addressed. Meanwhile, the deviation of unequal information in the subjective judgment of experts is overcome, and the accuracy of the prior probability value of basic events is guaranteed.
The prior probabilities of each basic event in LNG maritime transport risk can be calculated using Equations (3)–(8), and the calculation results are shown in
Table 5.
The probabilities of top event and intermediate events can be obtained after importing the prior probabilities of various basic events into the Bayesian network model. This step becomes ‘risk prediction’. By performing calculations using NETICA, the probability of the occurrence of risks during LNG maritime transport on the China–Australia route is 0.106, which is the predicted result. Due to the direct connection between the three intermediate events I1, I2, and I3 and the top event, they are considered as the direct cause of the risk occurrence. The direct causes of accidents are also evaluated, with a probability of 0.102 assigned to ‘Shipping routes safety risks (I3)’, 4.53 × 10⁻³ to ‘LNG’s own transport risks (I1)’, and 9.82 × 10⁻⁷ to ‘Vessels and equipment risks (I2)’. As a result, measures to reduce the risk of shipping routes should be prioritized over other risk-reduction measures.
4.3. Model Validation
The validity of the BN model can be evaluated using the two axioms. The reliability of partial nodes in the network is verified by applying these axioms sequentially.
Axiom 1: The change of the failure probability of the target node is observed in the BN model by changing the prior probability value of the relevant intermediate node. This test determines whether the model meets the requirements of Axiom 1.
Axiom 2: The total impact of the combination of probability changes from ‘evidence nodes’ on the target value should always be greater than the combination of probability changes from ‘secondary evidence nodes’.
The results of Axiom 1, depicted in
Figure 6, show that the prior probability value of the target node and the intermediate node exhibit similar fluctuation trends. When the probability of the intermediate nodes being in the ‘normal’ state is 0%, the probability of the target node being in the ‘normal’ state is also 0%. This is because, in CPT, any abnormality in the three intermediate nodes leads to the occurrence of the final accident.
To verify Axiom 2, it is necessary to first determine ‘evidence nodes’ and ‘secondary evidence nodes’. The state of ‘Safety of shipping routes (I3)’ is related to ‘Inherent risks of the airline itself (I4)’, ‘Influence of weather and sea state (I5)’, ‘Coastal ports risk (I6)’, and ‘Maritime security environment (I7)’. Therefore, in this paper, ‘Safety of shipping routes (I3)’ is considered an ‘evidence node’, while ‘inherent risks of the airline itself (I4)’, ‘Influence of weather and sea state (I5)’, ‘Coastal ports risk (I6)’, and ‘Maritime security environment (I7)’ are regarded as ‘secondary evidence nodes’.
When new evidence is introduced into the Bayesian network and the probability of four nodes being in the ‘normal’ state is 100%, the probability of ‘Risk of LNG maritime transport (T)’ being in the ‘normal’ state is 89.4%, 93.5%, 90.9%, and 93.5%, respectively. When the probability of the four nodes being in the ‘normal’ state simultaneously is 100%, the probability of ‘Risk of LNG maritime transport (T)’ being in the ‘normal’ state is 99.5%. This value is greater than the probability value of ‘Risk of LNG maritime transport (T)’ caused by the individual change probabilities of the four nodes, thereby satisfying the validation conditions of Axiom 2. In addition, tests were conducted on other corresponding secondary evidence nodes, which also met the validation criteria of Axiom 2.
4.4. Risk Prevention
By calculating and ranking the critical importance and probability importance of basic events, it is possible to clarify the degree of influence of each event on the occurrence risk. Taking control measures for events with a high degree of impact and a relatively easy reduction in the failure probability can effectively prevent the occurrence of LNG maritime transport risk.
4.4.1. Calculation of Importance
The probability importance and critical importance of basic events can be calculated, and the results are shown in
Table 6.
4.4.2. Rank of Importance
The risk matrix is a qualitative analysis tool used to rank the likelihood and consequences and specify the level of risk. It mainly analyzes and evaluates risks from two dimensions: the likelihood of risk factors occurring, and the severity of damage caused. This evaluation method is a combination of qualitative and quantitative methods. The form of the risk matrix is represented by a two-dimensional table, and the basic risk matrix coordinate diagram is shown in
Figure 7. By drawing a risk matrix diagram, multiple risks in the system can be more intuitively compared, and the corresponding order and methods of risk factors can be further determined based on the comparison results.
The basic risk matrix mainly divides the risk level into three regions: A, B, and C. If a risk factor is located in Region A, it is considered a high-level risk factor. Preventive measures should be taken well, and rules and regulations should be established to avoid such situations. If a risk factor is located in Region B, it is considered a moderate risk factor and reasonable control methods and solutions need to be developed. If a risk factor is in region C, it is considered a very low-level risk factor. Under the existing security management system, there is no need for additional control.
In order to comprehensively evaluate the risk of LNG maritime transport, the risk matrix analysis is introduced on the basis of the Bayesian network. Risk matrix is a qualitative analysis tool used to grade the possibility and consequence and specify the risk level. It can comprehensively represent the frequency and severity of risk accidents. According to the calculation results of probability importance and critical importance, they are standardized and presented in the table in the form of quadrants. By classifying the analyzed risks, we can obtain three different risk categories: ‘high risk factor (HR)’, ‘medium risk factor (MR)’, and ‘low risk factor (LR)’. The specific division is shown in
Figure 8.
4.4.3. Analysis of Importance Ranking Results
The high-risk factors are located at the intersection of the peaks of probability importance and critical importance, which means the events with a high risk of influencing top events and easily reduce the priori probability [
33]. Taking measures to reduce the possibility of failure of these events will quickly and effectively reduce the risk of LNG maritime transport.
From the calculation results of probability importance, we find that there is no significant difference between the importance values of the top 14 basic events, which is much higher than the bottom 8. The order of critical importance of the top 14 is the same as probability importance, but the critical importance of the top 5 is far higher than that of others. Consequently, the fundamental occurrences associated with the uppermost five were scrutinized as perilous elements. Specifically, these comprise ‘Non-traditional threat to security (I13)’, ‘Heavy fog (X10)’, ‘High frequency of strong winds (X13)’, and ‘Fewer LNG unloading ports (X14)’. First of all, non-traditional security threats along the China–Australia route are increasingly prominent. Piracy and terrorist attacks have international characteristics, increasing the probability of transport risks. Moreover, the impact of the global epidemic has made maritime public health safety one of the important factors affecting transport risks. Therefore, we should include this factor in the assessment and response to transport risks and strengthen joint prevention and control measures to build a solid maritime security defense line. Secondly, ‘Heavy fog (X10)’ and ‘High frequency of strong winds (X13)’ fall under the category of ‘Influence of weather and sea state (I5)’. In case of severe weather, navigation ships need to take evasive measures such as entering the port or avoiding navigation. Finally, the small number of seaports on the China–Australia route has a high impact on LNG maritime transport risks, mainly because some ports along the route do not have facilities and equipment for LNG storage, loading, and unloading, resulting in poor connectivity with other ports, thereby increasing the risks in LNG transport.
Meanwhile, eight basic events with probability importance and critical importance close to zero are considered low-risk factors, namely ‘Safety performance of LNG ships (X
3)’, ‘Difficult handling of LNG ships (X
4)’, ‘Long course distance (X
5)’, ‘Deep channel (X
6)’, ‘High ocean current velocity (X
7)’, ‘Heavy traffic flow in the section (X
8)’, ‘Unsafe behavior of personnel on LNG ships(X
17)’, and ‘Poor organization (X
18)’. Reducing the occurrence probability of these events has less effect on improving the safety of LNG maritime transport and is more difficult to reduce [
33]. We can summarize this as two intermediate events: ‘Vessels and equipment risks (I
2)’ and ‘Inherent risks of the route itself (I
4)’. In the case of limited resources, we can ignore these factors.
Moreover, medium-risk factors are events with high probability importance but low critical importance. Although such factors have a high risk of influencing the occurrence of top events, their own occurrence frequency is very low. Therefore, daily inspection and management should be strengthened for such factors, and potential symptoms should be found and handled in a timely manner.
4.5. Risk Diagnosis
The cause of risk can be diagnosed by sorting the posterior probability of basic events, with the support of the ability of BN’s binary risk diagnosis and risk prediction. The posterior probability of each basic event is calculated through NETICA, as shown in
Table 7.
The posterior probability ranking results of basic events are as follows.
If there are risks in LNG maritime transport on the China–Australia route, the most likely reasons are ‘The impact of epidemic (X22)’, ‘Piracy and terrorist attacks (X21)’, ‘Fewer LNG unloading ports (X14)’, and ‘Influence of weather and sea state (I5)’. When accidents occur in maritime transport, priority can be given to checking whether these events occur, so as to save time and cost.
5. Suggestions and Discussion
Based on the diagnosis of maritime transport risks on the China–Australia route, this paper puts forward suggestions and measures to reduce risks by reducing the probability of events with high posterior probability in
Table 7.
As shown in
Table 7, when accidents occur in LNG maritime transport, the posterior probability ranking of the top six basic events is significantly higher than others. To mitigate the risks associated with these events, the following suggestions and measures are proposed. From the perspective of risk control, these six events are divided into two categories for consideration: preventable and uncontrollable. Among them, the posterior probability ranking first and third are ‘The impact of epidemic (X
22)’ and ‘Piracy and terrorist attacks (X
21)’, which are considered as preventable events due to their low probability of failure. In response to the impact of the epidemic, shipping companies are predominantly affected, so it is crucial to establish a response mechanism for epidemic prevention and control for them; for piracy and terrorist attacks, the country should strengthen its domestic naval capacity building for defense. The rest are uncontrollable risks. The fourth-ranked event is ‘Fewer LNG unloading ports (X
14)’, and as this situation cannot be improved in a short period of time, the establishment of alternative route mechanisms at ports can alleviate this impact to some extent. Finally, the second, fifth, and sixth-ranked events, namely ‘Heavy fog (X
10)’, ‘High frequency of strong winds (X
13)’, and ‘High waves (X
9)’ can be summarized as the intermediate event ‘Influence of weather and sea state (I
5)’. Given the unchangeable nature of these objective conditions, the only viable approach is to avoid LNG loading and unloading operations during adverse weather conditions.
The following are specific further discussions based on the above suggestions. For shipping enterprises, they should establish epidemic prevention and control response mechanisms. The outbreak of the global COVID-19 pandemic has increased the risk of shipping routes due to port suspensions in some relevant countries. To prevent similar situations from causing greater risks in the future, shipping enterprises should take targeted actions. For example, they should formulate comprehensive and feasible emergency plans for epidemic prevention and control under the leadership and guidance of the national government. This would help establish and improve relevant emergency response mechanisms to reduce the harm caused by public health emergencies at sea and prevent the spread of the epidemic [
34]. Furthermore, strengthening the marine defense line for epidemic prevention and control is essential. Only by maintaining the normal order of maritime activities on the China–Australia route, and reducing the risk of the route, can we promote the recovery and normalization of shipping. Thus, it is crucial to take proactive measures to ensure the safety and security of shipping activities in the face of similar global accidents.
For the country, it is necessary to strengthen the capacity building of the domestic navy. The waters surrounding the South China Sea, Indonesia, and the Philippines are known for their high levels of pirate attacks and maritime terrorism, which create multiple uncertainties for shipping routes in the region. Therefore, it is crucial to enhance the construction of the domestic navy to improve route security. Specifically, China should focus on improving the navy’s long-distance combat capability and defense capability, as well as enhancing the protection mechanism for LNG ships. Additionally, the ability to patrol dangerous waters and monitor the marine environment must be strengthened, and a well-established emergency plan system for piracy and terrorist attacks must be put in place. Increasing the frequency of naval convoys on the China–Australia route and cracking down on piracy are also important measures to consider.
For ports, a route substitution mechanism could be established to address the challenges posed by the restrictions of many islands, such as the Indonesian archipelago and the South Pacific islands, and the different passing capacities of key nodes, such as the Straits. Alternative routes should be actively sought to reduce the threat of emergencies to route safety. In the face of security threats, the route substitution mechanism could be implemented to reduce losses caused by port blockade and ensure the safety of the route.
Furthermore, loading and unloading operations should be avoided as far as possible during bad weather conditions. If environmental factors such as bad weather, strong winds, or waves affect the loading and unloading operation, it should be stopped immediately, and the corresponding connecting equipment should be disconnected to ensure the safety of the ship and the wharf.
6. Conclusions
The main contribution of this paper is to build a fault tree analysis and Bayesian network model for the risk assessment of LNG maritime transport on the China–Australia routes. The proposed model combines the two methods to overcome the problem that conditional probabilities in the Bayesian network find difficult to determine. Specifically, due to the complexity of the maritime scenario, it is inappropriate for analysis to attribute accidents to a single cause or a few causes. This paper constructs accident causation networks from various perspectives of cargo, ships, route, and environment. The fault tree is established by investigating relevant literature and accident investigation reports, and expert opinions and fuzzy set are used to derive the prior probability, the fault tree is transformed into Bayesian network, and the conditional probability table in the Bayesian network is obtained through a relationship gate in fault tree analysis. From further analysis, the key influencing factors and sensitive factors can also be identified in this developed model.
In conclusion, the China–Australia route is an important maritime transport route for the trade activities between China and the Oceania region. However, the route is subject to multiple uncertainties, including piracy, terrorism, epidemic, port restrictions, and inclement weather conditions. These uncertainties pose significant risks to the safety of maritime transport activities and may result in economic losses and environmental damages. To reduce the risks and ensure the safety of maritime transport activities on this route, various measures should be taken, such as strengthening the construction of the domestic navy, establishing safety early warning systems for LNG storage and transportation, setting up appropriate meteorological monitoring departments, and avoiding LNG loading and unloading operations in bad weather conditions. By implementing these measures, we can promote the recovery and normalization of shipping on the China–Australia route and facilitate economic and trade cooperation between China and the Oceania region.
This paper analyzed the effect of risk factors from a systematic perspective based on real-world accidents. Although this paper takes LNG and the China–Australia route as an example, the proposed model can also be applied to other route to predict the probability of maritime accidents if the proposed route data have similar characteristics. Moreover, quantitative information assessed by experts due to limited data may be a biased representation of the exact real-world situation. Therefore, future work can model and analyze large amounts of data to provide additional and practical insights into enhancing marine safety.


