Article

Enhancement of Cruise Boat Resilience to Strong Convective Gusts with Global Model Cumulus Variable Prediction

1
Navigation College, Dalian Maritime University, Dalian 116026, China
2
Navigation College, Jimei University, Xiamen 361021, China
3
School of Earth and Atmospheric Sciences, Georgia Institute of Technology, Atlanta, GA 30332, USA
*
Author to whom correspondence should be addressed.
J. Mar. Sci. Eng. 2023, 11(8), 1588; https://doi.org/10.3390/jmse11081588
Submission received: 23 June 2023 / Revised: 22 July 2023 / Accepted: 24 July 2023 / Published: 13 August 2023
(This article belongs to the Special Issue Application of Advanced Technologies in Maritime Safety)

Abstract

:
Ship pilots and maritime safety administration have an urgent need for more accurate and earlier warnings for strong wind gusts. This study firstly investigated the “Oriental Star” cruise ship capsizing event in 2015, one of the deadliest shipwreck events in recent years, and explored all related hydro-meteorological components in a global mesoscale model. It was found that rather than the missing signal in raw surface-wind prediction, the cumulus precipitation variable (CP) increased dramatically during the accident occurrence, which significantly corresponds to a sub-grid strong wind gust. The effective lead time could be extended from 24 h (deterministic model) to 48 h (ensemble model). This finding was then verified in another two recent deadly cruise boat accidents. The introduction of the new variable aims to improve the current maritime safeguard system in predicting sub-grid strong wind gusts for small-sized cruise boats offshore and in inland rivers. Finally, an automatic response system was developed to provide economical convection prediction via INMARSAT email communication, aiming to explore operational severe convective gust early warning and appropriate numerical mesoscale model applications.

1. Introduction

A wind gust is officially defined as a sudden and brief increase in wind speed [1] and is often characterized by being on a small spatial scale, and having rapid variation, a short duration, and more importantly, little predictability. Early warning of strong wind gusts is needed in small-sized vessel (including but not limited to skiffs, crafts, boats, and yachts) navigation [2], as in recent years, many deadly maritime accidents have been associated with strong wind gusts, especially in severe convective events. A severe convective event usually refers to a weather system less than 200 km in horizontal scale with extreme air uplift, often accompanied by sudden and rapid adverse weather, such as thunderstorms, heavy rainfall, hail, and tornadoes, as well as strong wind gusts.
The “Oriental Star” shipwreck in 2015 dramatically broke the record of both death toll and rate in a Chinese maritime accident. This inland-river cruise ship suddenly capsized under extreme heavy rainfall on the Yangtze River’s main upstream channel, claiming 442 passengers’ and crews’ lives. All 12 survivors confirmed the on-site strong winds and heavy rain, which lasted 1–2 h. After a five-month investigation, the national professional team concluded that “it’s a catastrophe caused by a sudden and rare downburst accompanied with small-scale and strong convective weather” [3]. Another cruise boat, namely, “Double Dragon”, was also overturned upstream the Yangtze River in 2016, with a death toll of 15 out of the total 18 passengers. In addition, on 5 July 2018, offshore of Phuket Island, Southern Thailand, two cruise boats capsized during a heavy storm, claiming 47 out of 102 tourists’ lives, and was marked the worst maritime disaster in Thailand. During these tragedies, sudden strong convective events were all present. Statistical analysis shows that this kind of extreme weather occurs frequently in the tropical maritime continent and at some monsoonal mid-latitudes, where the “Oriental Star” and “Double Dragon” shipwrecked. To improve strongly convective-related extreme weather forecasting skills and warning capability, scholars have made a lot of efforts but mostly focused on rainfall extremes and secondary disasters, e.g., flooding, land sliding, inundation, etc. Collier et al. [4] and Nakamura et al. [5] were among the first to point out that high winds and gusts in severe weather at mid-latitudes may be due to deep convection. Mao [6] reviewed the meteorological service during the “Oriental Star” ship capsizing event, pointing out that “the current technology can’t make accurate warnings on the local scale winds, …, it is necessary to strengthen skills”. As noted by Friederichs [7], “gusts are one of the most poorly observed atmospheric variables”; so far, the effective operational recording and warning of strong nautical wind gusts is still a challenging problem.
Multiple methods have been applied to estimate wind gusts from meteorological components. Weggel [8] and the International Maritime Organization [9] tended to directly connect wind gusts with a 10 min average wind speed (or sustained wind; WMO 1987). This is rather simple and can only work as a state-of-the-art method when no big eddy is present, i.e., it might somehow miss some small-scale but devastating convective gusts, as discussed in this paper. Nakamura et al. [5] applied eddy equations and a non-numerical cloud physics model in the Western Europe region and concluded that the gust factor (gust/mean) under deep-convection conditions is much greater and more variable than that under no-eddy conditions. At the end of this paper, it is suggested that only numerical weather prediction (NWP) combined with eddy equations should be the next research stage.
Patlakas et al. [10,11], Chen et al. [12], and Gutiérrez et al. [13] applied various regional atmosphere numerical models forced by large-scale global weather products to simulate wind gusts under complex weather conditions. However, few of the wind gust estimation research studies are in the navigation field or are accident based. As a result, no significant predictor is recommended for strong nautical wind gusts with enough lead time [14].
This work studied the convective events associated with the above cruise shipwrecks using meteorological component analysis. From a meteorological point of view, precipitation could be divided into two types, large-scale precipitation (LSP) and cumulus precipitation (CP). The former is generally introduced by the steady uplift of warm air mass, e.g., slow-moving warm fronts with little chance of strong wind gusts (Figure 1a), but the latter develops and intensifies when the lower atmosphere level is quite unstable, e.g., in squall lines or fast-moving cold fronts (Figure 1b–d), possibly with strong wind gusts.
The total precipitation is commonly applied because, in practice, it is hard to discriminate convective and non-convective precipitation from the surface rain-gauge-based reading. However, in specific Numerical Weather Prediction (NWP) models, these two rainfall components were calculated, delivered, and stored separately. In dynamic meteorology theory, CP is a much more suitable representative for the intensity of convective weather. For the crew, any precipitation will result directly in limited visibility, which affects the navigation of the vessel. However, due to the poor anti-wind ability of cruise boats, strong wind gusts might be a much greater threat than navigation visibility. The reason is that nowadays, the conventional cabin has evolved from a dormitory-style canopy bed to an independent window-viewing bedroom, in order to meet the demands of the passengers’ private space and sightseeing. For example, during two renovations in 1997 and 2008, the shipyard enlarged the “Oriental Star” space, lifted the center of gravity, and reduced the wind pressure stability criterion numeral from 1.36 to 1.02, i.e., worsen the ship’s anti-wind ability [3]. The wind gusts have the characteristics of sudden intensification; large, instantaneous maximum wind speed; and great mutability directions. When the wind pressure tilting moment is greater than the minimum overturning moment, the ship would capsize due to water inflow [15]. This situation is particularly dangerous for inland and offshore cruise boats.
Although the concomitant relationship between short-term torrential precipitation and strong wind gusts under deep-convective weather has been confirmed both by observations and in fine-grid (resolution < 5 km) model [13], it is very difficult to apply the latter to provide operational early warning service because in most cases, the precipitation and strong wind gusts occur simultaneously. The fine-grid regional model needs the output of large-scale global weather products as initial forcing, which is time-consuming and disabled for operational warning. A hypothesis was raised by Jian et al. [16] that it is possible to invert the intensity of severe convective events by watching the CP variance in numerical weather products, thus indirectly leading to strong wind gust warnings for small-sized vessels, especially cruise boats. This work looks at the possibility that the global numerical product itself can act as an efficient tool to retrieve adverse convective events, though the events’ spatial scales are much smaller than the model’s grid distance (also called sub-grid), which are usually considered lacking in simulation capabilities.
This paper was organized as follows: Section 2 lists the data source and format; Section 3 discusses the weather components’ space-time performance during the “Oriental Star” shipwreck; Section 4 verifies the findings in Section 3 for two other cruise boat wrecks; Section 5 introduces an automatic gust warning system developed for marine application; and Section 6 draws the conclusion.

2. Data

2.1. Numerical Weather Prediction Product

Numerical Weather Prediction (NWP) product is a powerful tool, applying hydrodynamics, thermodynamics, and other equations to describe the weather evolution process initialized from certain boundary conditions of the atmosphere, and predicting the atmospheric motion state in a certain period in the future.
The NWP product used in this work is the global deterministic (0.5° × 0.5°, single member) and ensemble (1° × 1°, 51 members including one control) numerical mesoscale-weather prediction product from European Centre for Medium-Range Weather Forecasts (ECMWF) with a time step of 6 h and lead time of up to 240 h [17]. It is running under TL639 spectral truncation (horizontal resolution ~32 km) with 62 vertical levels for up to ten days long. The product contains a variety weather variables from the surface to upper atmosphere with a total of 33 variables, of which 2 are directly related to surface wind: 10 m zonal wind (10 U) and meridional wind (10 V). The core weather variables are listed in Table 1 below. Some of the variables changed dramatically when the “Oriental Star” capsized. The fifth column of Table 1 lists the variables’ behaviors during the shipwreck time. The detail discussion is in Section 3.2.

2.2. Ship AIS Data

The Automatic Identification System (AIS) is a widely applied monitoring and communication system used to automatically broadcast and receive ship dynamic, static, voyage, and safety information to realize ship identification. In regard to the “Oriental Star” accident case, AIS information of the accident is applied to analyze the causal relationship between typical accidents and weather.

2.3. CMORPH Satellite Precipitation Data

CMORPH (CPC morphing technique) was originally a technique created and developed by the United States National Oceanic and Atmospheric Administration (NOAA) to produce global high-altitude and spatial resolution precipitation products [18]. Nowadays CMORPH mostly refers to the precipitation data processed by this technology, which is based on low-orbit satellite observation, combined with multi-platform satellite microwave sensor, and then integrated by interpolation processing.
CMORPH has a variety of precipitation products that can be freely downloaded from the NOAA server at http://ftp.cpc.ncep.noaa.gov/precip/CMORPH_V0.x/RAW/ (accessed on 5 August 2023). The product has a time resolution of 3 h and a spatial resolution of 0.25° × 0.25°, covering the area within 60 degrees of the global north and south latitude.

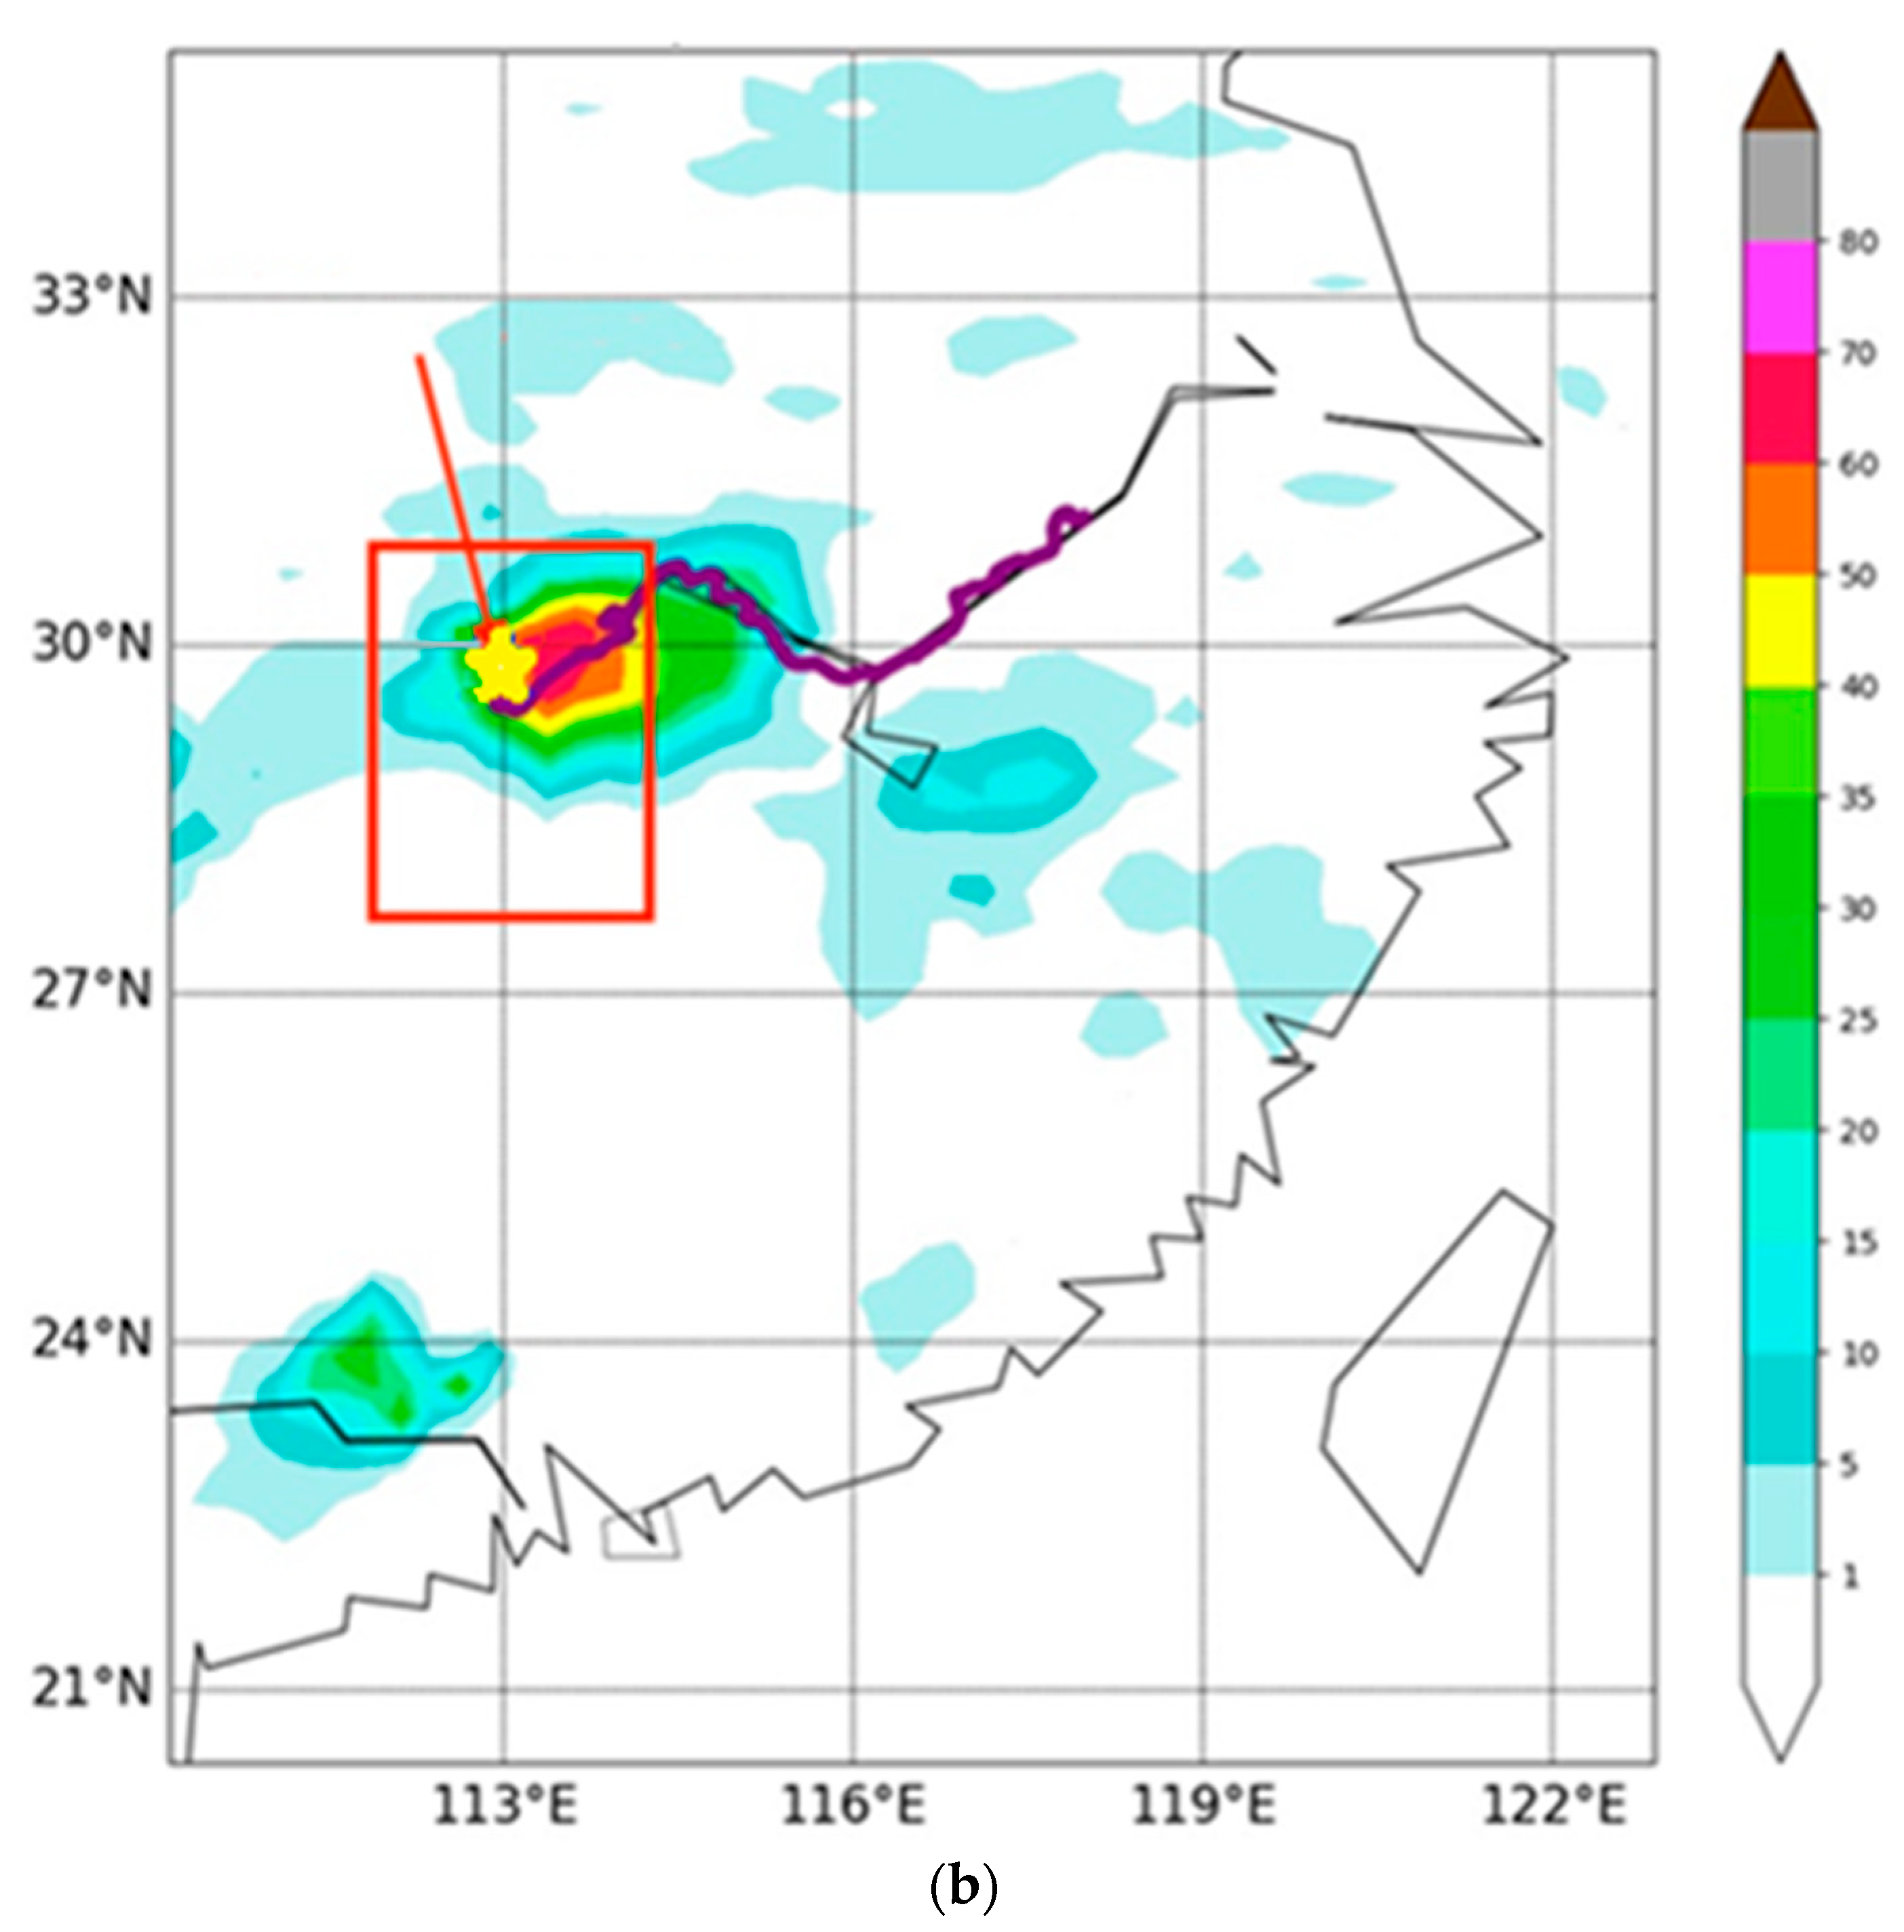
3. Weather Component Analysis during the “Oriental Star” Accident

3.1. Purpose

For ship navigators, if they can receive early warning signals of wind gusts that may occur in sight, they can make effective accident-avoidance activity. In the “Oriental Star” case, this preventive activity could be anchoring, like other nearby vessels did. The national investigation report [3] blamed the ship captain for “ignoring the possibility that severe weather may occur”, which is somewhat true because no other ship in the same channel, regardless if they were big- or small-sized, sank that night. So far, no persuasive point was given as to why the captain kept this cruise ship, which was fully loaded with over 400 passengers, moving forward through the extreme heavy rain, but clearly, he would not do so if given enough warning in advance. It can be seen that short-term wind warning has certain practical significance in boat safety navigation. Regarding the strong wind gust warning, there are three points that need to be raised before further discussion:
  • Dynamic meteorology tells us the more convective the cell is, the more possible it is that we see an accompanying strong surface wind. But strong surface wind gusts and local heavy rains are not 100% present. This paper only discusses the possibility of the warning of strong surface wind gusts associated with a “deep-convective event”. In other words, the probability exists that the findings may not fully warn of short-term convective gusts each time, but regardless, our purpose is to avoid deadly cruise boat capsizes.
  • The space-time scale of the short-term strong wind gust’s actual activity range is much smaller than the resolution of the conventional weather model. Therefore, the direct forecast of a sub-grid short-term strong wind is often ineffective in terms of advancement and accuracy. The focus of this paper is to solve this problem from the perspective of indirect forecasting.
  • The cause for each ship accident may normally be due to, but is not limited to, just one factor. In the “Oriental Star” case, the national investigation report [3] concludes more than four possible factors, e.g., the captain’s disastrous operation, a ship renovation flaw, the lack of attention by the maritime safety administration, and an adverse weather component. But this work only discusses the external non-human factor, i.e., potential weather predictor analysis.

3.2. Surface Wind Analysis

During the “Oriental Star” accident, the nearby observatory site observed a maximum 10 min average surface wind speed as high as 6.8 m/s, far below the 32–38 m/s identified in the national investigation report [3]. This large gap was not surprising for two reasons: First, it was a small-scale event with a diameter of 2–4 km. Second, as Nakamura [5] pointed out, wind gusts in deep-convective events could be as high as 2.9 times stronger than sustained wind.
How well did the numerical prediction compare with observation? Figure 2 illustrates the near-surface wind simulations 92 min in advance (Figure 2a), and 268 min after the “Oriental Star” overturning time (Figure 2b), produced from the ECMWF half-degree-resolution product. Given that the grid-based dataset would reduce the wind strength due to a smoothing effect, the fact that sustained surface wind speeds are close to minimum around the shipwreck position was surprising. So, at least in this case, real strong wind gusts introduced by deep convection cannot be simulated from raw numerical-mesoscale-model output and thus is hardly suitable for marine safety warning.

3.3. Investigate Weather Components in Deterministic Product

According to the nearby local meteorological observatory record, the on-site hourly rainfall reached 64.9 mm during UTC 1300–1400 Z on 1 June 2015, which was at a torrential rain level typically observed within 24-h period. Figure 3 presents rainfall images from various sources that were close to the “Oriental Star” accident. In the Doppler Radar image (Figure 3a), a squall line with multi-convective cells just passed the “Oriental Star” location. In the satellite infrared image from CMORPH project (Figure 3b), the accumulated 3 h precipitation map shows that overwhelming precipitation occurs at the time and place of the tragedy.
The next step was to investigate the quantitatively-predicted weather components. In the ECMWF deterministic products, the forecasted CP distribution (Figure 4a) is very similar to the observation field (Figure 3b), with the maximum value exactly located at the shipwreck position. However, this numerical forecast was initialized at UTC 1200 Z on 1 June 2015, just 90 min ahead of the accident. Due to the dynamic computation and data transition time, the analyzer was able to obtain the prediction data as early as 8 h after the model initialization time. So it was necessary to go backwards for an additional 24 h, i.e., the forecasts was initialized on 31 May UTC 1200 Z. It turned out that an area with a high CP value was observed to be adjacent to the last route of “Oriental Star” ship (Figure 4b), giving hope to the early-warning signal. In contrast, the LSP variable had a much higher value but was far away from the ship position (Figure 4c), with a minimum distance that exceeds 250 km.
Besides wind and precipitation variables, this study checked all 33 variables in the ECMWF deterministic product, but no other weather components showed high spatial-temporal connectivity with the “Oriental Star” accident (Table 1). Only air temperatures at a high level (Figure 5) are in the middle or end of an increasing trend. From a meteorological view, this trend indicates that the local air mass was uprising during that day, however this provides very limited information. Due to the superiority of the CP variable, in the remaining sections, it will be referred to as a predictor.

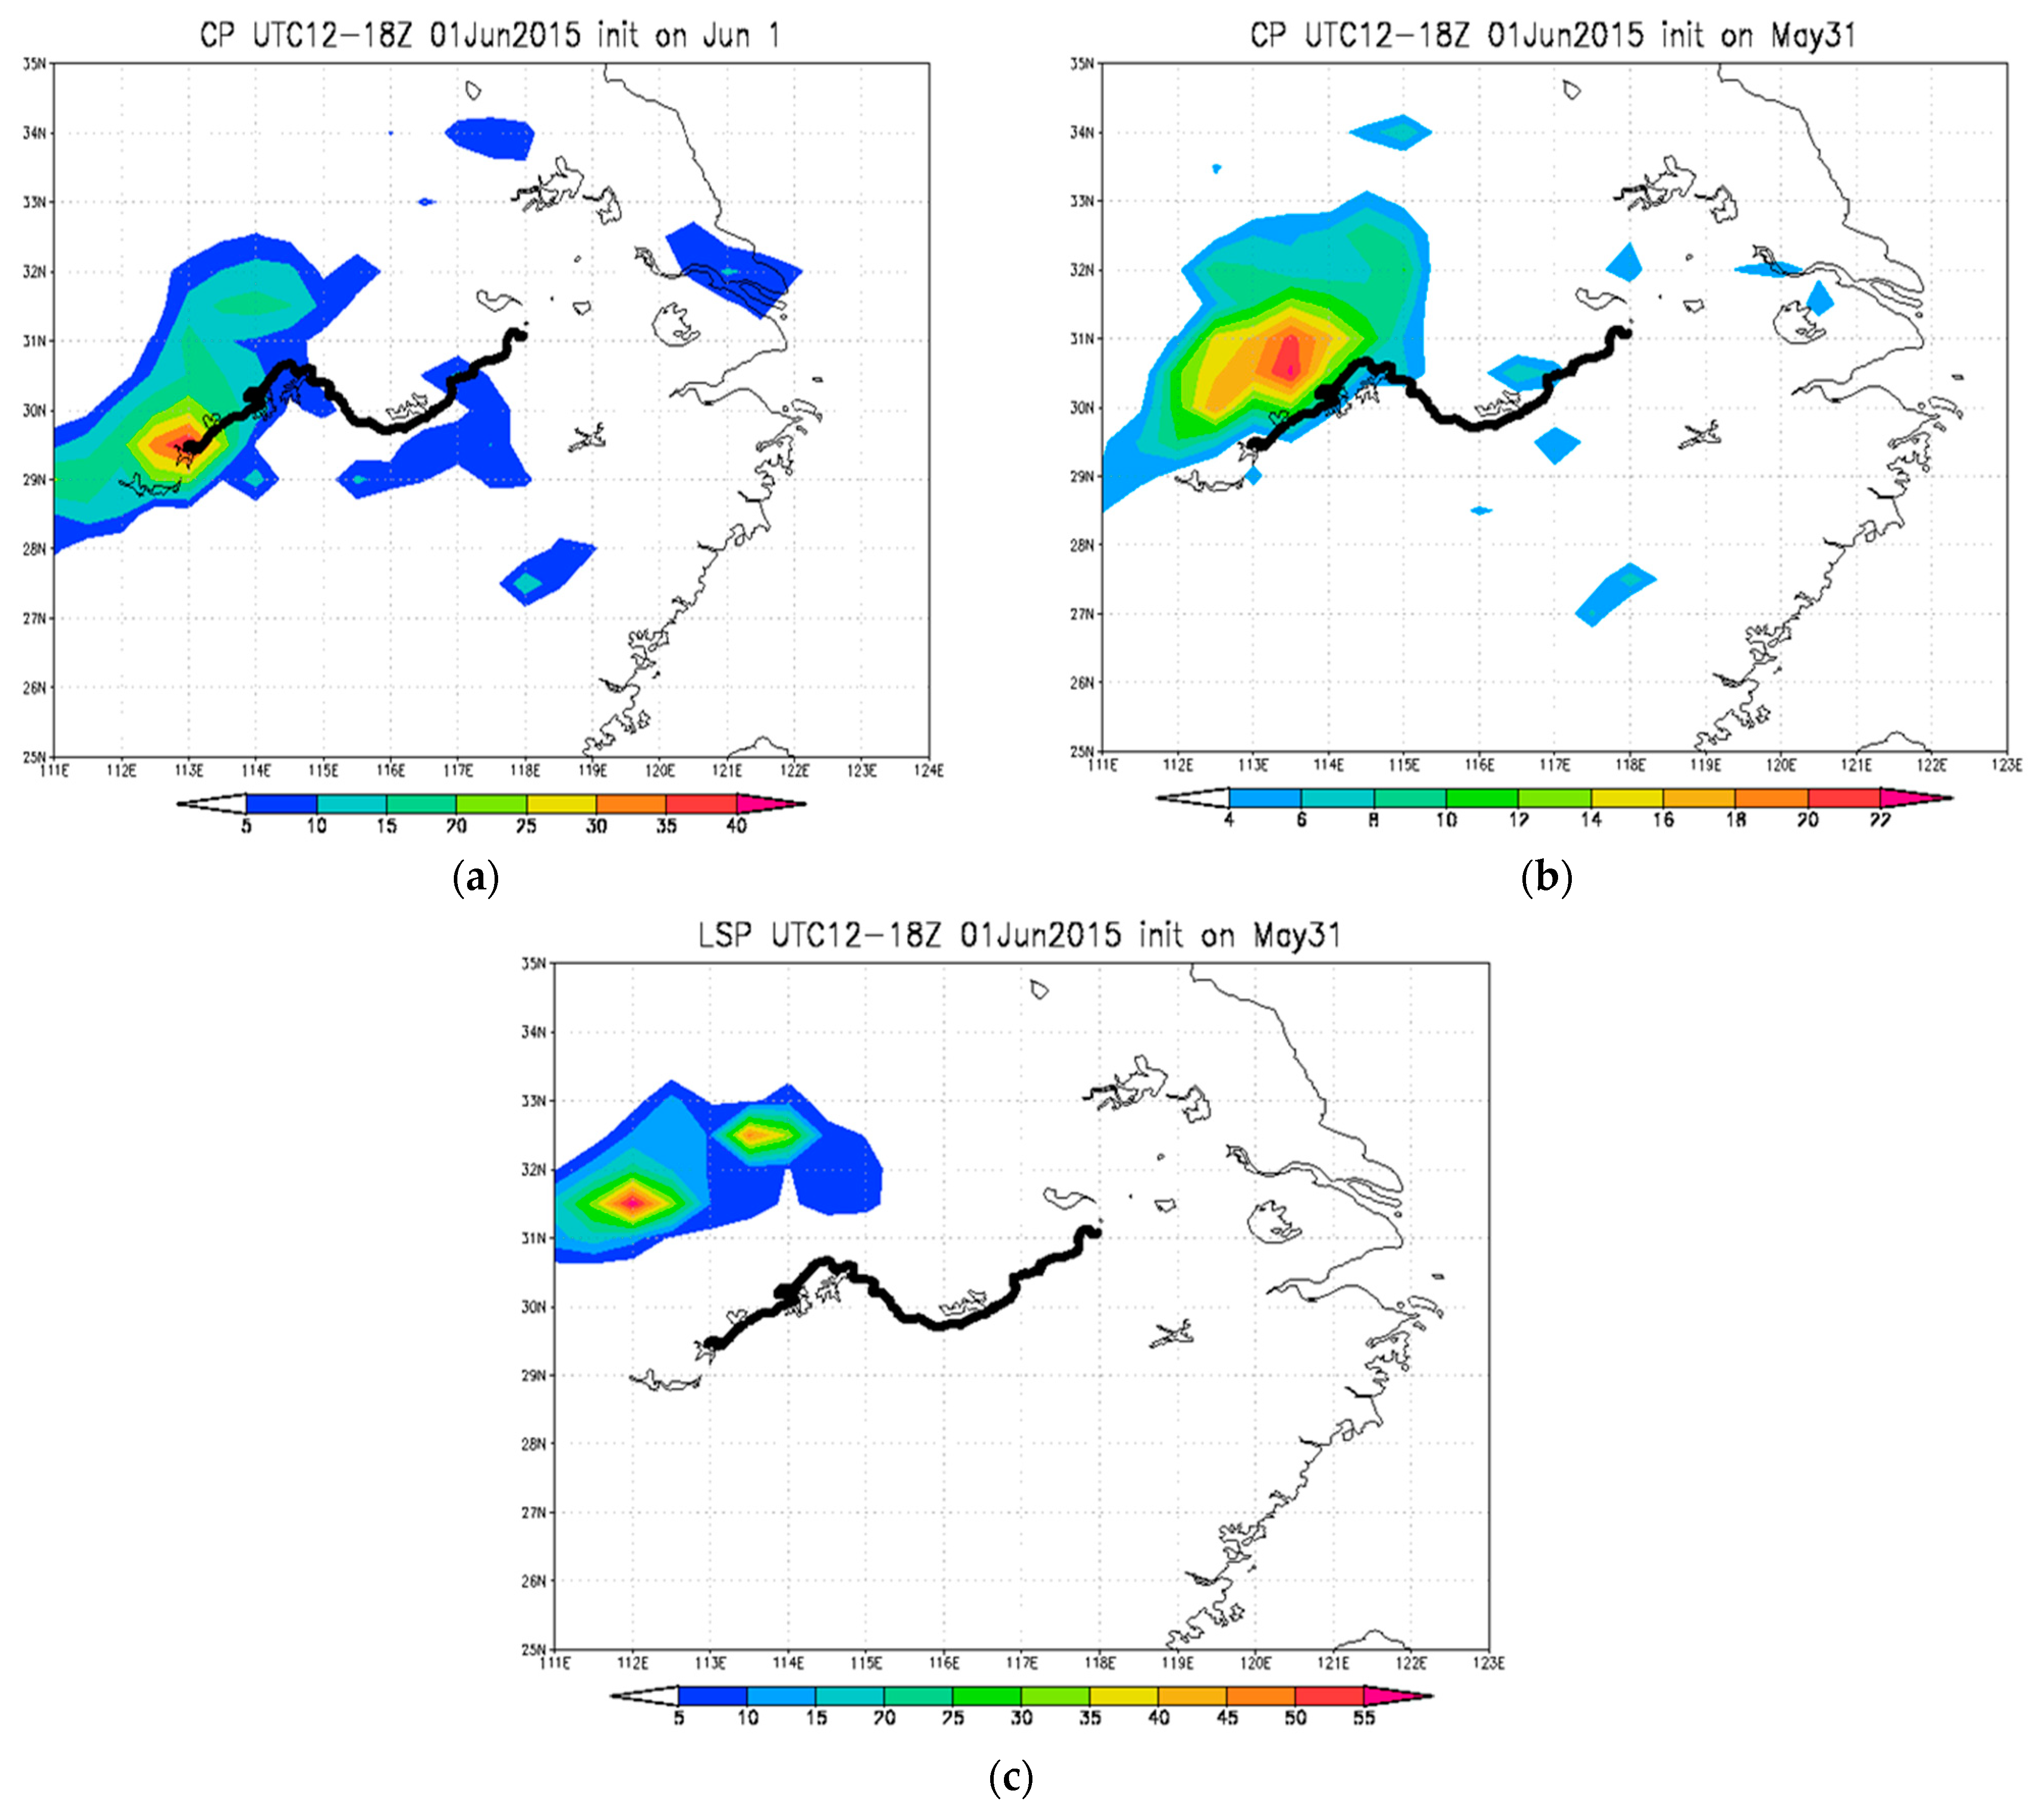
3.4. Predicted CP Following “Oriental Star” Last Route

In the “Oriental Star” case, the sliding moving average and a specific Kriging algorithm were adopted to interpolate the weather components at specific ship positions based on AIS data with a 10-min time interval. Kriging Method Optimization [19], known for its good performance and used for optimal, 3D space relation, linear, and unbiased purposes, was finally chosen after comparison to two other traditional interpolation algorithms. For the position of the ship corresponding to each time interval, the forecast data of the ECMWF numerical product with a lead of 24–36 h, 48–60 h, and 72–84 h are obtained by the space-time interpolation method. The formula is defined as follows:
z ~ 0 = i = 1 n λ i z i
γ ( h ) = 1 2 n i = 1 n ( z ( x i ) z ( x i + h ) ) 2
c ( h ) = E z ( x ) z ( x + h ) m 2
where z ~ 0 is the estimated value at the point ( x 0 , y 0 ) , and λ i is the weight coefficient, indicating the contribution of the observation value at each sample space point to the estimated value. The weight coefficient must satisfy the condition that the estimated value must be unbiased and optimal. γ ( h ) is also called the variogram and is a measure of the degree of spatial correlation between points. c ( h ) is the covariance function in the region, and m is the mean. The solving process is skipped here, and finally, it is simplified by the Lagrangian multiplier method:
j = 1 n λ i c ( x i , x j ) μ = c ( x i , x ) i = 1 n λ i = 1
Among them c ( x i , y j ) is the covariance, and μ is the coefficient in the Lagrangian multiplier method. The above formula can also be expressed in matrix form:
c 11 c 12 c 1 n 1 c 21 c 22 c 2 n 1 c n 1 c n 2 c n n 1 1 1 1 0 λ 1 λ 2 λ n μ = c ( x 1 , x ) c ( x 2 , x ) c ( x n , x ) 1
Therefore, λ i can be solved by matrix inversion, and c ( x i , x ) is obtained by γ ( h ) fitting the function γ ( h ) = c ( 0 ) c ( h ) .
With the above algorithm, different quantities of rainfall that the “Oriental Star” would have expected to receive per 15 min were calculated in Figure 6. The ship experienced an ordinary rainfall process shortly after its departure at UTC 1600 Z on 28 May, and both the CP and LSP predicted this weather process. After then, no rain was present until in the mid-day of 1 June. Among all the variables, only the CP at a one-day lead time showed a dramatic increase and decrease trend. These rapid variations closely corresponded with the on-site severe downburst and wind gusts that caused the ship to capsize. Although they correspond to 90 min earlier than the actual accident time, it is still remarkable considering its lead time. In contrast, CP predictions at other lead times and all LSP predictions on the ship’s last time are almost negligible; this agreed with the horizontal fields in Figure 4. Therefore, it is suggested that the one-day-lead CP prediction before the “Oriental Star” shipwreck has a great potential as a strong wind gust early warning, which is missing in the LSP variable.

3.5. Extended Study: Ensemble Forecast

As one of the renowned forecasting institutes, ECMWF developed its Ensemble Prediction System (EPS) in 1992, consisting of a global atmospheric general circulation model, a data assimilation system, a land surface model, an ocean wave model, and an ensemble forecasting system. In contrast to the deterministic product, which provides only one dynamic model result per grid point, the ECMWF EPS produces multiple outcomes per grid point. Forecasts such as these are designed to provide a measure of forecast uncertainty and probability, from which alternative scenarios and strategies can be developed. The ECMWF EPS generates a total of 51 forecasts (ensemble members), which are used to represent the initial analysis error (by perturbing the initial analysis) and model error (by using stochastic processes to represent the errors in the model’s physics framework). The probability of occurrence of an event (e.g., rainfall above or below some threshold) can be characterized by the number of ensemble members predicting the event divided by the total number of members [20,21].
Since its first distribution, ensemble forecast has been a powerful method to minimize uncertainty and systematic bias and was applied frequently in multi-weather-related hazard early warning, e.g., flooding [22], agriculture [23]; and typhoon [24]. In marine navigation, Skoglund et al. [25] compared deterministic and ensemble results and concluded that route optimization using the latter has the potential to reduce the risk of late arrival for voyages under adverse weather.
This section examined the CP performance in the ECMWF EPS product. In Figure 7a, most ensemble members of the regional average (defined in the blue rectangle in Figure 7b) CP time series showed a sudden increase during the accident period. Noting that members with high values perform better, we chose the average CP prediction of the highest one-tenth of all 51 ensemble members to draw the horizontal distribution (Figure 7b). It was observed that the maximum CP value was much closer to the final route of the “Oriental Star” ship. Figure 7c indicates that in the ensemble run, the CP’s warning effect can extend from a 24 h lead to a 48 h lead, but more cases should be considered.

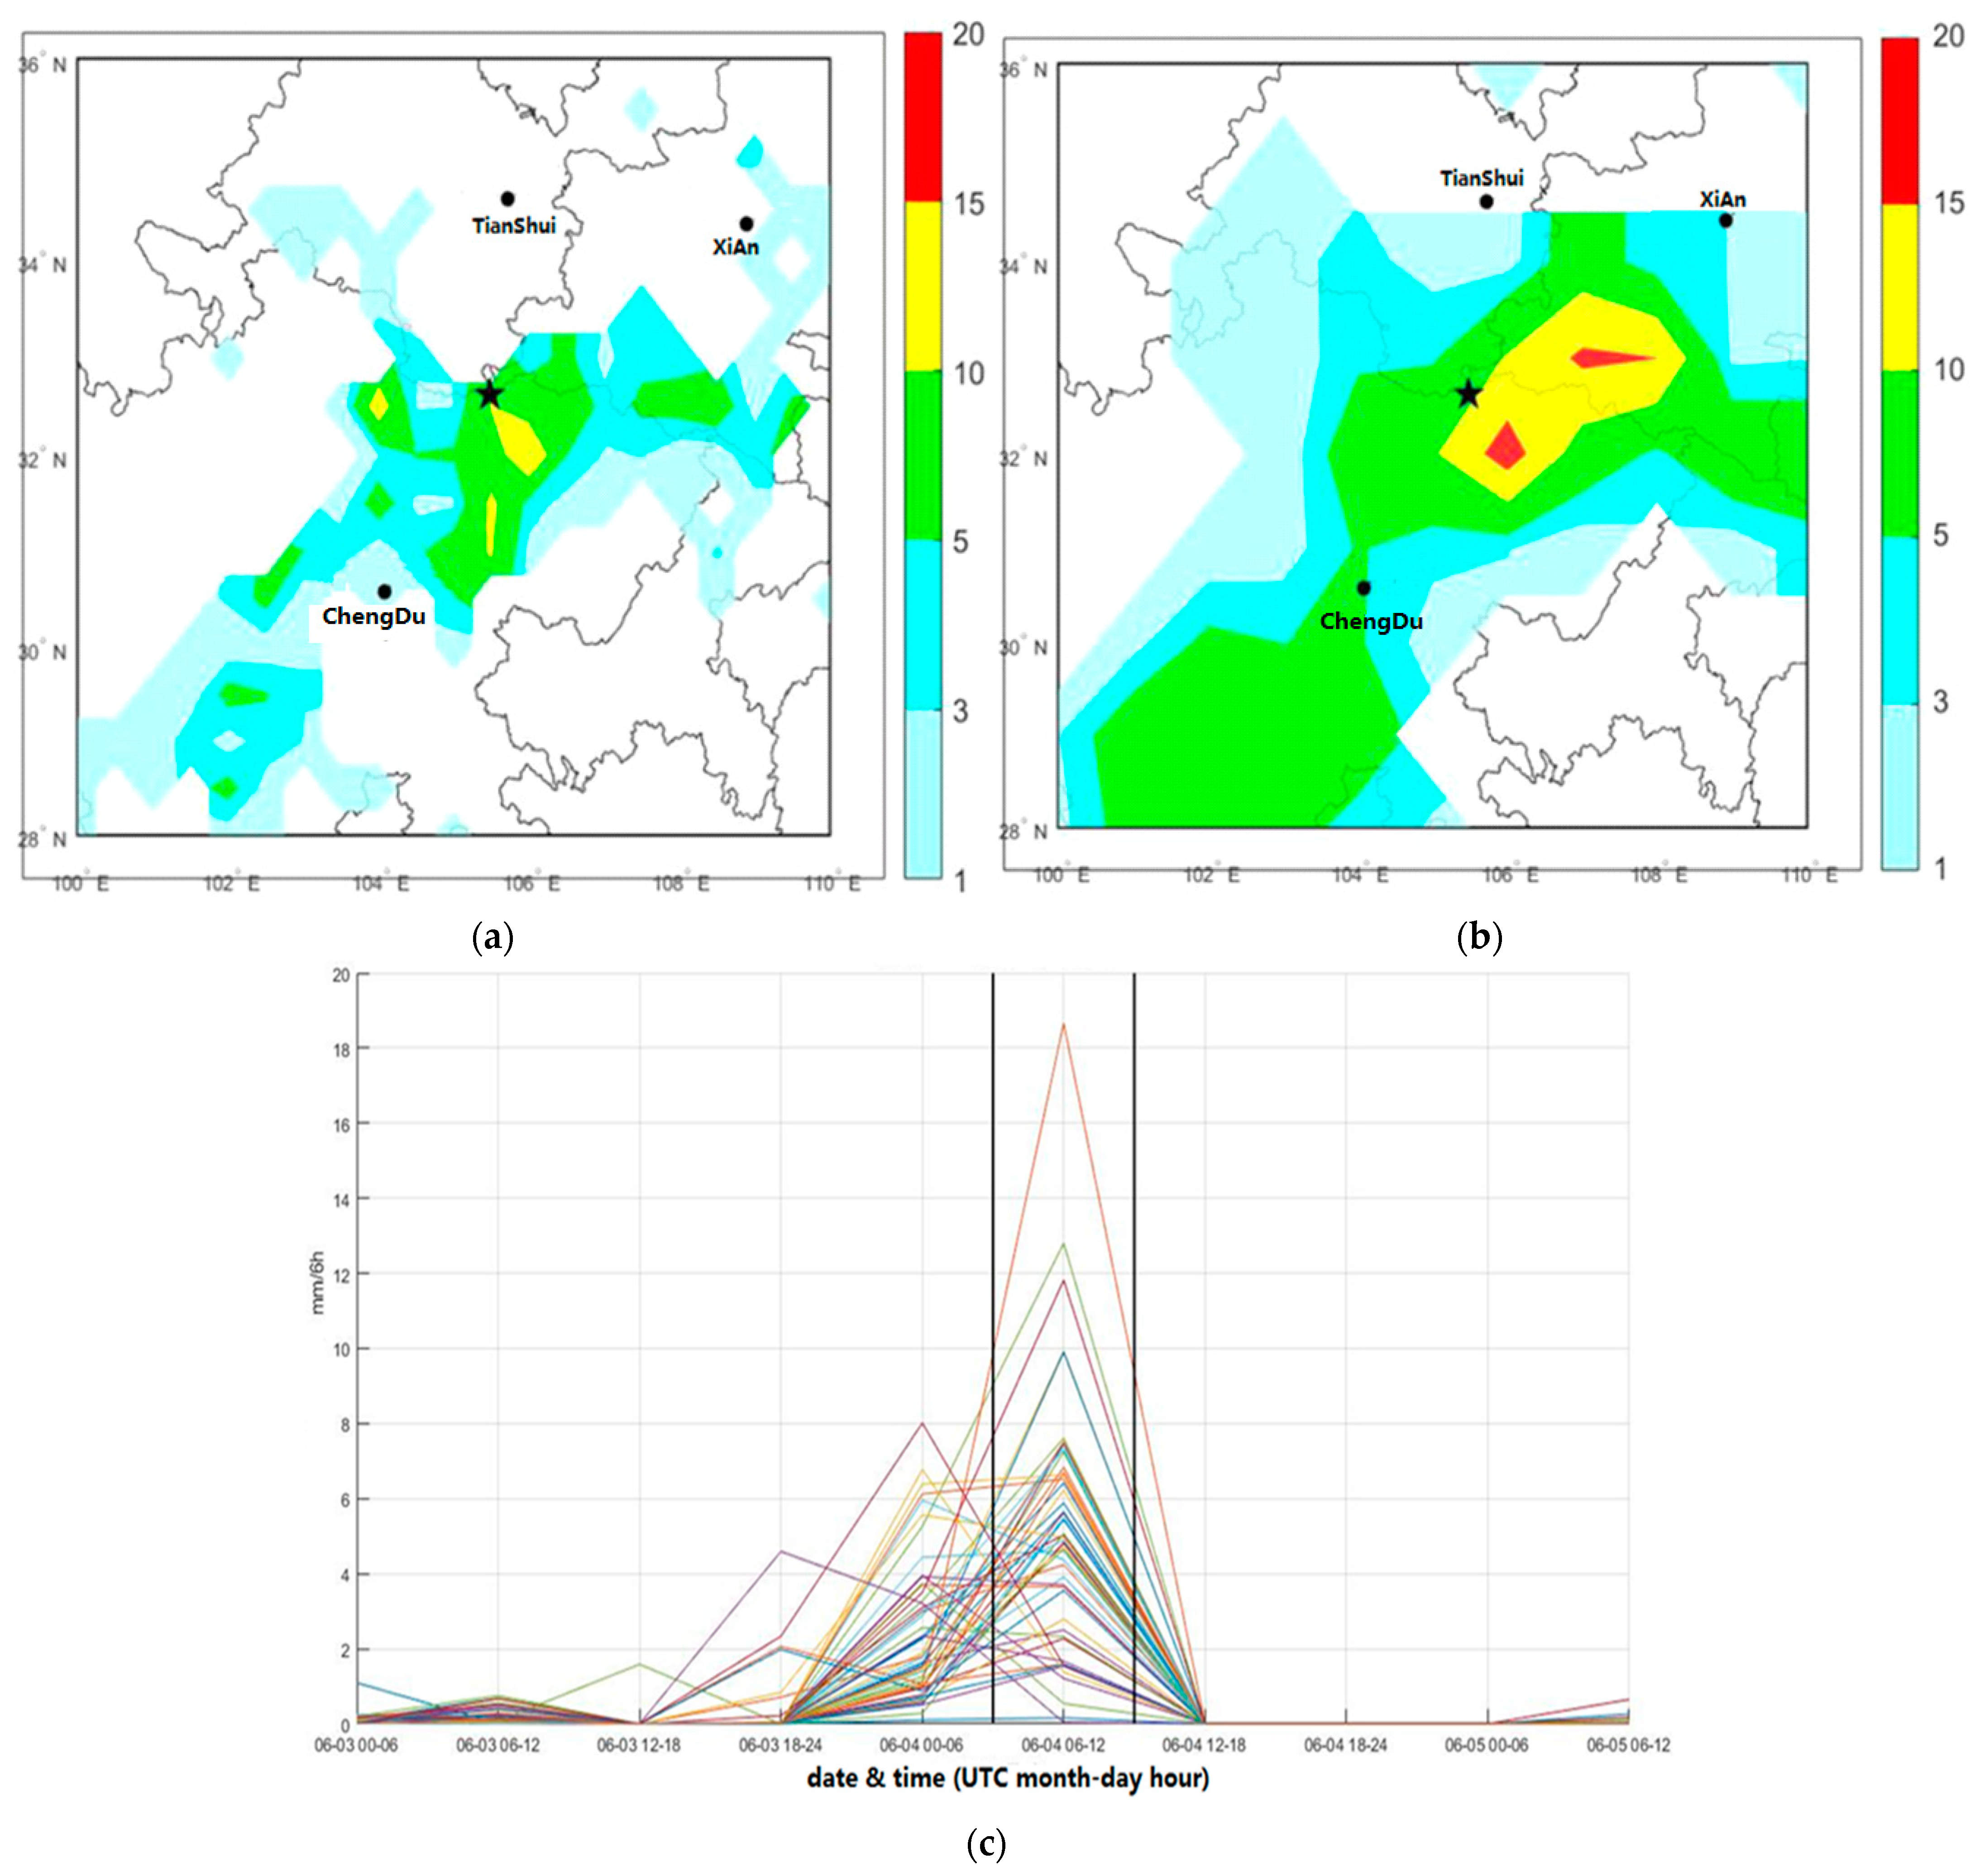
4. CP Warning Effect Verification in Another Two Similar Accidents

To confirm the findings in Section 3, another two cruise-boat capsizing accidents, also possibly due to the strong convective wind gusts, were investigated; however, ship-based AIS data were unavailable. In both cases, it was confirmed that in the ECMWF product, the nearest wind speeds at the shipwreck locations were both less than 8 m/s (force 5 wind on the Beaufort Scale), far from the actual situation.
In local time 1440 Z (UTC 0640Z), on 4 June 2016, a small cruise boat (only 13 tonnage), the “Double Dragon”, capsized in the middle of a resort lake upstream of the Yangtze River during a sudden convective rainstorm. The nearby meteorological station observed that before and after the incident, the local area was heavily affected by a multicell convective storm cluster weather system moving from northwest to southeast, combined with other severe convective disastrous weather and the impact of complex terrain, resulting in a strong local character of short-term gusty winds. The wind speed rapidly increases over a short period of time, with a maximum instantaneous wind speed of 33.5 m/s (force 12 wind on the Beaufort Scale). According to meteorological data, lightning, short-term heavy rainfall, and sudden temperature drops occurred in the vicinity of Bailong Lake at the time of the incident, all of which are typical characteristics of strong convective events [26].
In the “Double Dragon” cruise boat accident, similar to the discussion in Section 3, the CP variable predicted at a 24 h lead time shows great potential to become an early-warning factor in the ECMWF deterministic forecast (Figure 8a) and ensemble forecast (Figure 8b,c), i.e., the horizontal and temporal distribution of the maximum CP value is observed to be very close the value at the time of the accident. In contrast, the LSP value is almost negligible before and after the accident.
On 5 July 2018 at 17:45 local time (UTC 1045Z), the “Phoenix” and “Princess Aisha” cruise ships carrying 101 and 42 people, respectively, capsized and sank in a severe storm near Phuket Island in southern Thailand. Due to proper rescue efforts, all the tourists on the “Princess Aisha” cruise ship were rescued, but 47 Chinese tourists on the “Phoenix” unfortunately died.
In this accident, the 24 h lead CP prediction (Figure 9) also showed a corresponding sudden increase at the moment. However, whether this trend can be applied as an early warning factor is open to question. The main reason is due to the fact that convection is the common tropical weather type, and the accident was during the rainy season, which is when cumulus rain is almost routine. It can be seen that the CP value on the day of the accident was greater than the previous day but less than the next (Figure 9). In addition, numerical weather simulation usually applies different cumulus physics and parameterization schemes in the tropics from those in the extratropical region. Moreover, the “Phoenix” boat’s design and operation was both found to be partially unqualified and led to the disaster [27]. Therefore, the warning factor discovery in other regions cannot be directly transplanted into a tropical area, as the applicable warning factor in the tropics for short-term high wind needs further study. Given the ECMWF deterministic product grid resolution (0.5 × 0.5 degree), we could suggest that a sudden predicted CP increment of over 20 mm from nearly zero should be taken with caution but still seriously under the background of a negligible LSP value.
Since this article is focused on studying strong wind gust warning potential through an indirect method, there are many questions that remain unsolved. For example, when the magnitude of the CP changes significantly, does it necessarily indicate that short-term high winds will occur at a specific time, or will they occur sometime before or after, that is, the exact time of the short-term high winds occurrence is not analyzed. Another unclear problem is if a shorter CP duration could indicate the intensity of short-term strong winds. In a future work, our group would try to increase the forecast lead time and develop algorithms to correct the data of a 48 h and 72 h lead, thus striving to issue proper early warnings accordingly.

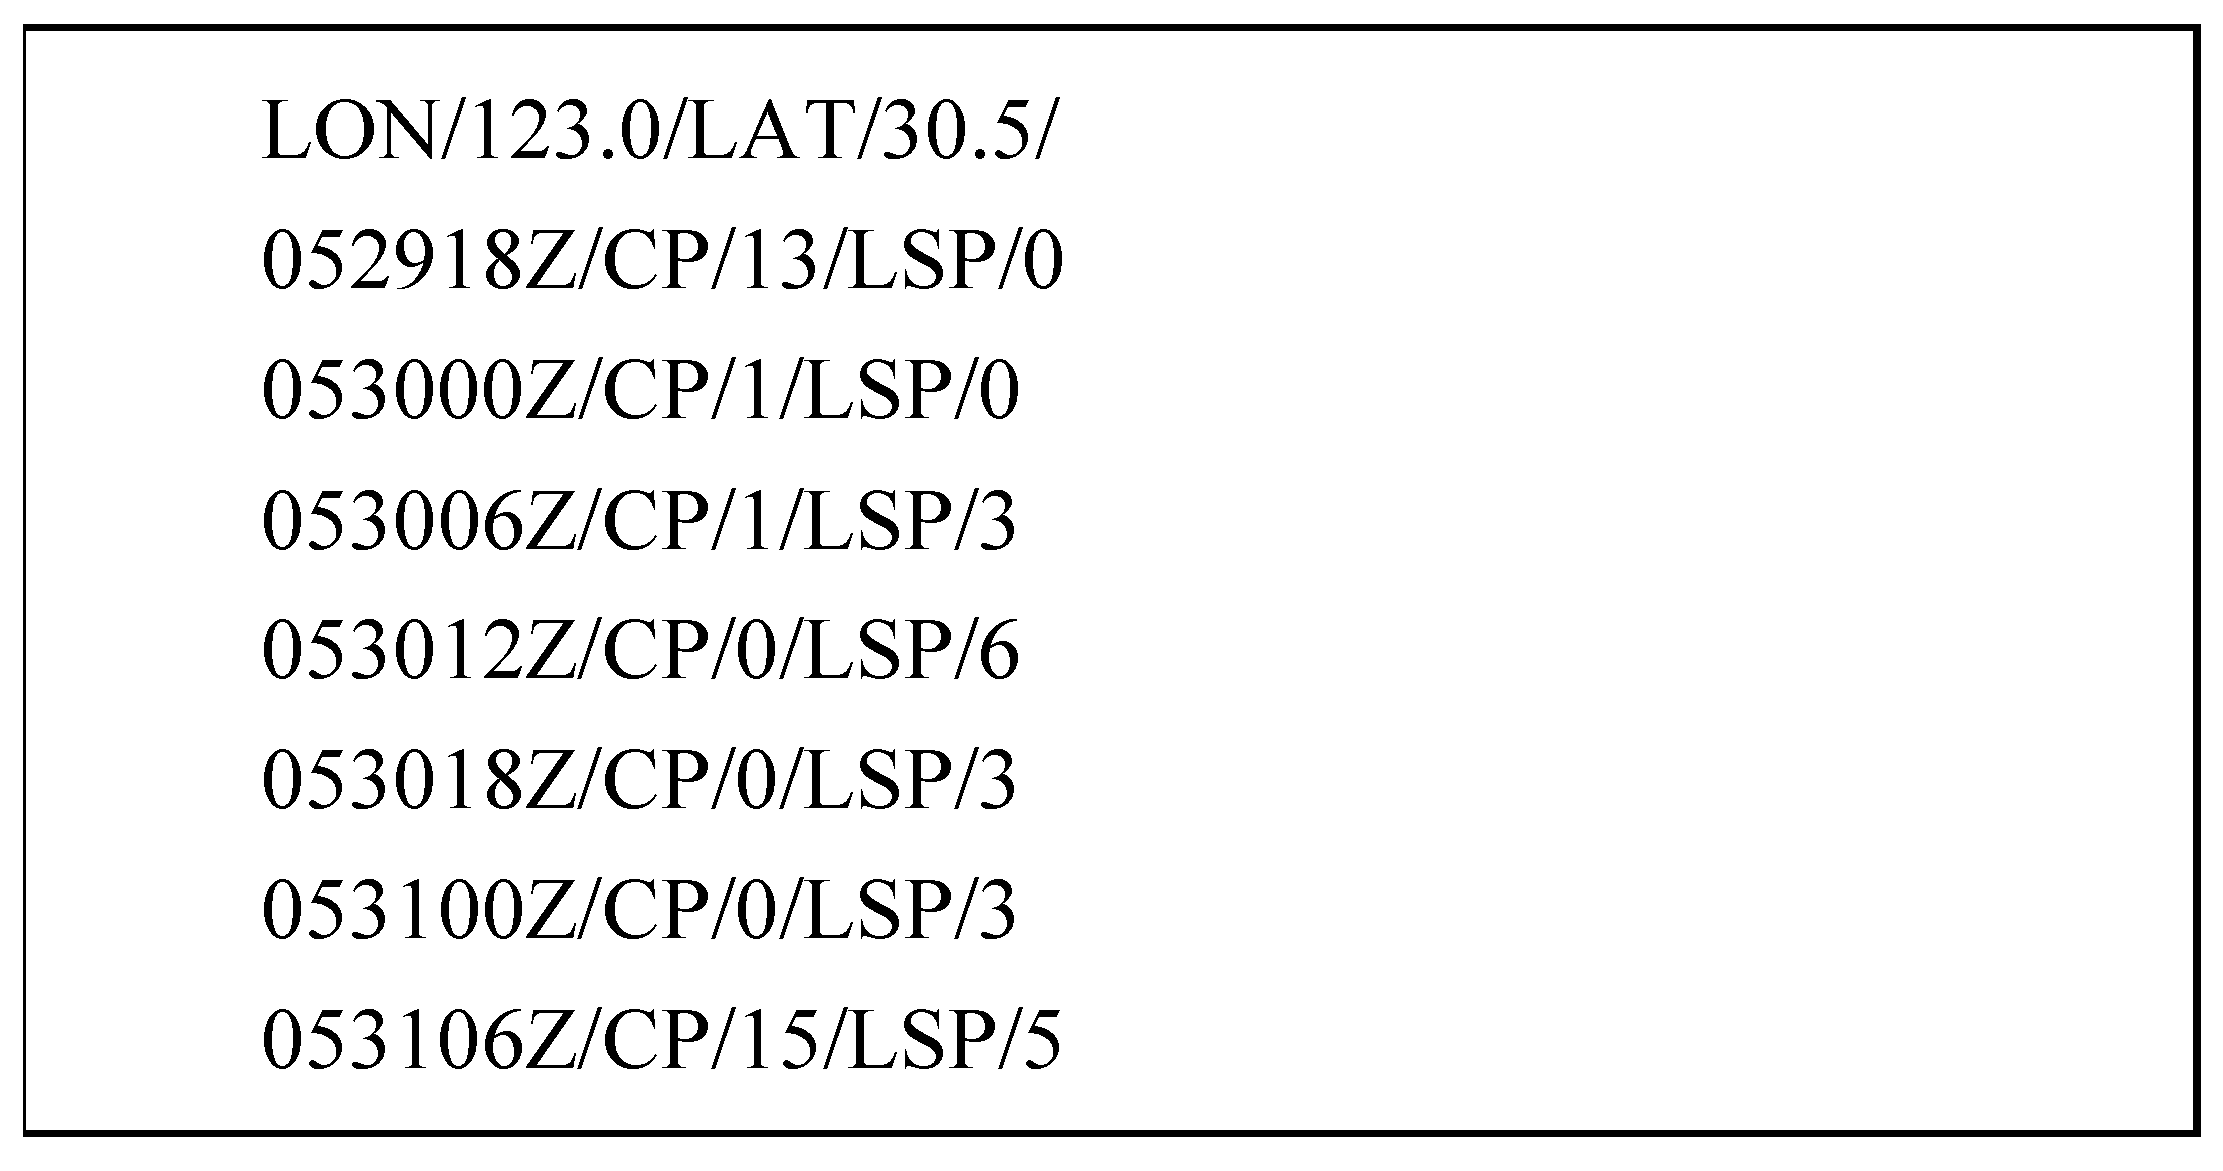
5. Development of an Auto-Response Early-Warning System

5.1. Purpose of the Warning System

As discussed above, in recent years, cruise-boat-related accidents caused by strong wind gusts have claimed heavy casualties and assets losses in Eastern and Southeastern Asia. This is not in contradiction with the increasing trend of summer daily peak wind gusts over the last 50 years under a warmer surface atmosphere [28].
The robustness of vessels against strong winds/waves varies greatly with a lot of factors, including tonnage, size, age, carrier product, structure, etc. Inland and offshore cruise boats generally have less than 1000 gross-tonnage and thus are less resistant to strong wind gusts but are also much closer to the harbor and anchorage, so the early warning service with a lead time of 2 to 48 h is highly critical and applicable. In the “Oriental Star” case, if the captain had anchored one hour in advance, then the tragedy would have highly likely been avoided because all other nearby small ships were not capsized. However, currently, commercial weather routing services, with professional and ship-oriented fame, are requested by transoceanic shipping companies and are somewhat expensive. As a result, cruise boats have very limited adverse-weather warning other than the open access information. Even for very large vessels, sudden extreme weather may also cause a large impact in a shallow channel. For example, it is arguable that at 8 am on 23 March 2021, a sudden strong convective gust may have been responsible the ULCC (Ultra Large Container Carrier) “Even Given” to be stuck in the Egypt Suez Canal, resulting in a week-long closure of the channel, and interruption of the whole world’s supply chain.
But open-access weather services, though free of charge, have limitations too. The weather reports in ECG or NAVTEX are described in text mode while the weather fax map is graphical and non-quantitative. In short, these weather services could only describe the regional synoptic weather condition and were not ship-oriented. As a result, the effect of the weather-related self-navigation was highly dependent on senior officer’s personal experience. One analysis shows more than 80% of marine accidents in the maritime domain are caused by human errors [29].
Based on raw surface 2 m wind component from the numerical weather products and INMARSAT satellite email communication, the Climate Forecast Applications Network group (CFAN) in the Georgia Institute of Technology in the USA developed an automatic marine wind forecast system [30], adding up wave and swell values latterly. Some other sail weather providers could provide similar service too, but it would only free for a limited trial time. However, as discussed in Section 3.2 and Figure 2, the product based on raw surface wind data do not contain warning potential for extreme wind gusts, particularly when related to convective events. Upon the finding in this study, this study adjusted the previous wind forecasting system to add up the state-of-the-art nautical CP and LSP forecast, with the aim of providing deep-convective wind gust warning to cruise boat officers via email communication.

5.2. Core of the System

The core forecasting frame is based on the ECMWF global NWP product, the same model applied in Section 3 and Section 4. CFAN has a long-term collaboration with ECMWF [22]. To reduce the communication cost via INMARSAT satellite service, most computational jobs are set in the servers. The request might be initialized at any time by vessel officers or users on land, who could send out a formatted email with latitudinal and longitudinal information to a particular email address (e.g., xxxx@cfanclimate.net). The successful arrival of this email will trigger a set of jobs that will read the near-to-date high-volume ECMWF product from the US server, generate the future weather element change trend near the target location, compress them, and then deliver the package to the server located in Dalian Maritime University, China. The Chinese server will apply a bias-correction algorithm to adjust the raw data according to water depth, the season, wind direction, and distance to the nearest land. Finally, the future CP/LSP trend will be stated in a concise way and sent back to the ship’s satellite receiver. Figure 10 briefly states the system process, which is all performed automatically.

5.3. Input and Output of the Warning System

The system was designed to simplify the operation through the pre-installed INMARSAT email communication instrument (C/F/FBB station) on the ship. For example, if any crew sends out a request including the following phrase “/LAT/30.4/LON/123.1/”, they will receive text message within 10 min via F station (or 25 min via C station).
In Figure 11, the first line notes the nearest grid’s latitude and longitude. In the following lines, the first value on the left marks the starting date and hour in UTC (e.g., 052912Z means 1200 Z at 29 May), then the accumulated CP and LSP forecast value within each six-hour interval (e.g., 052918Z/CP/13/means an accumulated 13 mm would be expected during the previous six hours until 1800 Z on 29 May).
Nowadays most inland and offshore river cruise boats are running in liner ship mode, that is to say, the manager and navigator know the ship’s position at the exact time before the departure. Thus, a future improvement of the above warning system could be to generate the predicted CP or wind profile, like Figure 6 or Figure 7c, before the trip and even after the trip begins. By reading the figures, the ship officer could know which part of the trip is most dangerous and then take necessary action to avoid it. Under this anticipation, the ship’s resilience toward convective wind gusts can be improved with enhanced object-oriented service. However, this work is still under development.
The authors of [31] stated that “With such an effective means of navigation, backed up by the continuing improvements in the provision of weather information and navigational warnings, the small craft of the future, whether at sea or in the air, should be capable of operation with minimal interference with larger commercial craft.” Our research bears a wishful small step toward this direction.

6. Conclusions

This study analyzed the performance of predicted weather components around the deadly “Oriental Star” shipwreck and, for the first time, raises the possibility that the sub-grid strong wind gusts associated with deep-convective weather can be indirectly warned for by a sudden CP increase in the global numerical mesoscale product. The result shows that, in terms of a single member (deterministic) model, the rapid change of CP at a 24 h lead is much more obvious than at a 48 h or greater, i.e., the 24 h lead forecast has more potential to act as a warning factor. The finding has been confirmed in another mid-latitude cruise boat capsizing events but not in the tropics. In addition, when considering the high-end value of the ensemble forecast members, the effective lead time could be extended to 48 h. It was also found that if the simultaneous LSP variation is negligible, then the warning credibility could be high.
This study tried to enhance the cruise boat resilience through the finding from a few certain accidences and situations. The partial reason that the finding was not verified for other cruise boat capsizing accidents is that the available global NWP product does not extend to enough long periods to cover more scenarios. However, considering the significant social consequence, it is suggested at its current stage, the maritime safety guidance should consider adding the CP variable into the maritime warning system, at least in the mid-latitude and for small-sized cruise boat shipping, to indirectly warn about the strong convective wind gusts along offshore and inland of rivers, which is of great importance in safety navigation. A previous text-mode automatic wind forecasting system is adjusted to provide simple convective wind gust warning preliminarily, with aspirations that a more trustworthy and user-oriented graphic-based warning could be applied in the future.

Author Contributions

Conceptualization, J.J.; methodology, J.J.; software, J.C. and J.J.; validation, J.J. and J.C.; formal analysis, J.J.; investigation, J.J. and J.C.; resources, P.J.W. and J.C.; data curation, J.C. and J.J.; writing—original draft preparation, J.J.; writing—review and editing, J.C.; visualization, J.C.; supervision, J.J. and P.J.W.; project administration, J.J.; funding acquisition, J.J. All authors have read and agreed to the published version of the manuscript.

Funding

This research was funded by the National Natural Science Foundation of China (Grant No. 42261144671, 42030602).

Institutional Review Board Statement

Not applicable.

Informed Consent Statement

Not applicable.

Data Availability Statement

The data presented in this study are available upon request from the corresponding author.

Acknowledgments

Thank reviewers for their helpful comments. Thank the ECMWF for the provision of the weather and climate ensemble products.

Conflicts of Interest

The authors declare no conflict of interest.

References

  1. Beljaars, A.C.M. The Measurement of Gustiness at Routine Wind Stations: A Review; Instruments and Observing Methods Report No. 31; World Meteorological Organization (WMO): Geneva, Switzerland, 1987. [Google Scholar]
  2. Watts, A. Weather forecasting for small craft. J. Navig. 1977, 30, 474–478. [Google Scholar] [CrossRef]
  3. National Investigation Report on the “Oriental Star” Shipwreck Incident. 2015. Available online: http://sh.sina.com.cn/news/g/2015-12-30/detail-ifxmxxyq4773338.shtml (accessed on 7 July 2023).
  4. Collier, C.G.; Dixon, J.; Harrison, M.S.J.; Hunt, J.C.R.; Mitchell, J.F.B.; Richardson, D.S. Extreme surface winds in mid-latitude storms: Forecasting and changes in climatology. J. Wind Eng. Ind. Aerodyn. 1994, 52, 1–27. [Google Scholar] [CrossRef]
  5. Nakamura, K.; Kershaw, R.; Gait, N. Prediction of near-surface gusts generated by deep convection. Meteorol. Appl. 1996, 3, 157–167. [Google Scholar] [CrossRef]
  6. Mao, Y.W. Meteorological Early Warning Service in the “Oriental Star” Passenger Ship Overturning Event and Its Enlight-enment. Cities Disaster Reduct. 2018, 2, 15–18. [Google Scholar]
  7. Friederichs, P.; Gober, M.; Bentzien, S.; Lenz, A.; Krampitz, R. A probabilistic analysis of wind gusts using extreme value statistics. Meteorol. Z. 2009, 18, 615–629. [Google Scholar] [CrossRef] [PubMed]
  8. Weggel, J.R. Maximum daily wind gusts related to mean daily wind speed. J. Struct. Eng. 1999, 125, 465–468. [Google Scholar] [CrossRef]
  9. International Maritime Organization (IMO). MSC.1/Circular.1281/Annex/Chapter3, Origin of Present Stability Criteria, Explanatory Notes to the International Code on Intact Stability. 2008. Available online: https://puc.overheid.nl/nsi/doc/PUC_1941_14/1/ (accessed on 22 July 2023).
  10. Patlakas, P.; Galanis, G.; Barranger, N.; Kallos, G. Extreme wind events in a complex maritime environment: Ways of quantification. J. Wind Eng. Ind. Aerodyn. 2016, 149, 89–101. [Google Scholar] [CrossRef]
  11. Patlakas, P.; Drakaki, E.; Galanis, G.; Spyrou, C.; Kallos, G. Wind gust estimation by combining a numerical weather prediction model and statistical post-processing. Energy Procedia 2017, 125, 190–198. [Google Scholar] [CrossRef]
  12. Chen, C.; Sasa, K.; Ohsawa, T.; Prpić-Oršić, J. Comparative study on WRF model simulations from the viewpoint of optimum ship routing. Ocean. Eng. 2020, 207, 107379. [Google Scholar] [CrossRef]
  13. Gutiérrez, A.; Porrini, C.; Fovell, R. Combination of wind gust models in convective events. J. Wind Eng. Ind. Aerodyn. 2020, 199, 104–118. [Google Scholar] [CrossRef]
  14. Brown, R.D.; Swail, V.R. Over-water gust factors. Ocean. Eng. 1991, 18, 363–394. [Google Scholar] [CrossRef]
  15. Sasa, K.; Incecik, A. Numerical simulation of anchored ship motions due to wave and wind forces for enhanced safety in offshore harbor refuge. Ocean Eng. 2012, 44, 68–78. [Google Scholar] [CrossRef]
  16. Jian, J.; Yu, M.J.; Shi, M.L.; Chen, J.H. Early warning of gust according to C_P change rate from numerical weather products. Navig. China 2020, 43, 25–30. [Google Scholar]
  17. Persson, A. User Guide to ECMWF Forecast Products; European Centre for Medium-Range Weather Forecast: Reading, UK, 2011. [Google Scholar]
  18. Joyce, R.J.; Janowiak, J.E.; Arkin, P.A.; Xie, P. CMORPH: A method that produces global precipitation estimates from passive microwave and infrared data at 8-km, hourly resolution. J. Hydrometeorol. 2004, 5, 487–503. [Google Scholar] [CrossRef]
  19. Sakata, S.; Ashida, F.; Zako, M. Structural optimization using Kriging approximation. Comput. Methods Appl. Mech. Eng. 2003, 192, 923–939. [Google Scholar] [CrossRef]
  20. Tracton, M.S.; Kalnay, E. Operational ensemble prediction at the National Meteorological Center: Practical aspects. Weather Forecast. 1993, 8, 379–398. [Google Scholar] [CrossRef]
  21. Buizza, R.; Milleer, M.; Palmer, T.N. Stochastic representation of model uncertainties in the ECMWF ensemble prediction system. Q. J. R. Meteorol. Soc. 1999, 125, 2887–2908. [Google Scholar] [CrossRef]
  22. Webster, P.J.; Jian, J.; Hopson, T.M.; Hoyos, C.D.; Agudelo, P.A.; Chang, H.R.; Curry, J.A.; Grossman, R.L.; Palmer, T.N.; Subbiah, A.R. Extended-range probabilistic forecasts of Ganges and Brahmaputra floods in Bangladesh. Bull. Am. Meteorol. Soc. 2010, 91, 1493–1514. [Google Scholar] [CrossRef] [Green Version]
  23. Christ, E.H.; Webster, P.J.; Snider, J.L.; Toma, V.E.; Ooserhuis, D.M.; Chastain, D.R. Predicting heat stress using probabilistic canopy temperature forecasts. Agron. J. 2015, 108, 1981–1991. [Google Scholar] [CrossRef]
  24. Don, P.K.; Evans, J.L.; Chiaromonte, F.; Kowaleski, A.M. Mixture-Based Path Clustering for Synthesis of ECMWF Ensemble Forecasts of Tropical Cyclone Evolution. Mon. Weather Rev. 2016, 144, 3301–3320. [Google Scholar] [CrossRef]
  25. Skoglund, L.; Kuttenkeuler, J.; Rosén, A.; Ovegard, E. A comparative study of deterministic and ensemble weather forecasts for weather routing. J. Mar. Sci. Technol. 2015, 20, 429–441. [Google Scholar] [CrossRef]
  26. Investigation Report on Guangyuan Bailong Lake “6.4” Major Shipwreck. Available online: http://www.safehoo.com/Case/Case/Drowned/201612/468757.shtml (accessed on 7 July 2023).
  27. Thailand Authority Report. 2018. Available online: https://thethaiger.com/news/phuket/phoenix-substandard-more-officials-face-legal-action (accessed on 1 August 2021).
  28. Azorin-Molina, C.; Guijarro, J.A.; McVicar, T.R.; Vicente-Serrano, S.M.; Chen, D.L.; Jerez, S.; Espirito-Stanto, F. Trends of daily peak wind gusts in Spain and Portugal, 1961–2014. J. Geophys. Res. Atmos. 2016, 121, 1059–1078. [Google Scholar] [CrossRef] [Green Version]
  29. Cho, J.Y.; Keum, J.S.; Jang, W.J. A study on the effects of marine accidents by navigation officer’s fatigue. Metab. Clin. Exp. 2010, 57, 946–953. [Google Scholar]
  30. Jian, J.; Webster, P.J. A new marine auto-response quantitative wind forecast system. Procedia Soc. Behav. Sci. 2013, 96, 1362–1365. [Google Scholar] [CrossRef] [Green Version]
  31. Page, D. The future navigation of small craft both at sea and in the air. J. Navig. 1992, 45, 13–18. [Google Scholar] [CrossRef]
Figure 1. Different types of clouds and precipitations: (a) frontal clouds (Ci, Cs, As, and Ns) with large-scale precipitation; (b) fair weather cumulus; (c) cumulus congestus; (d) cumulonimbus with strong precipitation. Arrow represents air particle movement direction.
Jmse 11 01588 g001
Figure 2. Depiction of 10 m wind at UTC: (a) 1200 Z on 1 June 2015; (b) 1800 Z on 1 June 2015. Black thick line and red star mark the last route and shipwreck position of “Oriental Star”.
Jmse 11 01588 g002
Figure 3. (a) Doppler radar rain rate snapshot at the “Oriental Star” shipwreck moment; (b) CMORPH 3 h precipitation during UTC1200–1500 Z on 1 June 2015. The red box represents the area of (a), and the purple thick line represents the last track of the “Oriental Star”. The star marks the ship’s final wreck location.
Jmse 11 01588 g003aJmse 11 01588 g003b
Figure 4. (a) Cumulus precipitation (CP) prediction over UTC 12–18 Z initialized at 12 Z 1st June 2015; (b) same as (a) but initialized at UTC 12 Z 31st May; (c) same as (b) but for large-scale precipitation (LSP) prediction (Reprinted with permission from Ref. Jian et al. 2020 [16]). The black thick line represents the last route of the “Oriental Star”.
Jmse 11 01588 g004
Figure 5. Upper-level air temperature trend at different pressure levels at the location of the “Oriental Star” shipwreck. The vertical lines mark the shipwreck time.
Jmse 11 01588 g005
Figure 6. Predicted CP (solid) and LSP (dash) value following the last route of the “Oriental Star” ship with a 1-day (red), 2-day (gray), and 3-day (green) lead time.
Jmse 11 01588 g006
Figure 7. (a) Time series of regional average (blue box) ensemble CP forecast, with each colored line representing each ensemble member; (b) mean of the highest one-tenth of 51-member ensemble CP forecast at a 24 h lead; (c) similar to Figure 6 but for the mean of one-tenth of the all-ensemble CP forecasts.
Jmse 11 01588 g007
Figure 8. (a) Deterministic and (b) ensemble mean forecast of 6 h accumulated CP horizontal distribution on 4 June 2016 when the “double dragon” capsized. Black star marks the shipwreck position of “Double Dragon”. (c) Time series of ensemble CP prediction similar to Figure 7a but for the “Double Dragon” case, with each colored line representing each ensemble member.
Jmse 11 01588 g008
Figure 9. CP forecast offshore of Phuket island, southern Thailand during 4–7th July 2018 ((Reprinted with permission from Ref. Jian et.al. [16]).
Jmse 11 01588 g009
Figure 10. Structure of the automatic weather navigation system scheme.
Jmse 11 01588 g010
Figure 11. Return message to the sender with location request.
Jmse 11 01588 g011
Table 1. Selected weather components in ECMWF deterministic product at 24 h lead time and their tempo-spatial variation in the “Oriental Star” accident.
AbbreviationFull NameLevelUnitVariation in “Oriental Star” Accident
2D, 2TDew point and air temperature2 m above surfaceKNo
CPCumulus precipitationSurfaceMExtreme value fits the accident’s location and time
LSPLarge-scale precipitationSurfaceMNo
MSLMean sea-level pressureSurfacePaNo
QSpecific humidity700 mb,
850 mb
kg/kg (%)No
SLHF, SSHF, SSR, STRLatent and sensible heat flux,
solar, and thermal radiation
SurfaceW/m2sNo
GHGeopotential height700 mb,
850 mb
GmpNo
TAir temperature200 mbKMiddle of increasing trend
TAir temperature250 mbKEnd of increasing trend
TAir temperature300 mbKEnd of increasing trend
TAir temperature500 mbKNo
U, VHorizontal wind velocity10 m above surface, 200 mb, 700 mb, 850 mbm/sNo
VOVorticity700 mb,
850 mb
1/sNo
Disclaimer/Publisher’s Note: The statements, opinions and data contained in all publications are solely those of the individual author(s) and contributor(s) and not of MDPI and/or the editor(s). MDPI and/or the editor(s) disclaim responsibility for any injury to people or property resulting from any ideas, methods, instructions or products referred to in the content.

