Article

Nearshore Observations and Modeling: Synergy for Coastal Flooding Prediction

1
Department of Civil and Building Engineering and Architecture, Università Politecnica delle Marche, 60131 Ancona, Italy
2
Institute for Electromagnetic Sensing of the Environment, National Research Council, I-80124 Napoli, Italy
*
Author to whom correspondence should be addressed.
J. Mar. Sci. Eng. 2023, 11(8), 1504; https://doi.org/10.3390/jmse11081504
Submission received: 7 July 2023 / Revised: 22 July 2023 / Accepted: 26 July 2023 / Published: 28 July 2023
(This article belongs to the Topic Aquatic Environment Research for Sustainable Development)

Abstract

:
Coastal inundation has recently started to require significant attention worldwide. The increasing frequency and intensity of extreme events (sea storms, tsunami waves) are highly stressing coastal environments by endangering a large number of residential areas, ecosystems, and tourist facilities, and also leading to potential environmental risks. Predicting such events and the generated coastal flooding is thus of paramount importance and can be accomplished by exploiting the potential of different tools. An example is the combination of remote sensors, like marine radars, with numerical models. Specifically, while instruments like X-band radars are able to precisely reconstruct both wave field and bathymetry up to some kilometers off the coast, wave-resolving Boussinesq-type models can reproduce the wave propagation in the nearshore area and the consequent coastal flooding. Hence, starting from baseline simulations of wave propagation and the conversion of water elevation results into radar images, the present work illustrates the reconstruction of coastal data (wave field and seabed depth) using a specifically suited data processing method, named the “Local Method”, and the use of such coastal data to run numerical simulations of coastal inundation in different scenarios. Such scenarios were built using two different European beaches, i.e., Senigallia (Italy) and Oostende (Belgium), and three different directional spreading values to evaluate the performances in cases of either long- or short-crested waves. Both baseline and inundation simulations were run using the FUNWAVE-TVD solver. The overall validation of the methodology, in terms of maximum inundation, shows its good performance, especially in cases of short-crested wind waves. Furthermore, the application on Oostende Beach demonstrates that the present methodology might work using only open-access tools, providing an easy investigation of coastal inundation and potential low-cost integration into early warning systems.

1. Introduction

Coastal inundation is one of the most relevant threats to communities all over the world. Although usually triggered by extreme events, the flooding of coastal areas is related to a series of diverse forcing actions, not only severe water waves like those occurring during sea storms or induced by tropical cyclones, but also storm surges, tidal oscillations, and additional contributions associated with low-frequency waves (e.g., infragravity waves) [1]. Furthermore, global warming is very likely to lead to increased frequency and intensity of extreme events, and is already inducing a non-negligible rise in sea level [2]. Although the objectives of the Paris Agreement, focused on global climate mitigation policy, will be achieved in the near and far future, many of the world’s coasts could potentially experience extreme events of unprecedented intensity [3].
The above actions have the potential to combine with each other, giving rise to a phenomenon known as “compound flooding”, which leads to an impact on the coastal region, and potentially on the nearby urban environment, that is larger than the sum of the impacts induced by single events [4]. More relevant effects can occur in estuarine coastal areas, where additional combination with river-induced forcings (e.g., flood peaks) is possible.
The flooding of coastal areas may ultimately lead to dramatic effects on the population, infrastructures, and structures [5,6], with potential drawbacks also related to seawater intrusion at both superficial (estuarine areas) and groundwater (coastal aquifers) levels [7].
Field observations are of paramount importance for safeguarding the coastal areas that are more prone to inundation phenomena. To this aim, remote sensors, like cameras or marine radars, are a common solution. These systems represent a valid alternative to the in situ systems (e.g., wave rider buoy) since they permit observing a site under test in a non-invasive way and can also be used during severe weather and sea conditions [8]. However, these remote sensors require a bit of practice, but the technology selected to conduct the experiment and the algorithms for the analysis of the collected data are nowadays robust and mature enough to guarantee a reliable characterization of the local coastal area in terms of bathymetry, shoreline motion, location of submerged bars, etc. [9,10,11,12,13].
On the other hand, the use of suitable remote instrumentation is not always possible, due to either economic issues (installation and maintenance of the equipment might be costly) or topographic/geographic difficulties (lack of a suitable area to reach a sufficient height over the sea level), among others. In such contexts, a low-cost solution is the novel short-range K-band marine radar, which is able to reconstruct the sea surface current and estimate the direction of the dominant waves in very nearshore areas [14].
In addition to the observations carried out using remote sensors, a straightforward method is required to evaluate the coastal inundation. Specifically, an approach based on the modeling chain allows one to exploit the skills of both numerical models and field observations. This synergic approach saves a significant amount of time and money. Recent examples related to coastal regions refer to the use of data gathered in open databases (e.g., Copernicus) or collected by remote sensors (e.g., X-band radar), which are then used as boundary or initial conditions for a numerical model, which operates over a relatively small domain (order of some km2) and aims to propagate the waves within a reduced nearshore region [15,16,17]. Simplified depth-averaged models, like those based on Boussinesq-type equations or Nonlinear Shallow Water Equations, can be employed with the final purpose of obtaining reliable information on potential inundation, at a reduced computational cost [18,19,20,21].
Hence, the use of X-band marine radars combined with the nearshore modeling of wave propagation results in a low-cost approach for the analysis of future coastal inundation, as the radar allows one to reconstruct both offshore bathymetry and estimate the characteristic sea state parameters (between some hundred meters and 3 km from the coast), while a shallow water model provides the wave propagation and the consequent shoreline motion, exploiting the offshore radar-derived data and available or reconstructed nearshore bathymetries [22,23].
The approach could potentially be integrated into early warning systems. As an example, if numerous simulations are run using a parametric approach (e.g., varying the spectral wave characteristics), an alert matrix could be built and a “safe area” could be identified, which is related to the coastal inundation that can be derived from the wave characteristics recorded offshore by the installed X-band radar. In particular, waves propagating at a distance of ~5–6 km from the coast can be detected by the radar, then transformed into wave height and related coastal inundation in near real time. If this corresponds to a warning condition, an instantaneous message will be instantaneously sent to the population via a mobile application or SMS, thus allowing beachgoers to find a safe place to take refuge.
The present work describes the potential of the synergic use of X-band radar and shallow-water modeling in the prediction of coastal inundation. Different wave characteristics are tested (significant height, peak period, main direction, spreading), and two different configurations are exploited. One is related to the Senigallia coast (Marche Region, Italy), where bathymetric data are available thanks to recent bathymetric campaigns. The other configuration is Oostende (Belgium), chosen with the aim to test open-access databases and show the reliability of the presented approach in a very low-cost framework.

2. Materials and Methods

The present work describes a methodology, sketched in Figure 1, that can be successfully applied in a real-world environment. It is worth stressing that this study is based on numerical tests, where the wave field is simulated through baseline numerical simulations, hereafter referred to as large-scale tests. The initial step (STEP 1) involves the incoming wave field as a specific data sequence, which consists of temporal 2D spatial radar images generated using an ad hoc radar data simulator. Afterward, a specific algorithm is used to reconstruct the bathymetry and the sea wave characteristics from the radar data sequence up to about 3–5 m depth (STEP 2). Such information is then used to produce boundary and initial conditions for the inundation modeling (STEP 3). The final phase consists of smaller-scale numerical modeling (small-scale tests) with bathymetry and wave input from the previous step, with the final purpose of evaluating the inundated coastal area (STEP 4). The final output is validated here using both baseline (large-scale) simulations and inundation (small-scale) simulations, to ensure the suitability of the proposed approach.

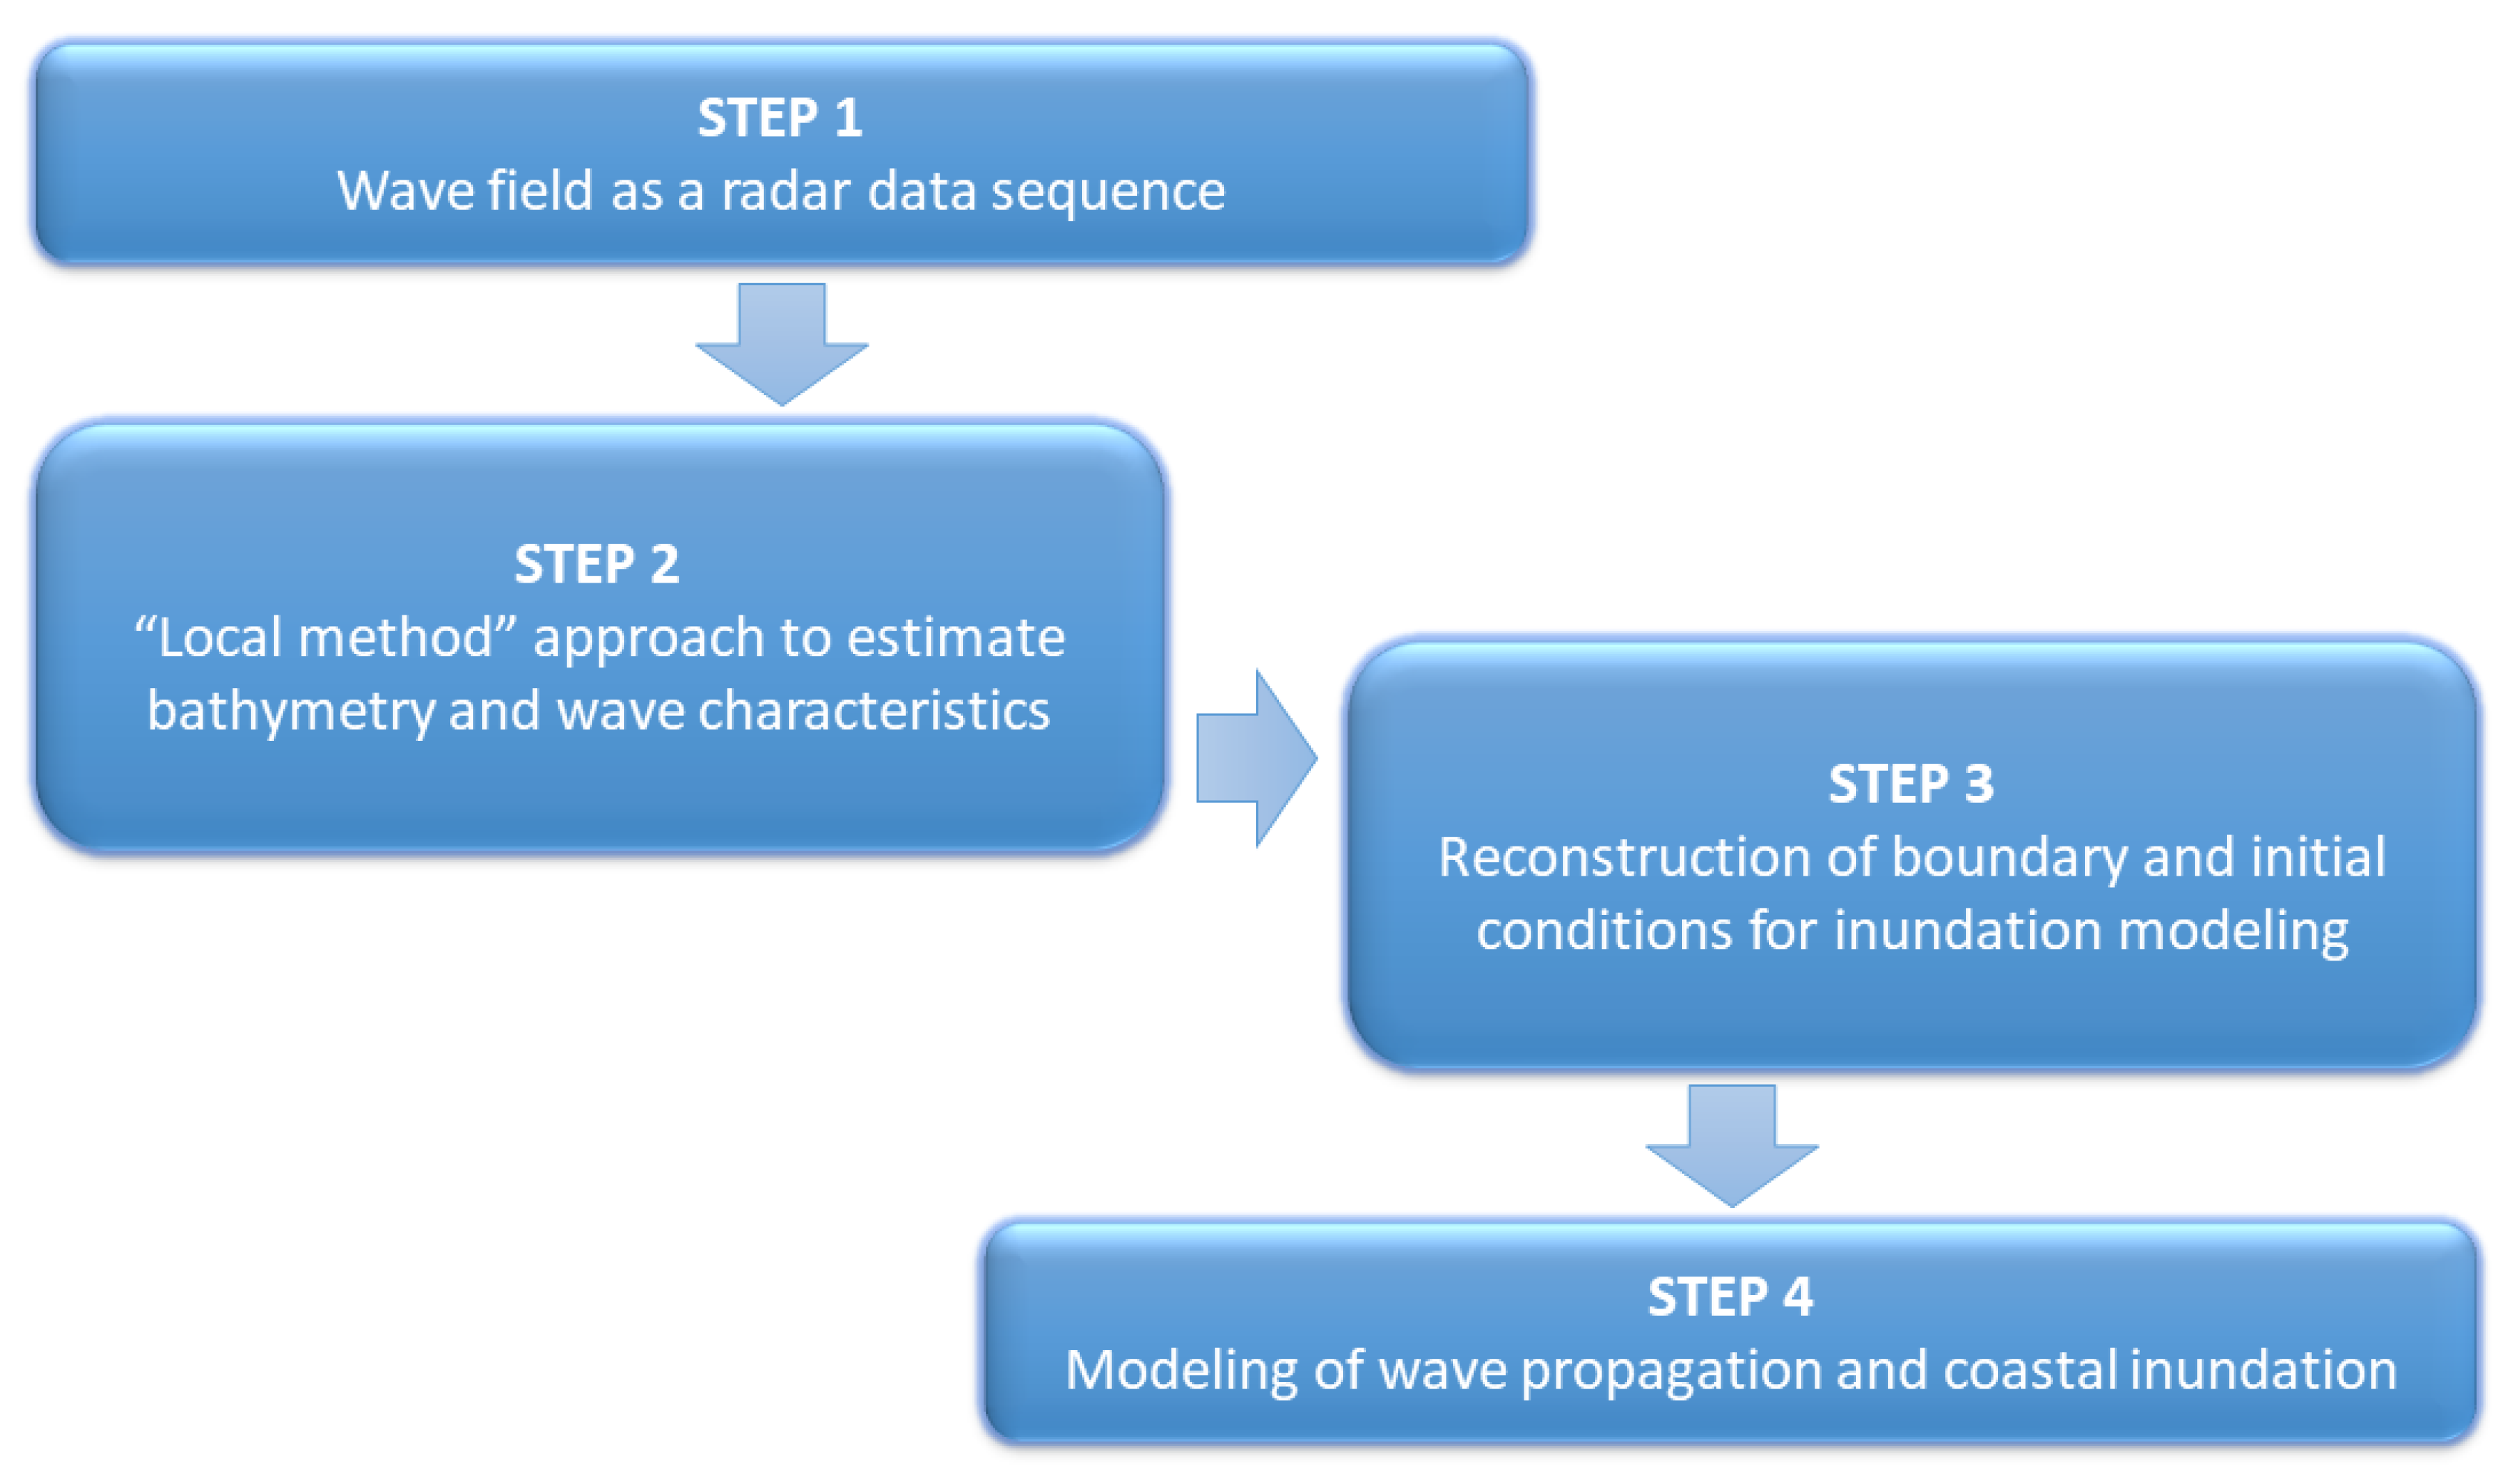
2.1. The Methodology

The above-described methodology, based on a modeling-chain approach, has already been proposed in several works (e.g., [17,24,25,26]). Specifically, the use of an X-band algorithm combined with the numerical modeling of coastal inundation has been recently described [23], demonstrating the applicability of the methodology to the case of long-crested waves with negligible spreading traveling within a known environment. To complement the analysis conducted in [23], the present work will illustrate (a) the potential application of the present approach to the case of wave spectra characterized by non-zero spreading and (b) the applicability of the methodology to unknown environments through the use of open-access datasets, i.e., only exploiting freely available data.
Recalling the aim of the study, the wave radar system serves as an external sensor to provide information about the wave characteristics of the observed scenario. This study is a proof of concept, and the real scenario is simulated by using the wave field modeled by specifically designed baseline simulations. This numerical modeling was conducted through the use of FUNWAVE-TVD 1, a nearshore phase-resolving Boussinesq-type model, which exploits the Total Variation Diminishing approach [27]. It is suitable for the description of shallow-to-intermediate water flows and is applied here for the baseline/large-scale simulations (Figure 1). Similar to other wave-resolving numerical solvers, FUNWAVE-TVD can model coastal inundation based on physical processes described by its governing equations. Specifically, when the waves propagate in the surf zone, a portion of their energy is dissipated as a consequence of both breaking and seabed friction, while a portion is converted into potential energy and leads to the wave runup onto the swash zone of the beach [28,29].
At this stage, the synthetic X-band radar images are obtained by implementing a simulator, extensively described in [30,31], which takes into account the modulation phenomena (shadowing and tilt modulation) affecting the radar echoes, which depend on the generated sea model and radar antenna geometry (STEP 1). The shadowing effect may be viewed as a geometrical phenomenon and is represented as if the radar antenna is not receiving any signal from the areas of the sea surface that are in shadow. Instead, the tilt modulation is influenced by the local power received by the radar antenna on the slope of the observed surface. As a result, the received radar signal undergoes modulation, which relies on the angle formed between the radar illumination ray (i.e., the local line of sight) and the normal vector to the wave surface.
Accordingly, the radar image is not a direct representation of the wave elevation profile, but rather a distorted version of it. Therefore, in order to obtain information about the sea state parameters as well as the bathymetry field, the radar data sequence is elaborated by means of a dedicated algorithm, named the “Local Method”, commonly adopted in coastal areas (STEP 2) [22,23,32]. This method is based on the inversion of the dispersion relation used in shallow water:
ω = k g h + k ¯ × U ¯
where ω is the angular frequency, k ¯ = k x , k y is the wave vector with amplitude k = k ¯ = k x 2 + k y 2 , h is the seabed depth, and U ¯ = U x , U y is the sea surface current vector [23]. Furthermore, the used approach involves a spatial partitioning of the radar images into partially overlapping sub-areas, since the hypothesis of the spatial homogeneity is not satisfied in the scenarios under investigation [32,33,34]. Specifically, this task is treated as a linear inverse problem and it is based on the knowledge of the fundamental laws which rule the dynamics of the sea gravity waves, whose dispersive behavior obeys the linear dispersion relationship [23].
Therefore, the main steps of the inversion procedure applied to each sub-area are summarized below:
  • Three-Dimensional Fast Fourier Transform (FFT) 2 is employed to convert a sub-area of a radar image sequence from space–time to wavenumber–frequency coordinates;
  • Estimation of the bathymetry value from the radar spectrum;
  • A band-pass filter is applied to account for the dispersion relation describing the gravity of sea waves;
  • Modulation Transfer Function (MTF) is applied to the radar spectrum, as it allows compensating for the spectral distortion introduced by the modulation effects and passing from the radar spectrum to the sea spectrum [23,35].
The reader can refer to [22,23] for more details about the inversion procedure employed. Then, from the reconstruction of bathymetry and wave characteristics, initial and boundary conditions were extracted (STEP 3) for the inundation/small-scale modeling (STEP 4), which was again performed using the FUNWAVE-TVD solver.
Finally, it is worth noting that the scope of baseline simulations is twofold. On the one hand, the elevation results are used to produce real-world radar images. On the other hand, the shoreline motion results are used to validate the overall methodology.

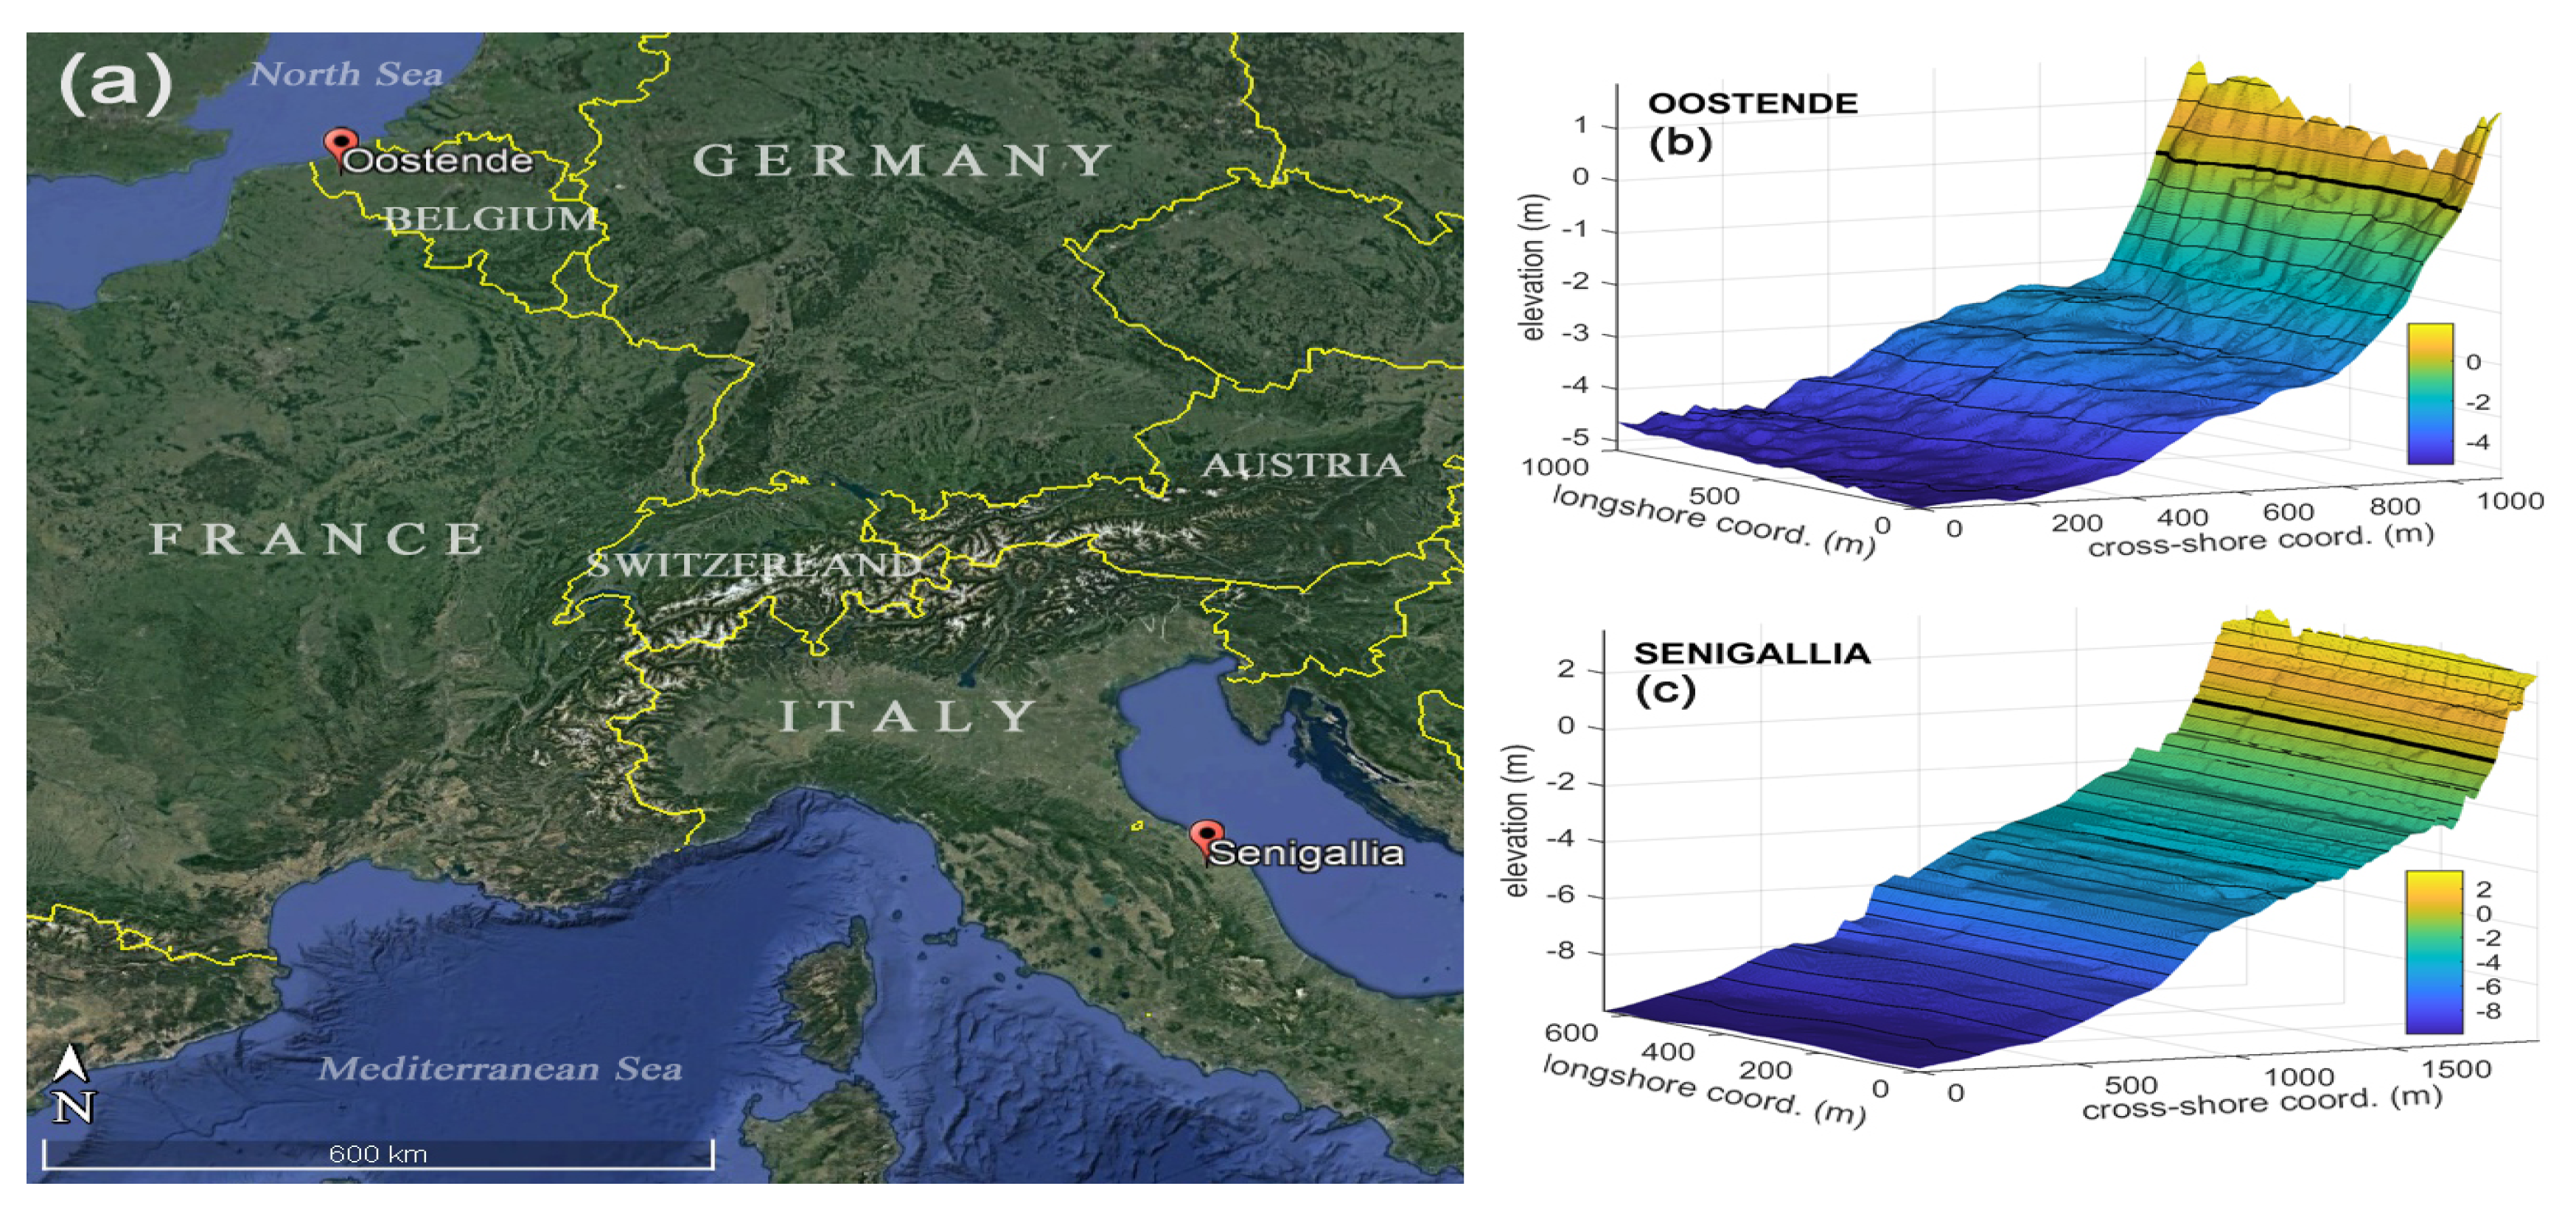
2.2. The Investigated Sites

Two different geographical sites were selected for the present study (Figure 2), each of them tested with different wave conditions. The first location is the southern coast of Senigallia, a tourist town located along the eastern Italian coast and characterized by the Misa River, a small watercourse flowing within the historical town and debouching into the Adriatic Sea. The choice was motivated by the bathymetric data made available by the municipality of Senigallia; the existence of a monitoring system continuously providing several hydrodynamic parameters, like offshore wave characteristics; and the dataset collected during a field campaign conducted in January 2014 at the estuary of the Misa River [1,36,37].
The second location is Oostende, a coastal city located in the province of West Flanders in the Flemish Region of Belgium, typified by a sandy coastline and overlooking the North Sea. Compared to Senigallia, Oostende is characterized by a completely different environment in terms of wave climate, tidal forcing, and data availability. The data used for the numerical simulations were extracted from open-access services: Copernicus Marine Service (CMEMS) 3 for wave characteristics and the European Marine Observation and Data Network (EMODnet) 4 for bathymetries.

2.3. Tested Conditions

To better understand the performance of the methodology at the chosen locations, one wave condition was used at each location for the baseline/large-scale simulations, i.e., a single triplet (hoff, Hs, Tp), where hoff is the offshore depth in still-water conditions, Hs is the significant wave height, and Tp is the peak period of a JONSWAP spectrum, defined as an input spectral condition in FUNWAVE-TVD [27]. In addition, three different directional spreading parameters σ were used at each location (e.g., see [38]). All tested conditions were characterized by a main wave direction perpendicular to the shore. Table 1 summarizes all the main input characteristics at the offshore boundary used for the baseline simulations.
Using the numerical results found from the baseline simulations, the “Local Method” was applied to reconstruct both wave climate and bathymetry from the original boundary depth up to h > 3 m. Reconstruction at shallower depths was discarded due to the unsuitability of radar-driven methods in correspondence with significantly shallow depths (i.e., h < 3 m). Consequently, the reconstructed wave parameters were used for the small-scale inundation modeling (see Section 2.1), with wave generation at depths of about h = 5 m for Senigallia and h = 3.5 m for Oostende.

3. Results

3.1. Baseline (Large-Scale) Modeling

The different configurations described in Table 1 were tested as baseline conditions and employed in large-scale simulations. The purpose of this modeling was twofold: (a) to obtain a first baseline estimate of coastal inundation from a large-scale approach, and (b) to extract a bundle of 200 snapshots of the propagating wave field at an interval of 1 s, to be later provided as input for the reconstruction method (see Section 3.2). Examples of wave fields modeled over the Senigallia bathymetry in the baseline simulations, for two different wave spreading parameters, are provided in Figure 3.

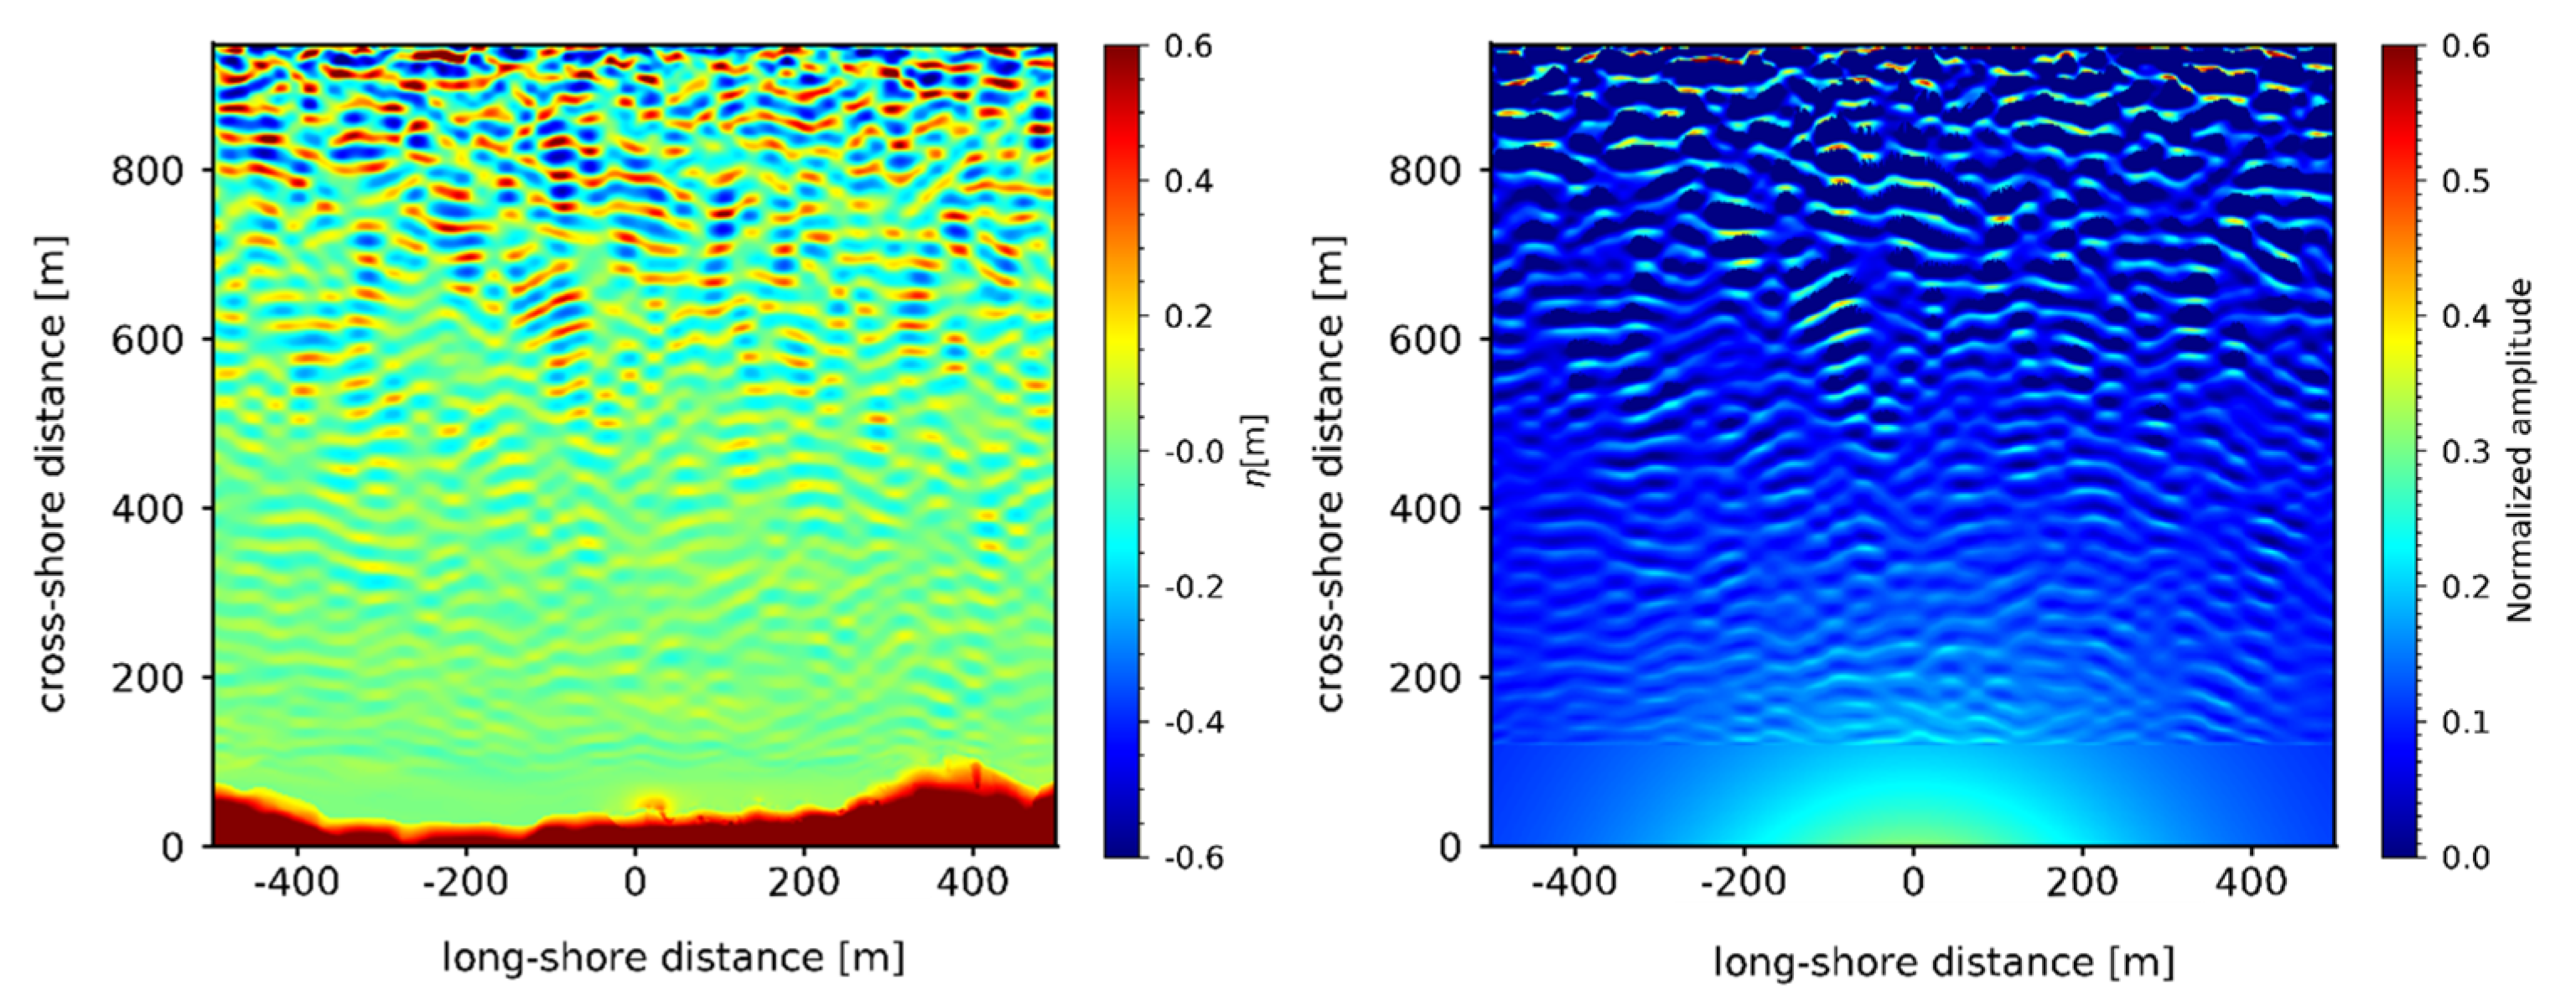
3.2. Local Method Reconstruction

This section presents the results obtained from the elaboration of the radar data sequence by means of the “Local Method” (see Section 2.1). The numerical baseline data were used for the reconstruction of both bathymetry and wave characteristics. Specifically, each considered dataset consists of 200 individual (synthetic) snapshots of wave surface, simulating the same number of radar images, with a time interval Δ t = 1 s (see Section 3.1) and a pixel size of 2 m in the Cartesian grid. It is worth noting that the radar images were simulated by considering the antenna located at x 0 = 0 m and y 0 = 0 m, with an elevation H r a d a r = 20 m.
Figure 4 shows an example of a synthetic sea-wave image obtained by means of FUNWAVE-TVD (left panel) and the amplitude of the corresponding radar image (right panel) at the same time instant (t = 100 s) for the Oostende case with a directional spreading σ = 30 .
In order to estimate the local sea-state parameters and bathymetry, the “Local Method” was applied to each radar data sequence. In particular, a sub-area size equal to (250 × 250) m2 was adopted for all considered radar sequences.
Firstly, the local procedure provided the bathymetry reconstructions, shown here using a pixel spacing of 10 m for all the considered wave types. The reliability of the bathymetric reconstruction using the above-mentioned strategy has been widely demonstrated [22,33]; thus, the statistical analysis obtained from the comparison with the ground truth is reported in Table 2 for all wave types, in terms of root mean square error (RMSE) and correlation coefficient square (R2).
To estimate the wave characteristics from the radar data, compensation of the modulation effect introduced by the radar imaging was required. Specifically, after the application of the band-pass filter, the MTF was applied to the filtered radar spectrum to obtain the desired sea wave spectrum in each sub-area. For more details, the reader can refer to [21].
The reconstructed bathymetry and the spatial map of the reconstructed significant wave height for the Oostende case with a directional spreading σ = 30 are reported in Figure 5 and Figure 6, respectively. Results of comparable accuracy were obtained with the other tested configurations. The mean values of some wave parameters (significant height Hs, peak period Tp, peak length Lp, main direction θ ) at different bathymetric lines, referring to all the considered spreading values, are reported in Table 3.

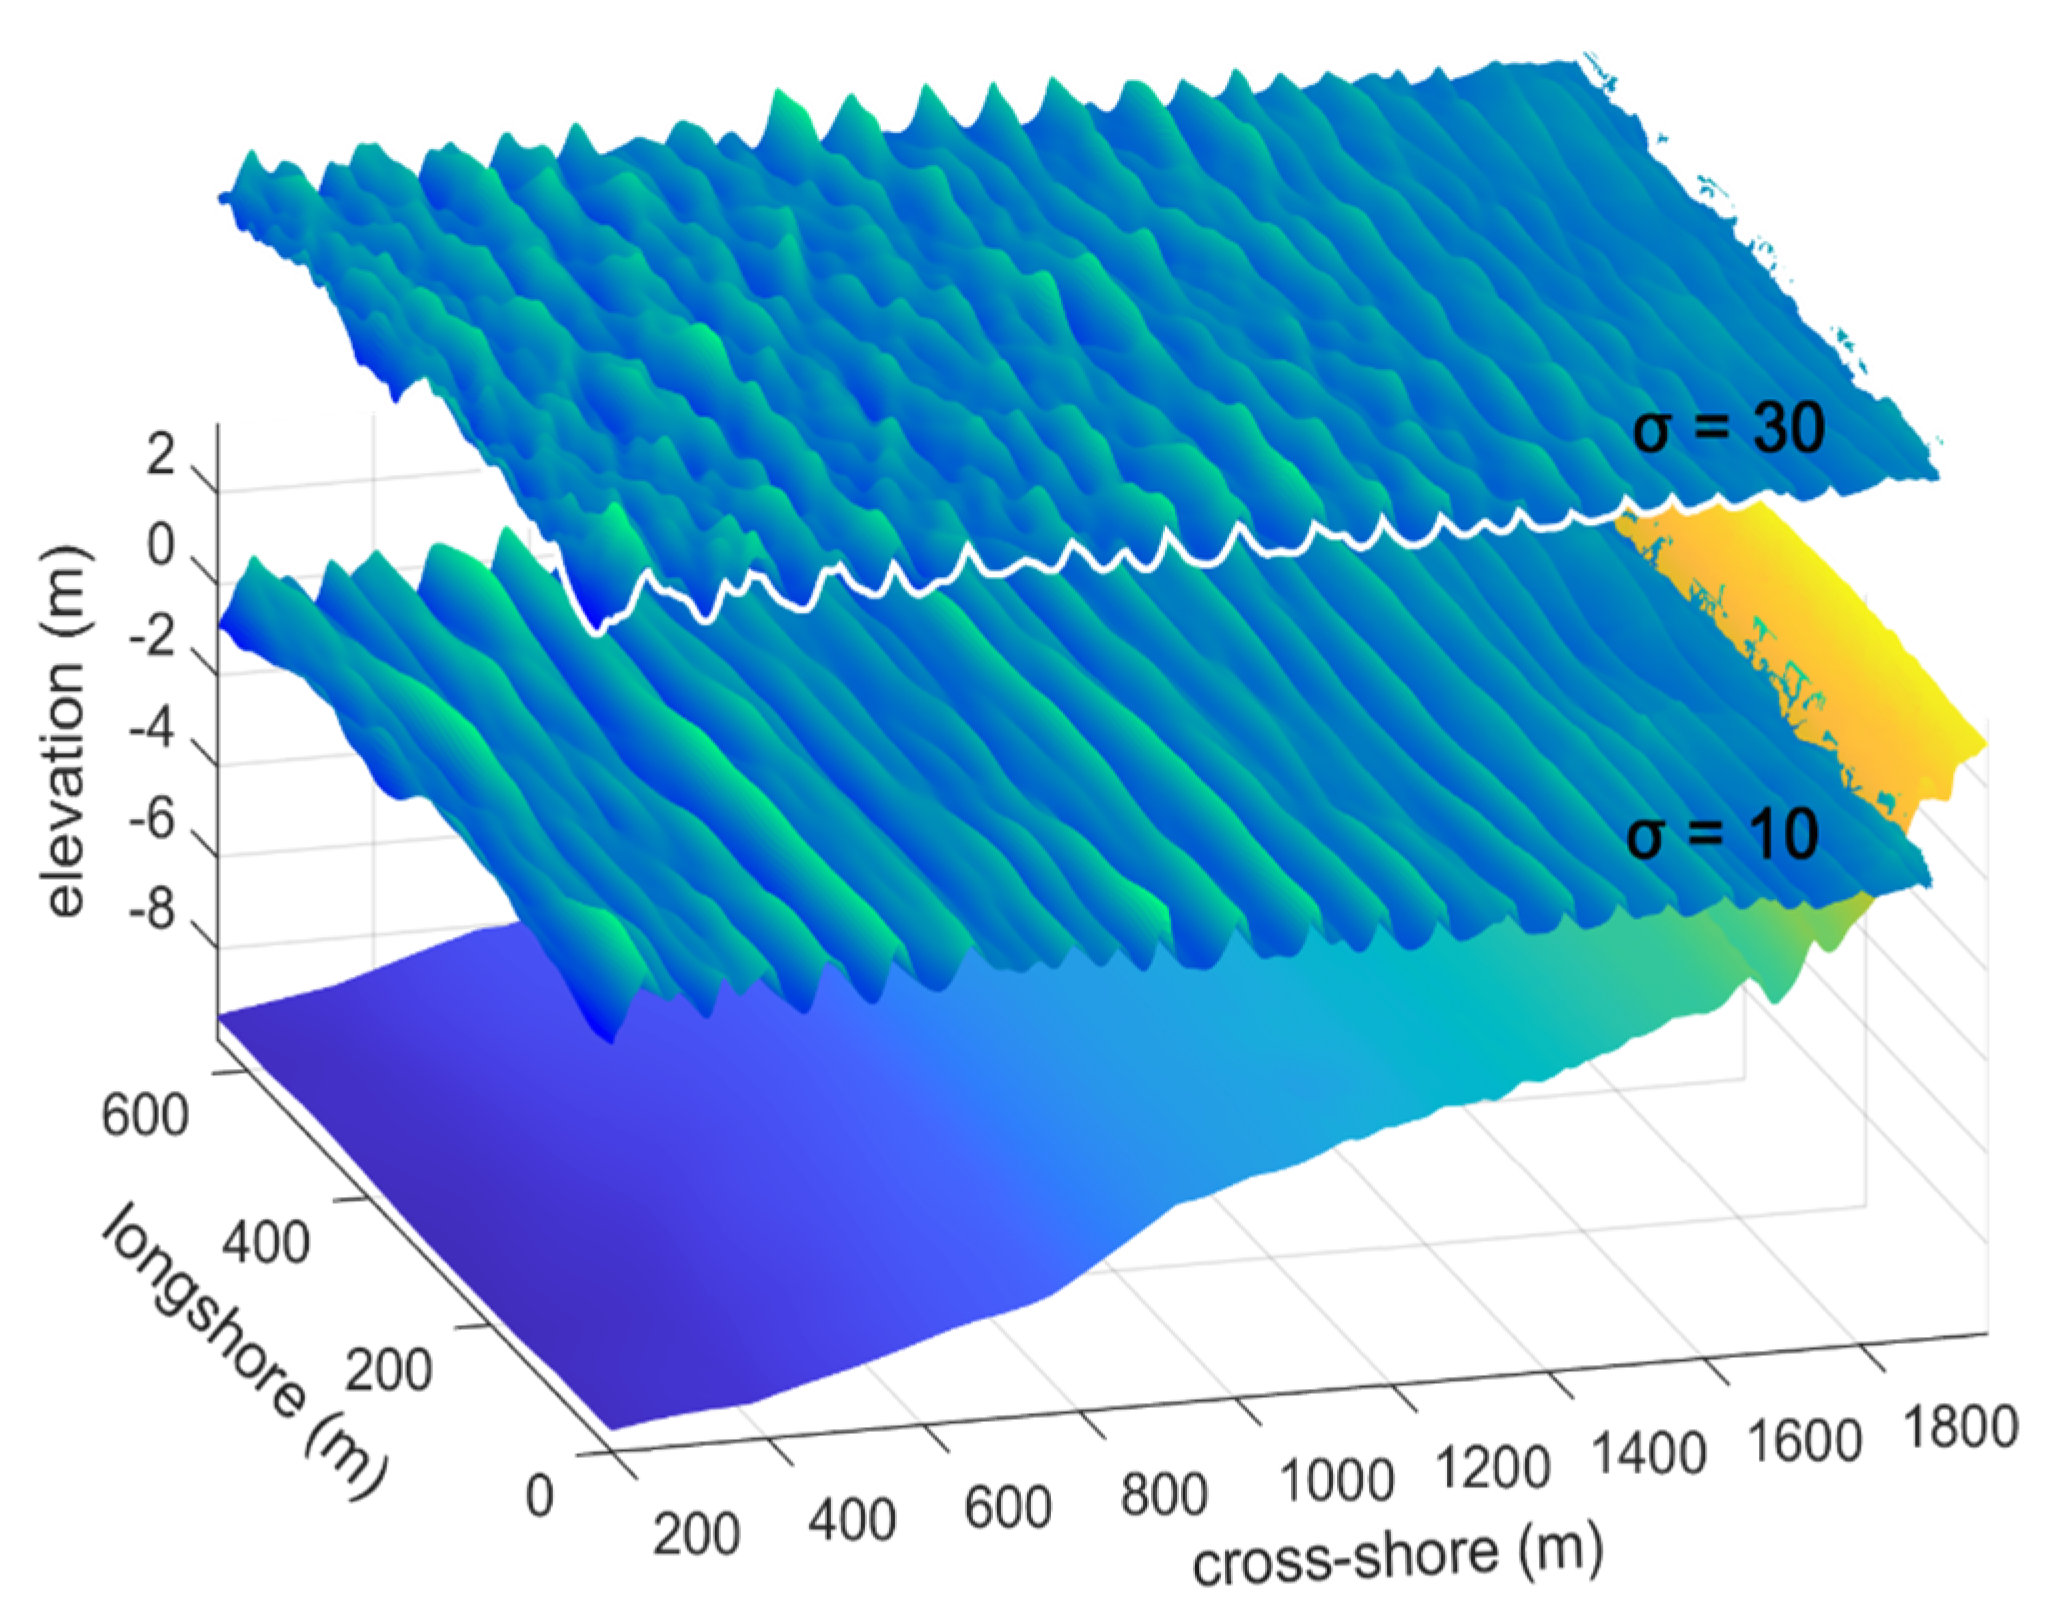
3.3. Setup of Inundation (Small-Scale) Simulations and Comparison with Large-Scale Modeling

The data reconstructed using the “Local Method” (Table 3) were used for the initialization of FUNWAVE-TVD for small-scale inundation modeling.
The boundary conditions for the small-scale simulations were generated starting from the wave characteristics Hs, Tp, and θ reconstructed at h = 5 m and 3.5 m for Senigallia and Oostende, respectively, and were applied as JONSWAP spectral waves at the same depths. The bathymetries used to simulate the small-scale inundation were the same as for the large-scale baseline simulations, with an increased spatial resolution of Δ x , Δ y = (1 m, 1 m). A video of wave propagation in a small-scale simulation for Senigallia with directional wave spreading σ = 10 is provided is the Supplementary Materials.
The envelope of the shoreline oscillations obtained during the coastal inundation modeling (at a small scale) was then compared to the envelope obtained from the baseline simulations (at a large scale). Figure 7 compares the small-scale and large-scale envelopes for the two investigated sites as a function of the wave spreading. In other words, each colored line represents the maximum runup locations reached during each simulation. A quantitative comparison of small-scale and large-scale inundation coordinates is also given in Figure 8, along with some error statistics. It can be observed that the small-scale modeling (input depth of 3.5 to 5 m) yields slightly smaller inundation levels than the corresponding large-scale modeling at all wave spreading levels. The largest differences are observed with a directionally narrow wave state ( σ = 2 ), with discrepancies as large as 20–25 m for Senigallia (yellow lines in Figure 7a) and 10–15 m for Oostende (yellow lines in Figure 7b). On the other hand, waves with a larger spreading ( σ = 30 ) yield much more comparable inundations.
The goodness-of-fit between large- and small-scale inundations can be also inferred from Figure 8. Although with some biases, like in Senigallia, for which inter-scale differences are the highest, small- and large-scale simulated inundations are always in good correspondence, as indicated by consistently high values of the coefficient of correlation p (0.94 to 1). This suggests that FUNWAVE-TVD, in the context of the approach presented here, can be applied to recreate wave dynamics at different scales quite reasonably, although not in absolute value. A better performance at Oostende is also highlighted by a smaller RMSE, which does not exceed 8 m.

4. Discussion and Conclusions

The present work illustrates the application of field observations and numerical modeling for the investigation of wave-driven flooding in coastal areas. The illustrated methodology, already tested in previous studies running a Nonlinear Shallow Water Equations solver over a simplified bathymetry and using zero-spreading/long-crested waves [22,23], was tested running a Boussinesq-type, open-source solver over two different bathymetries and using non-zero-spreading/short crested waves. This allowed us to inspect the performance of the method in modeling more realistic scenarios.
The application of the methodology to such new scenarios showed that fairly good results were achieved when comparing the maximum flooding obtained through baseline (large-scale) simulations to the maximum flooding obtained through inundation (small-scale) simulations. In particular, in the case of short-crested wind waves, i.e., characterized by relatively high spreading ( σ = 30 ), the comparison is extremely good, while long-crested waves (especially with small spreading σ = 2 ) provide worse comparisons, with the inundation simulations underestimating the wave runup and the flooded beach.
Such discrepancies may be due to the different momentum and radiation stress that characterize long-crested and short-crested waves. Specifically, the larger the wave spreading (i.e., the shorter is the wave crest), the smaller the radiation stress evaluated along the main wave propagation direction in deep waters [39]. This means that long-crested waves ( σ = 2 in our case) are characterized by higher radiation stress, which means that the waves are characterized by significant momentum in the large-scale simulations, which is not taken into account in the small-scale simulations, with the boundary condition being simply assigned in terms of water surface elevation. Such an issue is more evident where the boundary depth is larger, i.e., in the case of Senigallia, where h = 5 m.
On the other hand, the use of an open-access approach, in terms of the numerical solver (FUNWAVE-TVD), wave field data (Copernicus Marine Service), and bathymetry data (EMODnet), ensures a suitable application of the methodology to all the analyzed configurations, with good values of all statistical parameters used to evaluate the goodness of the maximum inundation prediction, i.e., RMSE not exceeding 8 m and a determination coefficient larger than 0.84.
A suitable application should be thus based on (i) a preliminary and thorough calibration of the used tools (radar-driven reconstructions and numerical model); (ii) a precautionary application of the boundary conditions, adopting zero- or almost-zero-spreading (independently of the actual length of the wave crests), in order to obtain larger/precautionary inundation values; (iii) an offshore boundary of the numerical domain located at a relatively small depth, to avoid inaccuracies in the model predictions due to the neglect of the wave momentum.
In conclusion, the present methodology could be applied to coastal communities with the aim of properly predicting the maximum inundation induced by wind and swell waves, either when data are available from the local authorities (as in the case of Senigallia) or when data are missing but can be retrieved for free through reliable web services (as in the case of Oostende). Furthermore, this methodology, especially in view of the scenarios analyzed in the present work, might be potentially implemented into warning systems aimed at alerting coastal communities about potential coastal flooding (e.g., [26]).
Further analyses are required, however, to better inspect the role of more complex environments, characterized by, e.g., nearby estuaries or particular morphologies like embayments or gulfs.
As for future developments, the potential of the short-range K-band radar, presented for the first time in [14], may be exploited to detect and study the nonlinear wave–wave interactions generated in the coastal zone, where both free and bound waves with different characteristics (length and period) persist [1,40].

Supplementary Materials

The following supporting information can be downloaded at: https://www.mdpi.com/article/10.3390/jmse11081504/s1, The supplementary video shows the wave propagation in the small-scale simulation of Senigallia with wave spreading σ = 10 .

Author Contributions

Conceptualization, M.P. and G.L.; Data curation, L.M. and G.L.; Investigation, L.M. and G.L.; Methodology, M.P. and G.L.; Supervision, M.P.; Validation, L.M.; Visualization, L.M. and G.L.; Writing—original draft, M.P., L.M. and G.L.; Writing—review and editing, M.P., L.M. and G.L. All authors have read and agreed to the published version of the manuscript.

Funding

This research was partially funded by the European Commission under the project SMART4ENV (grant number 101079251). The financial support from the PRIN 2017 program, funded by the Italian Ministry of Education, Universities and Research (grant number 20172B7MY9), is also acknowledged.

Institutional Review Board Statement

Not applicable.

Informed Consent Statement

Not applicable.

Data Availability Statement

The data presented in this study are available on request from the corresponding author.

Acknowledgments

The authors would like to thank the municipality of Senigallia for sharing the bathymetric survey.

Conflicts of Interest

The authors declare no conflict of interest.

Notes

1
2
3
https://marine.copernicus.eu/ (accessed 27 July 2023)
4

References

  1. Melito, L.; Postacchini, M.; Sheremet, A.; Calantoni, J.; Zitti, G.; Darvini, G.; Penna, P.; Brocchini, M. Hydrodynamics at a microtidal inlet: Analysis of propagation of the main wave components. Estuar. Coast. Shelf Sci. 2020, 235, 106603. [Google Scholar] [CrossRef]
  2. Intergovernmental Panel on Climate Change; IPCC’s Sixth Assessment Report; Cambridge University Press: Cambridge, UK; New York, NY, USA, 2021.
  3. Tebaldi, C.; Ranasinghe, R.; Vousdoukas, M.; Rasmussen, D.J.; Vega-Westhoff, B.; Kirezci, E.; Kopp, R.E.; Sriver, R.; Mentaschi, L. Extreme sea levels at different global warming levels. Nat. Clim. Chang. 2021, 11, 746–751. [Google Scholar] [CrossRef]
  4. Vousdoukas, M.I.; Mentaschi, L.; Hinkel, J.; Ward, P.J.; Mongelli, I.; Ciscar, J.C.; Feyen, L. Economic motivation for raising coastal flood defenses in Europe. Nat. Commun. 2020, 11, 2119. [Google Scholar] [CrossRef] [PubMed]
  5. Niemeyer, H.D.; Berkenbrink, C.; Ritzmann, A.; Knaack, H.; Wurpts, A.; Kaiser, R. Evaluation of coastal protection strategies in respect of climate change impacts. Die Küste 2014, 81, 565–578. [Google Scholar]
  6. Olbert, A.I.; Comer, J.; Nash, S.; Hartnett, M. High-resolution multi-scale modelling of coastal flooding due to tides, storm surges and rivers inflows. A Cork City example. Coast. Eng. 2017, 121, 278–296. [Google Scholar] [CrossRef]
  7. Mastrocicco, M.; Busico, G.; Colombani, N.; Vigliotti, M.; Ruberti, D. Modelling actual and future seawater intrusion in the variconi coastal wetland (Italy) due to climate and landscape changes. Water 2019, 11, 1502. [Google Scholar] [CrossRef] [Green Version]
  8. Neill, S.P.; Hashemi, M.R. In Situ and Remote Methods for Resource Characterization. Fundam. Ocean Renew. Energy 2018, 157–191. [Google Scholar] [CrossRef]
  9. Archetti, R. Quantifying the evolution of a beach protected by low crested structures using video monitoring. J. Coast. Res. 2009, 25, 884–899. [Google Scholar] [CrossRef]
  10. Rutten, J.; De Jong, S.M.; Ruessink, G. Accuracy of Nearshore Bathymetry Inverted from X-Band Radar and Optical Video Data. IEEE Trans. Geosci. Remote Sens. 2017, 55, 1106–1116. [Google Scholar] [CrossRef]
  11. Parlagreco, L.; Melito, L.; Devoti, S.; Perugini, E.; Soldini, L.; Zitti, G.; Brocchini, M. Monitoring for coastal resilience: Preliminary data from five italian sandy beaches. Sensors 2019, 19, 1854. [Google Scholar] [CrossRef] [Green Version]
  12. Huang, W.; Liu, X.; Gill, E.W. Ocean wind and wave measurements using X-band marine radar: A comprehensive review. Remote Sens. 2017, 9, 1261. [Google Scholar] [CrossRef] [Green Version]
  13. Benetazzo, A.; Serafino, F.; Bergamasco, F.; Ludeno, G.; Ardhuin, F.; Sutherland, P.; Sclavo, M.; Barbariol, F. Stereo imaging and X-band radar wave data fusion: An assessment. Ocean Eng. 2018, 152, 346–352. [Google Scholar] [CrossRef] [Green Version]
  14. Ludeno, G.; Catapano, I.; Soldovieri, F.; Gennarelli, G. Retrieval of Sea Surface Currents and Directional Wave Spectra by 24 GHz FMCW MIMO Radar. IEEE Trans. Geosci. Remote Sens. 2023, 61, 1–13. [Google Scholar] [CrossRef]
  15. Casella, E.; Rovere, A.; Pedroncini, A.; Mucerino, L.; Casella, M.; Cusati, L.A.; Vacchi, M.; Ferrari, M.; Firpo, M. Study of wave runup using numerical models and low-altitude aerial photogrammetry: A tool for coastal management. Estuar. Coast. Shelf Sci. 2014, 149, 160–167. [Google Scholar] [CrossRef]
  16. Armenio, E.; De Serio, F.; Mossa, M.; Petrillo, A.F. Coastline evolution based on statistical analysis and modeling. Nat. Hazards Earth Syst. Sci. 2019, 19, 1937–1953. [Google Scholar] [CrossRef] [Green Version]
  17. Postacchini, M.; Lalli, F.; Memmola, F.; Bruschi, A.; Bellafiore, D.; Lisi, I.; Zitti, G.; Brocchini, M. A model chain approach for coastal inundation: Application to the bay of Alghero. Estuar. Coast. Shelf Sci. 2019, 219, 56–70. [Google Scholar] [CrossRef]
  18. Favaretto, C.; Martinelli, L.; Ruol, P. Coastal flooding hazard due to overflow using a level II method: Application to the Venetian littoral. Water 2019, 11, 134. [Google Scholar] [CrossRef]
  19. Lo Re, C.; Manno, G.; Ciraolo, G. Tsunami propagation and flooding in Sicilian Coastal areas by means of a weakly dispersive boussinesq model. Water 2020, 12, 1448. [Google Scholar] [CrossRef]
  20. Briganti, R.; Torres-Freyermuth, A.; Baldock, T.E.; Brocchini, M.; Dodd, N.; Hsu, T.-J.; Jiang, Z.; Kim, Y.; Pintado-Patiño, J.C.; Postacchini, M. Advances in numerical modelling of swash zone dynamics. Coast. Eng. 2016, 115, 26–41. [Google Scholar] [CrossRef]
  21. Grilli, A.R.; Westcott, G.; Grilli, S.T.; Spaulding, M.L.; Shi, F.; Kirby, J.T. Assessing coastal hazard from extreme storms with a phase resolving wave model: Case study of Narragansett, RI, USA. Coast. Eng. 2020, 160, 103735. [Google Scholar] [CrossRef]
  22. Ludeno, G.; Postacchini, M.; Natale, A.; Brocchini, M.; Lugni, C.; Soldovieri, F.; Serafino, F. Normalized Scalar Product Approach for Nearshore Bathymetric Estimation from X-Band Radar Images: An Assessment Based on Simulated and Measured Data. IEEE J. Ocean. Eng. 2018, 43, 2758118. [Google Scholar] [CrossRef]
  23. Postacchini, M.; Ludeno, G. Combining numerical simulations and normalized scalar product strategy: A new tool for predicting beach inundation. J. Mar. Sci. Eng. 2019, 7, 325. [Google Scholar] [CrossRef] [Green Version]
  24. Bellafiore, D.; Zaggia, L.; Broglia, R.; Ferrarin, C.; Barbariol, F.; Zaghi, S.; Lorenzetti, G.; Manfè, G.; De Pascalis, F.; Benetazzo, A. Modeling ship-induced waves in shallow water systems: The Venice experiment. Ocean Eng. 2018, 155, 227–239. [Google Scholar] [CrossRef]
  25. Samaras, A.G.; Karambas, T.V. Modelling the impact of climate change on coastal flooding: Implications for coastal structures design. J. Mar. Sci. Eng. 2021, 9, 1008. [Google Scholar] [CrossRef]
  26. Melito, L.; Lalli, F.; Postacchini, M.; Brocchini, M. A Semi-Empirical Approach for Tsunami Inundation: An Application to the Coasts of South Italy. Geophys. Res. Lett. 2022, 49, e98422. [Google Scholar]
  27. Shi, F.; Kirby, J.T.; Harris, J.C.; Geiman, J.D.; Grilli, S.T. A high-order adaptive time-stepping TVD solver for Boussinesq modeling of breaking waves and coastal inundation. Ocean Model. 2012, 43–44, 36–51. [Google Scholar] [CrossRef]
  28. Hunt, I.A. Design of Seawalls and Breakwaters. J. Waterw. Harb. Div. 1959, 85, 123–152. [Google Scholar] [CrossRef]
  29. Stockdon, H.F.; Holman, R.A.; Howd, P.A.; Sallenger, A.H. Empirical parameterization of setup, swash, and runup. Coast. Eng. 2006, 53, 573–588. [Google Scholar] [CrossRef]
  30. Borge, J.C.N.; Rodríguez, G.R.; Hessner, K.; González, P.I. Inversion of marine radar images for surface wave analysis. J. Atmos. Ocean. Technol. 2004, 21, 1291–1300. [Google Scholar] [CrossRef]
  31. Ludeno, G.; Serafino, F. Estimation of the significant wave height from marine radar images without external reference. J. Mar. Sci. Eng. 2019, 7, 432. [Google Scholar] [CrossRef] [Green Version]
  32. Bell, P.S.; Osler, J.C. Mapping bathymetry using X-band marine radar data recorded from a moving vessel. Ocean Dyn. 2011, 61, 2141–2156. [Google Scholar] [CrossRef]
  33. Ludeno, G.; Flampouris, S.; Lugni, C.; Soldovieri, F.; Serafino, F. A novel approach based on marine radar data analysis for high-resolution bathymetry map generation. IEEE Geosci. Remote Sens. Lett. 2014, 11, 234–238. [Google Scholar] [CrossRef]
  34. Ludeno, G.; Brandini, C.; Lugni, C.; Arturi, D.; Natale, A.; Soldovieri, F.; Gozzini, B.; Serafino, F. Remocean system for the detection of the reflected waves from the costa concordia ship wreck. IEEE J. Sel. Top. Appl. Earth Obs. Remote Sens. 2014, 7, 2321048. [Google Scholar] [CrossRef]
  35. Fucile, F.; Ludeno, G.; Serafino, F.; Bulian, G.; Soldovieri, F.; Lugni, C. Some challenges in recovering wave features from a wave radar system. In Proceedings of the ISOPE International Ocean and Polar Engineering Conference, Rhodes, Greece, 26 June–1 July 2016. [Google Scholar]
  36. Baldoni, A.; Perugini, E.; Penna, P.; Parlagreco, L.; Brocchini, M. A comprehensive study of the river plume in a microtidal setting. Estuar. Coast. Shelf Sci. 2022, 275, 107995. [Google Scholar] [CrossRef]
  37. Postacchini, M.; Manning, A.J.; Calantoni, J.; Smith, J.P.; Brocchini, M. A storm driven turbidity maximum in a microtidal estuary. Estuar. Coast. Shelf Sci. 2023, 288, 108350. [Google Scholar] [CrossRef]
  38. Gao, J.L.; Chen, H.Z.; Mei, L.L.; Liu, Z.; Liu, Q. Statistical Analyses of Wave Height Distribution for Multidirectional Irregular Waves over A Sloping Bottom. China Ocean Eng. 2021, 35, 504–517. [Google Scholar] [CrossRef]
  39. Battjes, J.A. Radiation Stresses in Short-Crested Waves. J. Mar. Res. 1972, 30, 56–64. [Google Scholar]
  40. Kuznetsov, S.; Saprykina, Y. Nonlinear wave transformation in coastal zone: Free and bound waves. Fluids 2021, 6, 347. [Google Scholar] [CrossRef]
Figure 1. Sketch of the applied methodology.
Jmse 11 01504 g001
Figure 2. (a) Location of the two coastal sites (adapted from Google Earth). (b,c) Bathymetries for the two sites. Contours at 0.5 m intervals are traced with thin black lines. The 0 m contour is given with a thick black line. A different vertical scale is used.
Jmse 11 01504 g002
Figure 3. Numerical propagation of short waves over the Senigallia bathymetry (lower color map) in the baseline (large-scale) FUNWAVE simulations, for different wave spreading parameters: σ = 10 (middle color map) and σ = 30 (upper color map).
Jmse 11 01504 g003
Figure 4. Synthetic sea-wave image obtained using FUNWAVE-TVD (left) and simulated radar image (right) for the Oostende case with a directional spreading σ = 30 .
Jmse 11 01504 g004
Figure 5. Comparison between (left) ground-truth and (right) reconstructed bathymetry for Oostende case, with spreading σ = 30 .
Jmse 11 01504 g005
Figure 6. Comparison between (left) ground-truth and (right) reconstructed spatial map of significant wave height for Oostende case, with spreading σ = 30 .
Jmse 11 01504 g006
Figure 7. Large-scale (thick lines) and small-scale (dotted lines) inundations modeled at (a) Senigallia and (b) Oostende for different wave spreading parameters ( σ = 2 : yellow; σ = 10 : red; σ = 30 : blue). Each colored line represents the maximum runup locations reached during each simulation.
Jmse 11 01504 g007
Figure 8. Comparison of cross-shore coordinates of small-scale vs. large-scale inundation for (ac) Senigallia and (df) Oostende, as a function of the wave spreading parameter. Classical error statistics (correlation coefficient p, RMSE, and coefficient of determination R2) are given for each case.
Jmse 11 01504 g008
Table 1. Main wave characteristics at the offshore boundary.
Locationhoff
(m)
Hs
(m)
Tp
(s)
σ
(deg)
Senigallia101.8132, 10, 30
Oostende51.75.82, 10, 30
Table 2. Statistics analysis of the bathymetric reconstruction.
SenigalliaOostende
σ
(deg)
R2
(m)
RMSE
(m)
R2
(m)
RMSE
(m)
20.971.010.940.28
100.970.860.940.34
300.980.770.950.36
Table 3. Mean wave parameters (significant height Hs, peak period Tp, peak length Lp, main direction θ ) at different isobaths as a function of spreading. The wave conditions reconstructed at a depth h = 5 m for Senigallia and h = 3.5 m for Oostende (table lines with grey background) are used to initialize the small-scale simulations.
Senigallia
Wave Parameters H s m L p   m θ   ° N T p s
σ   d e g 21030210302103021030
Depth h
(m)
30.450.460.446262.562000121210.5
40.670.670.636262.562000121110.5
50.750.790.726574.77300011.51010.5
60.770.750.7083838300010.51110.5
70.850.770.758383830001111.510.5
80.80.750.70838383000111110.5
Oostende
Wave Parameters H s m L p   m θ   ° N T p s
σ  (deg)21030210302103021030
Depth h
(m)
30.220.220.203635.634.60006.76.36.27
3.50.350.350.353635.6350006.46.256.13
40.480.500.473635.635.70006.26.15.8
Disclaimer/Publisher’s Note: The statements, opinions and data contained in all publications are solely those of the individual author(s) and contributor(s) and not of MDPI and/or the editor(s). MDPI and/or the editor(s) disclaim responsibility for any injury to people or property resulting from any ideas, methods, instructions or products referred to in the content.

