Article

Effect of Void Content on the Mechanical Properties of GFRP for Ship Design

1
Department of Ocean System Engineering, Graduate School, Mokpo National Maritime University, Mokpo 58628, Republic of Korea
2
School of Naval Architecture and Maritime, Zhejiang Ocean University, Zhoushan 316022, China
3
Department of Naval Architecture and Ocean Engineering, Mokpo National Maritime University, Mokpo 58628, Republic of Korea
*
Authors to whom correspondence should be addressed.
J. Mar. Sci. Eng. 2023, 11(6), 1251; https://doi.org/10.3390/jmse11061251
Submission received: 9 May 2023 / Revised: 30 May 2023 / Accepted: 16 June 2023 / Published: 19 June 2023
(This article belongs to the Section Ocean Engineering)

Abstract

:
Defects such as voids in composite materials often degrade the mechanical properties of laminates. Even if these materials are manufactured based on the design requirements, there is a possibility of instability occurring in these composite structures. In this study, several prototypes were developed based on changes in composite ship design conditions (glass fiber weight fraction and fabric combination type) using a hand lay-up approach. The fabrication quality was quantitatively defined using the burn-off test, and statistical analysis was performed. A combination of chopped strand mat and woven roving material laminates possessed relatively less void content in the entire glass content (Gc) region (30–70 wt%) compared to a chopped strand mat single-material laminate. The effect was more pronounced in the high-Gc region (50–70 wt%) than that in the normal-Gc region (30–50 wt%). The composite hull plate can be designed seamlessly according to changes in fabrication quality. To ensure safety, the thickness of the laminate must be greater than that specified in the ISO standards, regardless of the combination type in the normal-Gc region. As a result of the void content considered, the flexural strength in the single laminate decreased by 15.02%. Furthermore, 3.33% of the flexural strength calculation decreased in the combined laminate compared to that in the ISO rules. Thus, a single CSM material can be designed to be thicker than a combined-material laminate with the same Gc, while considering the void content on the mechanical properties.

1. Introduction

In fiber-reinforced plastic (FRP) laminates, manufacturing characteristics and environments are the primary causes of inner defects, such as porosity, voids, and delamination. The volume occupied by a void is considered to possess “zero property”, that is, no mechanical strength and zero density [1]. Inner defects can significantly degrade the mechanical properties of FRP laminates, such as the tensile strength [2], flexural strength [2], interlaminar shear strength [2,3,4], and compressive strength [5]. In addition, when an FRP structure is subjected to load or fatigue load, inner defects, especially those at the interface, can increase delamination [6,7]. When delamination growth is induced by inner defects, the fatigue strength of the FRP laminate decreases (Figure 1) [8,9,10,11]. Furthermore, prolonged exposure to a sea environment can increase the possibility of structural failure [12,13,14].
Inner defects such as voids in FRP laminates can occur because of several factors, and it is difficult to identify and suppress each of these factors beforehand. This is because defects can be caused by environmental factors, such as temperature and humidity, during production, and other factors such as the proficiency of the laminate manufacturer, manufacturing method, type of reinforcing material used, and viscosity of the base material. To reduce such inner defects, several studies have analyzed the void content (volume content) for different lamination methods [16,17] and lamination sequences [18]. Sophisticated quality inspection methods such as ultrasonics, infrared thermography, shearography, and radiography are primarily used for relatively thin composite structures in the aerospace industry [19].
For composite ships, the laminate thickness is relatively larger than that in other fields; the value is in the range of 5–20 mm (Figure 2a). For naval and cost ships, the laminate thickness is in the range of a few tens of millimeters [20]. However, in the field of FRP shipbuilding, simple visual inspection is still widely used, and no special high-precision inspections are required.
The hand lay-up method (Figure 2b) is the most widely adopted manufacturing method, and is preferred over vacuum assisted resin transfer molding (VARTM) and infusion methods [22,23,24]. When this method is adopted for manufacturing composite ships, a higher amount of resin is used compared to composites used in other fields [24], which can generate a relatively large amount of void content [3]. Furthermore, the FRP laminates used in composite ships tend to be thicker because these ships are manufactured in small shipyards [25,26]; therefore, the possibility of inner defects such as voids is relatively high.
The quality of laminates can help to improve the safety of composite ships, which can be achieved by enhancing the manufacturing environment and the aforementioned method. However, these changes are accompanied by considerable economic burden. Therefore, understanding the uncertainty related to manufacturing quality considering various design conditions in the design stage is necessary to effectively improve the stability of FRP ships. Despite such uncertainties, shipyards are highly experienced in combining two types of fabrics to fabricate laminates, which are known to result in better quality and performance.
In the recently updated ISO standard 12215 [27], fabric combination, building quality factor, and assessment method factor were added as design factors for designing the hull plate. These factors assign specific weights to the quality based on the impregnation rate and the presence of the tested material. Apart from these factors, other design variables also affect production quality [25,26]. Thus, the classification society rules for ship design, construction, and inspection have not reflected these design elements [28,29,30,31].
In this study, we aim to quantitatively analyze the impact of variations in common design conditions such as Gc and fabric combination on the fabrication quality of laminates. To achieve this, laminates consisting of a single fabric and laminates combining two different fabrics were fabricated according to variations in Gc, and the inner defect and void content were measured. Thus, we proposed a design direction for composite ship structures by considering the effects of such design condition variations on inner defects.

2. Methodology

2.1. Composite Ship Design Condition and Variable Determination

The thickness of the laminate of composite ship structures is determined based on vessel displacement, speed, division of structures, spacing of stiffeners, design pressure, and other mechanical properties such as the strength of the composite laminate. The mechanical properties of composite structures are useful for determining the thickness because they directly affect structural safety. Design conditions that determine the strength of these composite structures include variables such as the type of fiber, reinforcement form, and glass fiber content (glass fiber weight fraction, Gc) [25].
The glass fiber content, Gc, helps to determine the strength of GFRP structures. In the rules, the Gc for developing GFRP structures is restricted to the range 30–70 wt% [28,32]. Figure 3 shows the relationship between Gc and the strength presented in the FRP ship structure design rule provided by the ISO international standard [27,33] and the rules of classification society [28,29]. The blue line in Figure 3 represents the ASTM D 790 [34] test result of the actual GFRP laminate manufactured in accordance with the design conditions. The figure shows the strength estimation based on the rules and the actual experimental results for the correlation between the weight fraction and strength of the glass fiber [35].
As shown in Figure 3, the equations for estimating the physical properties presented in the regulations confirm that the mechanical properties of the laminate increase with Gc. Using this physical property estimation formula, Gc is increased to improve the structural safety of the hull plate, which reduces the overall weight and enables an eco-friendly structure [25,35]. However, these outcomes can only be achieved when considering the assumption that the GFRP laminate is fabricated according to the design requirements. A comparison of the theoretical physical property estimation equation and the experimental results indicate that the experimental results for the specimens prepared by mixing 450 g of chopped strand mat (CSM) and 570 g of woven roving (WR) per unit area are better than those obtained using the estimated formula. The physical property estimated according to the regulations considers a certain level of safety margin. In addition, it is extremely difficult to control the void, which is the inner defect of the FRP laminate. Therefore, FRP laminates in shipbuilding typically contain less than 3% voids [3]. However, unlike the physical property estimation formula, the experimental results using 50 wt% Gc show that the flexural strength decreases rather quickly. This is because the amount of glass fiber increases and the amount of resin decreases. In addition to voids in the laminates, resin-starving also leads to inner defects, which result in the further deterioration of the physical properties. Thus, the fibers in the laminate are widened and inner defects such as voids occur, which further degrade the physical properties. Therefore, the quality of the laminate is closely related to the strength, and a building quality factor based on the recently revised ISO 12215 is introduced to ensure the quality of the laminate. The weight of the property estimation formula based on quality is presented accordingly. However, this factor is integrated without considering that the quality of the laminate can change when Gc increases [27]. Thus, it is necessary to confirm the change in the inner defect according to Gc.
Material combination is another important design variable. Materials such as carbon fiber and glass fiber are commonly used in composite ships. Although carbon fiber has been studied recently for use in special purpose vessels such as luxury yachts and ships due to its high strength and ultra-lightweight properties [37], E-glass fiber is still preferred. A combination of CSM and WR E-glass fibers are typically used; however, a single CSM fabric is used in small ships [38]. The physical properties of the laminate may vary depending on the orientation of the fabric used in the FRP laminate [39,40]. Although WR fabrics can improve the physical properties to a certain extent, the quality of the laminate varies based on the combination of fabrics used, which results in a difference in the physical properties [7,41]. Figure 3 shows that, according to the recently revised ISO standard (2019), the physical properties of composite laminate materials are estimated in accordance with the weaving method and fabric combination. However, these factors have not yet been incorporated into the rules of other classification societies [25]. In fact, there are various types of inner defects besides voids, but they are not explicitly addressed, and the fabrication method and types of fabric are applied to the design as coefficients and margins. The quantity of fiber has the greatest impact on thickness determination, and void content can influence it. Therefore, in this study, void content is defined as an inner defect, and the void content measured through the burn-off test was assumed as the scale.

2.2. Review and Determination of FRP Laminate Manufacturing Defect Confirmation Method

The methods used for checking defects inside the laminate are categorized into nondestructive and destructive testing methods. The former includes X-ray computed tomography (CT) and ultrasonic testing, while the latter includes the burn-off test and serial sectioning. The advantages and drawbacks of various testing methods are summarized in Table 1, which indicates that the burn-off test is superior in terms of time and accuracy [4,42].

2.3. Research Method

According to the findings in Section 2.1 and Section 2.2, a hull plate was manufactured based on the design of laminate structures and the fabrication conditions of small vessels less than 24 m and 20 tons; these vessels possess the highest occupancy rate among GFRP ships. Two different groups were designed: a single-material laminate using only CSM and a combined CSM and WR laminate. The Gc varied in the range of 30–70 wt%, which is the actual use area, and the hand lay-up method was adopted to manufacture the small vessel. It is relatively easy to measure the inner defects in the GFRP hull plate using the burn-off test method recommended by the ISO international standards [27]. The main objective of this experiment was to generate and quantify voids in accordance with ISO guidelines. In other words, the quantity of defects generated inside the laminate manufactured according to the design conditions was measured using this approach [45].
The amount of void content generated according to the change in Gc and fabric combination was analyzed statistically. The void content according to the Gc change for the single- and combined-material groups was analyzed using the analysis of variance (ANOVA) approach [46]. Furthermore, this content was analyzed using the analysis of covariance (ANCOVA) [46], and in this approach, the Gc, which changes simultaneously in both groups, was set as the covariance.
In addition, a design method was proposed based on the physical property estimation formula presented in ISO 12215 to clearly understand the change in fabrication quality according to the change in Gc and fabric combination in the design stage.

3. Design and Manufacture of GFRP Laminate According to Gc and Fabric Combination Changes

The materials used for fabrication included E-glass fiber, which is a combination of CSM (450 g/m2) and WR (570 g/m2), and polyester, which was used as the resin [47,48]. The relative densities of materials constituting the laminates were measured using a hydrometer [49]; all fibers were 2.62 g/cm3 and the cured polyester resin was 1.22 g/cm3. E-glass fiber attained a tensile strength of 3.75 × 10² MPa. The information regarding the designed laminates is summarized in Table 2 and Table 3. The fabricated laminates were cut with a waterjet into 30 mm × 30 mm specimens for a burn-off test to check for internal defects (Figure 4). There was a slight difference in the design Gc of the two groups. This was caused by the difference in weight per unit area of the two fabrics, CSM and WR, and thus, the Gc of the two groups could not be equalized.

4. Verification of Laminate Quality According to Gc and Fabric Combination Change as per Burn-Off Test

The burn-off test was adopted to identify the internal defects in the GFRP laminate. In single- and combined-material specimens, five specimens were analyzed according to all Gc values, and a burn-off test was conducted on a total of 50 specimens. The burn-off test was conducted based on the ASTM D3171 standards [50], and the furnace [51] was heated to 600 °C and burned for approximately 2 h. After cooling in a desiccator, the weight was measured, and additional burning was performed for 30 min until the change in weight was within 0.001 g. Finally, the polyester was burned and the weight of the remaining fiber was measured accordingly. The results of Gc and void content according to the burn-off test are summarized in Figure 5. The glass content (Gc, wt%) and void content (Vv, %) of each specimen were, respectively, calculated using [50].
G c = M f / M i × 100 ,
V v = 1 M f / M i × ρ c / ρ f M i M f / M i × ρ c / ρ r × 100 ,
where Mi and Mf are the weights of the specimens before and after calcination (g), ρ f represents the density of the glass fiber (g/cm3), ρ r represents the density of the resin matrix (g/cm3), and ρ c represents the density of the laminate (g/cm3).
The burn-off test results confirmed that a void content less than 3%, which is generally present in the normal-Gc (30–50 wt%) range, was present in both groups regardless of the fabric combination. However, in the high-Gc range (50–70 wt%), the void content varied according to the fabric used. For the single-material specimens, the void content increased rapidly from 50 wt% of Gc, and in the case of combined-material specimens, a void content of over 3% was present for 60 wt% of Gc. This indicates that the void content increases faster with the increase in Gc for the single-material specimen compared to that for the combined specimen.
This is because the value of Gc can be more easily increased in the combined-material specimens than in the single-material specimens using only CSM, and this may further reduce the number of plies [16]. Moreover, it was confirmed that the measured Gc was slightly different from the designed Gc in the high-Gc region in both groups. It was difficult to maintain a high Gc because the hand lay-up method was adopted.

5. Analysis of the Correlation between Gc, Fabric Combination Type, and Laminate Quality

The void content of the GFRP laminate was analyzed according to the change in Gc and fabric combination by using ANOVA and ANCOVA techniques to examine whether the results of the burn-off test were statistically significant. The statistical analysis results revealed that the correlation between Gc, fabric combination, and fabrication quality was determined using statistical methods.

5.1. Impact of Gc on Laminate Fabrication Quality

In the ANOVA analysis, the void content of all Gc values in the two groups satisfied the normality and homogeneity of variances. For each group of single- and combined-material specimens, the ANOVA analysis was conducted for each Gc level, and the results are summarized in Table 4 and Table 5. For single- and combined-material specimens, the degree of freedom was (4, 20), and the critical value of F was 2.87 for a significance level of 0.05. According to the ANOVA results, the F-value for the single-material specimens was 61.36, which was greater than the critical value of F (2.87). The p-value was 6.04 × 10⁻¹¹, which was less than the significance level of 0.05. Furthermore, each Gc level has at least one level of void content, and it was observed that the averages were different. In the case of the combined-material specimens, the F-value was 22.1 and the p-value was 4.18 × 10⁻⁷ according to the ANOVA table.
In both groups, the difference in the high-Gc region was larger than that in the normal-Gc region because it was difficult to fabricate a good-quality high-Gc laminate using the hand lay-up method. The void content varies according to the change in Gc level, and, therefore, the Gc of the two fabric combinations has a significant effect on the fabrication quality.
A post hoc test [52] was conducted to determine the groups of single and combined species in which the Gc value varied. In this case, the post hoc test method allows a pairwise comparison of all groups because the number of samples to be compared is the same. A significance level of 0.05 is used throughout the Tukey method [52], which is a pairwise post hoc test method. The test and grouping results are presented in Figure 6 and Table 6, respectively.
Table 6 shows that the specimens are classified into four groups according to the average difference in void content by Gc. Group A consists of specimens with good laminate quality and a void content of 0–3% [3], group B is a normal group with a void content of 3–5%, group C is a poor group with a void content of 5–10%, and group D consists of specimens with a Gc greater than or equal to 10% and is marked as being a very poor group. For specimens with Gc in the range of 60–65 wt%, the single- and combined-material specimens possess good and normal fabrication quality. However, the fabrication quality of the Gc 70 wt% single-material and combined-material specimens is very poor. Thus, these values can be considered to be statistically significant. These outcomes suggest that the effect of Gc on void content is not significant in the low-Gc regions, and in the case of high Gc, the effect of Gc on void content is greater.

5.2. Analysis of the Relationship between Fabric Combination and Laminate Fabrication Quality

The effect of change in the fabric combination of GFRP laminates on the fabrication quality was analyzed. The ANCOVA method was used because Gc has a significant effect on void content; furthermore, Gc was set as the covariance when analyzing the relationship between fabric combination and void content.
ANCOVA is a blend of ANOVA and regression. When using the ANCOVA technique, the normality test and homogeneity of variances must be satisfied, in addition to two other preconditions. Furthermore, the linearity of regression between the covariance and the dependent variable and the homogeneity of the regression slope must also be satisfied. The correlation between the fabric combination and void content was identified while checking the preconditions.
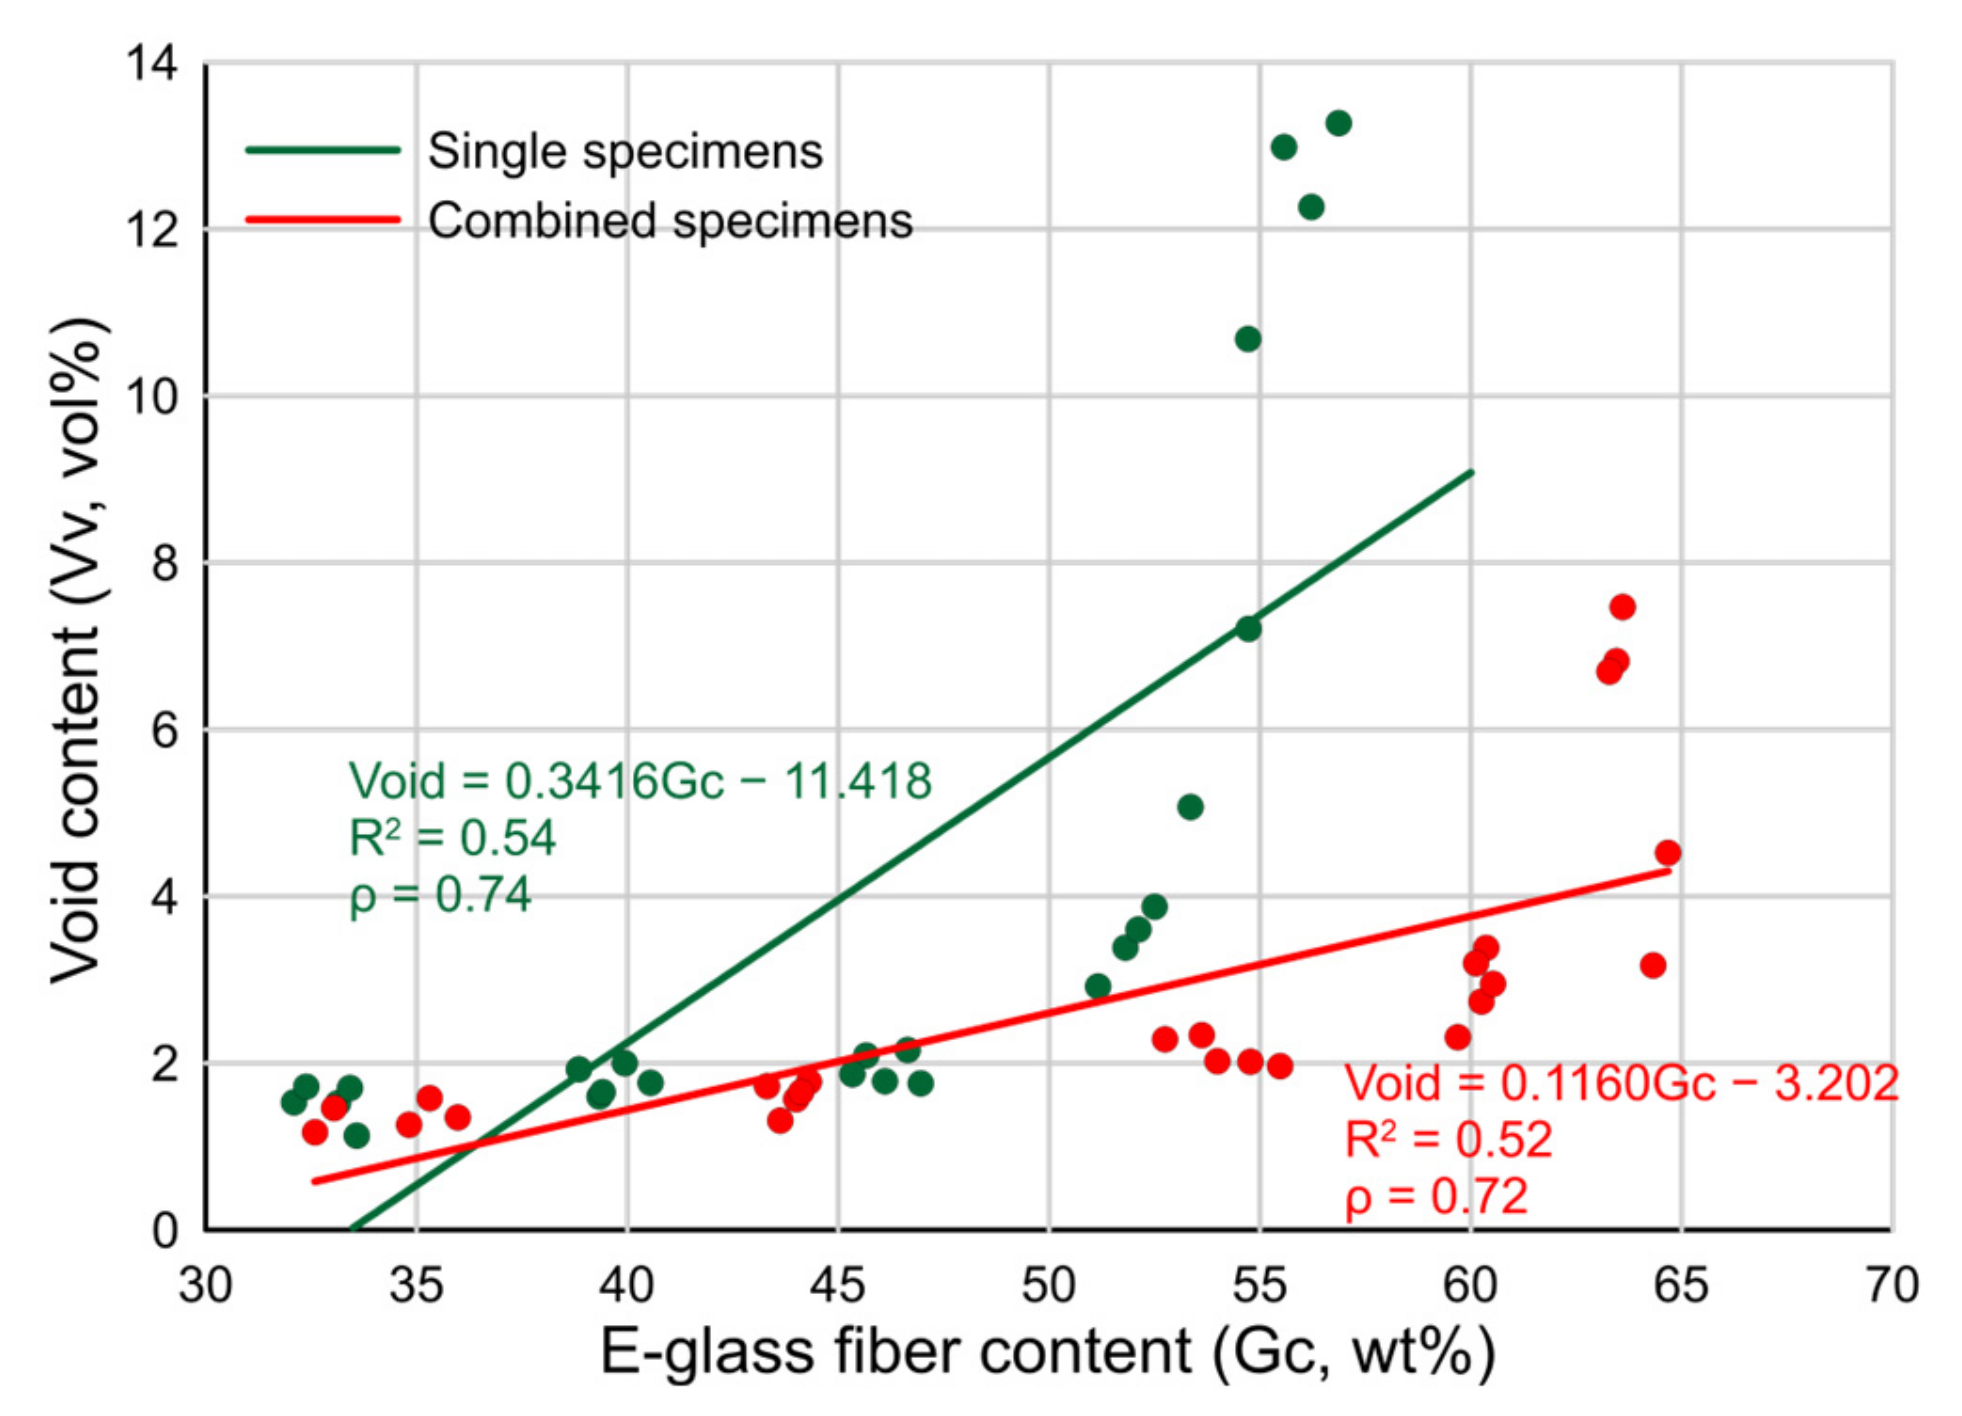
The normality test and homogeneity of variances were previously satisfied, and the additional preconditions were analyzed. Pearson’s correlation analysis was performed to confirm whether there was a linear relationship between Gc and the void content to verify the linearity between the covariance and the dependent variable. The analysis results are presented in Figure 7. The correlation coefficient (ρ) of single-material specimens was confirmed to be 0.74, and for the combined specimens, ρ was 0.72, which confirmed that both groups had a strong linear relationship. These results indicate that the effect of Gc on void content is statistically significant. In addition, a regression model was added to the results of the correlation analysis for each of the two fabric combinations to check whether the homogeneity of the regression slope was satisfied (Figure 7). The coefficient of determination (R2) was 0.54 and 0.52, respectively, and as a result, the regression model was statistically significant. However, it can be inferred that there is an interaction between Gc and the independent variable fabric combination (Figure 7 and Table 7).
Table 7 confirms that a change in the fabric combination has a significant effect on void content (F-value 6.92; p-value 0.0116). However, the effect of the fabric combination on the void content cannot be identified collectively in the entire Gc region because the trend of change in the void content of the two fabric combinations according to Gc, which is the covariance, is different and there is a certain interaction.

5.3. Analysis of the Relationship between Fabric Combination and Laminate Fabrication Quality Based on the Gc Region

In general, for Gc values equal to or greater than 0.5, it is difficult to maintain the fabrication quality when manufacturing GFRP hull plates [22,39]. For hull plate manufacturing, the Gc values in the normal-Gc region (30–50 wt%) are more commonly applied [20,23,24]. In addition, to investigate the effect of the fabric combination on the void content results, the Gc values were divided into two groups: normal Gc (30–50 wt%) and high Gc (50–70 wt%).
The corresponding data of the classified Gc regions were re-analyzed to confirm that they sufficed the precondition of ANCOVA. For the homogeneity of variances, all conditions were assumed to be satisfied. In addition, Pearson’s correlation analysis for the void contents classified into each section (ρ = 0.65–0.96, Figure 8) confirmed that linearity was satisfied. Therefore, it was confirmed that the normal-Gc interval satisfies the homogeneity of the regression slope at a significance level of 0.05 (significance level: 0.05; p-value = 0.80). Therefore, it can be inferred that the regression slopes were different from each other (significance level: 0.05, p-value = 3.55 × 10⁻⁷).
The outcomes of the aforementioned analysis confirm that the interaction occurred in the high-Gc region. However, the slopes of both models show an increasing trend. Therefore, for the high-Gc region, the significance of the void content according to the change in the Gc and fabric combination can be evaluated by determining the significance of the void content for 50 wt% specimens with Gc, which exhibits the smallest difference between the regression line slope and the two regressions. In the normal-Gc region, ANCOVA analysis can be performed directly.
The void content regression slopes according to the changes in Gc in the normal-Gc and high-Gc regions were compared. In the normal-Gc region, the slopes of the regression models of the two groups are similar and tend to increase even with a small increase in Gc. However, in the high-Gc region, the slope of the regression model of the single-material specimens was greater than that of the combined-material specimens by a factor of 6.46. This implies that the increase in void content in single-material specimens is greater than that in combined specimens, as Gc increases by a factor of 6.46. These results are the reason why the interaction occurred when the void content was analyzed for all of the sections in Figure 7.
We also checked whether there was a significant difference in the predicted value of void content based on the change in the fabric combination in each Gc region. For the normal-Gc region, when the Gc is at 30 wt% according to the regression model of the single- and combined-material specimens, approximately 15% lower combined specimens were found compared to the single-material specimens; the difference was also significant (significance level: 0.05, p-value = 0.00306). For the high-Gc region, the slopes of both regression models exhibited an increase, and, therefore, the Gc with the smallest difference between the two regression models determines the significance of the void content of 50 wt% specimens. Therefore, the significance of the void content was evaluated based on the change in fabric combination. These results confirm that the difference (1.65%) in each void content of the single- and combined-material specimens was statistically significant (significance level: 0.05, p-value = 0.011).
Thus, the analysis results of fabric combination and void content in the normal- and high-Gc regions confirm that the decrease in the void content is more statistically significant for the combined-material specimens than for the single-material specimens in both regions. For the high-Gc region, there was a significant difference in voids generated according to the change in the fabric combination. Figure 9 shows the dimensionless results obtained by normalizing the analysis results from Figure 8 using the fiber content guidance based on fabric types proposed in ISO 12215 (2019). In ISO 12215 (2019), a default value of 0.3 is suggested for CSM, and when CSM and WR are combined, a default value of 0.410 is proposed for Gc. As observed in Figure 9, even when considering the characteristics of fabric types, the Gc/ISO Gc guidance exhibits significant deviation of approximately 1.5. In particular, for single-material specimens using only CSM, there was a noticeable deviation from the ISO recommendation in the region beyond 1.5. Once again, the decrease in void content due to fabric combination was confirmed.

6. Design Direction for Composite Hull Structure According to Fabrication Quality

The analysis of the manufacturing quality (void content) based on changes in Gc and fabric combination confirmed that they were statistically significant. Previous studies confirmed that defects such as voids directly affect the physical properties of the laminate. In this chapter, considering the effect of these voids on physical properties, we will discuss the design direction based on fabrication quality. We used the hull plate thickness design and physical property estimation formulas presented in the ISO international standard for the analysis [27]. Equation (3) is the estimation formula of the required thickness of the hull plate presented in the ISO international standard, and it considers the flexural strength when designing the main structural material. However, if the thickness decreases, rigidity issues may exist that require longitudinal strength evaluations to be conducted. In this study, the analysis focused solely on the thickness, excluding these considerations. In this paper, it is explained by the change in flexural strength based on the void content.
T p = b × k c × P × k 2 b 1000 × 0.5 × R m f
where b, kc, k2b, P, and R m f represent the short dimension of the design area (m), curvature correction factor, coefficient of the long dimension/short dimension ratio of the design area, design pressure (kN/m2), and flexural strength of the laminate, respectively.
According to Equation (3), the required thickness of the hull plate increases when the flexural strength of the laminate decreases. When defects such as voids occur in the GFRP laminate, the flexural strength decreases because this part is manufactured using a Gc value lower than the designed value, given that it additionally occupies the volume as an empty air pocket. In accordance with this correlation, we analyzed how it is more reasonable to design according to the void content in the entire Gc region. Therefore, Gc, which is the weight ratio of fibers defined so far in this chapter, was converted into a volume ratio, and then it was analyzed by estimating the flexural strength presented in the ISO regulations. This is because the void content is the total volume ratio of the space composed of empty air pockets that excludes the solid space of fibers and resins in the composite material laminate.
Parameters for the comparative analysis of the flexural strength estimation formula of the ISO international standard were selected for the two types of fabric combinations, single and combined, and the 30.00 wt% Gc range and 60.00 wt% Gc range were used. A Gc of 30.00 wt% (16.64 vol%), which is used for manufacturing primary structural materials such as hull plates of small ships, was achieved using the hand lay-up method. A Gc of 60.00 wt% (41.12 vol%) was used for the production of substructural materials such as stiffeners. Thus, the value of Gc according to the void content was also calculated.
For a Gc of 30 wt%, the void contents of 1.46% and 1.25% were applied for the single and combined material in accordance with the regression analysis formula for each fabric combination (Figure 8), respectively. For the 60 wt% Gc, which exists in the high-Gc region, the void contents of 20.21% and 3.79% were applied for the single and combined materials, respectively. The results of the comparison of Gc before and after considering the void content are presented in Table 8, and the estimation results for the flexural strength are illustrated in Figure 10.
Table 8 indicates that, in the case of Gc at 30 wt%, the change in Gc was 0.37% for the single-material laminates and 0.32% for the combined-material laminates. Furthermore, a very small decrease was confirmed. For Gc at 60 wt%, the single- and combined-material laminates decreased by 4.21% and 1.51%, respectively. In other words, the case of Gc at 30 wt% remained almost the same regardless of the fabric combination change. However, the decrease in Gc for the single-material laminate in the case of Gc at 60 wt% was greater than that for the combined-material laminate by a factor of 4.6.
Figure 10 shows that, unlike ISO 12215 (2008), ISO 12215 (2019) estimates have different physical properties according to the change in fabric combination. Furthermore, it suggests a higher flexural strength of the laminate. The effect of the change in Gc according to the difference in the void content on the flexural strength is the same in normal Gc, as evident from the analysis results of the changes in Gc. However, for the case of 30 wt% Gc, the strength decreases by approximately 15% and 3% for the single- and combined-material laminates. Furthermore, the strength decreased according to the fabric combination by a factor of five.
Therefore, it can be inferred that there are no significant changes in the case of Gc with a 30 wt% laminate, even if it is manufactured according to the design regulations. However, in the case of Gc at 60 wt%, the value can vary based on the design regulations, which result in safety issues post-manufacturing. To overcome this issue, the effect of void content on the strength must be considered in the design stage, and it is necessary to design the required thickness in accordance with the design regulations. Therefore, if the same Gc conditions are used, a laminate composed solely of CSM should pay more attention to the effect of void content on fabrication quality, and it also requires considering a higher safety margin compared to a laminate combined with WR.

7. Conclusions

In this study, fabrication defects caused by changes in Gc and the fabric combination when designing the GFRP laminate of the composite ship were analyzed. The design direction of the composite hull plate in accordance with the fabrication quality was proposed. In the entire Gc region, the combined-material laminate showed less void content than the chopped strand mat single-material laminate; the effect was more pronounced in the high-Gc region than that in the normal-Gc region. The statistical analysis results confirmed that the difference in void content caused by the change in fabric combination was statistically significant in the entire Gc region.
The design direction was presented in accordance with the void content based on the ISO international standard (2008, 2019). In the normal-Gc region, there were no safety issues even if the laminate was designed according to the specified rules regardless of the change in fabric combination. However, in the high-Gc region, the laminate was manufactured using the hand lay-up approach in accordance with the specified design rules. A laminate with a higher thickness than that specified in the design rules is more suitable because of the safety issues. Thus, the single-material laminate should be designed such that its thickness is greater than that of the combined-material laminate. This is because a single-material laminate possess a maximum void content of 14%, which is twice as large as that of a combined-material laminate.
In particular, for composite ships such as fishing boats, work boats, yachts, and special purpose vessels, more cost is invested in the production process rather than the design process, and in reality, the rules are also focused on inspecting fabricated structures. Through the results of this study, it was confirmed that the quality of the primary structure, the hull laminate, is affected by the design conditions even when the production conditions are the same. Material design conditions such as the Gc range and fabric combination widely used in yards affect the quality of the laminate fabrication. Although a design factor for fabrication quality has been added in the current ISO international standards (2019), it is routinely applied only with a constant weight according to the change in the fabrication method, regardless of the change in the Gc and fabric combination. Therefore, based on the results of this study, it can be inferred that it is more effective to apply weights according to the impact of design conditions, such as Gc, fabric combination, and the fabrication method, on the quality of laminate. Furthermore, a separate design for each fabric combination was found to be more effective in the high-Gc region than that in the normal-Gc region.

Author Contributions

Conceptualization, D.O. and Z.H.; methodology, D.O. and Z.H.; funding acquisition, D.O.; manufacturing, J.J. and M.; test and investigation, J.J. and Y.K.; writing—original draft, J.J.; writing—review and editing, D.O. and Z.H. All authors have read and agreed to the published version of the manuscript.

Funding

This work was supported by the Korea Institute for Advancement of Technology (KIAT) grant, funded by the Korean Government (MOTIE) (P0017006, The Competency Development Program for Industry Specialist).

Institutional Review Board Statement

Not applicable.

Informed Consent Statement

Not applicable.

Data Availability Statement

All data are presented in the paper.

Conflicts of Interest

The authors declare no conflict of interest.

References

  1. Talreja, R. Manufacturing defects in composites and their effects on performance. In Polymer Composites in the Aerospace Industry; Irving, P.E., Soutis, C., Eds.; Woodhead Publishing: Sawston, UK, 2015; pp. 99–113. [Google Scholar]
  2. Ma, W.; Liu, F. Effects of porosity on ultrasonic characteristic parameters and mechanical properties of glass fiber reinforced composites. Int. J. Mod. Phys. Conf. Ser. 2012, 6, 646–651. [Google Scholar] [CrossRef] [Green Version]
  3. Mouritz, A.P. Ultrasonic and interlaminar properties of highly porous composites. J. Compos. Mater. 2000, 34, 218–239. [Google Scholar] [CrossRef]
  4. Klosterman, D.; Browning, C.; Hakim, I.; Lach, K. Investigation of various techniques for controlled void formation in fiberglass/epoxy composites. J. Compos. Mater. 2020, 55, 489–506. [Google Scholar] [CrossRef]
  5. Lee, J.; Soutis, C. Thickness effect on the compressive strength of T800/924C carbon fiber-epoxy laminates. Compos. Part A Appl. Sci. Manuf. 2005, 36, 213–227. [Google Scholar]
  6. Farooq, M.U.; Carlsson, L.A.; Acha, B.A. Determination of fiber/matrix adhesion using the Outwater–Murphy single fiber specimen. Eng. Fract. Mech. 2009, 76, 2758–2765. [Google Scholar] [CrossRef]
  7. Antony, S.; Drissi-Habti, M.; Raman, V. Numerical analysis to enhance delamination strength around bolt holes of unidirectional pultruded large smart composite platform. Adv. Mater. Sci. Eng. 2018, 2018, 3154904. [Google Scholar] [CrossRef] [Green Version]
  8. Abdelal, N. Effect of Voids on Delamination Behavior under Static and Fatigue Mode I and Mode II. Ph.D. Thesis, University of Dayton, Dayton, OH, USA, 2013. [Google Scholar]
  9. Liu, H.; Cui, H.; Wen, W.; Kang, H. Fatigue characterization of T300/924 polymer composites with voids under tension-tension and compression-compression cyclic loading. Fatigue Fract. Eng. Mater. Struct. 2018, 41, 597–610. [Google Scholar] [CrossRef]
  10. Sisodia, S.; Gamstedt, E.K.; Edgren, F.; Varma, J. Effects of voids on quasi-static and tension fatigue behaviour of carbon-fibre composite laminates. J. Compos. Mater. 2015, 49, 2137–2148. [Google Scholar] [CrossRef]
  11. Chambers, A.R.; Earl, J.S.; Squires, C.A.; Suhot, M.A. The effect of voids on the flexural fatigue performance of unidirectional carbon fibre composites developed for wind turbine applications. Int. J. Fatigue 2006, 28, 1389–1398. [Google Scholar] [CrossRef]
  12. Beura, S.; Chakraverty, A.P.; Pati, S.N.; Pradhan, D.D.; Thatoi, D.N.; Mohanty, U.K. Effect of salinity and strain rate on sea water aged GFRP composite for marine applications. Mater. Today Commun. 2023, 34, 105056. [Google Scholar] [CrossRef]
  13. Chakraverty, A.P.; Mohanty, U.K.; Mishra, S.C.; Satapathy, A. Sea water ageing of GFRP composites and the dissolved salts. IOP Conf. Ser. Mater. Sci. Eng. 2015, 75, 12029. [Google Scholar] [CrossRef]
  14. Kini, U.A.; Shettar, M.; Suresh, S.; Gowrishankar, M.C. Effect of different types of water soaking and re-drying on mechanical properties of glass fiber-epoxy composites. Cogent Eng. 2023, 10, 2165018. [Google Scholar] [CrossRef]
  15. Mehdikhani, M.; Gorbatikh, L.; Verpoest, I.; Lomov, S.V. Voids in fiber-reinforced polymer composites: A review on their formation, characteristics, and effects on mechanical performance. J. Compos. Mater. 2019, 53, 1579–1669. [Google Scholar] [CrossRef]
  16. Kim, S.-Y.; Shim, C.S.; Sturtevant, C.; Kim, D.; Song, H.C. Mechanical properties and production quality of hand-layup and vacuum infusion processed hybrid composite materials for GFRP marine structures. Int. J. Nav. Archit. Ocean Eng. 2014, 6, 723–736. [Google Scholar] [CrossRef] [Green Version]
  17. Ujianto, O.; Nugroho, A.; Setijotomo, H.S.; Bintoro, A. Effect of fabrication techniques, resin types and fiber combinations on mechanical properties and morphology of glass fiber composites. Int. J. Mater. Mech. Manuf. 2020, 8, 17–21. [Google Scholar] [CrossRef]
  18. Mariatti, M.; Chum, P.K. Effect of laminate configuration on the properties of glass fiber-reinforced plastics (GFRPs) mixed composites. J. Reinf. Plast. Compos. 2005, 24, 1713–1721. [Google Scholar] [CrossRef]
  19. Capriotti, M.; Kim, H.E.; Scalea, F.L.; Kim, H. Non-destructive inspection of impact damage in composite aircraft panels by ultrasonic guided waves and statistical processing. Materials 2017, 10, 616. [Google Scholar] [CrossRef] [Green Version]
  20. Mouritz, A.P.; Townsend, C.; Khan, M.S. Non-destructive detection of fatigue damage in thick composites by pulse-echo ultrasonics. Compos. Sci. Technol. 2000, 60, 23–32. [Google Scholar] [CrossRef]
  21. Guide to Composites. Available online: https://www.gurit.com/wp-content/uploads/2022/12/guide-to-composites-1.pdf (accessed on 15 May 2023).
  22. Greene, E. Marine composites non-destructive evaluation. In Proceedings of the SSC Ship Structure Symposium: Vessel Safety & Longevity through Ship Structure Research, Linthicum Heights, MD, USA, 18–20 May 2014. [Google Scholar]
  23. Eric Greene Associates. Marine Composites, 2nd ed.; Eric Greene Associates, Inc.: Annapolis, MD, USA, 1999; ISBN 0-9673692-0-7. [Google Scholar]
  24. Lee, S.-G.; Oh, D.K.; Woo, J.H. The effect of high glass fiber content and reinforcement combination on pulse-echo ultrasonic measurement of composite ship structures. J. Mar. Sci. Eng. 2021, 9, 379. [Google Scholar] [CrossRef]
  25. Jang, J.-W.; Han, Z.Q.; Oh, D.K. Light-weight optimum design of laminate structures of a GFRP fishing vessel. J. Ocean Eng. Technol. 2019, 33, 495–503. [Google Scholar] [CrossRef]
  26. Han, Z.Q.; Jang, J.W.; Oh, D.K. Design margin of composite structure of Korean fishing vessel and assessment of its environmental impact. Shipbuild. China 2020, 61, 90–100. [Google Scholar]
  27. ISO 12215-5; Small Craft—Hull Construction, and Scantlings—Part 5: Design Pressures for Monohulls, Design Stresses, Scantlings Determination. ISO (International Organization for Standardization): Geneva, Switzerland, 2019.
  28. RINA (Registro Italiano Navale). Rules for the Classification of Pleasure Yachts. Part B-Hull and Stability; Imago Media: Genova, Italy, 2021. [Google Scholar]
  29. LR (Lloyd’s Register). Rules & Regulations for the Classification of Special Service Crafts; Lloyd’s Register: London, UK, 2019. [Google Scholar]
  30. KR (Korean Register). Guidance for Recreational Crafts; KR: Busan, Republic of Korea, 2018. [Google Scholar]
  31. CCS (China Classification Society). Rules for Construction and Classification of Yachts; CCS: Beijing, China, 2019. [Google Scholar]
  32. Oh, D.K.; Han, Z.Q.; Noh, J.K.; Jeong, S.H. Laminate weight optimization of composite ship structures based on experimental data. J. Soc. Nav. Arch. Korea 2020, 57, 104–113. [Google Scholar] [CrossRef]
  33. ISO 12215-5; Small Craft—Hull Construction, and Scantlings—Part 5: Design Pressures for Monohulls, Design Stresses, Scantlings Determination. ISO (International Organization for Standardization): Geneva, Switzerland, 2008.
  34. ASTM D790-17; Standard Test Methods for Flexural Properties of Unreinforced and Reinforced Plastics and Electrical Insulating Materials. ASTM International: West Conshohocken, PA, USA, 2017.
  35. Han, Z.Q.; Jang, J.W.; Lee, K.H.; Oh, D.K. Lightweight-laminate design of fishing boat considering mechanical properties of glass fiber reinforced polymer. Shipbuild. China 2021, 62, 132–144. [Google Scholar]
  36. Ahmed, M.M.; Alzajramo, B.; Jouini, N.; Hessien, M.M.; Ataya, S. The role of orientation and temperature on the mechanical properties of a 20 years old wind turbine blade GFR composite. Polymers 2021, 13, 1144. [Google Scholar] [CrossRef]
  37. Oh, D.K. Marine Composites, FRP Small Craft, and Eco-Friendliness. The Society of Naval Architects of Korea Webzine. 2019. Available online: http://www.snak.or.kr/newsletter/webzine/news.html?Item=board21&mode=view&s_t=1&No=645 (accessed on 15 June 2021).
  38. Song, H.C.; Yum, J.S. A study of the mechanical properties of fiberglass reinforcements with constitution of lay-up, manufacturing method, and resins. J. Ocean. Eng. Technol. 2010, 24, 75–80. [Google Scholar]
  39. Scott, R.J. Fiberglass Boat Design and Construction, 2nd ed.; The Society of Naval Architects and Marine Engineers: Jersey City, NJ, USA, 1996; pp. 42–43. [Google Scholar]
  40. Sakin, R.; Ay, I.; Yaman, R. An investigation of bending fatigue behavior for glass-fiber reinforced polyester composite materials. Mater. Des. 2008, 29, 212–217. [Google Scholar] [CrossRef]
  41. Rashid, B.; Sadeq, A.; Ebraheem, M.; Mohammed, A. Mechanical properties of hybrid woven roving and chopped strand mat glass fabric reinforced polyester composites. Mater. Res. Express 2019, 6, 105208. [Google Scholar] [CrossRef]
  42. Abdelal, N.; Donaldson, S.L. Comparison of methods for the characterization of voids in glass fiber composites. J. Compos. Mater. 2017, 52, 487–501. [Google Scholar] [CrossRef]
  43. Hakim, I.A.; Donaldson, S.L.; Meyendorf, N.G.; Browning, C.E. Porosity Effects on Interlaminar Fracture Behavior in Carbon Fiber-Reinforced Polymer Composites. Mater. Sci. Appl. 2017, 8, 170–187. [Google Scholar] [CrossRef] [Green Version]
  44. McDonough, W.G.; Dunkers, J.P.; Flynn, K.M.; Hunston, D.L. A test method to determine the fiber and void contents of carbon/glass hybrid composites. J. ASTM Int. 2004, 1, 1–15. [Google Scholar] [CrossRef] [Green Version]
  45. Han, Z.; Jeong, S.; Noh, J.; Oh, D. Comparative Study of Glass Fiber Content Measurement Methods for Inspecting Fabrication Quality of Composite Ship Structures. Appl. Sci. 2020, 10, 5130. [Google Scholar] [CrossRef]
  46. Oh, D.; Jang, J.; Jee, J.-H.; Kwon, Y.; Im, S.; Han, Z. Effects of fabric combinations on the quality of glass fiber reinforced polymer hull structures. Int. J. Nav. Arch. Ocean Eng. 2022, 14, 100462. [Google Scholar] [CrossRef]
  47. Owens Corning. Available online: http://www.owenscorning.co.kr/new/main/main.asp (accessed on 26 March 2020).
  48. Aekyung Chemical Co., Ltd. Available online: https://www.akc.co.kr/product/list.do?bcode_id=BCK1&mcode_id=BCK1_1&scode_id=BCK1_1_3 (accessed on 15 June 2021).
  49. Alfa Mirge Co., Ltd. Available online: https://www.alfamirage.com/english/catalog/data/300s_features.pdf (accessed on 15 June 2021).
  50. ASTM D3171-15; Standard Test Methods for Constituent Content of Composite Materials. ASTM International: West Conshohocken, PA, USA, 2015.
  51. Coretech. Available online: https://www.core21.co.kr/home/core21/shop/item.php?it_id=1492400084 (accessed on 15 June 2021).
  52. Lee, S.S.; Lee, D.K. What is the proper way to apply the multiple comparison test? Korean J. Anesthesiol. 2018, 71, 353–360. [Google Scholar] [CrossRef] [PubMed] [Green Version]
Figure 1. (a) Void of UD carbon/epoxy laminate (void content: 7.4%, 2.1%) reproduced from Mehdikhani et al. (2019) ([15], Figure 9); (b) FRP laminate delamination reproduced from Antony et al. (2018) ([7], Figure 6).
Jmse 11 01251 g001
Figure 2. (a) Hull laminate design example; (b) hand lay-up process, reproduced after Gurit (n.d.) ([21], Figure 6.2).
Jmse 11 01251 g002
Figure 3. Variation in laminate strength with Gc determined by international rules and material tests: (a) three-point bending test [36]; (b) international rules and flexural strength test results [24,27,28,33,35].
Jmse 11 01251 g003
Figure 4. GFRP laminate specimens—fabrication and cutting.
Jmse 11 01251 g004
Figure 5. Burn-off test results and detailed comparison of specimens with normal and high Gc.
Jmse 11 01251 g005
Figure 6. Pairwise post hoc test results according to the Tukey method: (a) single-material specimens; (b) combined-material specimens.
Jmse 11 01251 g006
Figure 7. Scatterplots for analyzing the void content (single- and combined-material groups).
Jmse 11 01251 g007
Figure 8. Correlation and regression analysis for the void content for the normal and high-Gc regions.
Jmse 11 01251 g008
Figure 9. Void content for normal and high-Gc regions according to the ratio of the experiment’s Gc over the ISO12215-5 guidance Gc.
Jmse 11 01251 g009
Figure 10. Effect of voids on flexural strength (based on [27,33]).
Jmse 11 01251 g010
Table 1. Comparison of internal defect inspection and characterization methods of FRP laminate [4,42,43,44].
MethodCharacteristics
X-ray CT
-
High cost and safety problems for inspectors (−)
-
High time consumption (−)
-
Efficiently examines the interior of samples (+)
-
Morphology and distribution can be obtained in addition to global void content (+)
-
Sample must be removed from the structure (−)
Ultrasonic testing
-
Low time consumption (+)
-
Low precision (+)
-
Requires samples with different levels of porosity (−)
-
Relationship between porosity level and attenuation is not necessarily linear but depends on many other parameters (−)
Serial sectioning/
Image analysis
-
A large number of images may be analyzed, and thus reliable information such as amount, distribution, and shape of porosities may be obtained (+)
-
High time consumption (−)
-
High precision (−)
-
Errors depend on the number of pixels (−)
-
Limited by small sample size of many sections to be representative (−)
Burn-off test
-
Easy implementation (+)
-
Accurate Gc calculation (+)
-
Volume of fabrication defects in laminate can be considered (+)
-
Caters to ISO 12215 standards to measure Gc
Table 2. Design details of single-material laminates.
Design Gc (wt%)Laminate SchedulesTsingle (mm)Tdesign (mm)
30.00CSM ×   5 1.035.15
40.00CSM ×   7 0.725.04
50.00CSM ×   9 0.544.86
60.00CSM ×   12 0.414.92
70.00CSM ×   15 0.334.95
Tsingle: the average thickness of a single ply, Tdesign: the thickness of the laminate by the formula.
Table 3. Design details of combined-material laminates.
Design Gc (wt%)Laminate SchedulesTsingle (mm)Tdesign (mm)
CSMWR
33.00(CSM + WR) ×   2 1.031.045.15
44.00(CSM + WR) ×   3 0.720.745.04
54.00(CSM + WR) ×   4 0.540.544.86
65.00(CSM + WR) ×   5 0.410.424.92
70.00(CSM + WR) ×   6 0.370.374.95
Tsingle: the average thickness of a single ply, Tdesign: the thickness of the laminate according to the formula.
Table 4. One-way ANOVA results for the single-material specimens.
Sum of SquaresDegree of FreedomMean SquaresF-Valuep-Value
Between groups341.85485.4661.36<0.001
Within groups27.86201.39
Total369.7124
Table 5. One-way ANOVA results for the combined-material specimens.
Sum of SquaresDegree of FreedomMean SquaresF-Valuep-Value
Between groups62.78415.7022.11<0.001
Within groups14.20200.71
Total76.9824
Table 6. Grouping information using the Tukey method and 95% confidence. (a) Single-material specimens. (b) Combined-material specimens.
(a) 
Single-Material Specimens
FactorMeansGrouping (a)
30 wt%1.52A
40 wt%1.79AB
50 wt%1.93AB
60 wt%3.77 B
70 wt%11.28 D
(b) 
Combined-material specimens
FactorMeansGrouping (a)
33 wt%1.36A
44 wt%1.61A
54 wt%2.13A
65 wt%2.92A
70 wt%5.74 C
(a) Indicates values that do not share a letter and are significantly different; A: Good quality (void content: 0–3%); B: normal quality (void content: 3–5%); C: poor quality (void content: 5–10%); D: very poor quality (void content: 10%–).
Table 7. Test for the homogeneity of regression slopes using a general linear model (total data).
Sum of SquaresDegree of FreedomMean SquareF-Valuep-Value
Corrected model261.07 a387.0219.34<0.001
Intercept98.51198.5121.89<0.001
Gc (A)227.091227.0950.46<0.001
Combination type (B)31.12131.126.920.0116
A × B55.17155.1712.260.00104
Error207.03464.50
Total1047.2850
Corrected total468.1149
a R squared = 0.56 (adjusted R squared = 0.53).
Table 8. Comparison of change in Gc according to void contents.
Fabric
Combination
CasesISO 12215-5Void Content Considered
Vv (vol%)Gc (vol%)Vv (vol%)Gc (vol%)Gc (wt%)
Single30.00 wt%-16.641.4616.4029.63
Combination-16.641.2516.4329.68
Single60.00 wt%-41.1220.2134.2155.69
Combination-41.123.7939.6258.49
Disclaimer/Publisher’s Note: The statements, opinions and data contained in all publications are solely those of the individual author(s) and contributor(s) and not of MDPI and/or the editor(s). MDPI and/or the editor(s) disclaim responsibility for any injury to people or property resulting from any ideas, methods, instructions or products referred to in the content.

