Article

Estimate of Cetacean and Shark Depredations in the Small-Scale Longline Fishery in the Southeastern Waters of Taiwan

1
Institute of Marine Affairs and Resource Management, National Taiwan Ocean University, Keelung 20224, Taiwan
2
George Chen Shark Research Center, National Taiwan Ocean University, Keelung 20224, Taiwan
3
Center of Excellence for the Oceans, National Taiwan Ocean University, Keelung 20224, Taiwan
4
Fisheries Research Institute, Council of Agriculture, 199 Heyi Road, Keelung 20224, Taiwan
*
Author to whom correspondence should be addressed.
J. Mar. Sci. Eng. 2023, 11(6), 1233; https://doi.org/10.3390/jmse11061233
Submission received: 10 May 2023 / Revised: 14 June 2023 / Accepted: 14 June 2023 / Published: 15 June 2023
(This article belongs to the Topic Conservation and Management of Marine Ecosystems)

Abstract

:
Cetacean and shark depredations in a small-scale longline fishery in the southeastern Taiwan waters were estimated based on interviews of 21 fishermen and logbooks of 12 sampling vessels, including 649 operations (681,310 hooks) from October 2009 to December 2010. Cetacean depredations were more serious than shark depredations, with damage rates of 19.26% and 11.56%, respectively. The depredation rates in number and weight from cetaceans were estimated to be 2.21% and 3.23%, respectively, and were significantly higher than those from sharks, which were estimated to be 0.51% and 0.47%, respectively. The depredation indices from cetacean and shark were estimated to be 0.93 and 0.22 per 1000 hooks, respectively. The dolphinfish and yellowfin tuna were the top two species depredated by cetaceans and sharks. The annual economic loss of the small-scale longline fishery due to cetacean and shark depredations was estimated to be USD 441.9 thousand and USD 58.8 thousand, respectively, which corresponded to 4.5% and 0.6% of the total sales of the longline fishery at Hsinkang fishing port, southeastern Taiwan. The catch in number of dolphinfish and the operation depth were significant factors that affected cetacean depredations.

1. Introduction

The Kuroshio Current flows along the eastern waters of Taiwan and brings an upwelling with high primary production and rich nutrients when it hits seamounts, making this area a conventional fishing ground for migratory fish species such as dolphinfish (Coryphaena hippurus Linnaeus 1758), tunas, billfishes and sharks. This area is also one of the best cetacean-watching areas in Taiwan due to the high occurrence of cetaceans.
According to the Fisheries Statistics of Taiwan [
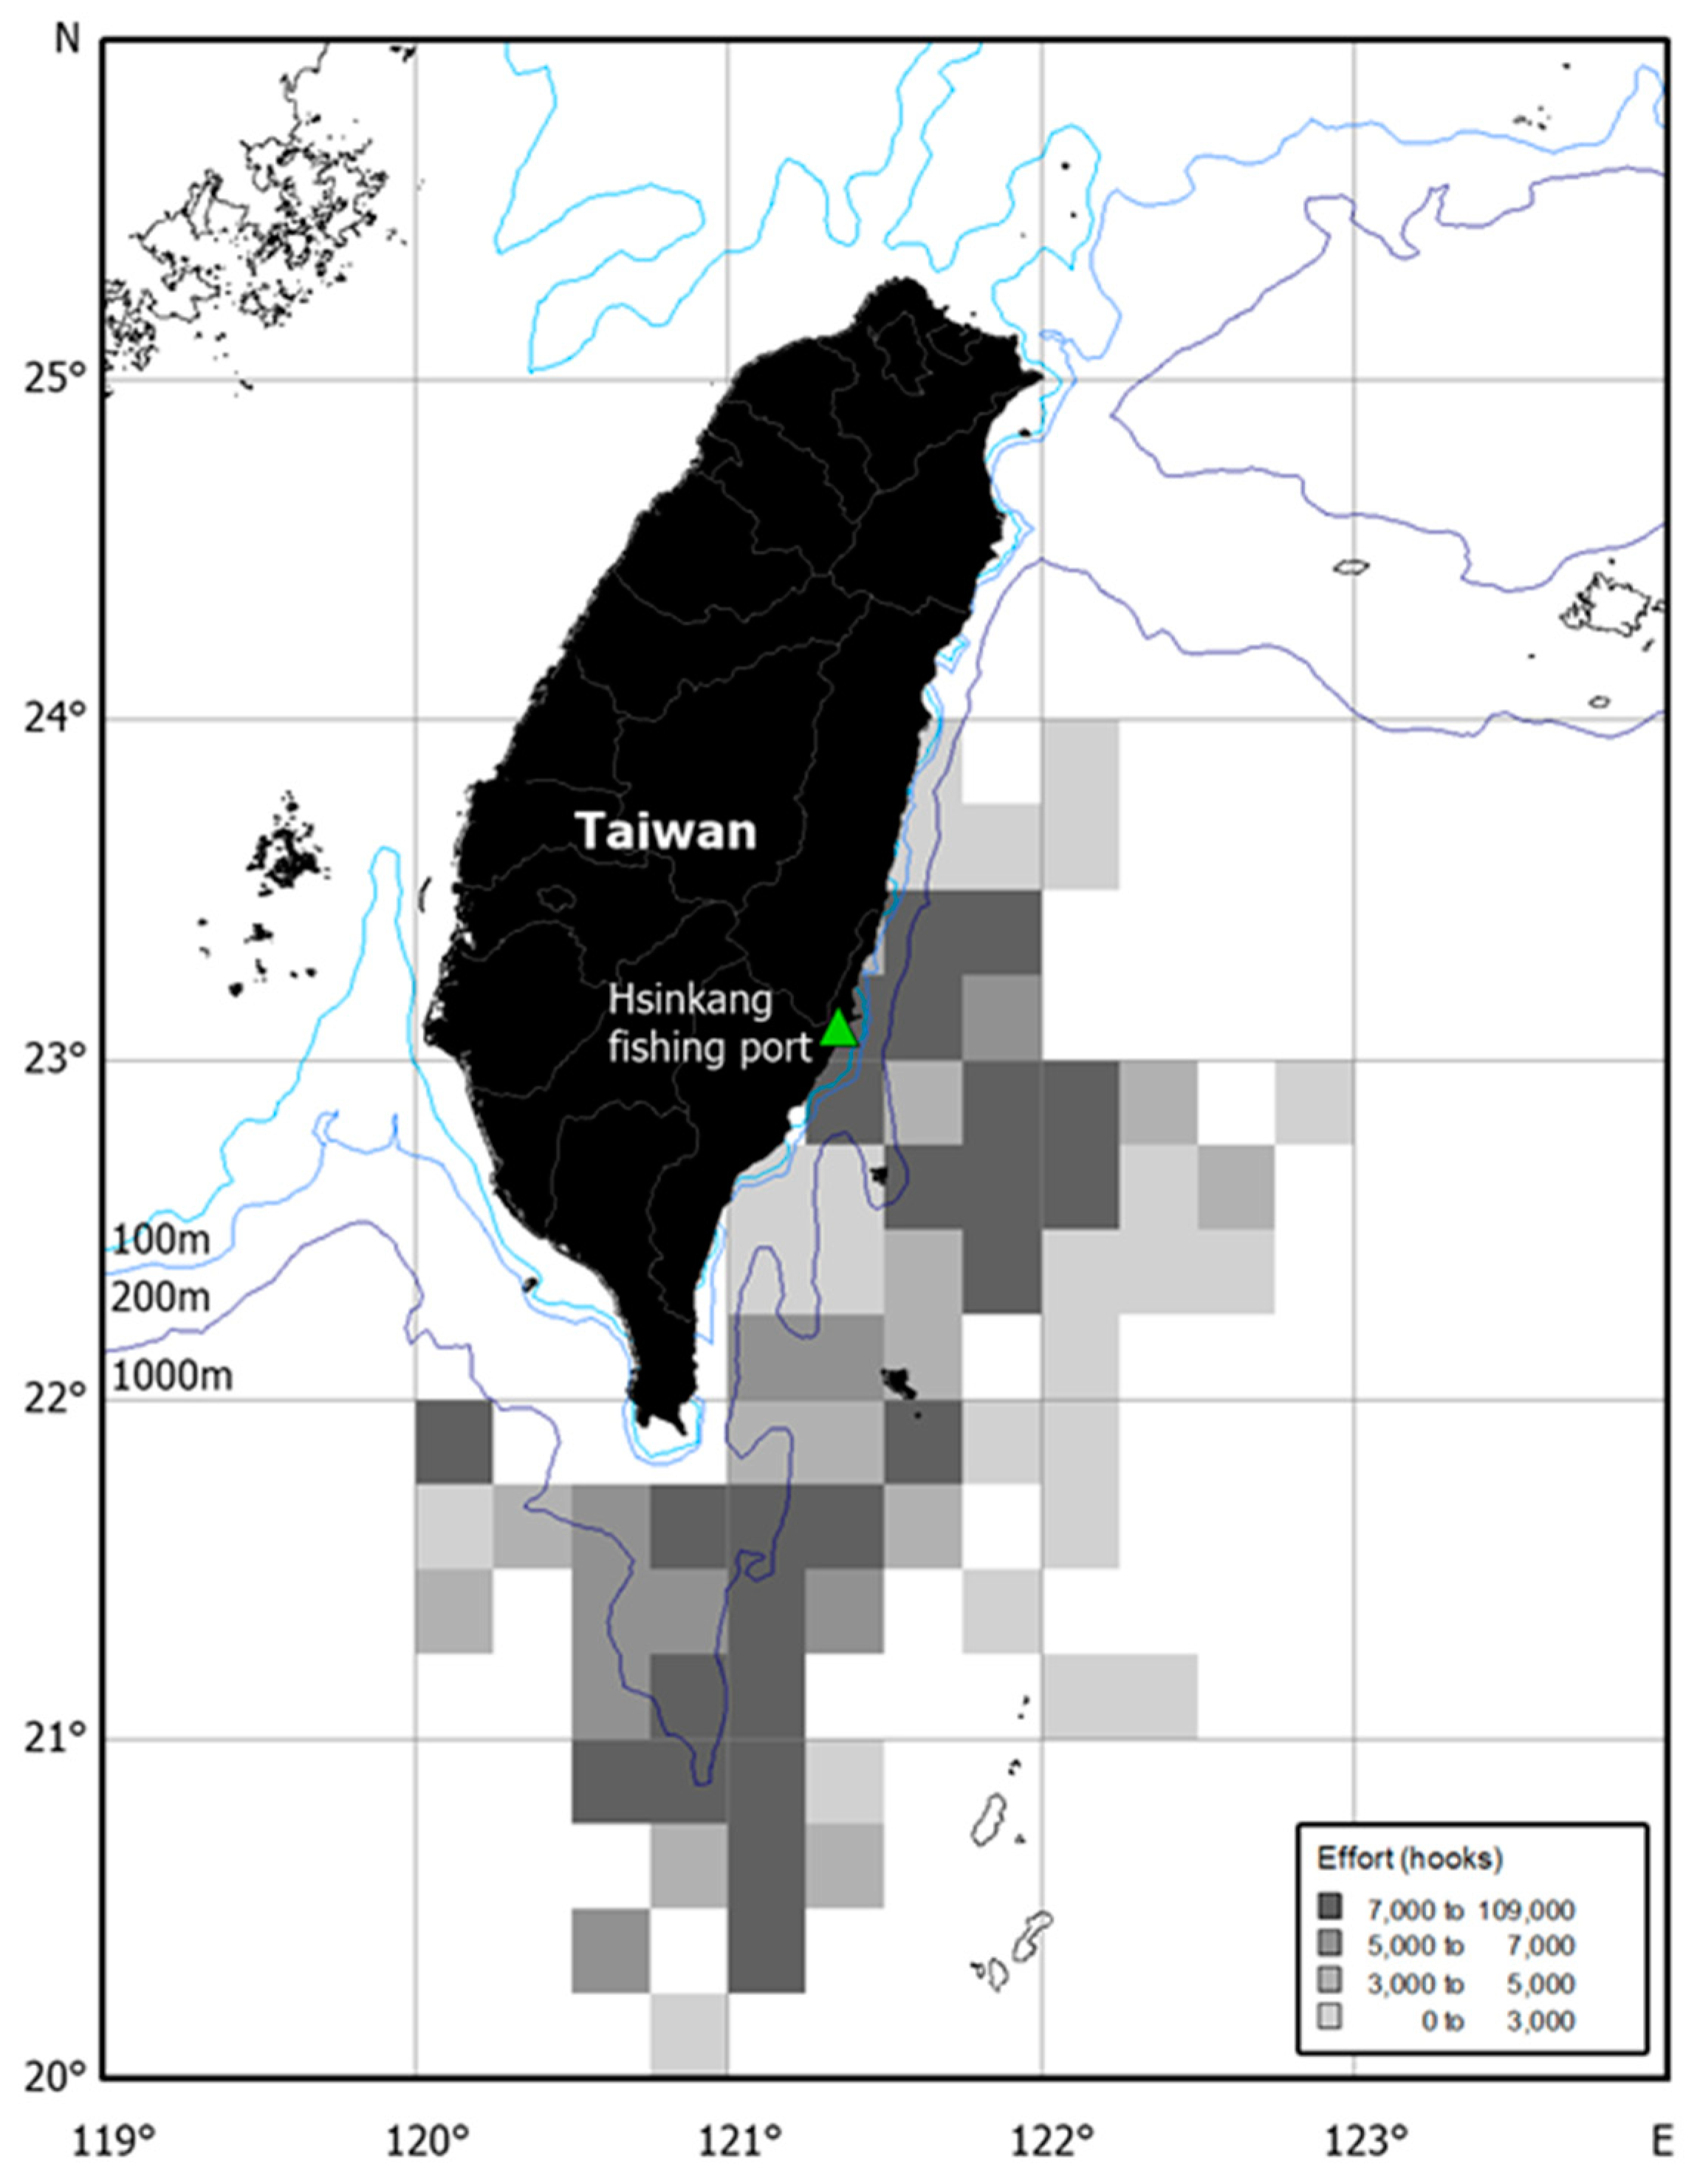
1], annual fishery production of the Hsinkang fishing port, southeastern Taiwan, is 6164 tons and is valued at USD 24.7 million. The major fisheries in this port include the small-scale tuna longline (STLL, <100 gross tonnages (GRT)), large-mesh drift net and harpoon fishery in the winter. The annual catch of the STLL is 3361 tons, which is 54.52% of the total annual catch and is valued at USD 10.7 million. Cetacean and shark depredations often occur when fishes were hooked by longline vessels. This issue affects, in different modalities, both cetaceans and fishers. The catch in terms of quality and quantity decreased when encountering cetacean interactions during fishing operations. On the other hand, depredations may result in the damage or mortality of cetaceans due to their being hooked or entangled by fishing gears [2].
There have been 31 cetacean species recorded in Taiwanese waters, and large cetaceans are commonly found in the eastern Taiwan waters [3]. The cetacean-watching activities started in the late 1990s after the cetacean-harvesting policy ban was implemented [3]. Several fishing ports in eastern Taiwan were transformed to recreational fishing ports for cetacean-watching ecotourism. The major areas for cetacean-watching were within 20 miles of the coast, and the sighting rate was 64–100% [4]. Risso’s dolphin (Grampus griseus Cuvier G., 1812), spinner dolphin (Stenella longirostris) and Pantropical spotted dolphin (S. attenuate) were the most sighted species, followed by the common bottlenose dolphin (Tursiops truncates), Fraser’s dolphin (Lagenodelphis hosei) and false killer whale (Pseudorca crassidens) [4]. Based on sales records, the shark landings at the Hsinkang fishing port decreased from 953 tons in 2001 to 436 tons in 2010, and the major shark species were the blue shark (Prionace glauca), shortfin mako (Isurus oxyrinchus), bigeye thresher (Alopias superciliosus), pelagic thresher (A. pelagicus), scalloped hammerhead (Sphyrna lewini), spinner shark (Carcharhinus bervippina) and tiger shark (Galeocerdo cuvier).
Various studies have documented cetacean and shark depredations in different areas around the world, particularly in the Indian Ocean [5]. Ramos-Cartelle and Mejuto [6] documented that the false killer whale depredations in Spanish billfish longline fishery were severe in the Indian Ocean. Rabearisoa et al. [7] reported toothed whale and shark depredations from the Reunion Island and Seychelles pelagic longline fisheries and concluded that depredation levels in Seychelles were among the highest observed in the world. Mitchell et al. [8] reviewed 61 studies and found shark depredation rates between 0.9% and 26% in commercial and recreational fisheries, respectively. Hamer et al. [9] and Gilman et al. [10] reviewed the interaction between cetaceans and longline fisheries. The issue of the depredation conflict between large marine predators and fisheries has been addressed [11]. The cetacean/dolphin depredations and mitigation for various fisheries have been well documented [12,13,14,15,16,17,18]. Carmody et al. [19] demonstrated that greater fishing efforts in a concentrated area may lead to high rates of shark depredations in a commercial trolling fishery in sub-tropical Australia.
The economic losses due to depredations have also been well documented in various areas. Liu [20] estimated the economic loss due to cetacean and shark depredations in a longline fishery in northeastern Taiwan. Luciano and Secchi [21] reported that the economic loss from killer whale depredations was higher than that from shark depredations in tuna longline fisheries in the southern waters of Brazil. Hernandez-Milian et al. [22] suggested that cetacean depredations were related to the moon phase, sea surface temperature and operation depth in the Atlantic Ocean. Muñoz-Lechuga et al. [23] described the depredation of Portugal billfish longline fleets in the Indian Ocean using general added models and identified the hotspot of depredations in the southwest Indian Ocean. Maccarrone et al. [24] and Fader et al. [25] reported the economic losses due to cetacean depredations in Sicily and Hawaii waters, respectively.
There are conflicts between commercial fisheries and recreational fisheries, particularly in terms of cetacean-watching activities. Since the ban on cetacean harvesting in Taiwan waters was implemented in 1993, fishermen argued that the reduction in fish catch was partially because the of increase in cetaceans that consumed large amounts of fish and interfered with fishing operations. In addition, the overlapping between cetacean-watching areas and conventional fishing grounds, as well as cetacean depredations, also resulted in the conflict between the two parties. Despite Yeh’s [26] description of the interaction of cetaceans in longline and troll fisheries and Liu’s [20] work on cetacean and shark depredations and the economic loss in the longline fishery in the northeastern Taiwan waters, depredation information is still lacking in the southeastern Taiwan waters. Hence, this study aims to estimate cetacean and shark depredations and to identify major factors affecting depredations in the STLL fisheries in the southeastern Taiwan waters based on fishermen interviews and logbook data of sampling vessels. The total economic loss due to depredations in the STLL in the southeastern Taiwan waters was also estimated.

2. Materials and Methods

2.1. Fishermen Interviews

Personal interviews of the longline fishermen at Hsinkang fishing port were conducted from October 2009 to December 2010. Three major parts—personal and fishing vessel profile, operation information and conservation opinions—were included in the interview. The first part included the age of the fisherman, years of fishing, fishing vessel size (GRT) and number of crews. The second part included annual operation days per year, target species, target shift, number of hooks, bait type, operation depth and depredation information, including the occurrence of depredation and the type of fishes damaged by cetaceans and sharks. The third part included cetacean conservation opinions.

2.2. Logbook Data

The logbook data were collected from the STLL sampling vessels from October 2009 to December 2010. The logbook data included three parts: (1) fishing records: date, operation location (longitude and latitude), operation time (start and end), hook type, number of hooks per basket, bait type, weather and number of cetacean sighting; (2) catch data, including catch in number and weight by species; and (3) depredation data: the species depredated by cetaceans or sharks in number and weight. The carcasses with only heads or internal organs left were identified as cetacean depredations, and those with small portions of torn wounds were identified as shark depredations. The depredations can be further categorized as (1) only head left, (2) only tail left, (3) one or few bites, (4) only skin left and (5) only skeleton left [27].

2.3. Environmental Data

Sea surface temperature (SST) data were provided by the Taiwan Ocean Research Institute (TORI) in a 0.1-by-0.1-degree scale. The seabed topography and water depth data in a 0.5-by=0.5-degree scale were adapted from National Ocean and Atmosphere Administration (NOAA) from the International Research Institute for Climate and Society (IRI) database. These data were used to estimate the SST and water depth of each operation set of sampling vessels.

2.4. Data Analysis

Estimation of Depredation Rate

Four depredation indices based on the definition of Indian Ocean Tuna Commission (IOTC) [5] were used in this study, namely the damage rate (DR), depredation rate in number (DRN), depredation rate in weight (DRW) and depredation index (DI).
  • The damage rate was estimated as D R j = O D j S j , where DRj is the DR of month j, ODj is the number of sets with depredation of month j and Sj is the total set of sampling vessels of month j.
  • The depredation rate in number was estimated as D R N j = D N j N j , where DRNj is the DRN of month j, DNj is the depredation in number of month j and Nj is the catch in number of month j.
  • The depredation rate in weight was estimated as D R W j = D W j W l , where DRWj is the DRW of month j, DWj is the depredation in weight of month j and Wj is the catch in weight of month j.
  • The depredation index was expressed as D I j = D N j H j / 1000 , where DIj is the depredation in number per 1000 hooks of month j and Hj is the number of hooks of month j.
The Wilcoxon test was used to examine the difference in depredation indices between seasons (from March to September and from October to February).

2.5. Depredation Models

Seven factors, including environmental variables, spatial–temporal effects, fishing effort, catch composition, cetacean sighting and interaction terms, were used to examine the effect on the depredation as follows (Table 1):
  • Operation depth (Dep): Two groups of the number of hooks between two adjacent floats (HPB) were categorized as deep set (≥15 hooks) and shallow set (<15 hooks) [28].
  • Bait type: Seven categories: live mackerel, frozen mackerel, moonfish, saury, live milk fish, frozen squid and others (any bait type that does not fall in the former six categories).
  • Season (S): Season 1 (from March to September) and season 2 (from October to February).
  • Area (A): Two areas were categorized: south (south of 22° N) and north (north of 22° N).
  • Number of hooks (NH): Fishing effort was expressed as number of 1000 hooks.
  • Sighting of cetaceans: Binary variables of “yes” and “no” were used.
  • Catch in number: Catch in number by species.
Interaction terms: The interaction terms of the above factors.
A binomial general linear model (GLM) was used to examine the factors affecting the depredation using SAS [29] as follows:
Y i ~ B i n o m i a l π i
log i t π i = β 0 + i = 1 n β i X i ,
where Yi is the DR, logit is the link function, β0 is the intercept, βi is the parameter to be estimated and Xi is the factor affecting depredations.
In addition, to deal with the high percentage of zero depredation, a GLM with a normal distribution of residuals was used in the analysis of positive depredation data. This model was as follows:
l n Y i = i = 1 n β i X i + ε , ε ~ N 0 , σ 2
where Yi is the DRN, DRW or DI; βi is the parameters to be estimated; Xi is the factor affecting depredations; and ε is a normally distributed error.

2.6. Estimate of Economic Loss Due to Depredation

Total sales of the sampling vessels (TSS) were estimated by T S S = i j C W i , j × P i , j , where CWi,j is the catch in weight of species i in month j of sampling vessels, and Pi,j is the average unit price of species i in month j calculated from the daily sales records at the Hsinkang fishing port. The economic loss of sampling vessels (ELS) due to depredations was E L S = i j D W i , j × P i , j , where DWi,j is the depredation in weight of species i in month j of sampling vessels. The economic loss of the longline fishery (ELL) in the Hsinkang fishing port was expressed as
E L L = i j Y i , j C W i , j × D W i , j × P i , j
where Yi,j is the catch in weight of species i in month j at the Hsinkang fishing port, and CWi,j is catch in weight of species i in month j of sampling vessels.
A Monte Carlo simulation was used to estimate the 95% confidence interval using a bootstrap [30] of 1000 iterations based on the range of 0.5–1.5-fold of the sales at the Hsinkang fishing port, as well as the catch and depredation rates of the sampling vessels.

3. Results

3.1. Fisherman Interviews

The results based on 21 interviews indicated that the age of fishermen ranged from 39 to 62 years old with fishing experience ranging from 25 to 50 years. The number of cruise members ranged from 4 to 6 depending on the vessel size. Six longline fishing vessels switched to drift nets or poles and lines targeting billfishes from September to the next March. Three fishing vessels also conducted harpoon fishing in the winter. An average of 150–250 operation days was conducted per year. The major baits used were frozen squids (60%), mackerels (18%) and live milk fish (11%) with 500–5000 hooks per set depending on the target species. The fishermen believed that the overexploitation of the drift net is the major reason resulting in the decline in the fish population. Fishermen acknowledged the cetacean harvest policy ban, but they also mentioned that this management measure was one of the reasons for the decrease in fish catch due to the increase in cetaceans. All fishermen had experience with cetacean depredations and were against cetacean conservation because they believed that depredations resulted in economic loss.

3.2. Logbook of Sampling Vessels

The logbook data of the sampling vessels are summarized as follows.

3.2.1. Operation Records

In total, 649 sets of the 12 sampling vessels, including 7 sets of 10–20 GRT and 5 sets of 20–50 GRT, were recorded from October 2009 to December 2010. The fishing area of these vessels is shown in Figure 1. There were two major fishing areas north and south of 20°N. High fishing efforts were found in both shallow (coastal) and deep (offshore) waters in the north area. High fishing efforts were only found in deep waters in the south area (Figure 1). The majority of bait was frozen squids (65%), followed by mackerel (14%) and live milk fish (10%). The number of hooks (fishing effort) peaked in April and May with 1464 hooks/set and 1661 hooks/set, respectively. A total of 138 cetacean sighting records were reported, including 41 records of spinner dolphins, 31 of pantropical spotted dolphins, 18 of short-finned pilot whales (Globicephala macrorhynchus) and 40 records of unidentified species.

3.2.2. Catch Records from the Logbook

A total of 29,270 individuals and 249 tons of catch were recorded in the logbook of the sampling vessels. The most caught species in terms of both number and in weight was dolphinfish, with 26,274 individuals for a total of 157 tons, representing 90% and 63% of the total catch in logbook records, respectively. Monthly variations in the dolphinfish catch in the logbook were similar to that of dolphinfish landings in the Hsinkang fishing port with the major fishing season from April to June.
The second highest catch in terms of the weight of sampling vessels was tuna, including the yellowfin tuna (Thunnus albacares) with 22 tons, the albacore (T. alalunga) with 12 tons and the bigeye tuna (T. obesus) with 10 tons, which were 9.0%, 4.9% and 4.0%, respectively, of the total catch of sampling vessels (Figure 2). The catch in terms of number of albacores was higher than that of the other two tuna species. Similar proportions of catch in weight were also found in the sales records of the Hsinkang fishing port.
The highest catch in number of billfishes of sampling vessels was the sailfish (Istiophorus platypterus) (n = 308), followed by the swordfish (Xiphias gladius) (n = 228) and the blue marlin (Makaira nigricans) (n = 130), which comprised 1.1%, 0.8% and 0.4%, respectively, of the total catch in number of sampling vessels (Figure 2).
The catch in number and weight of pelagic sharks of sampling vessels were 489 individuals and 20 tons, respectively, which comprised 1.7% and 8.1% of the catch of sampling vessels (Figure 2). The blue shark had the highest catch in both number and weight (67% and 52% of the total shark catch, respectively), followed by the thresher shark (including the bigeye thresher shark (Alopias superciliosus) and pelagic thresher shark (A. pelagicus)) and the requiem shark (including the spinner shark (Carcharhinus brevipinna), silky shark (C. falciformis), sandbar shark (C. plumbeus) and oceanic whitetip shark (C. longimanus)) in terms of catch in number. As for catch in weight, the bigeye thresher and pelagic thresher sharks comprised 32% and 5% of the shark catch of sampling vessels, respectively.
Temporal variations in catch were found in sampling vessels. The catch in number and weight from March to September was higher than that from October to February, mainly due to the variations in the catch of dolphinfish and sailfish between the two seasons. The catches of albacore, bigeye tuna and swordfish were higher from October to February. No significant difference in catch for other species was found between the two seasons (p > 0.05) (Figure 3).

3.2.3. Depredation in Logbook Records

The logbook data of 12 sampling vessels indicated that 200 depredation events included 125 cetacean depredations and 75 shark depredations with 33 co-occurrence events (Table 2). Of the 125 cetacean depredation events, 72 (58%) had cetacean sightings during fishing operations. Of those cetacean depredations, 98% only had the head remaining. For those depredated by sharks, only one bite or several bites were observed (Figure 4), comprising 54% and 32% of shark depredations, respectively.
In terms of depredation in number, 664 and 153 individuals were depredated by cetaceans and sharks, respectively. For those depredated by cetaceans, the dolphinfish was the top species with 538 individuals (81%), followed by the yellowfin tuna with 67 individuals (10%) (Table 3). Similar results were also found for shark depredation in number: the dolphinfish and yellowfin tuna were the top two species (133 and 10 individuals; 87% and 6.5%), followed by the sailfish and oilfish (Ruvettus pretiosus) (Table 3).
In total, 8.4 and 1.2 tons of cetacean and shark depredations were reported by the sampling vessels, respectively (Table 3). The major cetacean depredation was the dolphinfish (3.6 tons), followed by the yellowfin tuna with 3.0 tons and the albacore with 0.5 tons, which were 43%, 36% and 6.5% of the total depredations in weight, respectively. As for the shark depredations in weight, the dolphinfish (0.7 ton), the yellowfin tuna (0.4 ton) and the sailfish (0.1 ton) were the top three species, which were 55%, 30% and 6.5% of the total depredations in weight, respectively (Table 3).
More cetacean and shark depredations occurred from March to September than those from October to February. More dolphinfish, yellowfin tuna and sailfish (in number and weight) were depredated by cetaceans from March to September, but more albacore and bigeye tuna were depredated from October to February. As for shark depredations, more dolphinfish, sailfish and oilfish (both in number and weight) were found from March to September, but more yellowfin tuna were depredated from October to February.

3.3. Estimate of Depredation of Sampling Vessels

Four depredation indices of sampling vessels in different seasons were estimated as follows.

3.3.1. Damage Rate (DR)

The DR of cetaceans and sharks on sampling vessels were estimated to be 19.26% and 11.56%, respectively. A high DR of cetaceans (26.40%) was found from March to September and decreased to 13.01% from October to February. A higher DR of sharks also occurred in March–September (15.18%) compared with 8.38% in October–February (Table 4). The Wilcoxon test indicated that the DR of cetaceans was higher than that of sharks in both seasons, and the DRs of cetacean and shark were higher in March–September than in October–February (p < 0.05).

3.3.2. Depredation Rate in Number (DRN)

The DRN of cetaceans and sharks on sampling vessels were 2.21% and 0.51%, respectively. The cetacean DRN was higher in March–September than in October–February (Table 4). On the contrary, higher shark DRN occurred in October–February. However, these seasonal differences were not significant (p > 0.05) for either cetacean or shark DRN based on the Wilcoxon test. A higher cetacean DRN was found in offshore waters, but a higher shark DRN was found in coastal waters (Figure 5a,b).

3.3.3. Depredation Rate in Weight (DRW)

The DRW of cetaceans and sharks on sampling vessels were 3.23% and 0.47%, respectively. The cetacean DRW was higher in March–September than in October–February, but the shark DRW was similar in the two seasons (Table 4). The Wilcoxon test indicated there was a significant difference (p < 0.05) in the cetacean DRW between seasons, but no significant difference was found in the shark DRW (p > 0.05).

3.3.4. Depredation Index (DI)

The DI of cetaceans and sharks on sampling vessels were estimated to be 0.93 and 0.22 per 1000 hooks. Higher cetacean DI was found in March–September than in October–February (Table 4). The Wilcoxon test indicated there was a significant difference (p < 0.05) in the cetacean DI between seasons. However, there was no significant difference in the shark DI between seasons (p > 0.05). A higher cetacean DI was found in offshore waters but a higher shark DI was found in coastal waters (Figure 5c,d).

3.4. Production of Longline Fishery in the Hsinkang Fish Market

The production of longline fisheries based on the Hsinkang fishing port was 3131 tons and valued at USD 9.7 million in 2010. The production and sales of dolphinfish were 1805 tons and USD 3.8 million, which were 58% and 40%, respectively, of the longline production and value. The production and sales of billifishes were 20% and 30%, respectively, of the longline production and value; the production and sales were 13% and 23% for tunas, and 9.2% and 7.4% for sharks, respectively (Figure 6).
The sailfish had the most landings, of 249 tons, among the billfish species, followed by the white marlin and black marline, of 192 and 120 tons, respectively. The white marlin had the highest sales due to having the highest unit price, followed by the black marlin and sailfish. As for tuna, the yellowfin tuna had the highest production value of USD 1.8 million. The bluefin tuna had the lowest production value due to its small amount of catch despite its having the highest unit price (Figure 6).

3.5. Total Sales and Economic Loss

3.5.1. Total Sales of Sampling Vessels

The dolphinfish had the highest total sales of sampling vessels, with USD 335 thousand (45%) in sales, followed by tunas (yellowfin, albacore and bigeye tuna with USD 146, 65 and 29 thousand, 32%), billfishes (blue marlin, swordfish, Sailfish, black marlin and striped marlin with USD 41, 29, 17, 17 and 8 thousand, 14%), sharks with USD 54 thousand (7.3%) and oilfish with USD 12 thousand (1.7%).

3.5.2. Economic Loss Due to Depredations of Sampling Vessels

The economic losses due to cetacean and shark depredations in the sampling vessels were USD 33.3 and 4.9 thousand, which were 4.5% and 0.7% of the total sales of Hsinkang fishing port. Of the cetacean depredations, the yellowfin tuna and the dolphinfish had the highest economic losses, which comprised 55% and 24% of the loss. Similar results were also found for shark depredations, as the yellowfin tuna and dolphinfish comprised 60% and 33% of the economic loss (Figure 7).

3.6. Estimate of Total Catch Loss Due to Depredation

Annual economic loss due to depredation in Hsinkang fishing port was estimated to be 113.9 tons with a 95% confidence interval of 112.0–115.8 tons, which was 3.64% (3.58–3.70%) of the landings. Of these, the depredation losses of the dolphinfish, yellowfin and swordfish were 44.0, 37.0 and 14.3 tons, respectively. The annual catch loss due to shark depredations was 18.6 tons, which was 0.59% of the landings. Of which, the dolphinfish, sailfish and yellowfin tuna were the top three species, with 9.6, 4.9 and 3.8 tons, respectively (Table 5).
The total economic loss due to cetacean depredations was estimated to be USD 441.9 thousand, with a 95% C.I. of USD 434.8–449.0 thousand, which was 4.54% (95% C.I. of 4.46–4.61%) of the total fish production in Hsinkang fishing port in 2010. The highest loss was USD 208.1 thousand for yellowfin tuna, followed by USD 97.9 thousand for dolphinfish, and USD 65.6 thousand for swordfish (Table 5). The economic loss due to shark depredation was USD 58.8 thousand, with a 95% C.I. of USD 57.9–59.6 thousand, which was 0.60% of the total sales at Hsinkang fishing port in 2010. Of these, the yellowfin had the highest economic loss, followed by the dolphinfish and sailfish (Table 5).

3.7. General Linear Models (GLM)

The binomial general linear models (GLM) indicated that the cetacean sighting; the catch in number of dolphinfish, yellowfin and albacore; and the dolphinfish–season interaction had significant effects on the DR (p < 0.05) (Table 6). The GLM indicated that the dolphinfish catch in number and the operation depth had a significant effect on the DRN of cetaceans, while the DRW had a significant relation with the operation depth, area, shark catch in number, and the albacore catch in number and season interaction. The number of hooks, operation depth and dolphinfish catch in number had a significant effect on the DI of cetaceans (Table 6). The residuals of the aforementioned models were close to the normal distribution, suggesting that these models can describe the relations between depredation indices and those factors.

4. Discussion

This study provided the first information on cetacean and shark depredations in the STLL fishery in the southeastern waters of Taiwan. The results derived from this study can be used as a reference for the future stock assessment and management of tuna, billfishes and sharks in this region.

4.1. Uncertainty in Estimation

Several uncertainties may have affected the results of our estimations. Chiang et al. [31] documented that the drift net and harpoon were the major fishing gears for the coastal fishery, but the STLL was the major fishing gear for the offshore fishery in eastern Taiwan. Fishermen usually switched fishing gears depending on the target species and season. Some of the STLL vessels switched to drift nets to catch billfishes in certain seasons and even used harpoons to catch white marlin in the winter. As the fishing gear information was incomplete in the sales records of the Hsinkang fishing port, the estimation of the total longline catch and economic losses due to depredations at this port may have been overestimated.
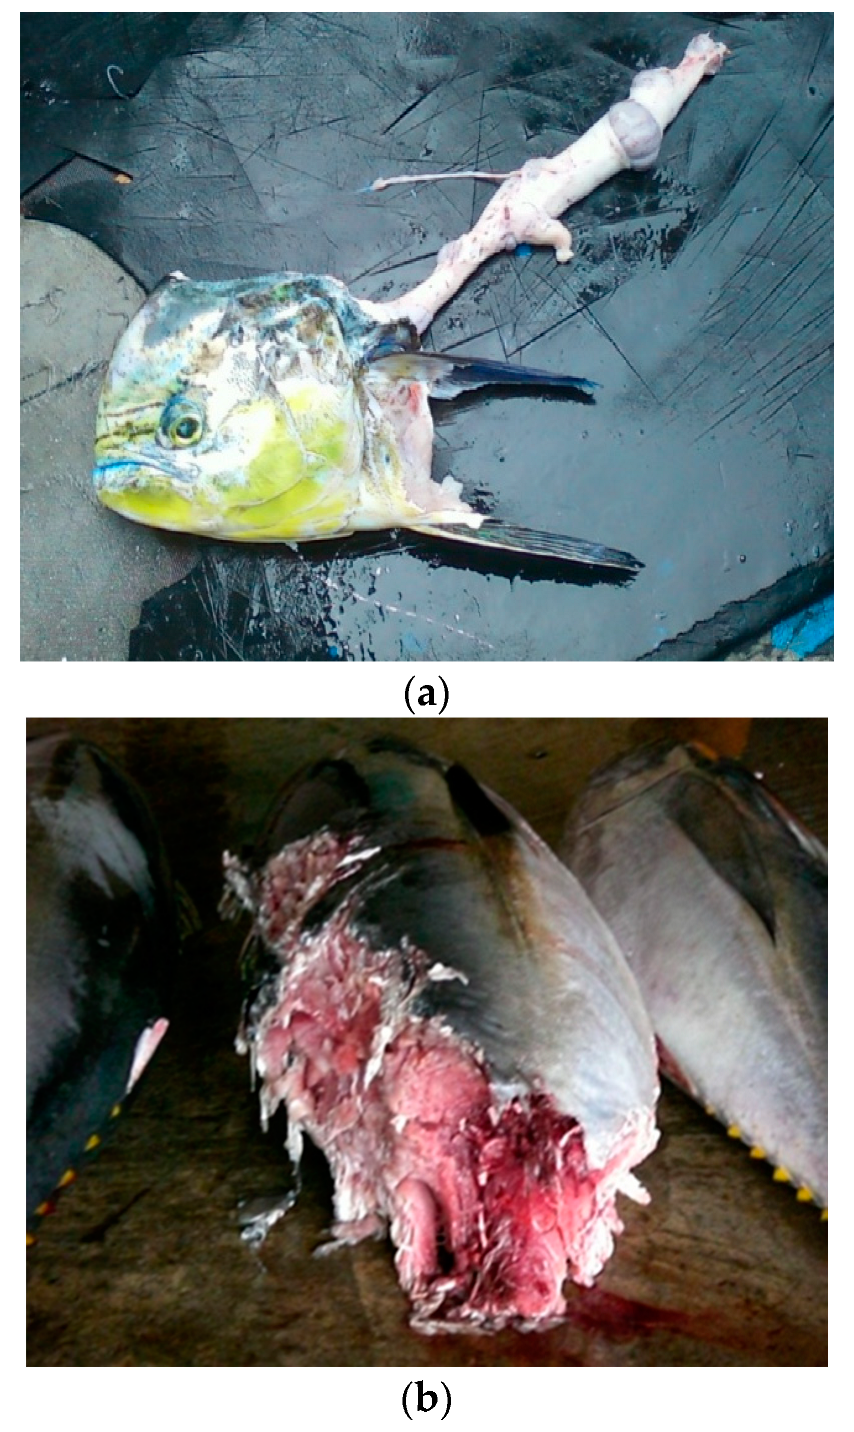
The fishing efforts of the 12 sampling vessels varied by month. Therefore, the estimated monthly catch and depredation may have been biased when lower fishing effort was reported in certain months. Uncertainty also existed in the identification of cetacean or shark depredation when only a small part of the fish carcass was left, which also biased the subsequent estimation of the DRW.

4.2. Cetacean and Shark Depredation

Liu [20] reported that the damage rates of cetaceans and sharks for a longline fishery in the northeastern Taiwan waters were 33.24% and 22.44%, with a DRN of 10.20% and 2.10%, DRW of 9.52% and 2.22%, and DI of 4.62 and 0.88, suggesting that the cetacean depredations were higher than shark depredations. Luciano and Secchi [21] also concluded that the economic loss due to cetacean depredations (12.38%) was higher than that from shark depredations (9.10%) in the southern Brazilian waters. Similar results were found in this study.
The higher cetacean depredation can likely be attributed to the fact that cetaceans need more energy than sharks to fulfill their energy requirements [31]. In addition, cetaceans, with their higher intelligence, often swim along the branch lines of longline fishing vessels and depredate the hooked fish [32]. Adult cetaceans even teach juveniles to depredate the fish hooked by longline vessels [33]. Sivasubramaniam [34] mentioned that when cetacean depredations occurred, if the fishing operation continued, the situation would grow worse in the Indian Ocean. To avoid fishing losses, fishermen tended to stop operations or change fishing areas when they encountered cetaceans.

4.3. Depredation Rates in Different Areas

IOTC [4] reported that the DRN of cetaceans was 2.6% in the southwest Indian Ocean from December 2004 to December 2005. Ramos-Cartelle and Mejuto [6] documented that the cetacean DR was 2% for the Spanish swordfish longline fleets, and the DRN were 1.1–1.8%, 0.5–2.6% and 0.1–0.3% in the Atlantic, Indian and Pacific Ocean, respectively.
As for the cetacean depredations in the longline fisheries in eastern Taiwan waters, Yeh [26] reported a DR of 11% based on interviews of 58 fishermen and observations of 73 trips on two sampling vessels. Liu [20] estimated a DR of 46.84%, DRN of 9.89%, DRW of 12.17% and DI of 3.36/1000 hooks for an offshore longline fishery in the northeastern Taiwan waters based on nine sampling vessels. However, the depredation estimates from the aforementioned studies were larger than our estimates of the STLL vessels in the southeastern Taiwan waters with DR = 19.02%, DRN = 2.13%, DRW = 3.11% and DI = 0.93/1000 hooks. One of the possible reasons for the difference is the different sizes of fishing vessels in the two areas. The fishing vessels in northeastern Taiwan were mainly 20–50 GRT and 50–100 GRT; however, those in southeastern Taiwan had smaller sizes (10–20 GRT and 20–50 GRT). Larger fishing vessels can travel farther from the port and deploy more hooks, thus increasing the catch [35]. As the soaking time increased with the vessel size, more depredations may have occurred, which resulted in higher economic loss [27]. Hernandez-Milian et al. [11] mentioned that the cetacean sightings increased with the catch. Garrison [36] suggested that cetacean depredation was positively correlated to the length of the branch line. The mean number of hooks per set was 1442 and 1005 for the longline fishing vessels in northeastern and southeastern Taiwan waters, respectively. More hooks lead to longer soaking times, which may increase the opportunity for depredation. In addition, different marine environments in the two areas may be another reason for the difference in depredations. The continental shelf in eastern Taiwan is very narrow, and the water depth drops sharply to thousands of meters within a couple of miles from the coast. Thus, different cetacean species are found in the two areas [37,38]. Liu [20] documented that the major cetacean species were Risson’s dolphin, short-beak common dolphin (Delphinus capensis) and pantropical spotted dolphin in the northeastern Taiwan waters. However, the spinner dolphin, pantropical spotted dolphin and short-finned pilot whale were the major species sighted in southeastern Taiwan. These sighting records agree with the distribution of cetaceans in eastern Taiwan that short-finned pilot whale occur in deep waters [
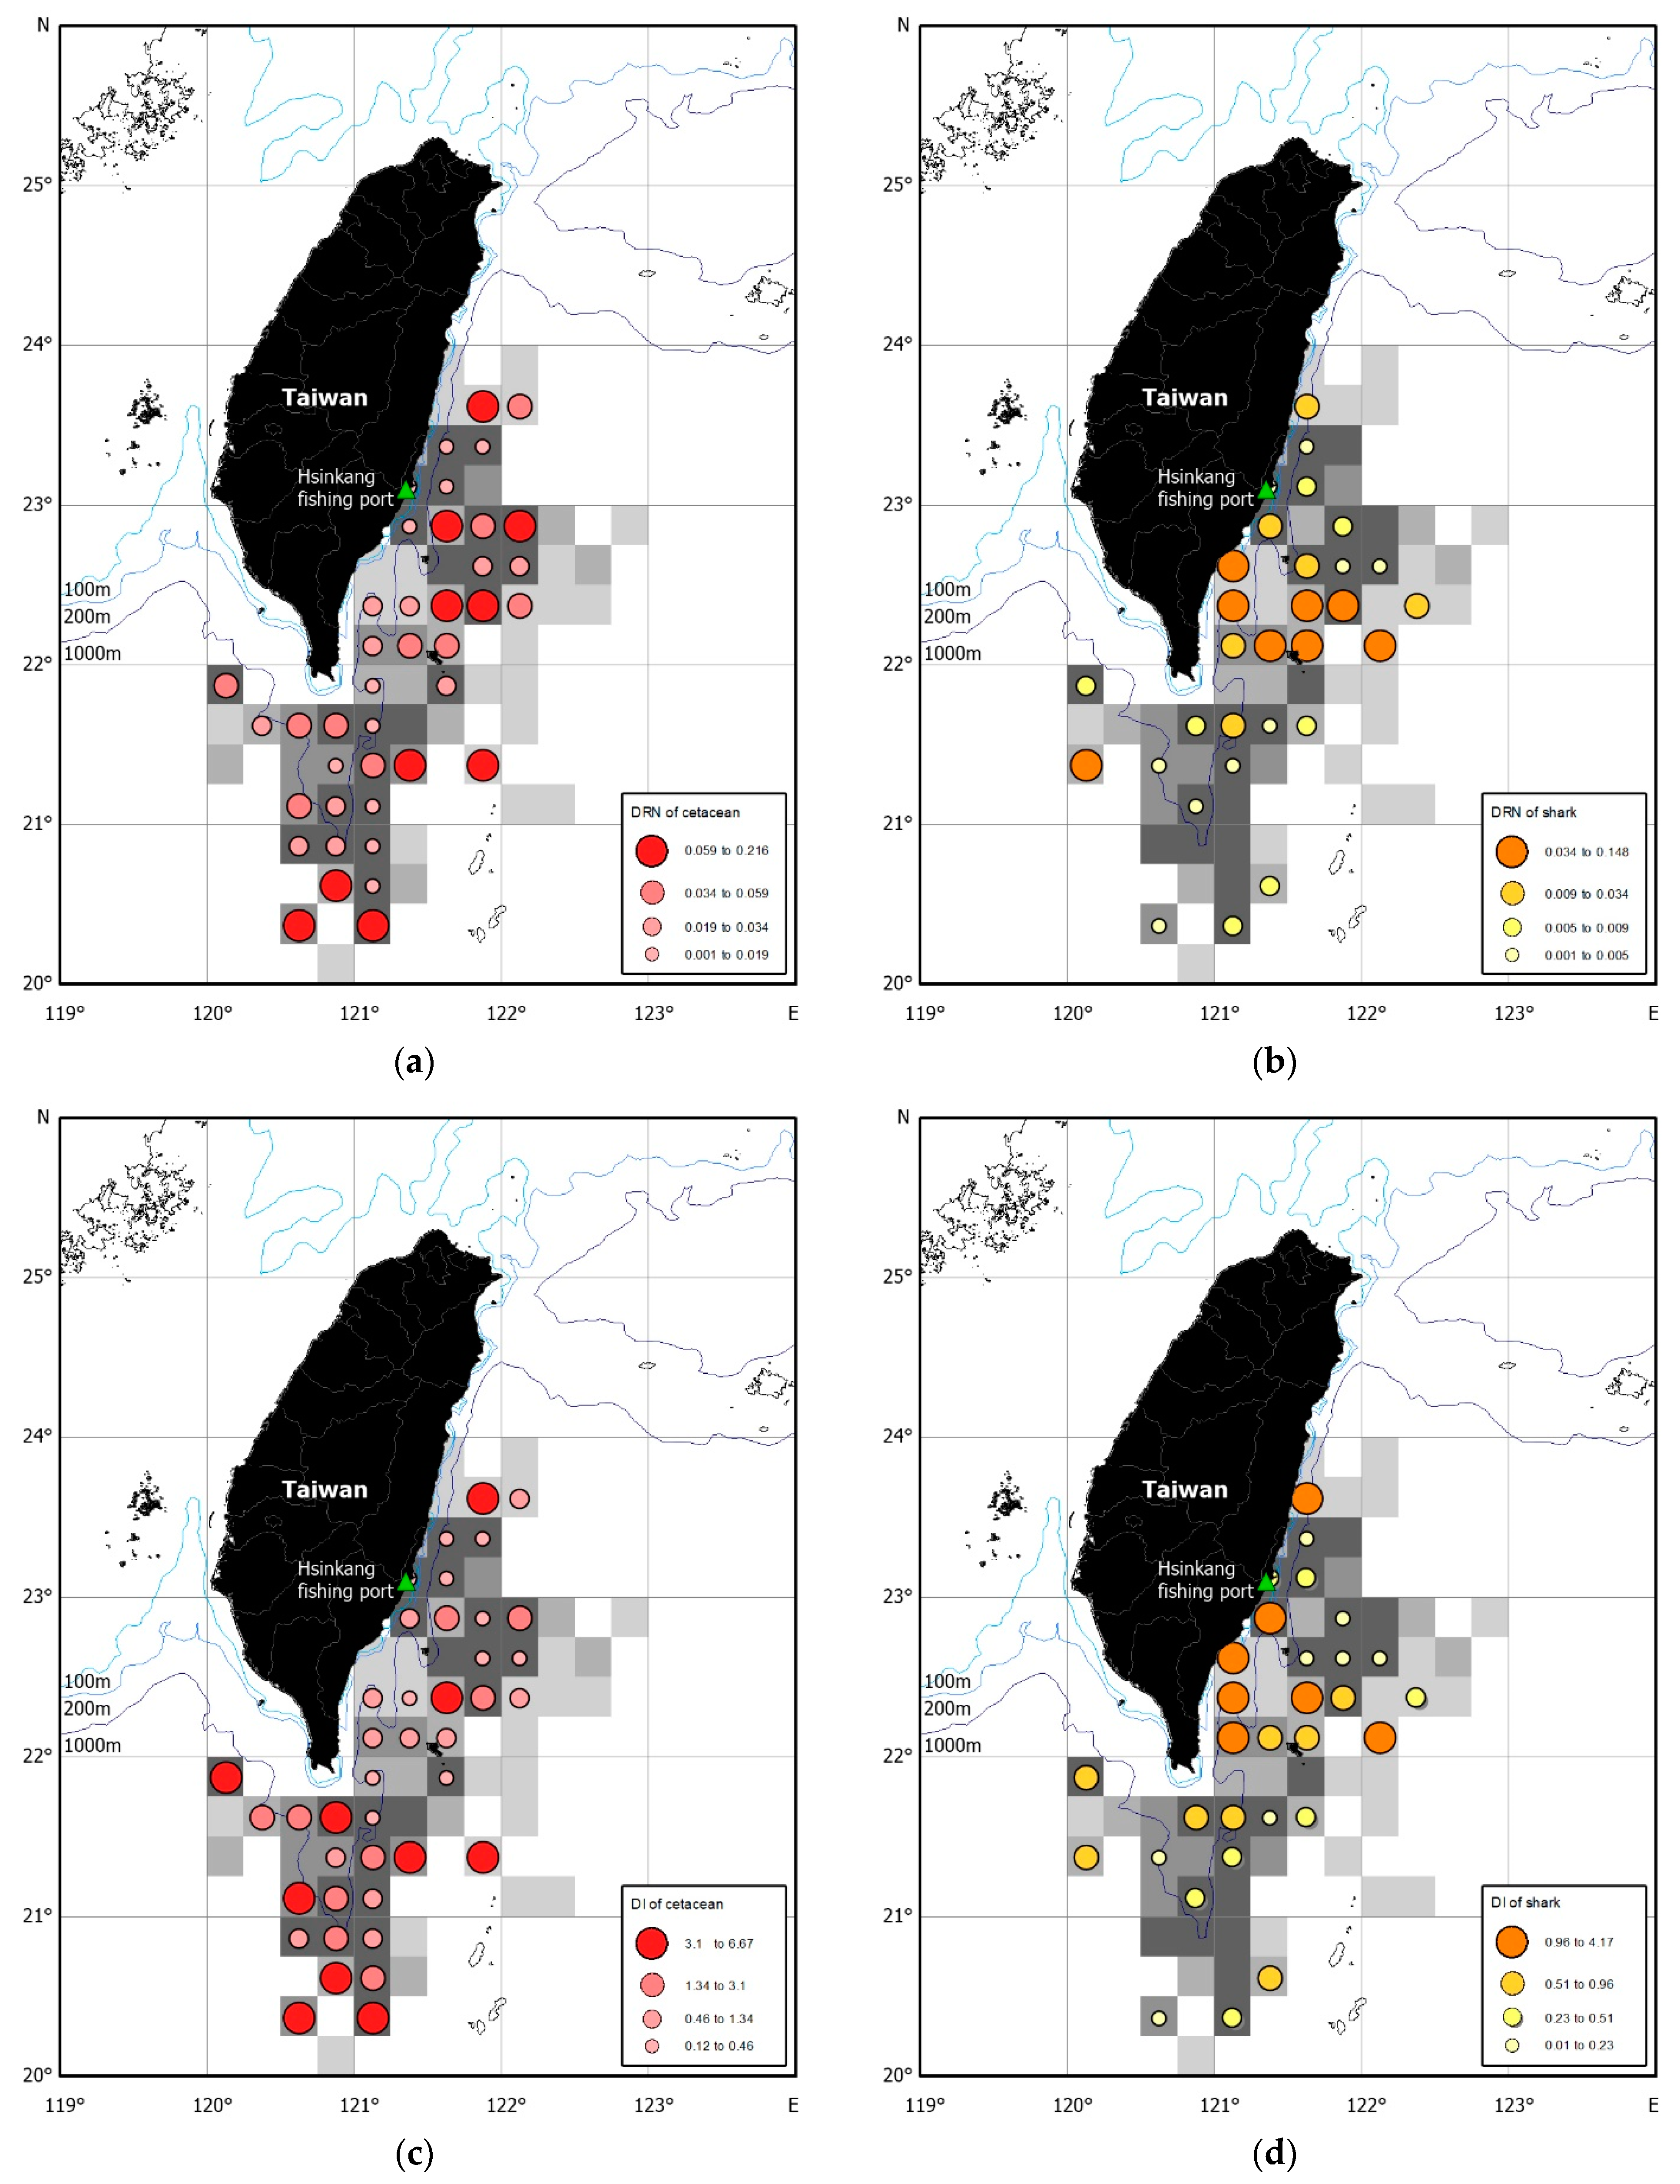
4]. The GLM indicated that the operation depth was a significant factor that affected the DRN, DRW and DI. Therefore, different depredation rates may have resulted from various cetacean species inhabiting different areas and water depths.
The sighting rates of cetaceans were 3.63/100 km and 1.63/100 km, with 263.45 individuals/100 km and 122.34 individuals/100 km in northeastern and southeastern Taiwan waters, respectively [37,39]. The higher number of cetaceans in northeastern Taiwan may result in the higher cetacean depredation.

4.4. The Preference of Cetacean and Shark Depredations

Liu [20] pointed out that the major fish depredated by cetaceans were dolphinfish and yellowfin tuna in the longline fishery in northeastern Taiwan. Similar results were found in this study. The major species depredated by sharks were dolphinfish, oilfish and billfishes. However, the major species depredated by sharks in this study were dolphinfish, yellowfin tuna and sailfish. The dolphinfish was the most common species in cetacean and shark depredations in the two areas. This was likely because the dolphinfish is the most abundant species caught by longline fisheries in eastern Taiwanese waters [40]. The dolphinfish catch peaked from April to June and from October to February [30]. When abundant dolphinfish were caught by longline fisheries, the hooked dolphinfish provided good sources for cetaceans [14]. Thus, the two peak seasons of dolphinfish catch corresponded to high cetacean depredations in southeastern Taiwan. Harwood [41] mentioned that, when many prey items were found, marine mammals could pick their preferred species. It is likely that the dolphinfish is the major fish species depredated by cetaceans and sharks in southeastern Taiwanese waters.

4.5. Cetacean Depredation and Dolphinfish Catch

The present study found that the catch-in number of dolphinfish and its interaction with season had a significant effect on the cetacean damage rate. Although dolphinfish were caught year-round, the number of catches from March to September was higher than that from October to February, which corresponded to the higher cetacean depredations of dolphinfish. Chiang et al. [30] documented that the catch of dolphinfish peaked from April to June, which is the period of the highest fishing effort for our sampling vessels. During this period, more hooks were deployed and longer operation and soaking times increased the cetacean depredation opportunities. Therefore, the number of hooks, catch of dolphinfish and cetacean depredations varied by season.

4.6. Economic Loss of Longline Fishery Due to Depredation

The economic losses of the longline fishery in Hsinkang were estimated based on the logbook data of the sampling vessels. However, some of the longline fishing vessels switched to drift nets or harpoons in certain seasons. As information regarding the seasonal switches of fishing method was not available in the sales records, the estimation of economic loss due to depredations of the longline fishery in Hsinkang fishing port may be biased. Future research should focus on collecting fishery switch information to improve the estimation.
Some Regional Fishery Management Organizations (RFMOs) have implemented the quota system on certain tuna or tuna-like species, but the cetacean and shark depredations have not been taken into account, which may lead to underestimations of the total removal of the species in stock assessment and mislead the subsequent management measures. The total depredation loss of dolphinfish was 44 and 10 tons, while the total loss of yellowfin tuna was 37 and 4 tons from cetacean and sharks, respectively. Consistent monitoring of the depredation is recommended to ensure the accuracy of the catch estimates in future stock assessments.

5. Conclusions

Cetacean and shark depredations in the STLL fishery in the southeastern Taiwan waters, estimated based on the logbooks from 12 sampling vessels, indicated damage rates of 19.26% and 11.56%, respectively. The depredation rates, in terms of number and weight, from cetaceans were estimated to be 2.21% and 3.23%, respectively, and were significantly higher than those from sharks, which were estimated to be 0.51% and 0.47% in terms of number and weight, respectively. The annual economic losses due to cetacean and shark depredations for the STLL fishery in Hsinkang port, southeastern Taiwan, were estimated to be USD 478.2 thousand and USD 63.6 thousand, respectively, which corresponded to 4.5% and 0.6% of the total sales of the longline fishery. The yellowfin tuna had the highest depredation loss, followed by the dolphinfish. The catch in number of dolphinfish and the operation depth were significant factors that affected cetacean depredations. Future research should collect more environmental data, increase the sample size and apply alternate models, such as general addictive models, to improve the results of the estimation.

Author Contributions

Conceptualization, K.-M.L.; methodology, K.-Y.S. and K.-M.L.; software, K.-Y.S. and C.-P.C.; formal analysis, K.-Y.S. and C.-P.C.; writing—original draft preparation, K.-Y.S. and K.-M.L.; writing—review and editing, K.-M.L.; supervision, K.-M.L. All authors have read and agreed to the published version of the manuscript.

Funding

This research received no external funding.

Institutional Review Board Statement

Not applicable.

Informed Consent Statement

Not applicable.

Data Availability Statement

Not applicable.

Conflicts of Interest

The authors declare no conflict of interest.

References

  1. Anon. Taiwan Fisheries Statistics Year Book, Fisheries Agency, Council of Agriculture, Taiwan. 2010. Available online: https://www.fa.gov.tw/cht/PublicationsFishYear/ (accessed on 1 June 2021).
  2. Reeves, R.R.; Read, A.J.; Notarbartolo-di-Sciara, G. Report of the Workshop on Interactions between Dolphins and Fisheries in the Mediterranean: Evaluation of Mitigation Alternatives; Istituto Centrale per la Ricerca Applicata al Mare: Roma, Italy, 2001; 44p. [Google Scholar]
  3. Tseng, Y.-P.; Huang, Y.-C.; Kyle, G.T.; Yang, M.-C. Modeling the impacts of cetacean-focused tourism in Taiwan: Observations from cetacean watching Boats: 2002–2005. Environ. Manag. 2011, 47, 56–66. [Google Scholar] [CrossRef] [PubMed]
  4. Chou, L.S. Abundance Estimation and Ecological Environment of the Cetaceans in Taiwan Waters; Project report; Fisheries Agency, Council of Agriculture: Taipei, Taiwan, 2008; 33p. (In Chinese)
  5. Indian Ocean Tuna Commission (IOTC). Proceedings of the Workshop on the Depredation in the Tuna Longline Fisheries in the Indian Ocean, Victoria, Seychelles, 9–10 July 2007.
  6. Ramos-Cartelle, A.; Mejuto, J. Interaction of the false killer whale (Pseudorca crassidens) and depredation on the swordfish catches of the Spanish surface longline fleet in the Atlantic, Indian and Pacific Oceans. Collect. Vol. Sci. Pap. ICCAT 2008, 62, 1721–1738. [Google Scholar]
  7. Rabearisoa, N.; Sabarros, P.S.; Romanov, E.V.; Lucas, V.; Bach, P. Toothed whale and shark depredation indicators: A case study from the Reunion Island and Seychelles pelagic longline fisheries. PLoS ONE 2018, 13, e0202037. [Google Scholar] [CrossRef] [PubMed]
  8. Mitchell, J.D.; McLean, D.L.; Collin, S.P.; Langlois, T.J. Shark depredation in commercial and recreational fisheries. Rev. Fish Biol. Fish. 2018, 28, 715–748. [Google Scholar] [CrossRef]
  9. Hamer, D.J.; Childerhouse, S.J.; Gales, N.J. Odontocete bycatch and depredation in longline fisheries: A review of available literature and of potential solutions. Mar. Mammal Sci. 2012, 28, E345–E374. [Google Scholar] [CrossRef]
  10. Gilman, E.; Brothers, N.; McPherson, G.; Dalzell, P. A review of cetacean interactions with longline gear. J. Cetacean Res. Manag. 2006, 8, 215–223. [Google Scholar] [CrossRef]
  11. Tixier, P.; Lea, M.A.; Hindell, M.A.; Welsford, D.; Mazé, C.; Gourguet, S.; Arnould, J.P. When large marine predators feed on fisheries catches: Global patterns of the depredation conflict and directions for coexistence. Fish Fish. 2021, 22, 31–53. [Google Scholar] [CrossRef]
  12. Lauriano, G.; Caramanna, L.; Scarno, M.; Andaloro, F. An overview of dolphin depredation in Italian artisanal fisheries. J. Mar. Biol. Assoc. UK 2009, 89, 921–929. [Google Scholar] [CrossRef]
  13. Rocklin, D.; Santoni, M.C.; Culioli, J.M.; Tomasini, J.A.; Pelletier, D.; Mouillot, D. Changes in the catch composition of artisanal fisheries attributable to dolphin depredation in a Mediterranean marine reserve. ICES J. Mar. Sci. 2009, 66, 699–707. [Google Scholar] [CrossRef] [Green Version]
  14. Bearzi, G.; Bonizzoni, S.; Gonzalvo, J. Dolphins and coastal fisheries within a marine protected area: Mismatch between dolphin occurrence and reported depredation. Aquat. Conserv. 2011, 21, 261–267. [Google Scholar] [CrossRef]
  15. Gönener, S.; Bilgin, S. The effects of acoustic pingers on dolphin’s depredation around Sinop Peninsula (Black Sea, Turkey) in bottom-set gillnets. Fırat. Univ. Fen Müh. Bil. Dergisi. 2007, 19, 121–127. [Google Scholar]
  16. Forney, K.A.; Kobayashi, D.R.; Johnston, D.W.; Marchetti, J.A.; Marsik, M.G. What’s the catch? Patterns of cetacean bycatch and depredation in Hawaii-based pelagic longline fisheries. Mar. Ecol. 2011, 32, 380–391. [Google Scholar] [CrossRef] [Green Version]
  17. Werner, T.B.; Northridge, S.; Press, K.M.; Young, N. Mitigating bycatch and depredation of marine mammals in longline fisheries. ICES J. Mar. Sci. 2015, 72, 1576–1586. [Google Scholar] [CrossRef] [Green Version]
  18. Santana-Garcon, J.; Wakefield, C.B.; Dorman, S.R.; Denham, A.; Blight, S.; Molony, B.W.; Newman, S.J. Risk versus reward: Interactions, depredation rates, and bycatch mitigation of dolphins in demersal fish trawls. Can. J. Fish. Aquat. Sci. 2018, 75, 2233–2240. [Google Scholar] [CrossRef]
  19. Carmody, H.; Langlois, T.; Mitchell, J.; Navarro, M.; Bosch, N.; McLean, D.; Monk, J.; Lewis, P.; Jackson, G. Shark depredation in a commercial trolling fishery in sub-tropical Australia. Mar. Ecol. Prog. Ser. 2021, 676, 19–35. [Google Scholar] [CrossRef]
  20. Liu, Y.P. Dolphin and Shark Depredations on the Longline Fishery in Nanfangao: Catch and Economic Loss Estimates. Master’s Thesis, National Taiwan Ocean University, Keelung, Taiwan, 31 July 2008. (In Chinese). [Google Scholar]
  21. Luciano, D.R.; Secchi, E.R. Killer whale (Orcinus orca) interactions with the tuna and swordfish longline fishery off southern and south-eastern Brazil: A comparison with shark interactions. J. Mar. Biol. Assoc. UK 2007, 87, 135–140. [Google Scholar] [CrossRef] [Green Version]
  22. Hernandez-Milian, G.; Goetz, S.; Varela-Dopico, C.; Rodriguez-Gutierrez, J.; Romon-Olea, J.; Fuertes-Gamundi, J.R.; Ulloa-Alonso, E.; Tregenza, N.J.C.; Smerdon, A.; Otero, M.G.; et al. Results of a short study of interactions of cetaceans and longline fisheries in Atlantic waters: Environmental correlates of catches and depredation events. Essent. Fish Habitat Mapp. Mediterr. 2008, 612, 251–268. [Google Scholar] [CrossRef]
  23. Muñoz-Lechuga, R.; Rosa, D.; Coelho, R. Depredation in the Portuguese pelagic longline fleet in the Indian Ocean. In IOTC–2016–WPEB12-35; Indian Ocean Tuna Commission: Victoria, Seychelles, 2016; 14p. [Google Scholar]
  24. Maccarrone, V.; Buffa, G.; Di Stefano, V.; Filiciotto, F.; Mazzola, S.; Buscaino, G. Economic assessment of dolphin depredation damages and pinger use in artisanal fisheries in the archipelago of Egadi Islands (Sicily). Turk. J. Fish. Aquat. Sci. 2014, 14, 173–181. [Google Scholar] [CrossRef]
  25. Fader, J.E.; Marchetti, J.A.; Schick, R.S.; Read, A.J. No free lunch: Estimating the biomass and ex-vessel value of target catch lost to depredation by odontocetes in the Hawai ‘i longline tuna fishery. Can. J. Fish. Aquat. Sci. 2023. [Google Scholar] [CrossRef]
  26. Yeh, C.C. Studies on Reducing the Fishery Loss Caused by Cetacean in Taiwan. Master’s Thesis, Department of Environmental Biology and Fisheries Science, National Taiwan Ocean University, Keelung, Taiwan, 31 July 2004. (In Chinese). [Google Scholar]
  27. Lauriano, G.; Fortuna, C.M.; Moltedo, G.; Notarbartolo-di-Sciara, G. Interaction between common bottlenose dolphin (Tursiops truncatus) and the artisanal fishery in Asinara Island National Park (Sardinia): Assessment of catch damage and economic loss. J. Cetacean Res. Manag. 2004, 6, 165–173. [Google Scholar] [CrossRef]
  28. Walsh, W.A. Ongoing and planned analyses of catch and catch rate data for blue shark Prionace glauca and shortfin mako Isurus oxyrinchus in the Hawaii-based pelagic longline fishery: 1995–2010. ISC/11/SHARKWG-2/2. In Proceedings of the Working document submitted to the ISC Shark Working Group Workshop, La Jolla, CA, USA, 28 November–3 December 2011. [Google Scholar]
  29. SAS Institute Inc. SAS® 9.4 Statements: Reference; SAS Institute Inc.: Cary, NC, USA, 2013. [Google Scholar]
  30. Efron, B.; Tibshirani, R.J. An Introduction to the Bootstrap; Chapman and Hall: London, UK, 1993. [Google Scholar]
  31. Benoit-Bird, K.J. Prey caloric value and predator energy needs: Foraging predictions for wild spinner dolphins. Mar. Biol. 2004, 145, 435–444. [Google Scholar] [CrossRef]
  32. Chiang, W.C.; Chen, W.Y. Current Status of Fisheries Resources and Conservation in Eastern Taiwan; East Marine Research Center; Fisheries Research Institute: Beijing, China, 2009; 10p. (In Chinese)
  33. Zollett, E.A.; Read, A.J. Depredation of catch by bottlenose dolphins (Tursiops truncatus) in the Florida king mackerel (Scomberomorus cavalla) troll fishery. Fish. Bull. 2006, 104, 343–349. [Google Scholar]
  34. Sivasubramaniam, K. Predation of tuna longline catches in the Indian Ocean, by killer whales and sharks. Bull. Fish. Res. Stn. 1964, 17, 221–236. [Google Scholar]
  35. Huang, L. Fishing Efficiency of the Offshore Longline Fishing Vessels in Taiwan. Master’s Thesis, National Taiwan Ocean University, Keelung, Taiwan, 2004. [Google Scholar]
  36. Garrison, L.P. Interactions between marine mammals and pelagic longline fishing gear in the U.S. Atlantic Ocean between 1992 and 2004. Fish. Bull. 2007, 105, 408–417. [Google Scholar]
  37. Chen, Y.A.; Chou, L.S.; Yeh, C.C.; McCallum, A. Fauna, distribution and habitat partitioning of cetaceans in Ilan waters, Taiwan. In Proceedings of the 13th Biennial Conference on the Biology of Marine Mammals, Maui, HI, USA, 28 November—3 December 1999. [Google Scholar]
  38. Yeh, C.C. Fauna, distribution and habitat features of cetaceans in coastal waters of southeastern Taiwan. Master’s Thesis, Institute of Zoology, National Taiwan University, Taipei, Taiwan, 31 July 2001. [Google Scholar]
  39. Yeh, C.C.; Chen, Y.A.; Chou, L.S. Fauna and distribution of cetacean in Taitung water. In Proceedings of the 6th Symposium on Cetacean Ecology and Conservation, Taipei, Taiwan, 23 May 1998; pp. 97–125. [Google Scholar]
  40. Tsai, F.Y.; Chiang, W.C.; Chen, C.C.; Madigan, D.J.; Ho, Y.S. Feeding ecology of dolphinfish (Coryphaena hippurus) in the waters off eastern Taiwan. J. Taiwan Fish. Res. 2006, 24, 11–24. (In Chinese) [Google Scholar]
  41. Harwood, J. Assessing the competitive effects of marine mammal predation on commercial fisheries. South Afr. J. Mar. Sci. 1992, 12, 689–693. [Google Scholar] [CrossRef]
Figure 1. The fishing area and fishing efforts of the small-scale tuna longline sampling vessels in this study.
Jmse 11 01233 g001
Figure 2. The percentage of species-specific catch in number (a) and catch in weight (b) of sampling vessels.
Jmse 11 01233 g002
Figure 3. The species-specific catch in number from March to September (a) and from October to February (b), and the catch in weight from March to September (c) and from October to February (d) of sampling vessels in different fishing seasons. The left side of the Y-axis is for dolphinfish, and the right side is for other species.
Jmse 11 01233 g003
Figure 4. A catch depredated by cetacean (a) and shark (b).
Jmse 11 01233 g004
Figure 5. The depredation rate in number (DRN) of cetaceans (a) and sharks (b), and depredation index (DI) of cetaceans (c) and sharks (d) by 0.25° × 0.25° grid.
Jmse 11 01233 g005
Figure 6. The percentage of species-specific production (a) and value (thousand USD) (b) at Hsinkang fishing port.
Jmse 11 01233 g006
Figure 7. Species-specific economic loss due to depredations from cetaceans (a) and sharks (b) of the sampling vessels.
Jmse 11 01233 g007
Table 1. Environmental, spatial and temporal, fishing effort, sighting, catch and interactions variables examined in generalized linear model analyses of the probability of cetacean interaction in the longline fishery.
Type of VariableVariable NameDescriptor
EnvironmentSea surface temperaturein °C
Water depthin m
Spatial and temporalSeasonMarch–-September and October–February
AreaNorth and South (22° N)
Fishing effortHooksNo. of hooks
SightingCetacean sightingsYes or No
CatchDolphinfish (Coryphaena hippurus)Catch in number
Yellowfin tuna (Thunnus albacares)
Bigeye tuna (Thunnus obesus)
Albacore (Thunnus alalunga)
Bluefin tuna (Thunnus orientalis)
Sailfish (Istiophorus platypterus)
Swordfish (Xiphias gladius)
Striped marlin (Kajikia audax)
Blue marlin (Makaira nigricans)
Black marlin (Makaira indica)
Blue shark (Prionace glauca)
Requiem shark (Carcharhinidae)
Hammerhead shark (Sphyrnidae)
Thresher shark (Alopiidae)
Shortfin mako shark (Isurus oxyrinchus)
Oilfish (Lepidocybium flavobrunneum)
InteractionDolphinfish × Season
Albacore × Season
Bigeye tuna × Season
Swordfish × Season
Sailfish × Season
Table 2. The fishing effort, catch, depredation event and depredation in number and weight of cetaceans and sharks of sampling vessels.
Catch Depredation EventDepredation in NumberDepredation in Weight (kg)
MonthHooksSetsNumberWeight (kg)CetaceanSharkCetaceanSharkCetaceanShark
March29,95031785747911114515
April83,45757700448,334121099271170170
May149,46090884964,1652615311322785248
June51,90536232421,4651778218126495
July88508290281013154055
August30,104464167180136159436169
September29,432351087743810416516728
October83,73291360525,6051795112769163
November99,352120353735,5931384691034121
December62,1268172614,61413113734576126
January31,32232375887011316035
February21,620222725613102060
Total681,31064929,270249,1661257566415383521225
Table 3. The species-specific depredation in number and weight by cetaceans and sharks of sampling vessels.
Depredation in NumberDepredation in Weight (ton)
Speciesby Cetacean(%)by Shark(%)by Cetacean(%)by Shark(%)
Dolphinfish5388113386.93.642.60.755.3
Yellowfin tuna6710.1106.53360.429.6
Bigeye tuna101.521.30.44.70.14.5
Albacore263.910.70.56.501.2
Sailfish81.2320.22.60.16.5
Swordfish30.510.70.11.301.6
Striped marlin--------
Blue marlin30.5--0.33.6--
Black marlin10.2--0.11.3--
Shark20.3--0.11.1--
Oilfish60.93200.301.2
Total6641001531008.41001.2100
Table 4. The damage rate, depredation rate in number and weight and depredation index by cetaceans and sharks of sampling vessels in different fishing seasons.
DR (%) DRN (%) DRW (%) DI
SeasonCetaceanSharkCetaceanSharkCetaceanSharkCetaceanShark
March–September26.4015.182.460.453.570.471.260.24
October–February13.018.381.600.642.620.480.470.19
Average19.2611.562.210.513.230.470.930.22
DR: Damage rate; DRN: depredation rate in number; DRW: depredation rate in weight; DI: depredation index.
Table 5. The depredation in weight and economic loss by cetaceans and sharks for the longline fishery estimated by landings at Hsinkang fishing port.
Depredation in Weight (tons)Economic Loss (Thousand USD)
by Cetacean (95% C.I.)by Shark (95% C.I.)by Cetacean (95% C.I.)by Shark (95% C.I.)
SpeciesMeanLowerUpperMeanLowerUpperMeanLowerUpperMeanLowerUpper
Dolphinfish44.043.444.79.69.59.797.996.499.421.721.521.9
Yellowfin tuna37.036.537.53.83.83.9208.1205.8210.426.726.327.1
Bigeye tuna1.11.11.20.10.10.16.46.36.50.40.40.5
Albacore1.31.31.30.00.00.03.02.93.00.10.10.1
Sailfish4.24.24.34.94.84.911.110.911.39.39.29.5
Swordfish14.313.914.70.10.10.165.663.867.30.30.20.3
Striped marlin0.00.00.00.00.00.00.00.00.00.00.00.0
Blue marlin3.33.33.40.00.00.013.613.313.90.00.00.0
Black marlin7.06.87.20.00.00.031.831.032.70.00.00.0
Shark0.90.90.90.00.00.02.82.72.80.00.00.0
Oilfish0.70.70.70.10.10.11.81.71.80.30.30.3
Total113.9112.0115.818.618.318.8441.9434.8449.058.857.959.6
Table 6. The results of general linear models examining the significance of factors on the depredation rates (DRN, DRW and DI) of cetaceans. A binomial model was applied to the DR.
DR DRN DRW DI
SourceDFF ValuePr > F F ValuePr > F F ValuePr > F F ValuePr > F
Albacore17.110.0076*0.070.7914 0.360.5496 0.330.5679
Bigeye tuna10.030.8538 0.430.5158 1.820.1799 1.050.308
Yellowfin tuna17.90.005*0.330.5653 1.850.1762 3.020.0853
Swordfish12.540.1113 0.610.4355 0.830.363 1.490.2246
Striped marlin10.50.4776 0.080.7832 0.020.8853 0.390.5333
Blue marlin10.260.6113 1.610.2074 0.140.7135 2.10.15
Black marlin10.320.572 0.070.7863 0.050.8282 0.750.3882
Sailfish10.050.8208 0.140.7125 0.770.3821 0.110.7374
Shark10.680.4087 1.390.2407 4.830.0302*0.160.6931
Dolphinfish14.360.0369*4.860.0297*1.140.2887 19.88<0.0001*
Oilfish11.940.164 0.380.5405 0.040.8386 2.270.1347
Hook10.030.8693 0.460.4972 1.90.171 4.950.0282*
SST12.130.1446 0.070.7934 0.150.6956 0.930.3375
Depth11.10.2946 23.34<0.0001*13.360.0004*8.470.0044*
Season10.350.554 2.610.1092 00.9779 1.370.2439
Area10.470.491 1.370.2441 4.050.0468*2.940.0893
Sighting178.58<0.0001*0.840.3607 0.020.8827 2.080.1522
Dolphinfish × Season17.550.006*1.920.1689 0.420.5197 2.040.156
Albacore × Season10.540.4638 1.220.2729 11.140.0012*3.030.0847
Bigeyetuna × Season11.120.291 0.280.5952 0.040.8442 0.640.4239
Swordfish × Season10.850.3579 0.010.9234 0.360.5476 0.470.4948
Sailfish × Season10.040.8323 0.020.8786 0.520.4729 0.510.4758
DF: degree of freedom, *: significant at the 5% level.
Disclaimer/Publisher’s Note: The statements, opinions and data contained in all publications are solely those of the individual author(s) and contributor(s) and not of MDPI and/or the editor(s). MDPI and/or the editor(s) disclaim responsibility for any injury to people or property resulting from any ideas, methods, instructions or products referred to in the content.

