Article

Numerical and Experimental Analysis of Fire Resistance for Bulkhead and Deck Structures of Ships and Offshore Installations

School of Naval Architecture and Ocean Engineering, Jiangsu University of Science and Technology, Zhenjiang 212003, China
*
Author to whom correspondence should be addressed.
J. Mar. Sci. Eng. 2023, 11(6), 1200; https://doi.org/10.3390/jmse11061200
Submission received: 14 May 2023 / Revised: 30 May 2023 / Accepted: 1 June 2023 / Published: 9 June 2023
(This article belongs to the Special Issue Advanced Analysis of Marine Structures)

Abstract

:
Investigating the loss of integrity (E) in cabin walls and decks, as well as the role of insulation capabilities, holds significant implications for preventing serious human, economic and environmental damage caused by the ignition of cabins in ships and ocean platforms due to fires and explosions. In this study, the fire resistance of A-60 class ship bulkheads and decks was evaluated through two groups of standard fire resistance tests. In the first test, the steel structure side of the bulkhead was exposed to the fire, while in the second test, the mineral wool and L-shaped stiffeners side of the deck was exposed to the fire. Numerical material models for steel and mineral wool were established based on standards, and the temperature distribution and structural deformation were simulated using Abaqus. The results showed a good correlation with the experimental data. The maximum and average temperature increases on the unheated surface of the bulkhead during the standard fire resistance test were 158 °C and 136 °C, respectively. The corresponding values for the deck were 176 °C and 138 °C. Upon the conclusion of the experiment, the maximum displacement deformation in the direction towards the furnace from the center of the cabin wall was 54 mm, and from the center of the deck, the maximum displacement deformation towards the furnace was 28 mm. This research can provide guidance for the design of fire-resistant ship compartment structures.

1. Introduction

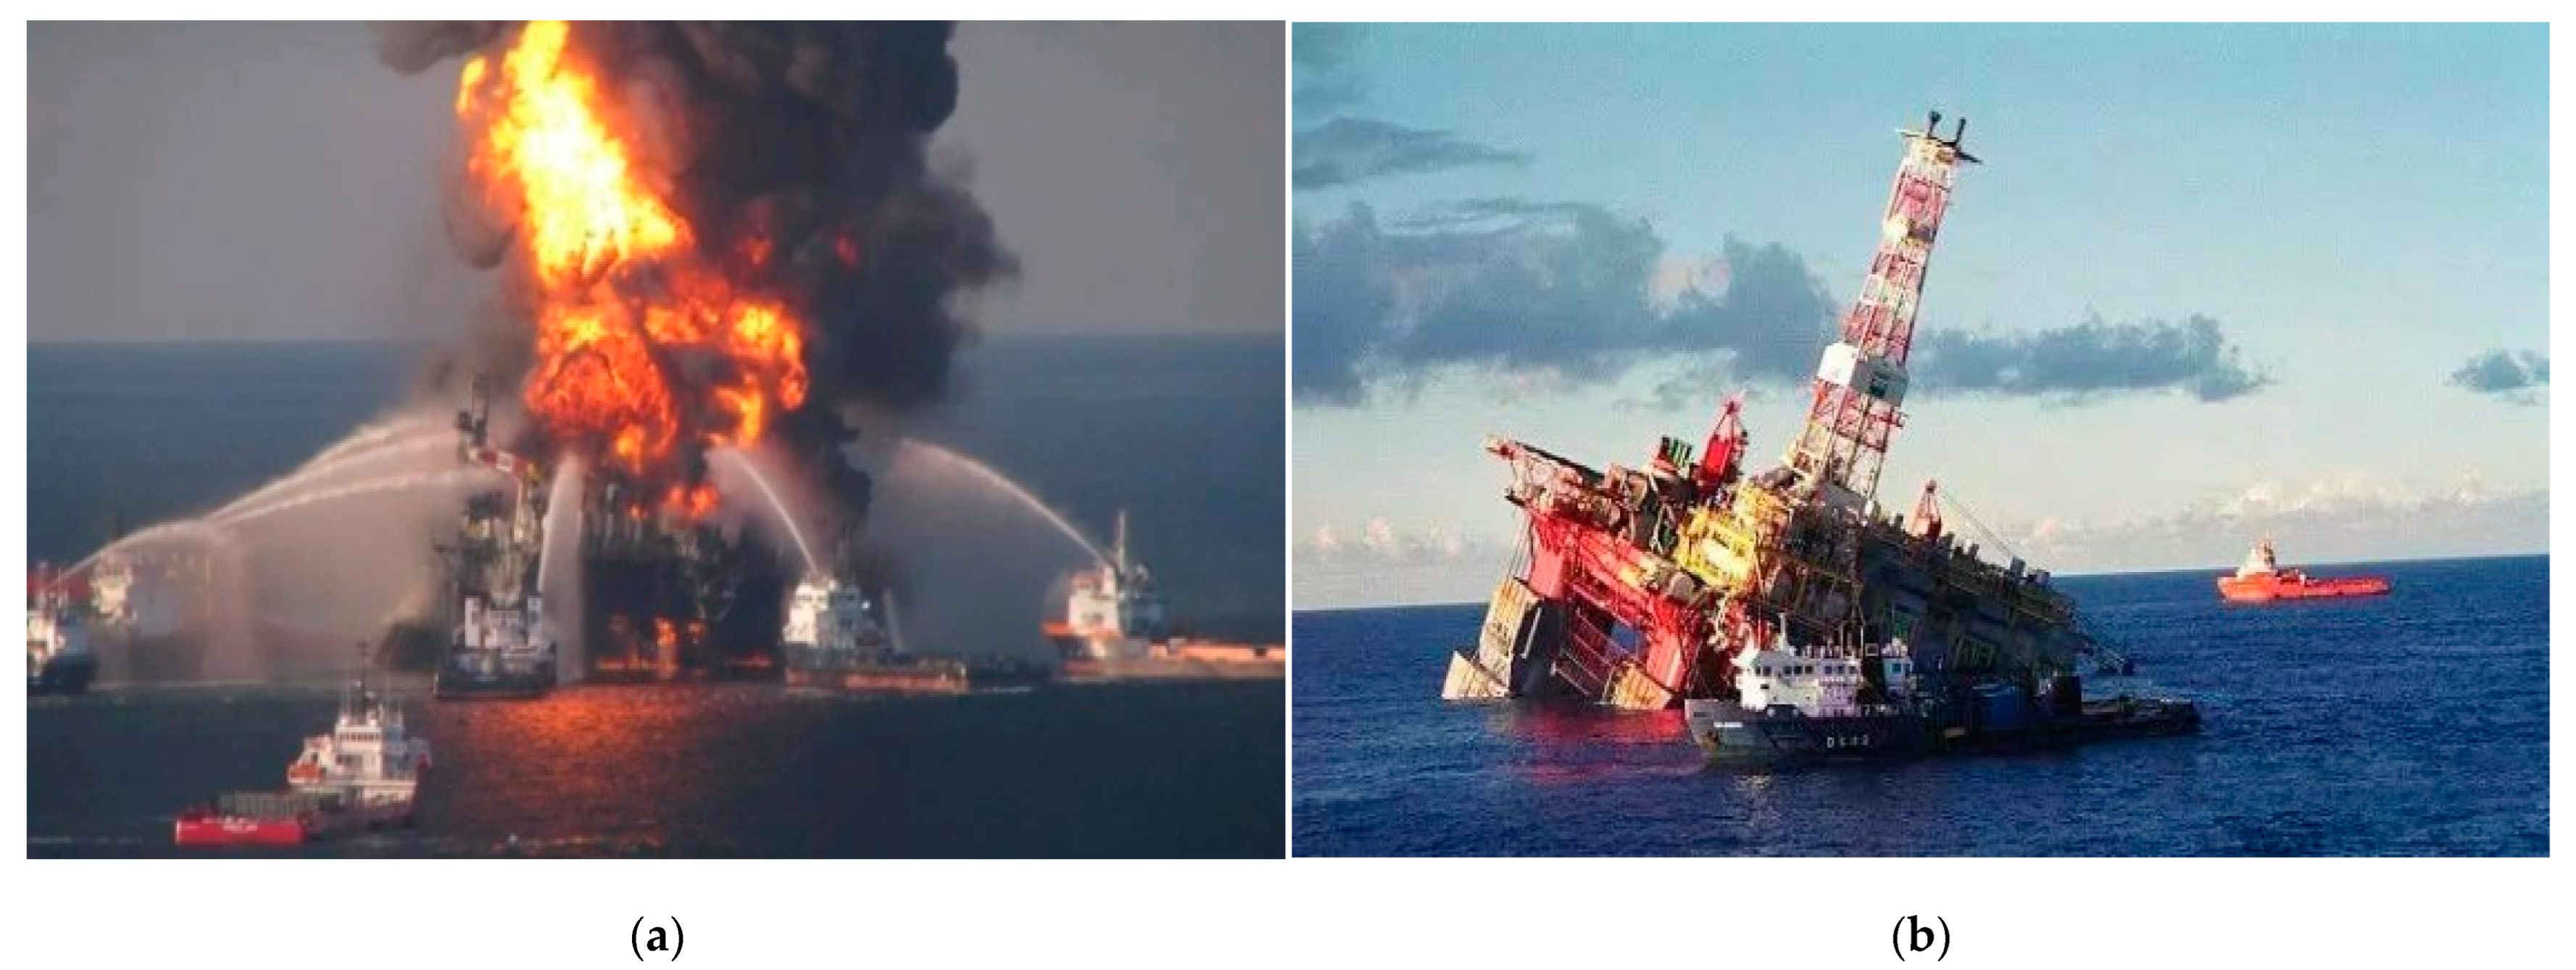
Ships and offshore structures carrying oil and gas are often subjected to high-temperature impact due to the large number of accidents including fires and explosions. Their structural collapse during fires causes not only significant casualties but also environmental catastrophes such as oil spills [1,2,3]. HSE (2007) reported that fire and explosion were considered the main hazards in more than 60 offshore accidents that occurred in the last 40 years [4], such as the Sanchi oil tanker accident on 6 January 2018 in the East China Sea and the U.S.S. Bonhomme Richard accident on 12 July 2020 in San Diego shown in Figure 1 [5,6].
The heat generated by the fire and explosion is transmitted through steel structures of the bulkheads and deck, which can ignite fires in other cabins, resulting in severe loss of personnel and economy and damage to the environment. In order to prevent the occurrence of this kind of accident risk, the structural members must meet the fire resistance grade specification determined by the standard fire resistance test and the tests of fire resistance properties for marine structures, such as decks and bulkheads in ships and offshore installations. These tests must be rigorously performed in adherence to the stipulations delineated in the Safety of Life at Sea (SOLAS) Regulation II-2/17 [7]. These evaluations are further guided by resolutions and directives issued by the International Maritime Organization (IMO) as well as recommendations from member nations. Additionally, pertinent standards established by classification societies, including the American Bureau of Shipping (ABS) [8] and the Russian Maritime Register of Shipping (RS) [9], are integrated into the evaluation process. The selection of an appropriate fire temperature model is crucial for accurately representing fire behavior and ensuring that the simulated conditions closely resemble real-world scenarios. Typically, fire resistance performance of structures is assessed using two distinct testing methodologies: the standard temperature regime and the hydrocarbon compound fire conditions. In Europe and the United States, the combustion of hydrocarbons and fire development are primarily examined in accordance with the hydrocarbon fire curve, wherein initial fire temperatures may reach 1000 °C or even exceed this threshold [9,10]. Conversely, in the Russian oil and gas complex (O&G) fire resistance evaluations, standard curves are employed to simulate fire environments for decks and bulkheads, as specified by the ISO-834 standard developed by ISO Technical Committee 92 [11]. However, it is important to note that analogous requirements for ship decks and bulkheads are exclusively regulated by stipulations pertaining to standard fire conditions.
In the 1950s, the international community commenced efforts to address the impact of fires on ships and offshore installations, conducting extensive research on temperature distribution and their fire resistance capabilities within structures. The European Steel Construction Association and the British Standard Institution have conducted numerous experimental studies using single component as an analysis object (such as steel beams and steel columns). The physical properties and mechanical properties of steel structures at high temperatures were investigated, and specifications for fire-resistant design of steel structures were written based on the test data [12,13]. Since then, many countries such as the United States and Europe have also carried out a large amount of theoretical and test research on material performance [14,15], nodes and components [16,17], and corresponding steel structure fire-resistant design standards have been produced. Based on the European standard, Hanus carried out a comprehensive high-temperature test of S500 M steel and studied the dynamic response process of a steel beam under rapid and slow heating. It was found that the failure temperature range of the steel beam was between 550 °C and 650 °C [18]. Based on a large number of experimental data and theoretical research results, many countries, regions and organizations have proposed the applicable constitutive models for fire resistance of steel structures. Zhang [19], Agarwal [20], Yao and Tan [21,22], Buchaan [23], etc. have studied the deformation damage mechanism of different structures, components and material performance of steel at high temperature based on relevant specifications and derived the analytical expression of damage deformation and bearing capacity analysis of specific structural injury in the event of a fire, which promotes the development of structural damage deformation prediction technology for fire accidents. Nassiraei H. [24] investigated the behavior of T/Y-joints reinforced with collar plates under compressive loading at elevated temperatures. Finite element modeling and experimental validation were conducted, revealing significant increases in initial stiffness and ultimate strength with increased collar plate length and thickness. A design formula was developed to determine the ultimate strength of these joints at elevated temperatures.
Due to the inability to recreate the real accident scenario well, the current research on the temperature distribution of offshore platform fire accidents mainly adopts numerical simulation methods. Kim [25] studied the fire resistance of FPSO’s upper deck based on the temperature distribution data obtained from the jet fire test of steel tubes and compared the test results using a numerical method, which provided valuable data support for the fire resistance design of FPSO’s superstructure. Based on this, Seo [26] proposed a method based on a risk-based optimization design procedure, utilizing probabilistic sampling and numerical simulation of a fire to determine fire accident loads. Computational fluid dynamics (CFD) software was used to conduct an A60 test based on thermal response analysis results and compute the temperature distribution, thereby establishing an optimized scheme for a thin-walled structure in a living area. In addition, the Paik team [27,28] of Busan National University in South Korea has used the method of combining experiment, theory and simulation: the structural response mechanism affected by fire was deeply explored, and the research process of structural response of offshore platform structure in complex accidents was promoted, which provides the basis for the safety design of offshore platform structures and the emergency response mechanism of accidents.
In order to ensure the safety of ships and offshore installation structures, most classification societies use insulation materials, which are usually non-combustible materials or materials with low combustion spread to strengthen the fire protection design of key cabins (such as cargo tanks and cabins) when a fire occurs. According to SOLAS Regulation II-2/17 [29] and the parameters of the fire-resistance limits and temperature exposure modes, the ships and offshore installation structures of the deck and bulkheads that separate industrial rooms are made of non-flammable materials and designed with certain fire-resistance classes: A, B, C and H (standard regime—A, B, C classes, and hydrocarbon—H class) [30]. Seo J.K. simulated the fire resistance of the A-60-level steel structure and calculated the temperature distribution for a certain road according to the simulation results. The analysis results show that the safety design of the sea cabin on the sea compartment complies with the specification requirements [31]. LeMoyne Boyer conducted full-scale tests on 21 steel bulkheads of different thicknesses and densities in the A-60, A-30, A-15 and A-0 classes according to IMO Resolution A 517 [32]. In addition, Zhou et al. conducted a numerical simulation of heat transfer to analyze the thermodynamic behavior associated with the generation of the cutting access openings in hull structures using the flame cutting method [33]. Park and Song also carried out fire resistance tests according to the test procedures specified in the MSC specification and analyzed fire resistance according to the material type of the bulkhead penetration [34].
The purpose of this study is to validate the numerical analysis and experimental results of transient heat transfer in A-60 grade steel structures. We utilized the fire test procedure (FTP) to verify the A-60 fire resistance specified in the Marine Safety Committee (MSC), including the design of the specimens, furnace temperature conditions and the setting of heating time. We conducted two sets of fire resistance tests on A-60 grade ship cabin walls and decks under standard fire conditions. Experimental and numerical analysis of the integrity loss and insulation capability of the cabin walls and decks were performed. This research can provide guidance for the design of fire-resistant ship cabin structures.

2. A-60 Class Decks and Bulkheads Fire Test Procedure (FTP)

2.1. Bulkheads and Decks Structure Specimen Design

The external dimensions of the A-60 class bulkhead core are 3020 mm in width and 2480 mm in height, with a steel plate thickness of 4.5 mm. For structural enhancement, six pieces of angle steel, each measuring 65 mm by 65 mm by 6 mm, have been incorporated as reinforcement, arranged at intervals of 600 mm. The A-60 class deck core, on the other hand, has external dimensions of 3020 mm in length and 2420 mm in width, with an identical steel plate thickness of 4.5 mm. To bolster its structural integrity, five pieces of angle steel, each sized 100 mm by 75 mm by 7 mm, have been employed as reinforcing elements, also arranged at intervals of 600 mm.
The insulation material for the test sample is ABM-FR6O marine fire-resistant mineral wool board. The specifications and dimensions of the insulation materials for the bulkheads are 1200 mm × 600 mm × 75 mm (90 kg/m3), 1200 mm × 600 mm × 25 mm (90 kg/m3) and 1200 mm × 600 mm × 50 mm (90 kg/m3) (Figure 2a). The insulation materials for the deck have dimensions of 1200 mm × 600 mm × 50 mm and 1200 mm × 600 mm × 25 mm (Figure 3a). On the steel plate surface (bulkhead/deck) with the supporting material, a layer of 75 mm/50 mm-thick rock wool board is laid, and on the surface of the supporting material, a layer of 25 mm/50 mm-thick, 115 mm/175 mm-wide (on the middle 4 supporting materials) and 90 mm/125 mm-wide (on the two vertical edge supporting materials) rock wool board is laid. They are all laid using the stud and fastening ring process. On both sides of the supporting material angle steel, a layer of 25 mm/50 mm-thick rock wool board that is level with the angle steel is placed vertically, and inside the supporting material angle steel, a 25 mm/50 mm-thick rock wool board is filled; on the top and bottom ends of each row of the supporting material in the width direction of the bulkhead core, a 50 mm-thick, 90 mm/150 mm-high rock wool board is also placed vertically. The maximum distance between the studs and the rock wool board seam on the bulkhead core is 100 mm; the distance between the studs in the width direction of the bulkhead core is 223 mm, 285 mm and 288 mm and in the height direction is 238.5 mm, 200 mm and 400 mm. The maximum distance between the studs and the rock wool board seam on the supporting material is 50 mm; the distance between the studs on the supporting material is 283 mm, 300 mm and 100 mm. There are about 20 studs per meter on the bulkhead (including those on the supporting material) (Figure 2b and Figure 3b).
In the standard fire resistance test, the bulkhead was tested in the vertical position with the steel structure side exposed to the fire, and the side with mineral wool and L-shaped stiffeners of the deck is exposed to the fire. The bulkhead and deck were mounted within a steel restraint frame with a 50 mm-thick refractory concrete lining. The temperature of the sample was measured by thermocouples. A total of 8 thermocouples were arranged on the unheated surface of the specimen. Thermocouples No. 1 to No. 5 were located at the centers of the four 1/4 regions of the bulkhead specimen and the center of the whole specimen, respectively. No. 6 and 7 were located at the height of 3/4 of the two supporting materials, and No. 8 was located at the corresponding position of the heat insulation material seam. All the thermocouples mentioned above were used to measure the temperature rise at each corresponding point, where No. 1 to No. 5 were also used to calculate the average temperature rise (Figure 2a and Figure 3a).

2.2. Experimental Apparatus and Experimental Procedure

The actual fire resistance test was carried out according to the FTP specification specified in MSC.307(88):
(1)
The initial laboratory ambient temperature was maintained at 20 °C, accompanied by a relative humidity of 68%. The average temperature of the unheated surface of the specimen was consistently measured at 20 °C as well.
(2)
The specimens underwent testing in a vertical furnace featuring two distinct furnace opening dimensions: 3000 mm × 3000 mm and 3000 mm × 2400 mm. Within the furnace, one thermocouple was installed per square meter, resulting in a total of nine plate thermocouples. The temperature measurement points were situated at a distance of 100 mm from the surface of the specimen facing the fire. The average inner furnace temperature was determined according to the standard temperature curve.
(3)
During the heating test, the furnace pressure was maintained at a slight positive pressure relative to the pressure in the laboratory. The pressure setting and control at the bottom of the bulkhead sample’s upward 2000 mm height was 12 Pa.
(4)
A total of eight thermocouples were arranged on the unexposed surface of the specimen. Thermocouples 1 through 5 were located at the center of the four quarter sections of the cabin wall specimen and the center of the entire specimen. Thermocouples 6 and 7 were positioned at the 3/4 height of the two stiffening members, while thermocouple 8 was situated at the corresponding location of the insulation material seam. All of these thermocouples were employed to measure the temperature rise at their respective points, with thermocouples 1 through 5 also being utilized for calculating the average temperature rise. Refer to Figure 2 and Figure 3 for further details.
(5)
Temperature readings were continuously monitored and documented during the entire testing duration. The specimen was deemed to comply with the regulations if it withstood the specified flame temperature for 60 min without smoke or flames penetrating the gap, and the structural integrity remained uncompromised. Furthermore, the average temperature increase of the unheated specimen surface was not to exceed 140 °C, and the maximum temperature of the unheated specimen surface was not to surpass 180 °C at the conclusion of the 60 min interval.

2.3. The Furnace Control Temperature Curve

Experimental A-60 class bulkhead and deck specimens were tested to determine their limit state during fire exposure according to IMO FTP Code Part 3 [35]. There are several heating curves for the temperature field analysis of structures in general fire accidents, such as the ASTM-E119 standard temperature rise curve developed in North America and elsewhere and the ISO-834 standard temperature rise curve developed by the International Organization for Standardization [36].
The heating furnace was configured to create a standard heating state according to the ISO-834 standard warming curve, as shown in Equation (1).
T = T 0 + 345 log ( 8 t + 1 )
where T is the temperature inside the furnace in °C, and T0 is the initial temperature inside the furnace; t is the time in minutes from the start of the test.
The comparison between the actual temperature inside the furnace (Actual) and the standard temperature curve (ISO-834) specified by ISO is shown in Figure 4. As shown in the figure, the actual temperature curve inside the furnace is in good agreement with the ISO standard temperature curve, and the temperature change specified by MSC.307(88) during the fire resistance test meets the internal test temperature requirements.

3. Fire Resistance Test Results

The actual fire resistance tests were conducted in accordance with the FTP Code specified in MSC.307(88). Both the deck and the bulkhead were installed in a vertical fire testing furnace, which was designed for testing A-class reinforced concrete frames for ships and offshore facilities. The furnace temperature was continuously controlled to comply with the standard combustion curve prescribed in ISO-834-1.

3.1. The Structural Integrity of Specimen

The A-60 deck and bulkhead fire resistance test was conducted at the Far East Fire Test Center. Figure 5, Figure 6, Figure 7 and Figure 8 depict the structural damage state and temperature distribution of the fire-resistant Class A-60 decks and bulkheads, both prior to and following the fire test.
Figure 6 presents the unheated surface of the A-60 deck following a 60-min fire test. Figure 6a illustrates the preparations prior to the fire test on the deck, while Figure 6b displays the state of the deck after being heated for 60 min. The annotations within the figure denote the respective locations where thermocouples were employed to measure temperature.
Figure 7 shows the heating surface of A-60 bulkhead before and after 60 min of fire test.
Based on the observed test results: (1) No flames crossed the unheated surface of the test specimen during the entire testing time. (2) No cracks, holes or other visible changes were observed on the sample, and no deflection values were measured. Gap measurements were conducted using 6 mm and 25 mm gauges. The 6 mm gauge could not penetrate the specimen. (3) The cotton pad ignition test was carried out on the unheated surface of the sample, and the results showed that the cotton pad was not ignited and there was no smoldering phenomenon. The heated surface remained intact without visible damage.

3.2. The Structural Thermal Insulation

According to the FTP specification specified in MSC.307(88), thermocouples are arranged on the unheated surface of the A-60 deck and bulkhead for temperature measurement. As shown in Table 1 and Table 2, at the end of 60 min, the maximum temperature rise for any thermocouple on the unheated surface of the A-60 deck was 177 °C, with an average temperature rise of 138 °C for thermocouples 1 through 5. At the conclusion of the 60 min period, the maximum temperature rise for any thermocouple on the unheated surface of the A-60 bulkhead was 158 °C, with an average temperature rise of 137 °C for thermocouples 1 through 5. The structure met the regulatory requirements.
According to the test reports, the temperature measured by thermocouples in the furnace was determined as an absolute value, and the temperature on the unheated surface was recorded and displayed as the difference between the ambient temperature and the temperature on the unheated surface.

3.3. The Structural Thermal Insulation

The deformation records of the A-60 deck and bulkhead centers during the test are presented in Table 3.
Based on the deformation table, it can be observed that the center of the A-60 deck did not undergo any deformation during the first 15 min. After 30 min, as the temperature increased, the deck center began to exhibit concave deformation towards the furnace interior, with the deformation gradually increasing. At the end of the 60 min test, the maximum deformation at the center was 28 mm. During the fire resistance test for the A-60 bulkhead, the bulkhead center began to show concave deformation towards the furnace interior within the first 15 min, with a maximum value of 103 mm. Subsequently, as the temperature increased, the deformation gradually decreased, and at the end of the 60 min test, the bulkhead center deformation was 54 mm.

4. Simulation of Bulkhead and Deck Section Heating

4.1. The Finite Element Model

Finite element simulation analysis of the heating process for the bulkhead and deck sections was conducted using the finite element software Abaqus2020. The temperature distribution and structural deformation of the deck and bulkhead were analyzed through sequential thermomechanical coupling analysis. The time step and the total loading time were set to 60 s and 3600 s, respectively. The results of each sub-step were saved to facilitate the post-processing and observation of the temperature field over time.
To investigate the influence of mesh size on the computational results, a mesh sensitivity analysis was performed for the numerical analysis of the deck and bulkhead. The models were divided into meshes with different sizes, considering mesh sizes of 10 mm, 12 mm, 15 mm, 20 mm, 25 mm and 30 mm, using a uniform meshing approach. Thermal-mechanical coupling analysis was carried out for the models with different mesh sizes to obtain the temperature distribution and structural deformation results of the deck and bulkhead. The results are shown in Figure 9 and Figure 10.
It can be seen from the calculation results of Figure 9a that the temperature distribution of deck and bulkhead does not change significantly with the change of grid size. This shows that in the numerical simulation analysis, the mesh size has little effect on the temperature distribution during the structural fire resistance test.
According to the calculation results of Figure 9b, with the increase of mesh size, the displacement at the center point of deck and bulkhead structure decreases gradually. The deformation trends of deck and bulkhead structures with different mesh sizes are consistent with the experimental results. Considering both calculation accuracy and calculation efficiency, the structural grid size of 10 mm is selected for finite element numerical calculation.
As shown in Figure 10, the element types used in the finite element model of the A-60 deck and bulkhead for a heat transfer analysis are eight-node linear heat transfer tetrahedron solids. In order to calculate the accuracy, the finite element mesh size of the mineral wool is 10 mm, and the mesh size of the steel plate is also 10 mm. In order to transfer heat between the mineral wool and steel sheets, binding coupling constraints are used between the mineral wool and the steel plates.

4.2. Materials and Methods

In the study of structural responses of steel constructions and mineral wool under high-temperature conditions, it is crucial to account for the impacts of temperature elevations on the performance of both steel structures and mineral wool. Determining the material parameters of steel and mineral wool at varying temperatures is necessary, including specific heat capacity, thermal conductivity, convective heat transfer coefficient and thermal expansion coefficient, among others. This lays the foundation for subsequent numerical simulation analyses of steel structures and mineral wool under the influence of high temperatures.
In the simulation of heating, the thermal conductivity equation is used in the three-dimensional temperature field [37], as shown in Equation (2).
ρ C T t = k 2 T x 2 + 2 T y 2 + 2 T z 2
where T is the temperature inside the furnace in °C; k is the thermal conductivity in W/(m·K); t is the time in minutes from the start of the test in °C; C is the specific heat capacity in J/(kg·K) and ρ is the density in kg/m3. During numerical analysis, both thermal conductivity and specific heat capacity vary with temperature. Therefore, in subsequent calculations, it is imperative to consider the effects induced by temperature changes. However, the influence of increasing temperature on density is not pronounced and is thus disregarded in this context.
Before the standard fire test occurs, the specimen is at ambient temperature, and it is assumed that the entire structure section temperature is uniform and equal to the ambient temperature T0. The ambient temperature is averaged according to the test report and is assumed to be 20 °C.

4.2.1. Convective Heat Transfer Coefficient of Steel and Mineral Wool

There are four types of heat transfer relations on the boundary of the specimen: convective heat exchange between the surface of the specimen and the high-temperature gas inside the furnace, radiant heat from the high-temperature gas to the specimen, radiant heat from the furnace wall to the specimen and radiant heat from the specimen to the outside. The boundary condition of the specimen under the condition of the fire resistance test is the third type of boundary, as shown in Equation (3) [38].
k T n = α T 0 T
where α is the convective heat transfer coefficient in W/(m2·K), mean 25 W/(m2·K); k is the thermal conductivity in W/(m·K); T0 is the initial temperature inside the furnace in °C.

4.2.2. Radiative Heat Transfer Coefficient of Steel and Mineral Wool

The radiation heat transfer condition is set at the boundary of the model. The radiation heat transfer is determined according to Equation (4) [39].
F n = k S B × β × T 4 T 0 4
where kSB is the Stefan–Boltzmann constant in W/(m2·K4), mean 5.67 × 10⁻⁸ W/(m2·K4); β is the surface absorption coefficient, and the surface absorption coefficient is set at 0.5 [37].
The material characteristics of mineral wool differ from those of bulkhead and deck. Its thermal conductivity and specific heat capacity increase with the increase in temperature. Previous research results have shown this, as indicated in Table 4 [40,41], “Kwool” is employed to denote the thermal conductivity of mineral wool.

4.2.3. Physical Properties of Steel

In investigating the response of steel structures under high-temperature conditions, the initial step is to ascertain the temperature distribution within the structure. Unlike the mechanical properties of steel under normal temperature static loads, the strength and stiffness of steel significantly decline when it exceeds a certain temperature, a phenomenon referred to as “steel softening”. At this point, the steel structure undergoes substantial plastic deformation, losing its original load-bearing capacity. This section collates and summarizes the physical and mechanical properties of Grade A steel material models ranging from 20 to 1000 °C, including specific heat capacity, thermal conductivity, convective heat transfer coefficient and thermal expansion coefficient. Notably, the impact of increased temperature on steel density and Poisson’s ratio is negligible, and thus this analysis disregards the temperature effects on these factors (with density assumed as 7850 kg/m3 and Poisson’s ratio as 0.3). This provides a foundation for subsequent numerical simulation analyses.

4.2.4. Specific Heat Capacity of Steel

Specific heat capacity refers to the amount of heat absorbed or released by a unit mass of steel for a unit temperature rise or drop, with units of J/(kg·K) or J/(kg·°C).
The European Standard (EC3) [13] stipulates:
C steel = 425 + 7.73 × 10 1 T 1.69 × 10 3 T 2 + 2.22 × 10 6 T 3 20 T < 600   ° C C steel = 666 + 13002 / ( 738 T ) 600 T < 735   ° C C steel = 545 + 17820 / ( T 731 ) 735 T < 900   ° C C steel = 650 900 T < 1200   ° C
The specific heat capacity of 20–700 °C steel calculated with reference to EC3 is shown in Table 5.

4.2.5. Thermal Conductivity of Steel

Thermal conductivity k refers to the amount of heat transferred per unit area per unit time through a unit thickness of steel, under steady heat transfer conditions and with a temperature difference of 1 °C between the upper and lower surfaces. Its units are either A or B. According to the European Standard (EC3), thermal conductivity decreases with increasing temperature, and the rate of change slows when the temperature exceeds 800 °C.
k steel = 54 3.33 × 10 2 T 20 T < 800   ° C k steel = 27.3 800 T < 1200   ° C
Thermal conductivity of steel at 20–1000 °C calculated according to European Standard (EC3) is shown in Table 6.

4.2.6. Stress–Strain Relationship of Steel

As the temperature rises to a certain level (generally above 300 °C), the strength and stiffness of steel gradually decrease and rapidly decline after surpassing a certain temperature (typically 600 °C). Consequently, the structure undergoes substantial plastic deformation, losing its load-bearing capacity.
Different standards provide diverse theoretical stipulations for the reduction coefficients (TRCs) of yield strength and modulus of elasticity of steel materials under high-temperature conditions. According to the theoretical formulas of different standards [12,13,42,43], TRCs for yield strength and modulus of elasticity were calculated, as shown in Figure 11.
From the Figure 11a, it can be observed that several standards show the same trend for the relationship between yield strength and temperature. The yield strength of steel gradually decreases before reaching 300 °C. When the temperature exceeds 300 °C, the yield strength rapidly decreases with increasing temperature. When the temperature reaches 700 °C, the yield strength stipulated by these standards is only 10% to 20% of that at room temperature.
From the Figure 11b, the relationship between the modulus of elasticity and temperature stipulated by the standards also follows the same trend. The modulus of elasticity as defined by ECCS and EC3 decreases slowly before 300 °C and rapidly declines after 300 °C. In comparison, the modulus of elasticity as defined by CECS and ISO19901-3 continually decreases in the range of 20 °C to 700 °C, without the apparent ”slow-then-rapid” phenomenon.
In this study, the reduction coefficients for the modulus of elasticity and yield strength of steel materials at high temperatures, as defined by ISO19901-3, were taken as the standard. The tensile test data of marine grade A steel [44] were adjusted accordingly, and the elastic modulus of the material at different temperatures and the engineering stress-strain relationship are shown in Figure 12 and Figure 13.
In finite element numerical simulation calculations, it is necessary to correct the engineering stress–strain relationship and convert it into the true stress–strain relationship. In this study, the “combined material” relationship curve [45] was adopted to address the conversion from engineering to true stress–strain relationship:
The true stress and strain before necking can be calculated from the engineering stress and strain using the following equation:
σ t = σ e ( ε e + 1 )
ε t = ln ( ε e + 1 )
The true stress–strain curve after necking:
σ t = C ε t n
where n = ln ( 1 + A g ) ; C = R m ( e / n ) n ; A g = 1 / ( 0.24 + 0.01395 R m ) ; R m is the ultimate tensile stress from the tensile test, e is the base of the natural logarithm and A g is the maximum uniform strain related to the ultimate tensile stress.
By connecting the above two segments with a straight line, the converted true stress–strain curve can be directly used for the material input in the simulation, as shown in Figure 14.

5. Results and Discussion

5.1. Structure Temperature Distribution

Based on the thermomechanical coupling analysis, the temperature distribution of the structure was calculated and mapped onto the finite element models (a) and (b). Figure 15 and Figure 16 show the contour maps of the overall temperature distribution on the deck and cabin walls after 60 min of heating.
As Table 7 shows, the temperature of each thermocouple area on the unheated surface of the A-60 deck changes evenly over time. In the first 30 min, due to the protection provided by the mineral wool, the temperature of most regions in the sample changes little. As the temperature continues to rise, the temperature change gradient in the center of the sample increases. The temperature change around the reinforcing rib in the middle gradually becomes higher than in other areas.
The results of the finite element analysis indicate that at the end of 60 min, the maximum temperature rise of any thermocouple is 179 °C. The average temperature rise of thermocouples 1 to 5 is 140 °C. The structure meets the FTP specification specified in MSC.307(88).
The results of the finite element analysis, shown in Table 8, indicate that the outer edge of the sample maintains its shape, while the interior of the sample begins to degenerate. Since the outer edge of the sample is close to high-temperature airflow, the temperature is high, and the gradient is large. On the other hand, the deepening of the sample causes both temperature and gradient to decrease. Due to the protection provided by the mineral wool in the first 30 min, the temperature in most areas inside the sample remains low. As the temperature inside the furnace continues to rise, the gradients at the outer edge continue to increase and gradually move toward the middle of the sample. The temperature of the tendon gradually decreases, forming five low-temperature zones with uniform temperatures.
The results of the finite element analysis indicate that at the end of 60 min, the maximum temperature rise of any thermocouple is 158 °C. The average temperature rise of thermocouples 1 to 5 is 137.2 °C. The structure meets the FTP specification specified in MSC.307(88).

5.2. Structural Deformation

In the nonlinear finite element analysis, a thermomechanical coupled analysis was employed to calculate the central displacement of the structure under thermal loads. The deformation records at the center of the A-60 deck and cabin walls during the simulation process are shown in Table 3. At the end of the simulation, the deformation cloud diagrams of the deck and cabin walls are presented in Figure 17.
Figure 17a,b respectively show the structural deformation of the deck and bulkhead at 60 min during the thermomechanical coupling analysis. From the figures, it can be observed that the maximum thermal deformation of the bulkhead specimen is 51.44 mm, while the maximum deformation of the deck specimen is 27.34 mm. Both maximum deformations occur at the center of the specimens.
According to the deformation Table 9, it can be observed that the deformation at the center of the A-60 deck is relatively slow within the first 15 min. After 30 min, as the temperature rises, the deformation at the deck center begins to accelerate, and the amount of deformation gradually increases. At the end of the 60 min test, the maximum deformation at the center is 27.3 mm. During the fire resistance test on the A-60 bulkhead, a larger deformation occurs at the bulkhead center within the first 15 min, with a maximum value of 105 mm. Subsequently, as the temperature rises, the amount of deformation gradually decreases, and at the end of the 60 min test, the deformation at the bulkhead center is 51.44 mm.

5.3. Comparative Analysis of Test and Simulation

Experimental and simulated average and maximum temperature rise record curves of the unheated surface of the A-60 deck and bulkhead are shown in Figure 18 and Figure 19.
The simulation results using Abaqus on the heating of the A-60 cabin wall and deck show that the temperature of the deck and cabin wall increases slowly between 20 and 30 min and increases quickly between 30 and 50 min. During the 50–60 min period, the temperature of the test specimen increases gradually. The simulation results for the cabin wall have an error of within 25% during the 20–30 min period, but the simulation results for the deck and cabin wall match the experimental results well (with a difference of no more than 5%). The main reason for this error is that the test report does not provide information about the presence of additional fire retardants (including water-based adhesives) in the partition structure, and mineral wool is a dry fire retardant containing organic matter and water, which cannot be simulated in the simulation.
As shown in Figure 20, during the heating process, the deck structure undergoes deformation rather slowly at the initial stage. With the increase in temperature, thermal expansion begins at the central point of the deck structure, causing the structure to shift towards the furnace. In the heating process of the bulkhead structure, given that the heating surface is on one side of the steel plate and considering that the thermal conductivity of the steel plate is significantly higher than that of the mineral wool, the steel plate undergoes rapid thermal expansion and deformation at the onset of heating under the effect of gravity. Once the mineral wool absorbs enough heat, thermal expansion begins in the mineral wool structure, leading to a slow shift of the structural deformation in the opposite direction. The displacement changes measured at the centers of the deck and bulkhead during the test align well with the results of the simulation calculations, with the error value within 10 percent. These simulation calculations can provide a reference for the subsequent fire resistance tests.

6. Conclusions

This study employed both experimental and numerical simulation techniques to investigate the temperature distribution and structural deformation of the A-60 deck and bulkhead during fire resistance tests.
The primary conclusions of this research include the following points:
  • In this study, the fire resistance performance of the A-60 deck and bulkhead was numerically analyzed using Abaqus software. The simulation analysis of the standard fire resistance test for A-60 deck and bulkhead was conducted by selecting appropriate finite element units and material parameters. The simulation results showed good agreement with the experimental results (with an error within 5%), indicating the effectiveness of this study in predicting the performance of the samples and saving time and costs.
  • In the standard fire resistance test of the A-60 ship deck and bulkhead, the average temperature rise on the unexposed surface at 60 min did not exceed 140 °C compared to the initial temperature, and the temperature rise at any point on the unexposed surface did not exceed 180 °C compared to the initial temperature. Throughout the entire testing process, no smoke or flame penetration occurred, and the structure remained intact. The structure met the specification requirements. Therefore, this study provides guidance for the design of fire-resistant ship compartment structures.
  • There is a certain discrepancy between the finite element numerical analysis results and the fire resistance test. The main reason for this discrepancy is the lack of information in the test report regarding the presence of additional fire retardants (including water-based adhesives) in the partition structure. Mineral wool, being a dry fire retardant containing organic matter and water, cannot be accurately reproduced in the simulation. Further research is needed to strengthen the study of the thermal performance of mineral wool at high temperatures.

Author Contributions

Conceptualization, S.Z. and W.Q.; Writing—original draft, S.Z.; Writing—review and editing, Z.G. and K.L.; Visualization, K.L. and J.W. All authors have read and agreed to the published version of the manuscript.

Funding

This research was funded by the National Natural Science Foundation of China (Grant No. 52171311; Grant No. 52271279).

Institutional Review Board Statement

Not applicable.

Informed Consent Statement

Not applicable.

Data Availability Statement

Not applicable.

Conflicts of Interest

The authors declare no conflict of interest.

References

  1. Paik, J.K.; Czujko, J.; Kim, B.J.; Seo, J.K.; Ryu, H.S.; Ha, Y.C.; Janiszewski, P.; Musial, B. Quantitative assessment of hydrocarbon explosion and fire risks in offshore installations. Mar. Struct. 2011, 24, 73–96. [Google Scholar] [CrossRef]
  2. Andryushkin, A.Y.; Kirshina, A.A.; Kadochnikova, E.N. The evaluation of the fire-retardant efficiency of intumescent coatings of steel structures exposed to high-temperature gas flows. Fire Explos. 2021, 30, 14–26. [Google Scholar] [CrossRef]
  3. Gravit, M.; Zimin, S.; Lazarev, Y.; Dmitriev, I.; Golub, E. Fire simulation of bearing structures for natural gas module plant. In International Scientific Siberian Transport Forum; Springer: Cham, Switzerland, 2019; pp. 365–376. [Google Scholar]
  4. Veritas D, N. Accident statistics for floating offshore units on the UK continental shelf 1980–2005. Health and Safety Executive (HSE) Report. [Online] (Updated 2007). Available online: http://www.hse.gov.uk/research/-rrpdf/rr567.pdf (accessed on 1 October 2013).
  5. Vinnem, J.E.; Røed, W. Offshore Risk Assessment Vol. 1. In Principles, Modelling and Applications of QRA Studies; Springer: Berlin/Heidelberg, Germany, 2014. [Google Scholar]
  6. Woo, D.; Seo, J.K. Numerical validation of the two-way fluid-structure interaction method for non-linear structural analysis under fire conditions. J. Mar. Sci. Eng. 2021, 9, 400. [Google Scholar] [CrossRef]
  7. Zisimopoulos D, A. Use of Fiber Reinforced Plastics in Ship Construction: A Study of SOLAS regulation II-2/17 on Alternative Design and Arrangementsfor Fire Safety. 2016. Available online: https://dspace.lib.ntua.gr/xmlui/handle/123456789/42464?show=full (accessed on 10 May 2023).
  8. Russian Maritime Register of Shipping. Available online: https://rs-class.org/en/ (accessed on 22 November 2021).
  9. Imran, M.; Liew, M.S.; Nasif, M.S.; Gracia, E.M.; Danyaro, K.U.; Niazi, M.U. Thermal and Mechanical Response of Partially Protected Steel I-Beam under Fire. MATEC Web Conf. EDP Sci. 2018, 203, 06009. [Google Scholar] [CrossRef]
  10. Gravit, M.; Gumerova, E.; Bardin, A.; Lukinov, V. Increase of fire resistance limits of building structures of oil-and-gas complex under hydrocarbon fire. In Energy Management of Municipal Transportation Facilities and Transport; Springer: Cham, Switzerland, 2017; pp. 818–829. [Google Scholar]
  11. ISO 834-75; Fire-Resistance Tests—Elements of Building Construction. ISO: Geneva, Switzerland, 1975.
  12. ECCS. European recommendations for the fire safety of steel structures. In Calculation of the Fire Resistant; Elsevier Scientific Pub. Co.: Amsterdam, The Netherlands, 1983. [Google Scholar]
  13. British Standard Institution. Structural Use of Steelwork in Building; British Standard Institution: Chiswick, UK, 2000. [Google Scholar]
  14. Kirby, B.R.; Preston, R.R. High temperature properties of hot-rolled, structural steels for use in fire engineering design studies. Fire Saf. J. 1988, 13, 27–37. [Google Scholar] [CrossRef]
  15. Twilt, L. Strength and deformation properties of steel at elevated temperatures: Some practical implications. Fire Saf. J. 1988, 13, 9–15. [Google Scholar] [CrossRef]
  16. Anderberg, Y.; Forsen, N.; Aasen, B. Measured and Predicted Behaviour of Steel Beams and Columns in Fire; Department of Fire Safety Engineering and Systems Safety, Lund University: Lund, Sweden, 1986; Volume 1, pp. 259–269. [Google Scholar]
  17. SkowrońSki, W. Buckling fire endurance of steel columns. J. Struct. Eng. 1993, 119, 1712–1732. [Google Scholar] [CrossRef]
  18. Hanus, F.; Vassart, O.; Caillet, N.; Franssen, J.M. High temperature full-scale tests performed on S500M steel grade beams. J. Constr. Steel Res. 2017, 133, 448–458. [Google Scholar] [CrossRef]
  19. Zhang, C.; Li, G.Q.; Wang, Y.C. Predictability of buckling temperature of axially loaded steel columns in fire. J. Constr. Steel Res. 2012, 75, 32–37. [Google Scholar] [CrossRef]
  20. Agarwal, A.; Choe, L.; Varma, A.H. Fire design of steel columns: Effects of thermal gradients. J. Constr. Steel Res. 2014, 93, 107–118. [Google Scholar] [CrossRef]
  21. Tan, K.H.; Yao, Y. Fire resistance of reinforced concrete columns subjected to 1-, 2-, and 3-face heating. J. Struct. Eng. 2004, 130, 1820–1828. [Google Scholar] [CrossRef]
  22. Yao, Y.; Tan, K.H. Fire resistance of four-face heated reinforced concrete columns. J. Struct. Eng. 2003, 129, 1220–1229. [Google Scholar]
  23. Buchanan, A.H.; Abu, A.K. Structural Design for Fire Safety; John Wiley & Sons: Hoboken, NJ, USA, 2017. [Google Scholar]
  24. Nassiraei, H. Static strength of tubular T/Y-joints reinforced with collar plates at fire induced elevated temperature. Mar. Struct. 2019, 67, 102635. [Google Scholar] [CrossRef]
  25. Kim, B.J.; Seo, J.K.; Park, J.H.; Jeong, J.S.; Oh, B.K.; Kim, S.H.; Park, C.H.; Paik, J.K. Load characteristics of steel and concrete tubular members under jet fire: An experimental and numerical study. Ocean. Eng. 2010, 37, 1159–1168. [Google Scholar] [CrossRef]
  26. Seo, J.K.; Lee, S.E.; Park, J.S. A method for determining fire accidental loads and its application to thermal response analysis for optimal design of offshore thin-walled structures. Fire Saf. J. 2017, 92, 107–121. [Google Scholar] [CrossRef]
  27. Kim, S.J.; Lee, J.; Kim, S.H.; Seo, J.K.; Kim, B.J.; Ha, Y.C.; Paik, J.K.; Lee, K.S.; Park, B.; Ki, M.S.; et al. Nonlinear structural response in jet fire in association with the interaction between fire loads and time-variant geometry and material properties. Ocean. Eng. 2017, 144, 118–134. [Google Scholar] [CrossRef] [Green Version]
  28. Darbra, R.M.; Palacios, A.; Casal, J. Domino effect in chemical accidents: Main features and accident sequences. J. Hazard. Mater. 2010, 183, 565–573. [Google Scholar] [CrossRef] [PubMed]
  29. Flis, L. Application of the rules of the American Bureau of Shipping (ABS) to design mobile offshore structures. Marit. Tech. J. 2016, 205, 17–28. [Google Scholar] [CrossRef]
  30. ABS Rules for Building and Classing Facilities on Offshore Installations. Rules for Building and Classing Facilities on Offshore Installations 2021. Available online: https://infostore.saiglobal.com/en-au/?productID=1787173 (accessed on 10 May 2023).
  31. Kim, S.J.; Lee, J.; Paik, J.K.; Seo, J.K.; Shin, W.H.; Park, J.S. A study on fire design accidental loads for aluminum safety helidecks. Int. J. Nav. Archit. Ocean. Eng. 2016, 8, 519–529. [Google Scholar] [CrossRef] [Green Version]
  32. Boyer, L.M. Thermal Radiation from Marine Fire Boundaries: Evaluation and Analysis of A-60, A-30, A-15, and A-0 Bulkhead Assemblies; Wyman-Gordon Co.: Worcester, MA, USA, 1993. [Google Scholar]
  33. Zhou, B.; Han, X.; Guo, W.; Liu, Y.; Tan, S.K. Numerical and experimental study on cutting access opening in ship structure. J. Ship Prod. Des. 2017, 33, 12–23. [Google Scholar] [CrossRef]
  34. Park, W.C.; Song, C.Y. Heat transfer characteristics of bulkhead penetration piece for A60 class compartment II: Fire resistance test for piece material and insulation types. J. Ocean. Eng. Tech. 2019, 33, 340–349. [Google Scholar] [CrossRef] [Green Version]
  35. Res I M O. MSC 307 (88)-International Code for Application of Fire Test Procedures. Annex1, Part3–Part4, 2010. Available online: https://wwwcdn.imo.org/localresources/en/KnowledgeCentre/IndexofIMOResolutions/MSCResolutions/MSC.307(88).pdf (accessed on 10 May 2023).
  36. Maraveas, C.; Tsavdaridis, K.D.; Nadjai, A. Fire Resistance of Unprotected Ultra Shallow Floor Beams (USFB): A Numerical Investigation. Fire Technol. 2017, 53, 609–627. [Google Scholar] [CrossRef] [Green Version]
  37. Markus, E.S.; Snegirev, A.Y.; Kuznetsov, E.A. Numerical Simulation of a Fire Using Fire Dynamics; St. Petersburg Polytech-Press: St. Petersburg, Russia, 2021; p. 175. [Google Scholar]
  38. ENBS 1-2:2002; Eurocode 1: Actions on Structures—Part 1-2: General Actions—Actions on Structures Exposed to Fire. British Standards: Chiswick, UK, 1991.
  39. ELCUT. Modeling of Two-Dimensional Fields by the Finite Element Method. Available online: https://elcut.ru/free_doc_r.htm (accessed on 6 January 2022).
  40. Code of Practice. SP 50.13330.2012. Thermal Performance of the Buildings. Available online: https://docs.cntd.ru/document/1200095525 (accessed on 11 January 2022).
  41. Paudel, D.; Rinta-Paavola, A.; Mattila, H.P.; Hostikka, S. Multiphysics modelling of stone wool fire resistance. Fire Technol. 2021, 57, 1283–1312. [Google Scholar] [CrossRef]
  42. CECS 200:2006; China Association for Engineering Construction Standardization—Technical Code for Fire Safety of Steel Structures in Buildings. China Planning Publishing House: Beijing, China, 2006.
  43. Neumann, N. Study of ISO 19901-3 Building Code Correspondence Factor for Eurocode 3. Am. Soc. Mech. Eng. 2013, 55324, V02AT02A023. [Google Scholar]
  44. Liu, K.; Wang, Z.; Tang, W.; Zhang, Y.; Wang, G. Experimental and numerical analysis of laterally impacted stiffened plates considering the effect of strain rate. Ocean. Eng. 2015, 99, 44–54. [Google Scholar] [CrossRef]
  45. Richard, A.; Villavicencio, F. Response of Ship structural components to Impact Loading; Lisbon University of Technology: Lisbon, Portugal, 2012. [Google Scholar]
Figure 1. (a) Sanchi oil tanker and (b) U.S.S. Bonhomme Richard (right) accidents.
Jmse 11 01200 g001
Figure 2. (a) Location of thermocouples on bulkhead A-60; (b) section of A-60 bulkhead specimen. (unit: mm).
Jmse 11 01200 g002
Figure 3. (a) Location of thermocouples on deck A-60; (b) section of A-60 deck specimen. (unit: mm).
Jmse 11 01200 g003
Figure 4. Verification of the time–temperature curve for the furnace.
Jmse 11 01200 g004
Figure 5. Heated surface of the A-60 deck before (a) and after (b) fire test (60 min) (The enlarged area in (b) is the damage area of mineral wool and marked.)
Jmse 11 01200 g005
Figure 6. Unheated surface of the A-60 deck before and after fire test (60 min).
Jmse 11 01200 g006
Figure 7. Heated surface of the A-60 bulkhead before (a) and after (b) fire test (60 min).
Jmse 11 01200 g007
Figure 8. Unheated surface of the A-60 bulkhead before and after fire test (60 min). (a) shows the preparation of the bulkhead before the fire test, and (b) shows the state of the bulkhead after heating for 60 min.
Jmse 11 01200 g008
Figure 9. (a) The variation of structural temperature with mesh size. (b) The variation of displacement deformation with mesh size.
Jmse 11 01200 g009
Figure 10. (a) Finite element model of A-60 deck; (b) finite element model of A-60 bulkhead.
Jmse 11 01200 g010
Figure 11. (a) The yield strength–temperature relationship and (b) the elastic modulus–temperature relationship.
Jmse 11 01200 g011
Figure 12. The stress–strain relationship of materials at different temperatures.
Jmse 11 01200 g012
Figure 13. The Young’s modulus–temperature relationship.
Jmse 11 01200 g013
Figure 14. True stress–strain curves at different temperatures.
Jmse 11 01200 g014
Figure 15. (a) Surface exposed to the inside furnace of the A-60 deck; (b) surface unexposed to the inside furnace of the A-60 deck.
Jmse 11 01200 g015
Figure 16. (a) Surface exposed to furnace of A-60 bulkhead; (b) surface unexposed to furnace of A-60 bulkhead.
Jmse 11 01200 g016
Figure 17. (a) Deformation of A-60 bulkhead; (b) deformation of A-60 deck.
Jmse 11 01200 g017
Figure 18. (a) Experimental and simulated maximum temperature rise record curves of unheated surface of A-60 deck; (b) experimental and simulated average temperature rise record curves of unheated surface of A-60 deck.
Jmse 11 01200 g018
Figure 19. (a) Experimental and simulated maximum temperature rise record curves of unheated surface of A-60 bulkhead. (b) Experimental and simulated average temperature rise record curves of unheated surface of A-60 bulkhead.
Jmse 11 01200 g019
Figure 20. (a) Experimental and simulated displacement curves of unheated surface of A-60 deck. (b) Experimental and simulated displacement curves of unheated surface of A-60 bulkhead.
Jmse 11 01200 g020
Table 1. Experimental temperature change of different thermocouples on unheated surface of A-60 deck.
Te (°C)Time (min)
0102030405060
No. 1010426695120140
No. 2013365985108124
No. 3010355882106123
No. 408356294125150
No. 508396597128154
Mean09376290117138
No. 609285792138177
No. 705315987123155
No. 8064674106132154
Table 2. Experimental temperature change of different thermocouples on unheated surface of A-60 bulkhead.
Te (°C)Time (min)
0102030405060
No. 103164474141156
No. 201932466692
No. 302164794146158
No. 401144775142158
No. 501123149112122
Mean01134067121137
No. 602916345368
No. 7011023426184
No. 802124464117156
Table 3. A-60 deck center deformation displacement table after the test.
0 min15 min30 min45 min60 min
Deck center (mm)0051628
Bulkhead center (mm)0103835554
Table 4. The main characteristics of mineral wool for structures.
Te (°C)Kwool W/(m·K)Cwool J/(kg·K)
1010030010100300
0.0350.0460.085840860900
Table 5. Specific heat capacity of steel at elevated temperatures.
Te (°C)201002003004005006007008009001000
Csteel J/(kg·K)4394875295646056667601008803650650
Table 6. The heat conductivity coefficient of steel at elevated temperatures.
Te (°C)201002003004005006007008009001000
ksteel W/(m·K)53.350.747.34440.737.43430.727.327.327.3
Table 7. Simulated temperature change of different thermocouples on unheated surface of A-60 deck.
Te (°C)Time (min)
0102030405060
No. 1014396795119140
No. 209335683105127
No. 306345584106125
No. 406336395128153
No. 5011426498131155
Mean09.236.26191117.8140
No. 606275791139179
No. 704286086124152
No. 8084777107132152
Table 8. Simulated temperature change of different thermocouples on unheated surface of A-60 bulkhead.
Te (°C)Time (min)
0102030405060
No. 103144775140156
No. 201834456794
No. 305145096145158
No. 401174478113158
No. 501132947118120
Mean02.213.240.868.2116.6137.2
No. 6051015325666
No. 7021124426486
No. 802124161116158
Table 9. A-60 deck center deformation displacement table.
0 min15 min30 min45 min60 min
Deck center (mm)01.86.71827.3
Bulkhead center (mm)010584.557.851.44
Disclaimer/Publisher’s Note: The statements, opinions and data contained in all publications are solely those of the individual author(s) and contributor(s) and not of MDPI and/or the editor(s). MDPI and/or the editor(s) disclaim responsibility for any injury to people or property resulting from any ideas, methods, instructions or products referred to in the content.

