Article

Evaluating the Applicability of Mainstream Wave Energy Converters in the South China Sea

College of Oceanography and Space Informatics, China University of Petroleum, Qingdao 266580, China
*
Author to whom correspondence should be addressed.
J. Mar. Sci. Eng. 2023, 11(6), 1198; https://doi.org/10.3390/jmse11061198
Submission received: 10 May 2023 / Revised: 31 May 2023 / Accepted: 6 June 2023 / Published: 9 June 2023
(This article belongs to the Special Issue Advances in Offshore Wind and Wave Energies)

Abstract

:
Based on the past ten years of ERA5 wave field data, this study analyzed the distribution of wave energy resources in the coastal waters of each province around the South China Sea. In view of the single resource evaluation method, a regional classification method was established that comprehensively considered the three factors that impact wave energy resource reserves, the suitable water depth of the wave energy conversion device, and the device layout mode that affects energy absorption efficiency. From this information, the locations of key deployment stations around the coastal provinces were determined. Additionally, the CRITIC method was used to build indicators that can comprehensively evaluate the performance of different devices, and the most suitable devices for deployment in the five provinces were identified. The wave energy propagation direction of each key station was analyzed. The results show that the wave energy propagation direction of each station is relatively concentrated, which is convenient since this helps the device absorb and utilize energy more efficiently. Finally, the power generation performance and economic benefits of each key station’s most suitable device were analyzed. This article provides an assessment of the applicability of mainstream wave energy conversion devices in the nearshore area of the South China Sea, which is of great significance for the development and utilization of wave energy resources in the South China Sea’s nearshore waters. It provides a scientific basis for the selection, deployment, operation, and other practical operations of the follow-up devices in the South China Sea, as well as the power generation performance and economic benefits of the devices.

1. Introduction

The severity of the fossil fuel pollution impacting the air, seas, and land is increasing and is seriously endangering the ecological environment and human health. In addition, as a nonrenewable energy source, fossil energy reserves are decreasing daily. The ocean offers an abundant source of renewable energy, such as solar, wave, and tidal energy. The energy crisis and environmental pollution caused by fossil fuels can be solved by renewable energy. Furthermore, since fossil fuel sources will continuously deplete over time, actively developing renewable and clean energy is the key to mitigating this impending problem. Wave energy is a renewable energy source that is easy to directly utilize and has attracted the attention of many coastal countries due to the advantages it offers, such as its wide availability, lack of pollution, and high energy output [1]. Long-term and sustainable supplies of energy are critical for maintaining the sustainable development of a country, which is itself of great significance to human socioeconomic development. China’s economic and social development also requires a large energy supply [2,3]. Fortunately, there are abundant wave energy resources in the coastal waters of the provinces along the South China Sea. The rational development and utilization of wave energy resources can effectively solve the energy supply and environmental pollution problems afflicting the provinces along the South China Sea.
Before resource development and utilization can begin, the potential of wave energy development in the study area must be evaluated. Additionally, wave energy converters (WECs) are critical for the development and utilization of wave energy resources. However, the development and utilization of this technology are still in the research and development stage; thus, large-scale commercial applications have not been realized. According to Iglesias et al., in 2011, two problems must first be solved to commercialize wave energy: first, a reliable assessment of the distribution of wave energy resources must be conducted, and second, an efficient WEC must be developed to improve energy utilization [4]. Thus, the selection of devices is critical. At present, researchers all over the world have conducted considerable research on wave energy assessment in different marine areas. In 2008, Cornett [5] investigated global wave energy resources by using the third-generation wave numerical prediction model WAVEWATCH-III (WW3). From 2009 to 2010, Iglesias and Carballo [6,7,8] and Iglesias et al. [9] conducted a reliable assessment of wave energy resources in several seas around Spain using the results of the numerical wave model. In the same year, Hughes and Heap [10] evaluated potential wave energy resources in Australian shelf waters using the WAM model (a third-generation ocean wave prediction mode). In 2012, Arinaga and Cheung [11] achieved a comprehensive assessment of global wave energy resources using the results of a 10-year WW3 numerical model simulation. In 2013, Liberti et al. [12] evaluated wave energy resources in the Mediterranean basin of Italy by using a third-generation ocean wave model. In 2014, Mota and Pinto [13] evaluated inshore wave energy resources off the coast of Portugal using wave simulation data from 1995 to 2010. Soares C.G. et al. [14] used two contemporary spectral models to evaluate the wave energy resource along the Atlantic European coast. In 2017, Bernardino M. et al. [15] evaluated the wave energy resources of the Cape Verde Islands using reanalysis data from ECMWF. In 2018, Silva D. et al. [16] evaluated the distribution of wave energy resources along the Portuguese continental coast using two spectral wave models (WWIII and SWAN). In the same year, Gonalves M. et al. [17] also used these two models to assess wave energy resources on the western French coast. In 2020, Gonalves M. et al. [18] evaluated the wave energy resource of the Canary Islands using data from 1979 to 2011. Ribal et al. [19] evaluated Indonesia’s wave energy resources based on data generated with a two-way nested high-resolution wave model (WAVEWATCH III) with observation-based physics (ST6). In 2021, Binglbali et al. [20] conducted a detailed assessment of wave energy resources on the southwestern Black Sea Coast using a calibrated three-layer nested SWAN model. In addition, researchers in our country have also carried out fruitful research on the evaluation of wave energy, which has played a substantial role in the development and utilization of wave energy resources in our country. In 2013, Liang et al. [21] conducted a detailed investigation of the wave energy resources in the coastal waters around the Shandong Peninsula using the simulations from the SWAN model. In 2014, Zheng et al. [22] used the results of global wind and wave fields provided by ECMWF ERA-40 reanalysis data to conduct a comprehensive assessment of global sea wind and wave energy resources. Liang B. et al. [23] analyzed the distribution of wave energy resources in the China East Adjacent Seas using the third-generation wave model SWAN. In 2015, Zhou G. et al. [24] evaluated the wave energy resources of the coastal waters of Beibu Gulf, China, using ERA-Interim reanalysis wave field data. In 2016, Wang Z. et al. [25] evaluated the wave energy resources in the Bohai Sea, China, using the third-generation wave model SWAN. In 2019, Lin Y et al. [26] evaluated the wave energy resources in China’s adjacent seas (including the Bohai Sea, Yellow Sea, and East China Sea) using data from 1996 to 2015. In 2020, Wan Yong et al. [27] conducted a comprehensive and detailed analysis of wave energy resources in the coastal waters around China using ERA-Interim reanalysis of wave field data.
The previous research work provides a good reference for wave energy resource assessment. The abundance of wave energy resources varies in different sea areas due to factors such as geographical location and climate. Through the introduction of previous research work, we have learned that researchers have adopted different evaluation methods when assessing the wave energy resources of relevant sea areas. Such as using numerical simulation to access the wave energy resources or analyzing the distribution of wave energy resources in a study area by obtaining historical reanalysis data of the area. However, in the development of wave energy resources, the existing classification method of the wave energy development area only takes the influence factors of resources, such as resource reserves, richness, and other factors, as the evaluation criteria, without taking the device factors into account. As a result, the selected sea area cannot provide the necessary basic conditions for the later deployment of the device. Therefore, it is necessary to establish a method of regional classification considering the influence factors of the device. Secondly, when evaluating the applicability of the wave energy conversion device in the study area, there are some problems, such as subjective evaluation methods and the unclear importance of each evaluation index. Therefore, it is also very important to establish a comprehensive and accurate device evaluation method for the efficient development of wave energy resources.
Meanwhile, the South China Sea covers an area of approximately 3.5 million square kilometers. It is not only the largest sea area in China but also the third-largest sea area in the world. Additionally, the South China Sea is also an important shipping channel through which much international trade passes. Moreover, the South China Sea plays an important strategic role because it is located at the core of Southeast Asia and contains an important channel leading to the Indian Ocean and the Pacific Ocean. This sea contains numerous marine resources, among which wave energy resources are abundant. The rational development and utilization of these resources can provide a sustainable energy supply for the provinces along the South China Sea, effectively solving the energy supply problem and promoting the economic and social development of those provinces. However, through the study of relevant literature on the South China Sea, it is found that there are relatively few studies or reports regarding the wave energy resources in various provinces and regions around the South China Sea.
Comprehensively considering the above factors, this study uses the wave field data for the past 10 years provided by ERA5 to analyze the distribution of wave energy resources within the coastal waters of various provinces around the South China Sea (the location of the study area is shown in Figure 1). Furthermore, this work establishes an areal classification method that comprehensively considers the three factors of wave energy resource reserves, the suitable water depth of the devices, and how device placement mode will affect their energy absorption efficiency before determining the optimum development locations and key stations within the study area. Second, due to the changes within the study area, the importance of each indicator varies accordingly. This study used the CRITIC method to analyze the weight of the four indicators that can reflect the performance of the wave energy conversion device, and a comprehensive index was established that can be used to evaluate the performance of devices in different study areas. The applicability of mainstream wave energy devices in the coastal areas of various provinces around the South China Sea was evaluated, and the most suitable device for deployment was identified. The importance of the evaluation index and the threshold range of the comprehensive index will vary depending on the study area. This improves the accuracy of the selection results and means that this method can be widely and universally applied to studies seeking the most appropriate wave energy devices across various marine areas. Finally, the propagation direction of wave energy at key stations under full sea conditions, as well as storm protection methods, was also studied.
The research results provide an important scientific basis for the future development of wave energy resources in the waters around the South China Sea, as well as the selection, operation, and maintenance of devices.

2. Materials and Methods

This chapter mainly introduces the materials and methods used in the research.

2.1. Materials

2.1.1. ERA-5 Reanalysis Wave Field Data and Buoy Data

ERA5 is the fifth-generation and most recent meteorological dataset provided by the European Centre for Medium-Range Weather Forecasts (ECMWF). This dataset contains a large number of meteorological elements, including wind speed, wind direction, pressure, temperature, humidity, etc. ERA5 is the predecessor of the ERA-Interim global atmospheric reanalysis data and has higher spatial and temporal resolution than that product [28]. There are many methods for studying wave energy resources. One of which is to use meteorological data to analyze marine atmospheric environmental conditions to estimate wave energy resources, and the wave field data from ERA5 is used in this study. The time range considered by this study is from January 2012 to December 2021 and contains hourly observations. The spatial range is 15–27° N, 107–126° E, and the spatial resolution is 0.125° × 0.125°. When analyzing wave energy resources in a specific sea area, the accuracy of the selected data will directly affect the accuracy of the resource assessment results. Therefore, the buoy selected for this study to verify the accuracy of the significant wave height ( H s )   and energy period ( T e ) provided by ERA5 is the directional Wave Rider MkIII buoy (Datawell BV, Haarlem, The Netherlands). The buoy, Buoy_PY30-1, was deployed by the State Oceanic Administration of China in the offshore area of the South China Sea during the Ocean Renewable Energy Special Fund Project (GHME). The buoy was located at 20.2447° N and 114.9413° E. The buoy data period used in this study was from April to June 2012, with an interval of one hour. The buoy position is shown in Figure 2.
The verification results were evaluated by the following four statistical parameters: scattering index (SI), root mean square error (RMSE), bias, and correlation coefficient (CC). The formula for calculating the parameter is as follows:
SI reflects the degree of dispersion of the dataset:
SI = 1 X i _ E R A 5 ¯ 1 N i = 1 N ( X i _ b u o y X i _ b u o y ¯ ) ( X i _ E R A 5 X i _ E R A 5 ¯ ) ,
RMSE reflects the degree of deviation between the dataset and the measured data:
RMSE = 1 N i = 1 N ( X i _ b u o y X i _ E R A 5 ) 2 ,
bias reflects the accuracy of the dataset:
bias = X i _ b u o y ¯ X i _ E R A 5 ¯ ,
CC indicates the correlation between the dataset and the measured data:
C C = i = 1 N [ ( X i _ E R A 5 X i _ E R A 5 ¯ ) ( X i _ b u o y X i _ b u o y ¯ ) ] i = 1 N ( X i _ E R A 5 X i _ E R A 5 ¯ ) 2 i = 1 N ( X i _ b u o y X i _ b u o y ¯ ) 2 ,
In the above formulae, N is the number of datasets, X i _ b u o y is the two parameters provided by buoy data, respectively, H s and T e , and X i _ E R A 5 is the H s and T e provided by ERA5 data. The smaller the SI, RMSE, and bias values and the larger the CC values are, the higher the accuracy of the ERA5 data, and vice versa.

2.1.2. Existing Wave Energy Extraction Technologies

Most of the existing WECs are designed and manufactured for specific marine areas, and their working characteristics are closely related to the wave state range of the studied areas. Generally, a high energy utilization rate can be obtained only in specific marine areas, while the conversion efficiency in other areas is very limited. The existing WECs are different according to their location of operation and working principles. These systems can be divided into wave-activated bodies (WABs), point absorbers, oscillating water column (OWC) WECs, oscillating surge (OS) WECs, overtopping systems, and other devices [28,29,30]. The most common WABs include, for example, the CECO, Oyster, and Sharp Eagle Wanshan. The Wanshan is an Eagle-type wave energy device independently developed by China. The device has high conversion efficiency, strong stability, and is reliable. The most common point absorbers are the AquaBuoy, Wavebob, and Archimedes Wave Swing (AWS). These systems are small in size, can capture wave energy from multiple directions, and have high conversion efficiency [31,32]. The most common OWCs include, for example, the WaveStar and OceanLinx, which both have strong stability in extreme environments but have high construction costs and low WEC efficiency [32]. The typical representative device of an oscillating surge wave energy converter is RM5, which is a type of device that utilizes the surge motion of waves to generate electrical power [33]. The typical overtopping devices are the SSG and Wave Dragon. There are two types of devices: floating and fixed. The floating device is fixed by a chain and can be transported and deployed in an area rich in wave energy to generate electricity [32].
When utilizing wave energy resources from a specific sea area, an appropriate WEC should be selected according to the suitable water depth of the device, output power, and other influencing factors. Table 1 briefly summarizes and presents the characteristic parameters of typical WEC types [31,32,33,34,35,36,37].

2.2. Methods

2.2.1. Applicability Evaluation Index and Calculation Method for Each Wave Energy Con Version Device

When evaluating the applicability of mainstream WECs for use in specific marine areas, it is necessary to use appropriate evaluation indicators. In this study, four indicators are selected to measure the power generation performance of the WECs: average output power P e (kW), energy conversion rate C f (%), capture width C w (m), and relative capture width R c w (%).
P e refers to the power generated by a device during operation and represents the power that the wave energy generation equipment converts into electric energy during the operation. It measures the power output capacity of the device, usually depending on the geometric shape of the device, control strategy, etc. P e is calculated by multiplying the power values of different units in the device power matrix by the probability of corresponding sea conditions occurring, and finally adding up all values. C f refers to the average usage of the installed capacity of the device, which is used to measure the performance and efficiency of the device. It is the ratio between the average output power P e and the rated peak power. Generally, the higher the energy conversion rate of the device, the greater its average output power [38]. C w is the sea surface width at which the device can effectively capture the wave energy. This width depends on the device design and wave conditions. It is used as a reference value to evaluate the conversion efficiency of the WEC in terms of its performance. C w is calculated by taking the ratio of P e to P w . R c w refers to the ratio of C w to the main dimensions of the device (the main dimension refers to the maximum width of the device). R c w is usually used to indicate the capture efficiency of the device. Generally, the larger the relative capture width of a wave energy conversion device, the more effectively it can capture wave energy, thus generating more electricity.
Next, the CRITIC objective weighting method is used to conduct a weight analysis on the values of the above four indicators. The following describes the assignment process of the CRITIC method. Let the original data matrix A consist of m evaluation objects and n indicators.
A = ( a 11 a 1 n a m 1 a m n ) ,
(1)
Matrix normalization
First, the original data matrix A is normalized, and the normalization process of the positive indicators is calculated as:
a i j = a i j min ( a j ) max ( a j ) min ( a j )
The normalization process of the negative indicators is calculated as:
a i j = max ( a j ) a i j max ( a j ) min ( a j )
(2)
Calculate the information carrying capacity
After the original data matrix is normalized, the information carrying capacity of the index is calculated next, and it is then calculated by the contrast intensity and conflict between indicators. Contrast intensity is calculated as:
S j = i = 1 m ( a i j a j ¯ 2 ) n 1
where a j is the average of the data in each indicator column. When calculating the conflicting nature between indicators, it is necessary to calculate the correlation matrix of the indicator matrix, which is calculated by the formula:
R = j , k = 1 n ( a i j a j ¯ ) ( a i k a k ¯ ) j = 1 n ( a i j a j ¯ ) 2 j = 1 n ( a i k a k ¯ ) 2
Conflict is calculated as:
A j = i = 1 n ( 1 r i j )
where, r i j represents the correlation coefficient between the i indicator and the j indicator. After calculating the contrast intensity and conflict between the indicators, the information of the indicators is:
C j = S j × A j
(3)
Calculate the weights
Finally, the indicator weights are calculated by the formula:
W j = C j j = 1 n C j
The above is the whole process of the CRITIC empowerment method. Additionally, a comprehensive indicator CI is established according to the importance of each indicator. This metric allows for the performance of the devices to be analyzed more comprehensively and reliably, which will determine which device is most suitable for deployment in the study sea area. CI is calculated using the following formula:
CI = m P e + n C f + x C w + y R c w ,
m, n, x, and y are the proportion coefficients (weights) of each index, and the specific calculation formulas of these four indices P e , C f , C w , R c w are as follows:
P e = i = 1 n T j = 1 n H P i j × f i j ,
C f = P e R a t e d   p o w e r ,
C w = P e P w ,
R c w = C w m a i n _ d i m e n s i o n ,
where n T and n H are the number of T e classes and the number of H s   classes , respectively. P i j is the power output of the WEC, whose value depends on the specific power matrix of the device. The power matrices for the AquaBuoy, Archimedes Wave Swing, and Wavebob are shown in reference [38], and RM5 is shown in reference [33]. f i j is the frequency of occurrence in different sea states. Rated power is the rated power of each device, which is 250 kW, 750 kW, 2000 kW, 1000 kW, and 100 kW [33,37,38,39]. In addition, when calculating C w , the wave energy flux P w ( kW / m ) must be used because it is the most important characteristic quantity to evaluate the state of the wave energy distribution and the basic parameter to calculate the other indices. Therefore, the accuracy of the P w calculation is very important when evaluating the applicability of the WEC in the study area. The coastal waters of China are mostly shallow water areas, so the influence of water depth should be considered when calculating the P w to obtain accurate calculation results. Thus, the calculation formula of the P w adopted for this study [39], which takes into account the influence of water depth, is as follows [10]:
P w = E C g = E C n ,
where E is the energy density in terms of the significant wave height; C g is the group speed of the waves; and C is the wave speed and n is the ratio of the wave group speed to wave speed. The specific calculation formulas of E ¯ , C , and P * are as follows:
E = 1 16 ρ g H s 2 ,
C = [ g T e 2 π tanh ( k d ) ] ,
n = 1 2 ( 1 + 2 k d sinh 2 k d ) ,
where H s is the significant wave height; T e is the energy period; ρ is the density of seawater; g is the gravitational acceleration constant; k is the wavenumber; d is the depth of the water. When calculating R c w , m a i n _ d i m e n s i o n is used, which represents the dimensions of each WEC. The m a i n _ d i m e n s i o n of the AquaBuoy, Archimedes Wave Swing, Wavebob, RM5, and Sharp Eagle Wanshan devices are 20, 144, 45, 26, and 24 [39,40], respectively.

2.2.2. Determination Method of Dominant Development Areas and Key Stations

Before the division of the coastal areas of the provinces around the South China Sea and the identification of key stations, we need to understand the resource reserves and distribution of the potential development areas to carry out resource assessments.
Figure 3 shows the annual average distribution of P w in the South China Sea over the last 10 years (2012–2021). According to the distribution of the annual average value, the P w in the coastal waters of the provinces around the South China Sea gradually increases with increasing offshore distance. In particular, the annual P w at the intersection of Fujian Province and Taiwan Province is more than 10 kW/m, and wave energy resources are particularly abundant. With increasing offshore distance, the average annual P w in Guangdong and Hainan provinces is approximately 4–10 kW/m, and the wave energy resources are relatively rich. However, the P w in the middle sea area between Guangxi Province and Hainan Province is relatively low, approximately 2–4 kW/m. Compared to other provinces, the wave resources in this sea area are relatively scarce, and the development value is slightly lower.
After quantifying the distribution of wave energy resources in the South China Sea, the next step is to classify the marine areas of the neighboring provinces in the South China Sea and select the optimum wave energy resource development areas. When evaluating wave energy resources, it is necessary to comprehensively analyze the availability, sustainability, and exploitability of wave energy in combination with factors such as wave conditions and device placement. However, through the research literature, it is found that the current assessments of wave energy resources only consider the resource aspect, and the assessment factors are not sufficiently comprehensive. To resolve this problem, this study establishes an areal classification method that methodically considers the three factors of wave energy resource reserves, the applicable water depth of the device, and the proportion of the main propagation direction of the wave energy (which affects its energy absorption efficiency). This method comprehensively considers the following three indicators to determine the optimum development area.
The three indices are annual average wave energy flux   ( P w ) , annual average effective wave hours   ( T E w a v e ) , and proportion of main wave direction ( D i r m a i n _ p r o ) , where T E w a v e is the average annual duration of waves with heights ranging from 1–4 m. The annual average duration of 1–4 m wave height is chosen as one of the important indicators for selecting the best development area for the following two reasons:
(1)
Sea state conditions: According to the international standard sea state scale (1–9), when the sea state is at level 6 (with wave heights of 4–6 m), the frothy crests of waves are beginning to extend into streaks along the slanting wave faces, and sometimes the wave crests take on a shape similar to that of storm waves. Although some WEC devices may be able to operate under these conditions, for the majority of WEC devices, this sea state can still cause certain damage.
(2)
Meeting operating conditions for the majority of WEC devices: Through researching literature and examining the design and operation of WEC devices currently available on the market, it has been found that the effective wave height for these devices to enter storm protection mode is generally between 4 and 6 m. Furthermore, when the wave height is lower, the power output of WEC devices is lower, and in some cases, they may not be able to generate any power at all [27,41,42,43,44,45].
Taking the above factors into consideration, when selecting the optimum development area, the region with the highest wave height within the range of 1–4 m is selected. D i r m a i n _ p r o is the total proportion of the first six highest propagation directions, that is, the main direction of wave energy propagation. As the wave energy incident direction is orthogonal to the device layout direction, the device can effectively capture the wave energy and achieve the maximum energy absorption efficiency [45]. Therefore, when classifying the wave energy resource development areas, D i r m a i n _ p r o , the proportion of the main wave direction, is taken as one of the important indicators to determine the dominant development areas.
Next, the steps followed by this method will be described in detail. First, a large wave energy research area is established in the coastal waters of the provinces around the South China Sea; namely, four research areas, designated A, B, C, and D, are established in the offshore areas where Guangxi, Hainan, Guangdong, Fujian, and Taiwan meet. The establishment of the study area takes into account two influencing factors, namely, the annual average distribution of P w in the South China Sea during the last 10 years and the suitable water depth of the device (typically, common wave energy devices operate within 100 m of water depth). Next, small wave energy study sites are established in each of the four larger research areas. The sites cover 0.5° × 1°, and each contains 45 grid points (stations). The number of small study sites within each of the larger areas depends on the size of the 4 larger research areas. For example, three small study sites are set up off the coast of Guangxi Province (area A), where the water depth is 100 m and wave energy resources are plentiful. The method of setting up the small study sites in the other three larger areas is the same as that in area A. After the establishment of the small study sites, areal classification of the small study sites will be carried out.
The specific steps for the areal division of the small study sites are as follows:
(1)
The average annual P w , average annual T E w a v e , and main wave proportion D i r m a i n _ p r o of each grid point in each small study site in the four larger areas (A, B, C, and D) are calculated. Then, the average value of each index from all grid points in each small site is taken as the result of each index in this small study site.
(2)
The minimum and maximum annual average P w , annual average   T E w a v e and D i r m a i n _ p r o of all grid points in all small study sites contained in each large area were selected, and the indices were divided into interval segments and grades. Taking the division of the annual average P w as an example, this study introduces the interval segmentation method (the interval segmentation method of T E w a v e and D i r m a i n _ p r o indicators is the same as P w ). The annual average P w interval [minimum value, maximum value] was divided into three equal fractions, and the length of each interval can be specified as follows:
h = P w m a x P w m i n 3 ,
the dividing point x 1 = P w m i n + h , x 2 = P w m i n + 2   h , the corresponding wave energy development potential of these three segments increased from level 1 to level 3 successively. These are denoted as poor, usable, and good potential, respectively.
(3)
The grade interval corresponding to the average value of each indicator in each small study site is the development potential of each indicator within the small area. Based on the development potential of the three indicators, the small study site with the best development potential is selected as the dominant development area in the A/B/C/D domain.
(4)
After the dominant development area is determined, the product size of the annual average P w , annual average T E w a v e and D i r m a i n _ p r o is taken as the basis for determining the key stations in the dominant development area. The development potential coefficient ( D P C ) was defined as the result of the product of the three factors to determine the key stations, which was expressed as follows:
D P C = P w · T E w a v e · D W m a i n _ p r o ,
The larger the   D P C value, the higher the potential to be exploited. According to the order of the D P C value, from large to small, the station suitable for the deployment of WEC in the optimum development area is selected as the key station.

3. Results

3.1. Validation Results of ERA5 and Buoy Data

Section 2.1.1 introduced the basic information of ERA5, the buoy, and the four parameters used to verify the accuracy of the ERA5 data, namely, SI, RMSE, bias, and CC. The values of SI, RMSE, and bias indicate the degree of difference between the ERA5 and buoy data, while the CC values indicate the degree of correlation between the ERA5 and buoy data. In this section, ERA5 data are compared with buoy data, and the above four parameters are calculated. The comparison results are shown in Figure 4.The results show that the SI, RMSE, and bias values of H s compared with the buoy are 0.19, 0.25 m, and 0.12 m, respectively, which indicates that the difference between the ERA5 data and the buoy is small. The value of the correlation coefficient CC is 0.95, which also indicates that the H s parameter has a strong correlation with the buoy. The values of SI, RMSE, bias, and CC of T e compared with the buoy are 0.1, 0.58 s, 0.3 s, and 0.79, respectively, which also shows that the ERA5 data are relatively accurate and have little difference from the buoy data.

3.2. Grading Method of Wave Energy Development Area and Establishment of Key Stations

This section presents the establishment of the four research areas, A, B, C, and D, which were set up at the intersection of Guangxi, Hainan, Guangdong, Fujian, and Taiwan according to the method outlined in Section 2.2.2. The locations of the research areas in each province are shown in Figure 5. Next, within study area A of Guangxi Province, small study sites a1, a2, and a3 were set up in the marine areas with plentiful wave resources and where water depths were below 100 m. Within research area B of Hainan Province, small study sites b1 and b2 were set up according to the above two considerations. As the sea area of Guangdong Province is relatively large, five small study sites (c1, c2, c3, c4, and c5) were set up in study area C. Finally, in study area D, at the intersection of Fujian Province and Taiwan Province, small study sites d1, d2, d3, and d4 were set up in the intermediate marine area where wave energy resources are abundant and the water depth is less than 100 m. The results of the small study sites are shown in Figure 6. After the establishment of the small areas, the next step is to grade the small study sites and select the optimum development location.
Taking the grade division of area A in Guangxi Province as an example, the result of the area A division is explained as follows (note that the division method is the same for all four divisions):
According to the calculation, the minimum and maximum annual average P w values of the three small study sites in area A are 1.05 kW/m and 3.84 kW/m, respectively. The intervals [1.05, 3.84] were divided into three equal parts, and the corresponding wave energy development potential of these three intervals was successively increased from level 1 to level 3, which were, respectively, classified as poor, usable, and good potential. The average annual T E w a v e and average annual D i r m a i n _ p r o indices are classified in the same way as the average annual P w index, and their numerical intervals in area A are [967.2, 3621] and [0.79, 0.97], respectively. The division criteria for the three indicators in area A are shown in Table 2. The average values of the annual average P w , annual average T E w a v e and D i r m a i n _ p r o indicators of all stations in small study sites a1, a2, and a3 are calculated, respectively, and the corresponding grade of each value is the grade of each indicator in the area.
The level of each indicator is shown in the following Table 3:
Considering the exploitable level of wave energy resources in the three small study sites shown in Table 4, small study site a2 is selected as the dominant development area in Guangxi Province. The division method for areas B, C, and D is the same as that for area A. It is calculated that area b2 within the Hainan Province area is the most valuable location for development in area B. As the offshore extents of areas C and D are relatively wide, two small optimum development areas are selected in these two larger areas. After calculation, study sites c3 and c5 within area C of Guangdong Province are identified as the optimum development areas. In area D, at the intersection of Fujian and Taiwan Provinces, d2 and d3 are identified as the optimum development areas.
After the optimum development area is determined, the next step is the selection of key stations. In this section, the D P C values of all stations in study sites a2, b2, c3, c5, d2, and d3 are calculated, and the station with the largest D P C value is selected as the key station. The positions of key stations are shown in Figure 7, which are stations a2-57 (107.875° E, 20° N, annual P w : 3.84 kW/m, D P C value: 12334.449, water depth: 58 m); station b2-54 (107.75° E, 17.625° N, average P w : 5.38 kW/m, D P C value: 18779.96, water depth: 78 m); in b2, station c3-49 (114.375° E, 21.250° N, average P w : 10.4 kW/m, D P C value: 60194.74, water depth: 78 m); station c5-59 in c5 (117° E, 22.125° N, average P w : 11.75 kW/m, D P C value: 66883.76433, water depth: 72 m); station d2-53 in d2 (119.375° E, 24.125° N, annual P w : 13.97 kW/m, D P C value: 66521.83775, water depth: 64 m); and station d3-17 (120.5° E, 25.5° N, average P w : 10.92 kW/m, D P C value: 5370.40991, water depth: 77 m). The average annual P w of the stations is greater than the standard for wave energy development ( P w > 2 kW/m), and the average annual P w of the key stations in c3, c5, d2, and d3 plots is greater than 10 kW/m, indicating that wave energy resources are abundant, which indicates that the wave energy resources in the coastal waters of provinces around the South China Sea have certain development value.

3.3. Applicability Evaluation of Key Stations in the Coastal Waters of Provinces around the South China Sea

Different WECs are suitable for different marine areas, and the efficiency of the WEC depends on the performance of the device. Therefore, it is very important to select an appropriate WEC for the development and utilization of wave energy in specific marine areas. After identifying the key stations in the dominant development zone, it is necessary to determine the WECs suitable for deployment at these key stations. Since each WEC has its own applicable water depth range, based on the water depth values of the six key stations (a2, b2, c3, c5, d2, and d3), this study selected five WECs suitable for deployment in the coastal waters of the provinces around the South China Sea, namely, AB, AWS, Wavebob, Sharp Eagle Wanshan, and RM5. The performance index values of the five devices at each key station are shown in Table 4.
After calculating the P e , C f , C w , and R c w values of the five devices at each key station, the CRITIC method was used to analyze the performance values of the devices at different research stations in five provinces, and the weight of the four indicators at each key station was obtained (as shown in Figure 8), that is, the importance of the indicators. The CRITIC method is an objective weighting method used to evaluate the relative importance of multiple indicators. It is a scientific evaluation that comprehensively measures the objective weight of indicators based on the comparative strength of those indicators and the conflicts between them. Furthermore, this method fully uses the objective attributes of the data itself. The CRITIC objective weighting method can comprehensively consider the weights of multiple indicators, thus reflecting the relative importance of indicators, so that multiple factors can be considered more systematically. The greater the index weight, the greater the importance and representativeness of the indicator representation. The comprehensive indicators (CI) are constructed according to the weight ratio of the four indicators. The larger the CI value, the better the performance of the device in this area.
In this section, we will take the key station a2-57 as an example to analyze the weight results of the four indicators of this station. The weight results of the four indicators after applying the CRITIC method at a2-57 are shown in Figure 8. It can be seen from the figure that the weights of P e , C f , C w , and R c w are 0.206, 0.207, 0.362, and 0.225, respectively; that is, they correspond to the four coefficients of m, n, x, and y in CI. Therefore, the CI of station a2-57 can be expressed as:
CI a 2 57 = 0.206 P e + 0.207 C f + 0.362 C w + 0.225 R c w ,
The comprehensive indices of the five devices at the a2-57 station are calculated, and the CI a 2 57 value of the Wanshan device is the largest, which is 7.992; that is, Wanshan is the most suitable wave energy conversion device for the a2-57 station. Similarly, the weights of the four indicators of the station b2-54 are 0.287, 0.204, 0.312, and 0.197; therefore, the comprehensive indicators of the station can be determined by:
CI b 2 54 = 0.287 P e + 0.204 C f + 0.312 C w + 0.197 R c w ,
The calculated CI b 2 54 value of the Wanshan device is the largest, which is 11.436; that is, this station is most suitable for deploying Wanshan devices. The weights of the four indicators of the c3-49 station are 0.313, 0.200, 0.299, and 0.188; therefore, the CI is equal to:
CI c 3 49 = 0.313 P e + 0.200 C f + 0.299 C w + 0.188 R c w ,
The calculated   CI c 3 49 value of the RM5 device is the largest, 20.284; therefore, the key station selects the RM5 device for deployment. The weights of the four indicators of the c5-59 station are 0.299, 0.203, 0.307, and 0.190; therefore, the comprehensive indicators of the c5-59 station can be expressed as:
CI c 5 59 = 0.299 P e + 0.203 C f + 0.307 C w + 0.190 R c w ,
It is calculated that the RM5 device has the largest value and the best performance, 21.889. Therefore, RM5 is the most suitable device for the c5-59 station. The weights of the four indicators of the d2-53 station are 0.301, 0.205, 0.307, and 0.188, respectively. This means that the comprehensive indicators of this station are equal to:
CI d 2 53 = 0.301 P e + 0.205 C f + 0.307 C w + 0.188 R c w ,
It is calculated that the CI d 2 53 value of the Wanshan device is the largest, 23.835; that is, Wanshan is the most suitable wave energy conversion device to be deployed at the key station of d2-53. Finally, the weights of the four indicators of the d17 station are 0.283, 0.207, 0.313, and 0.197, respectively. Thus, the comprehensive indicators of the key station are:
CI d 3 17 = 0.283 P e + 0.207 C f + 0.313 C w + 0.197 R c w ,
It is calculated that the comprehensive index value of the RM5 device is the largest, which is 19.744; that is, RM5 is the most suitable wave energy conversion device to be deployed at station d3-17.

3.4. Direction of Wave Energy Propagation at Key Stations under Full Sea Conditions and Storm Protection

As mentioned in Section 2.2.2 above, the incident direction of wave energy and the placement direction of the device will affect the efficiency of the device in terms of the wave energy it can absorb. When the incident direction of wave energy is orthogonal to the placement direction of the device, the device can effectively capture wave energy and achieve maximum energy absorption efficiency. It is important to note that this conclusion does not apply to point absorbers, for which efficiency is independent of wave direction. The reason is that point absorbers have a small physical area, and this type of device is capable of capturing wave energy in any direction. Thus, for a point absorber, its efficiency does not depend on the relationship between the direction of wave incidence and the direction of device placement. According to the research results in the previous section, the devices most suitable for deployment in offshore waters of provinces around the South China Sea are Wanshan (wave-activated body) and RM5 (oscillating surge wave energy converter). The efficiency of these two devices is related to the wave direction. Therefore, the study of the wave energy incident direction of key stations in the neighboring provinces of the South China Sea provides an important scientific basis for the placement direction of subsequent devices and the efficient development of wave energy resources. In addition, the energy absorption efficiency of the device will also be affected under extreme sea states. For example, when the H s reaches a certain level, the floating platform of the device may be subject to excessive impact, resulting in damage to the device. To prevent this, the device will enter storm protection mode. The H s that triggers the storm protection mode is the maximum H s that the device can withstand. Different wave energy conversion devices have different conditions for triggering the storm protection mode. Based on research on the design and operation of wave energy conversion devices in the current market, it is found that the H s of wave energy conversion devices entering the storm protection mode is generally between 4 m and 6 m.
Therefore, we chose a minimum limit (4 m) to enter the storm protection mode for research. This study calculated the annual energy distribution percentage of each key station in all directions, plotted the wave power rose diagram, and counted the direction and energy proportion of the main wave power of each key station under the conditions of the whole sea state and storm protection.
Figure 9 and Table 5 show that the coastal area of Guangxi has a monsoon climate. Under the influence of the northeast monsoon, the dominant directions of wave energy propagation are NNE and NE at a2-57, which is a key station off the coast of Guangxi. Under the influence of the south wind, part of the wave energy propagates in the south direction. The power on the main wave side of the station in the full sea state accounts for 71% of the total power during the full sea state. Under storm protection, the upward power of the main wave accounts for 72% of the total power in the overall direction. At b2-54, a key station off the coast of Hainan Province, NNE-E is the dominant wind direction for wave energy propagation. The area is mainly affected by the northwest monsoon in winter, and the dominant direction starts to move eastward. The power on the dominant wave side of this station in the full sea state accounts for 77.4% of the total power of the full sea state. The power of the dominant wave side under storm protection accounts for 77.8% of the total power under the full sea state. At c3-49, a key station off the coast of Guangdong Province, the dominant direction that wave energy propagates is ENE and east due to the influence of the northeast monsoon. The power on the dominant wave side of the station in the full sea state is approximately 74.2% of the total power of the full sea state. In the storm protection mode, the power from the dominant wave side accounts for 75.7% of the total power from all directions. At key station c5-59 in the c5 area, the dominant wave direction is consistent with the NE wind direction for the whole sea state, and the power of the dominant waves of the whole sea state accounts for approximately 60.7% of the total power of the whole sea state. The dominant wave direction under storm protection is from NE to ENE, and the power ratio, in this case, is 66.4%.
Finally, d2-53, a key station at the intersection of Fujian Province and Taiwan Province, is also affected by the northeast monsoon, and the dominant direction of wave energy propagation is NNE and NE. The power on the dominant wave side of this station accounts for approximately 92.8% of the total power of the full sea state. In the storm protection mode, the power of the dominant wave accounted for approximately 84.5% of the total power from all directions. At d3-17, another key station in the d3 area, the dominant wave direction in the whole sea state is from NNE to ENE, and the power ratio is 71.7%. In the storm protection mode, the dominant wave direction is from NE to ENE, and the power, in this case, accounts for 77.2%.
From the above analysis, it can be seen that the dominant direction of wave energy at the key stations in the d2 sea area at the junction of Fujian Province and Taiwan Province is more concentrated, regardless of the full sea state or storm protection mode, which is very useful for using devices to absorb wave energy. Therefore, this sea area is the most suitable research area for deploying WECs in the South China Sea.

3.5. Power Generation Performance and Economic Benefits of the WEC under Full Sea Conditions and Storm Protection

The main device to complete the development of wave energy resources and energy conversion is the WECs. After selecting the device most suitable for the key stations, it is necessary to analyze the power generation performance and economic benefits of the device at the key stations. In this section, the generation capacity and economic benefits of Wanshan and RM5 devices under full sea conditions and storm protection are analyzed by calculating the indexes of annual energy production ( A E P ) and levelized cost of energy ( L C O E ), respectively.
AEP represents the power generation of the wave energy conversion device in the study area for one year. This index directly reflects the power generation capacity of the device to convert wave energy into electric energy. The calculation method of AEP is to multiply the power values corresponding to different sea conditions in the power matrix by the number of hours that occur in that sea condition throughout the year, and then sum them up. The specific calculation formula is as follows:
A E P = i = 1 n T j = 1 n H P i j × T i j ,
where P i j represents the power values corresponding to different H s and T e in the power matrix. T i j represents the number of hours that different sea conditions occur throughout the year. The higher the A E P value, the stronger the power generation capacity and the higher the power generation efficiency of the wave energy conversion device.
L C O E is a fundamental indicator for evaluating the economic benefits of wave energy devices as well as an important indicator for assessing the economic feasibility of wave energy development projects. Its calculation formula is shown below:
L C O E = C a p E x + t = 1 n O p E x t ( 1 + r ) t t = 1 n A E P ( 1 + r ) t ,
C a p E x is capital expenditures. O p E x t refers to the operating and maintenance expenses of the device in year t. r represents the discount rate. t is the duration of the wave energy project. This study refers to the standards proposed by Astariz et al. [46], and sets various parameters. The duration t of the project was set at 10 years, and the discount rate r was set at 7%. The lower the LCOE value, the lower the cost of converting wave energy into electric energy, and the higher the profit of developing wave energy resources, which is more economically competitive.
A E P and L C O E values of devices under full sea conditions and storm protection are calculated, respectively. The numerical results are shown in the Table 6:
From Table 6, it can be obtained that the power generation of the device in one year and the economic income of the device are expected to be installed for 10 years under full sea conditions and storm protection.
Under full sea conditions, Wanshan devices at d2-57 stations in the intersection of Fujian and Taiwan provinces have the highest AEP , with an annual power supply of 591170.3 MWh. Moreover, the LCOE value of the Wanshan device at this station is the lowest, which means that the device has the highest economic benefits and the strongest economic competitiveness at this station. Therefore, this device is most reliable when deployed at this station. Secondly, the power generation of the RM5 device at station c5-59 in Guangdong Province ranked second with a total of 530562.2 MWh. Compared with other devices, the Wanshan device at station a2-57 in Guangxi Province has the smallest AEP value, but its economic benefits are not the lowest, so there is also a degree of reliability in the deployment of the device at this station.
Under storm protection, the RM5 device at station c3-49 in Guangdong Province had the highest power generation with a total of 380657.4 MWh, while the device at station c5-59 in the same province ranked second, but neither had the highest economic benefits. The device with the best economic benefits was the Wanshan device at station d2-57, located at the intersection of Fujian and Taiwan provinces in the sea area, with an LCOE value of only 0.8953 EUR/MWh. Similarly, the Wanshan device at station a2-57 in Guangxi Province had the lowest power generation and the lowest economic benefits under storm protection at this station. The reliability of the device at this station is slightly lower compared to other stations.

4. Conclusions

The study uses the latest atmospheric reanalysis product, ERA5, the fifth-generation meteorological dataset from the ECMWF, to analyze the distribution of wave energy resources in the coastal waters around five provinces along the South China Sea over the past 10 years. A regional classification method is established that considers the three factors of wave energy resource reserves, the applicable water depth of the device, and the proportion of the main propagation direction of the wave energy (which affects its energy absorption efficiency). Using the CRITIC method, the importance of four indicators that can measure the power generation performance of wave energy devices was calculated at various key stations, and an indicator was constructed to comprehensively evaluate the performance of the devices. The most suitable devices for deployment in the five provinces around the South China Sea were determined. In addition, this study also studied the factors related to the direction of device deployment that affect the energy absorption efficiency of the device, and the following conclusions were reached:
(1)
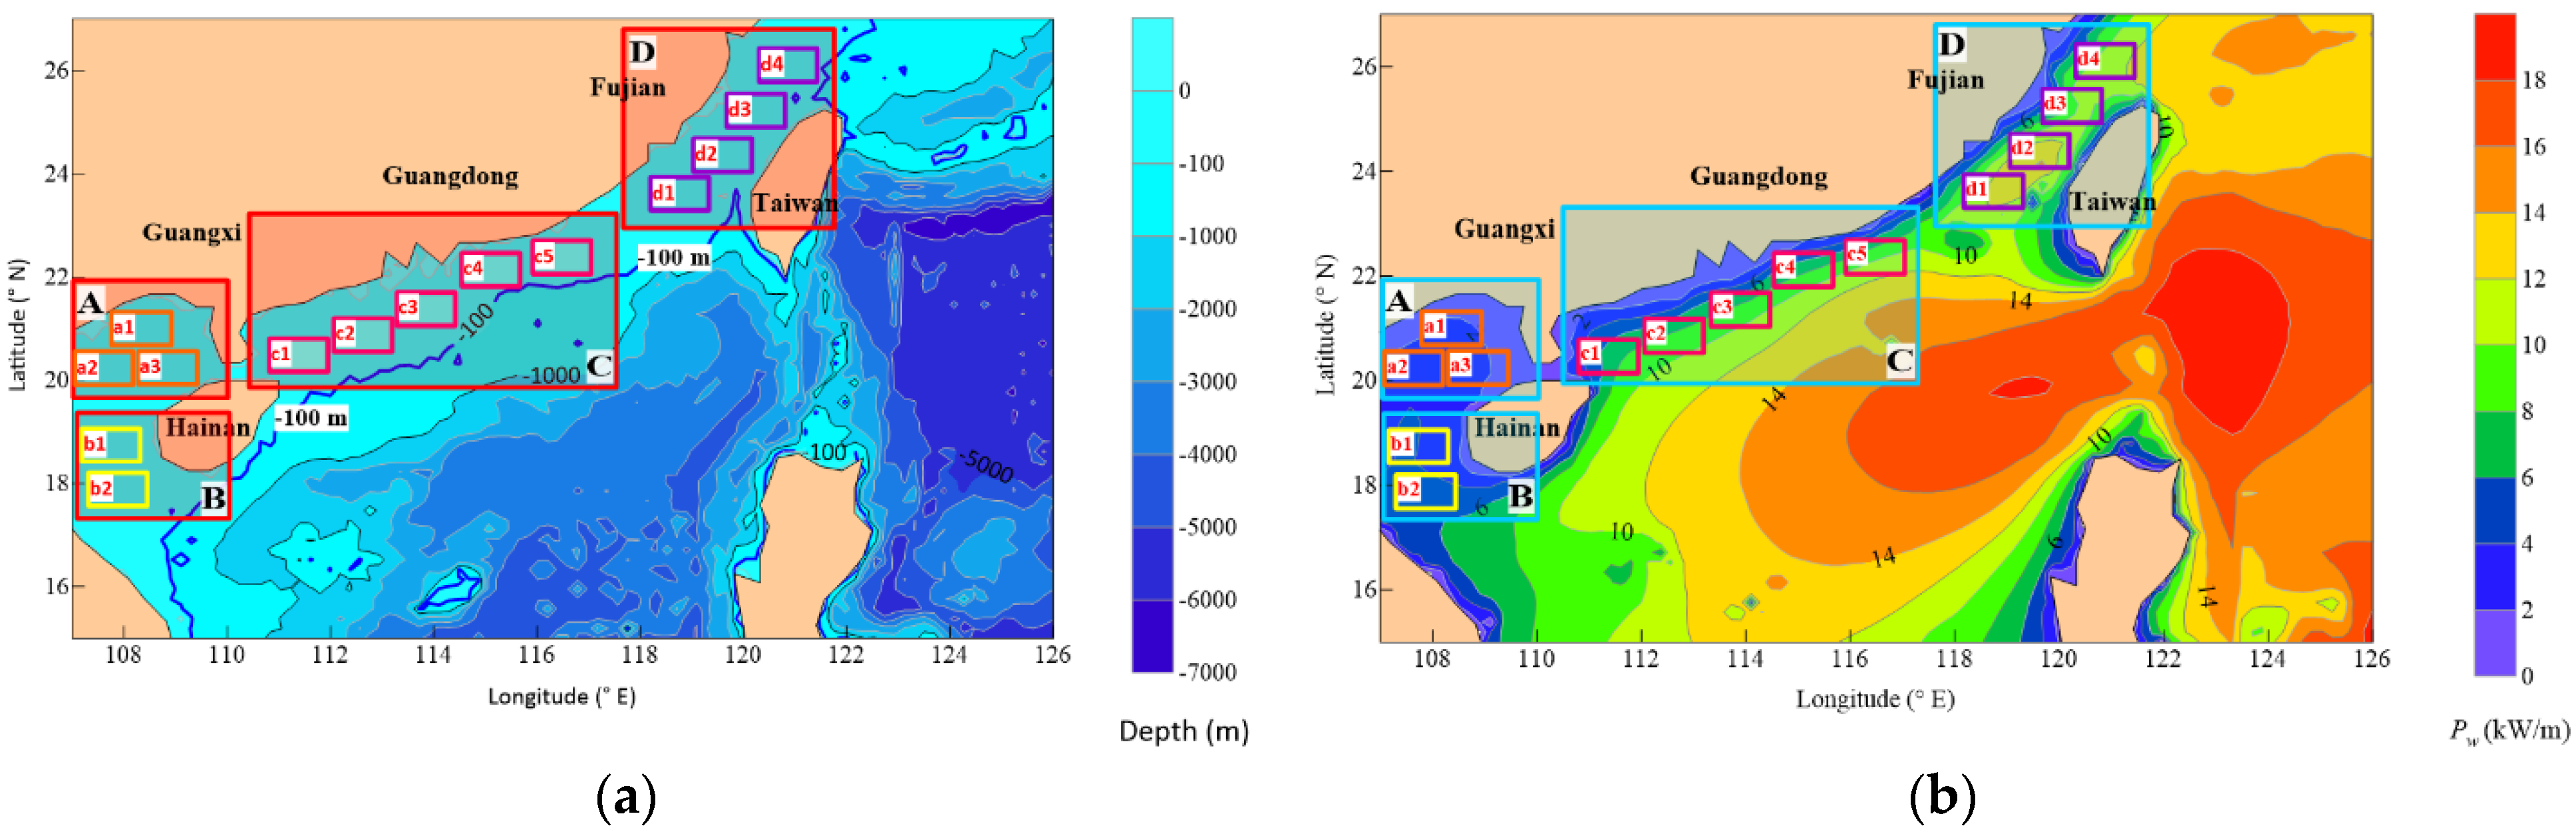
When dividing the research area and determining the key stations, this study comprehensively considers three indicators, namely, the annual average P w , the annual average T E w a v e , and the proportion of the dominant wave direction D i r m a i n _ p r o . Additionally, this work establishes a regional classification method that comprehensively considers multiple factors and determines the optimum wave energy resource development areas and the locations of the key stations in the adjacent marine areas of five provinces around the South China Sea. Among them, Guangxi Province and Hainan Province each contain one identified key station, and Guangdong Province, Fujian Province, and Taiwan Province each contain two identified key stations.
(2)
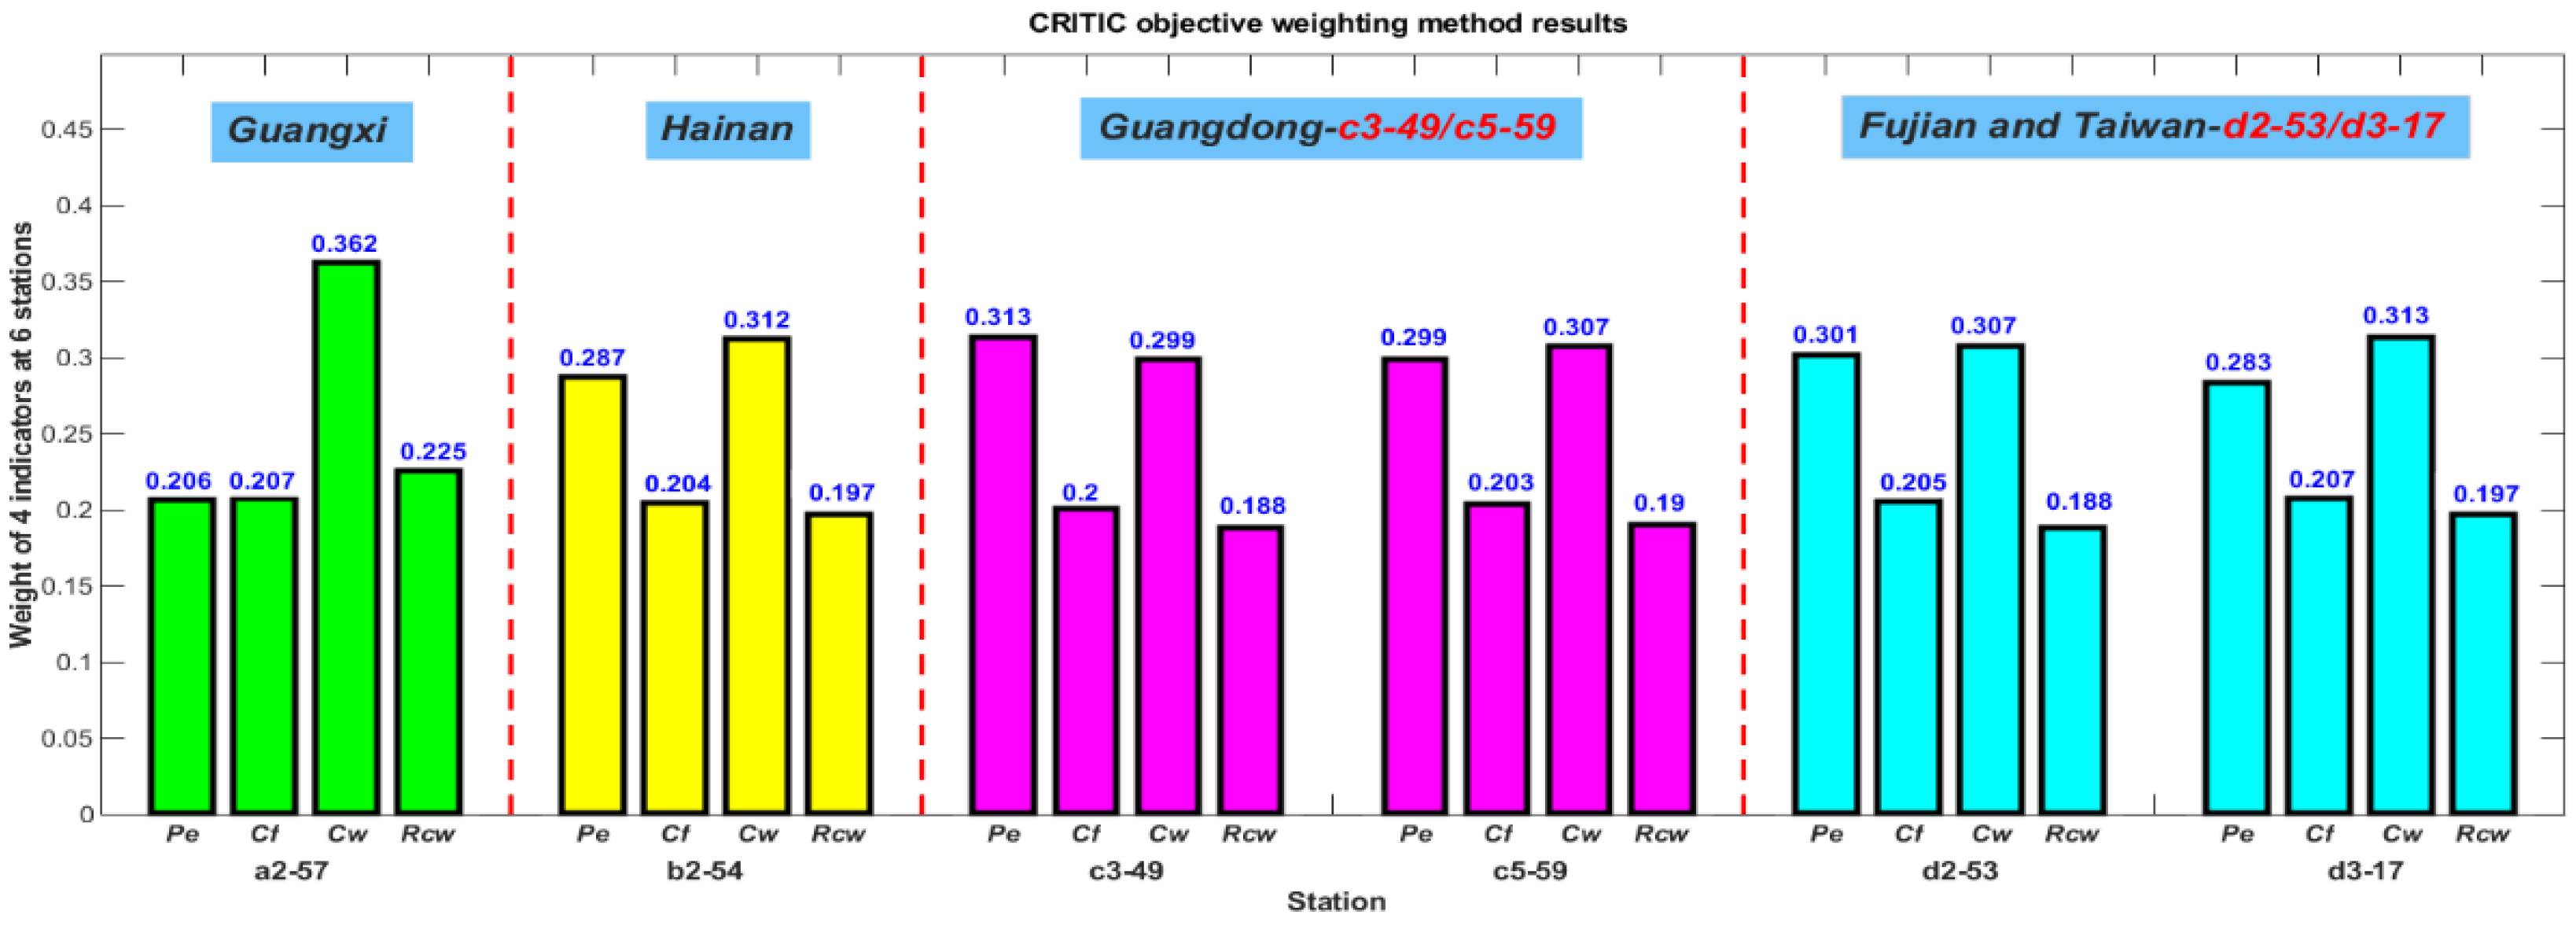
The applicability of the current most common wave energy conversion devices in the adjacent marine areas of five provinces around the South China Sea is evaluated by the CRITIC method. According to the analysis, Wanshan is suitable for deployment in Guangxi and Hainan provinces, and RM5 is suitable for deployment in Guangdong province, while Wanshan and RM5 are suitable for deployment in the area between Fujian and Taiwan provinces.
(3)
This work also studied the direction of wave propagation at key stations in five provinces around the South China Sea under full sea conditions and during storm protection mode. The results show that except for the slightly dispersed direction of wave propagation in the nearshore waters of Guangxi Province, the wave propagation direction in the other five study areas is relatively concentrated. Among them, the dominant wave direction at the intersection of Fujian Province and Taiwan Province (d2 study area) is the most concentrated and is the most suitable research area for the deployment of wave energy devices and for the establishment of nearshore wave energy stations in the South China Sea region. This research can provide an important reference for the deployment direction of wave energy devices and the efficient energy absorption and power generation of wave energy devices in the future.
(4)
Finally, this paper analyzes the power generation performance and economic benefits of Wanshan and RM5 devices that are most suitable for deployment within the coastal waters of various provinces around the South China Sea. The analysis results are as follows: Except for the Wanshan device at the a2-57 station in Guangxi Province, which has a slightly lower power generation capacity, the devices at other stations have a power generation capacity of over 200,000 MWh per year and excellent power generation performance; The Wanshan device at the d2-53 station in the intersection of Fujian Province and Taiwan Province has the highest economic benefits, whether under full sea conditions or storm protection. Therefore, compared with the economic benefits obtained by devices at other stations, the Wanshan device at this station has the highest economic benefits and the strongest economic competitiveness.

Author Contributions

Conceptualization, Y.W. and X.F.; data curation, Y.W. and X.F.; investigation, W.Z.; writing—original draft preparation, X.F.; writing—review and editing, Y.W. All authors have read and agreed to the published version of the manuscript.

Funding

This research was funded by the National Natural Science Foundation of China, grant number No. 61931025.

Acknowledgments

Thanks to the National Data Buoy Center for buoy data and the European Center for Medium and Long-term Weather Forecasts for ECMWF ERA5 data.

Conflicts of Interest

The authors declare no conflict of interest.

References

  1. Liu, M.Q. Development and prospect of wave energy utilization. Ocean Dev. Manag. 2010, 27, 80–82. [Google Scholar]
  2. Bai, S.C. On the world energy crisis and China’s strategic choice. Exp. Sci. Technol. 2006, 168–170. [Google Scholar]
  3. Chen, M.Y. Building a strong maritime nation is an important strategy for the great rejuvenation of the chinese nation. J. Dev. Stud. 2010, 4–7. [Google Scholar]
  4. Iglesias, G.; Carballo, R. Choosing the site for the first wave farm in a region: A case study in the Galician Southwest (Spain). Energy 2011, 36, 5525–5531. [Google Scholar] [CrossRef]
  5. Cornett, A.M. A global wave energy resource assessment. In Proceedings of the Eighteenth International Offshore and Polar Engineering Conference, Vancouver, BC, Canada, 6–11 July 2008; OnePetro: Richardson, TX, USA, 2008. [Google Scholar]
  6. Iglesias, G.; Carballo, R. Wave energy potential along the Death Coast (Spain). Energy 2009, 34, 1963–1975. [Google Scholar] [CrossRef]
  7. Iglesias, G.; López, M.; Carballo, R.; Castro, A.; Fraguela, J.A.; Frigaard, P. Wave energy potential in Galicia (NW Spain). Renew. Energy 2009, 34, 2323–2333. [Google Scholar] [CrossRef]
  8. Iglesias, G.; Carballo, R. Offshore and inshore wave energy assessment: Asturias (N Spain). Energy 2010, 35, 1964–1972. [Google Scholar] [CrossRef]
  9. Iglesias, G.; Carballo, R. Wave energy resource in the Estaca de Bares area (Spain). Renew. Energy 2010, 35, 1574–1584. [Google Scholar] [CrossRef]
  10. Hughes, M.G.; Heap, A.D. National-scale wave energy resource assessment for Australia. Renew. Energy 2010, 35, 1783–1791. [Google Scholar] [CrossRef]
  11. Arinaga, R.A.; Cheung, K.F. Atlas of global wave energy from 10 years of reanalysis and hindcast data. Renew. Energy 2012, 39, 49–64. [Google Scholar] [CrossRef]
  12. Liberti, L.; Carillo, A.; Sannino, G. Wave energy resource assessment in the Mediterranean, the Italian perspective. Renew. Energy 2013, 50, 938–949. [Google Scholar] [CrossRef]
  13. Mota, P.; Pinto, J.P. Wave energy potential along the western Portuguese coast. Renew. Energy 2014, 71, 8–17. [Google Scholar] [CrossRef]
  14. Soares, C.G.; Bento, A.R.; Goncalves, M.; Silva, D.; Martinho, P. Numerical evaluation of the wave energy resource along the Atlantic European coast. Comput. Geosci. 2014, 71, 37–49. [Google Scholar] [CrossRef]
  15. Bernardino, M.; Rusu, L.; Soares, C.G. Evaluation of the wave energy resources in the Cape Verde Islands. Renew. Energy 2017, 101, 316–326. [Google Scholar] [CrossRef]
  16. Silva, D.; Martinho, P.; Guedes Soares, C. Wave energy Distribution along the Portuguese continental coast based on A thirty three years hindcast. Renew. Energy 2018, 127, 1064–1075. [Google Scholar] [CrossRef]
  17. Gonalves, M.; Martinho, P.; Soares, C.G. A 33-year hindcast on wave energy assessment in the western French coast. Energy 2018, 165, 790–801. [Google Scholar] [CrossRef]
  18. Gonalves, M.; Martinho, P.; Soares, C.G. Wave energy assessment based on a 33-year hindcast for the Canary Islands. Renew. Energy 2020, 152, 259–269. [Google Scholar] [CrossRef]
  19. Ribal, A.; Babanin, A.V.; Zieger, S.; Liu, Q. A high-resolution wave energy resource assessment of Indonesia. Renew. Energy 2020, 160, 1349–1363. [Google Scholar] [CrossRef]
  20. Bingölbali, B.; Majidi, A.G.; Akpınar, A. Inter-and intra-annual wave energy resource assessment in the south-western Black Sea coast. Renew. Energy 2021, 169, 809–819. [Google Scholar] [CrossRef]
  21. Liang, B.; Fan, F.; Yin, Z.; Shi, H.; Lee, D. Numerical modelling of the nearshore wave energy resources of Shandong peninsula, China. Renew. Energy 2013, 57, 330–338. [Google Scholar] [CrossRef]
  22. Zheng, C.; Shao, L.; Shi, W.; Su, Q.; Lin, G.; Li, X.; Chen, X. An assessment of global ocean wave energy resources over the last 45 a. Acta Oceanol. Sin. 2014, 33, 92–101. [Google Scholar] [CrossRef]
  23. Liang, B.; Fei, F.; Liu, F.; Gao, S.; Zuo, H. 22-Year wave energy hindcast for the China East Adjacent Seas. Renew. Energy 2014, 71, 200–207. [Google Scholar] [CrossRef]
  24. Zhou, G.; Huang, J.; Zhang, G. Evaluation of the wave energy conditions along the coastal waters of Beibu Gulf, China. Energy 2015, 85, 449–457. [Google Scholar] [CrossRef]
  25. Wang, Z.; Dong, S.; Li, X.; Soares, C.G. Assessments of wave energy in the Bohai Sea, China. Renew. Energy 2016, 90, 145–156. [Google Scholar] [CrossRef]
  26. Lin, Y.; Dong, S.; Wang, Z.; Soares, C.G. Wave energy assessment in the China adjacent seas on the basis of a 20-year SWAN simulation with unstructured grids. Renew. Energy 2019, 136, 275–295. [Google Scholar] [CrossRef]
  27. Wan, Y.; Zheng, C.; Li, L.; Dai, Y.; Esteban, M.D.; López-Gutiérrez, J.-S.; Qu, X.; Zhang, X. Wave energy assessment related to wave energy convertors in the coastal waters of China. Energy 2020, 202, 117741. [Google Scholar] [CrossRef]
  28. Hersbach, H.; Bell, B.; Berrisford, P.; Hirahara, S.; Horányi, A.; Muñoz-Sabater, J.; Nicolas, J.; Peubey, C.; Radu, R.; Schepers, D.; et al. The ERA5 Global Reanalysis. Q. J. R. Meteorol. Soc. 2020, 146, 1999–2049. [Google Scholar] [CrossRef]
  29. Mustapa, M.A.; Yaakob, O.B.; Ahmed, Y.M.; Rheem, C.-K.; Koh, K.K.; Adnan, F.A. Wave energy device and breakwater integration: A review. Renew. Sustain. Energy Rev. 2017, 77, 43–58. [Google Scholar] [CrossRef]
  30. Alamian, R.; Shafaghat, R.; Miri, S.J.; Yazdanshenas, N.; Shakeri, M. Evaluation of technologies for harvesting wave energy in Caspian Sea. Renew. Sustain. Energy Rev. 2014, 32, 468–476. [Google Scholar] [CrossRef]
  31. Jiang, Y. Research on Structure Optimization and Control Technology of Point Absorption Wave Power Generation System; South China University of Technology: Guangzhou, China, 2019. [Google Scholar]
  32. Li, H.L. Study on Duck Wave Energy Acquisition Converter with Elastic Energy Storage; Harbin Institute of Technology: Harbin, China, 2015. [Google Scholar]
  33. Yu, Y.H.; Jenne, D.S.; Thresher, R.; Copping, A.; Geerlofs, S.; Hanna, L.A. Reference Model 5 (rm5): Oscillating Surge Wave Energy converter; National Renewable Energy Laboratory (NREL): Golden, CO, USA, 2015.
  34. Zhang, Y.Q.; Sheng, S.W.; You, Y.G.; Wang, Z.P.; Wang, K.L.; Lin, H.J. Model test of 100 kw multi-body floating eagle wave power generation device. J. Ocean Technol. 2014, 33, 73–80. [Google Scholar]
  35. Ramos, V.; López, M.; Taveira-Pinto, F.; Rosa-Santos, P. Performance assessment of the CECO wave energy converter: Water depth influence. Renew. Energy 2018, 117, 341–356. [Google Scholar] [CrossRef]
  36. Santos, P.R.; Taveira-Pinto, F.; Rodríguez, C.A.; Ramos, V.; Lopez, M. The CECO wave energy converter: Recent developments. Renew. Energy 2019, 139, 368–384. [Google Scholar] [CrossRef]
  37. Giannini, G.; Rosa-Santos, P.; Ramos, V.; Taveira-Pinto, F. On the Development of an Offshore Version of the CECO Wave Energy Converter. Energies 2020, 13, 1036. [Google Scholar] [CrossRef]
  38. Bozzi, S.; Besio, G.; Passoni, G. Wave power technologies for the Mediterranean offshore: Scaling and performance analysis. Coast. Eng. 2018, 136, 130–146. [Google Scholar] [CrossRef]
  39. Wan, Y.; Fan, C.; Zhang, J.; Meng, J.; Dai, Y.; Li, L.; Sun, W.; Zhou, P.; Wang, J.; Zhang, X. Wave energy resource assessment off the coast of China around the Zhoushan Islands. Energies 2017, 10, 1320. [Google Scholar] [CrossRef]
  40. Weinstein, A.; Fredrikson, G.; Parks, M.J.; Nielsen, K. AquaBuOY-the offshore wave energy converter numerical modeling and optimization. In Proceedings of the Oceans’ 04 MTS/IEEE Techno-Ocean’04 (IEEE Cat. No. 04CH37600), Kobe, Japan, 9–12 November 2004; IEEE: Piscataway, NJ, USA, 2004; Volume 4, pp. 1854–1859. [Google Scholar]
  41. Morim, J.; Cartwright, N.; Etemad-Shahidi, A.; Strauss, D.; Hemer, M. Wave energy resource assessment along the Southeast coast of Australia on the basis of a 31-year hindcast. Appl. Energy 2016, 184, 276–297. [Google Scholar] [CrossRef]
  42. Lavidas, G.; Agarwal, A.; Venugopal, V. Availability and Accessibility for Offshore Operations in the Mediterranean Sea. J. Waterw. Port Coast. Ocean Eng. 2018, 144, 5018006. [Google Scholar] [CrossRef]
  43. Amrutha, M.M.; Kumar, V.S. Evaluation of a few wave energy converters for the Indian shelf seas based on available wave power. Ocean Eng. 2022, 244, 110360. [Google Scholar] [CrossRef]
  44. Shi, H.; Zhang, X.; Du, W.; Li, Q.; Qu, H.; You, Z. Assessment of Wave Energy Resources in China. J. Mar. Sci. Eng. 2022, 10, 1771. [Google Scholar] [CrossRef]
  45. Wang, C.K.; Lu, W. Analysis Methods and Reserves Evaluation of Ocean Energy Resources; Ocean Publication: Beijing, China, 2009; p. 272. [Google Scholar]
  46. Astariz, S.; Vazquez, A.; Iglesias, G. Evaluation and comparison of the levelized cost of tidal, wave, and offshore wind energy. J. Renew. Sustain. Energy 2015, 7, 053112. [Google Scholar] [CrossRef]
Figure 1. Study area.
Jmse 11 01198 g001
Figure 2. A map of the location of the buoy (The star is Buoy_PY30-1).
Jmse 11 01198 g002
Figure 3. Annual average distribution of P w in the South China Sea in the last 10 years.
Jmse 11 01198 g003
Figure 4. Validation results of ERA5 and buoy data ( H s data is magenta and T e data is green. The graph in the figure is a enlarged display of the selected area): (a) H s validation results; (b) T e validation results.
Jmse 11 01198 g004
Figure 5. Location of the four research areas and their associated province.
Jmse 11 01198 g005
Figure 6. Locations of the small study sites in study areas A, B, C, and D considering a 100 m water depth (a) and P w (b).
Jmse 11 01198 g006
Figure 7. Locations of key stations in the provinces around the South China Sea.
Jmse 11 01198 g007
Figure 8. The weight of the four indicators in each key station.
Jmse 11 01198 g008
Figure 9. Rose plots of wave power under full sea state (the first two rows) and storm protection (the last two rows) at each key station.
Jmse 11 01198 g009aJmse 11 01198 g009b
Table 1. Characteristic parameters of the performance indices of various devices.
TypeDeviceRated Power (kW)Suitable Water Depth (m)
Wave-activated bodyCECO50030–50
Oyster800≈15
Wanshan10020–100
Point absorberAquaBuoy25040–80
Wavebob1000>50
AWS2000>50
Oscillating water columnWaveStar60050–60
OceanLinx2005–50
Oscillating surgeRM536050–100
OvertoppingSSG1506–18
Wave Dragon4020–40
Table 2. Grading criteria for three indicators of small study sites in the Guangxi A study area.
IndexhPoorUseableGood
P w 0.931.05–1.981.99–2.912.92–3.84
T E w a v e 884.6967.2–1851.81851.9–2736.42736.5–3621
D i r m a i n _ p r o 0.060.79–0.850.86–0.910.92–0.97
Table 3. Levels of the three indicators in small study sites a1, a2, and a3.
Area P w   ( k W / m ) Level T E w a v e   ( h ) Level D i r m a i n p r o ( % ) Level
a12.473Useable2532.573useable0.88Useable
a23.332Good3308.547good0.90Useable
a32.388Useable2332.867useable0.85Useable
Table 4. P e , C f , C w , and R c w values of five devices at each key station.
Key StationIndexABAWSWbRM5Wanshan
a2-57 P e 1.8927.84711.6278.71118.547
C f 0.0080.0040.0120.0870.052
C w 0.4922.0423.0262.2674.827
R c w 2.4621.41811.6389.44610.726
b2-54 P e 6.17223.90521.83715.59726.783
C f 0.0250.0120.0220.1560.074
C w 1.1484.4464.0612.9014.981
R c w 5.7393.08715.61912.08511.068
c3-49 P e 14.25054.72146.85553.02932.046
C f 0.0570.0270.0470.1470.321
C w 1.3705.2624.5065.1003.082
R c w 6.8523.65517.33111.33312.841
c5-59 P e 15.19656.46551.44560.52534.222
C f 0.0610.0280.0510.1680.342
C w 1.2944.8074.3805.1532.914
R c w 6.4693.33816.84511.45112.140
d2-53 P e 15.09370.59263.28430.67467.439
C f 0.0600.0350.0630.3070.187
C w 1.0805.0514.5282.1954.826
R c w 5.4003.50817.4179.14610.724
d3-17 P e 12.70748.29345.68856.03930.427
C f 0.0510.0240.0460.1560.304
C w 1.1644.4234.1845.1322.787
R c w 5.8183.07116.09311.40411.610
Table 5. The main wave propagation direction and energy proportion of each key station.
Key StationPredominatingUnder Full
Sea State (%)
Under Storm
Protection (%)
a2-57(NNE-NE)+S7176
b2-54NE-E77.477.8
c3-49ENE-E74.275.7
c5-59NE-ENE60.7 (NE)66.4 (NE-ENE)
d2-53NNE-NE92.884.5
d3-17NNE-ENE71.7 (NNE-ENE)77.2 (NE-ENE)
Table 6. Results of AEP and LCOE values for two devices at key stations.
Key Station
(WEC)
Under Full Sea StateUnder Storm Protection
A E P   ( MWh ) LCOE (EUR/MW h) A E P   ( MWh ) LCOE (EUR/MW h)
a2-57
(Wanshan)
1625831.398864828.93.5080
b2-54
(Wanshan)
234779.80.9686200952.71.1317
c3-49
(RM5)
464852.21.7612380657.42.1508
c5-59
(RM5)
530562.21.5431367711. 82.2265
d2-53
(Wanshan)
591170.30.3847254014.10.8953
d3-17
(RM5)
491237.91.6666342505.22.3903
Disclaimer/Publisher’s Note: The statements, opinions and data contained in all publications are solely those of the individual author(s) and contributor(s) and not of MDPI and/or the editor(s). MDPI and/or the editor(s) disclaim responsibility for any injury to people or property resulting from any ideas, methods, instructions or products referred to in the content.

