
An Effective Multi-Layer Attention Network for SAR Ship Detection

Abstract
:1. Introduction
2. Related Works
2.1. Traditional SAR Ship Detection
2.2. Deep Learning-Based SAR Ship Detection
3. Methods
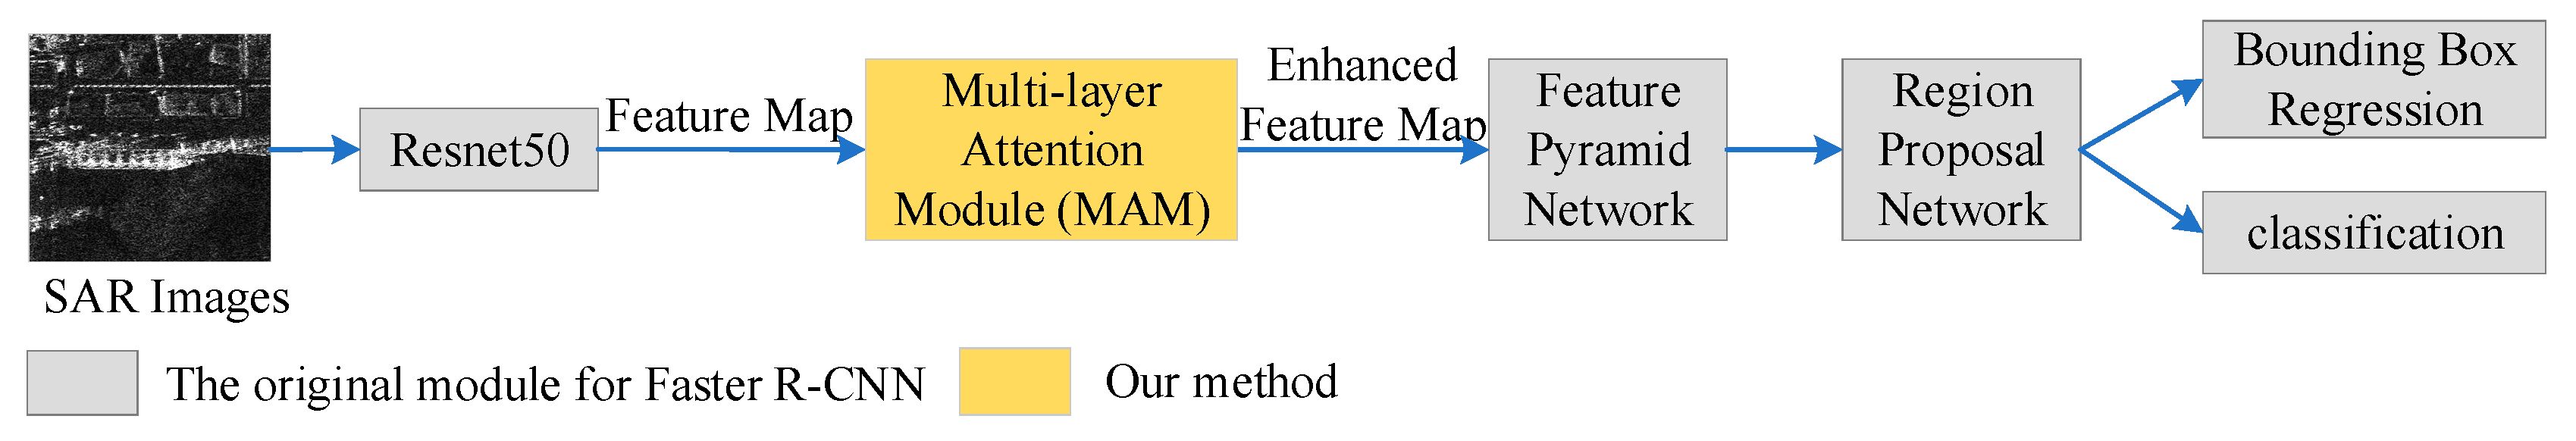
3.1. Overall Design
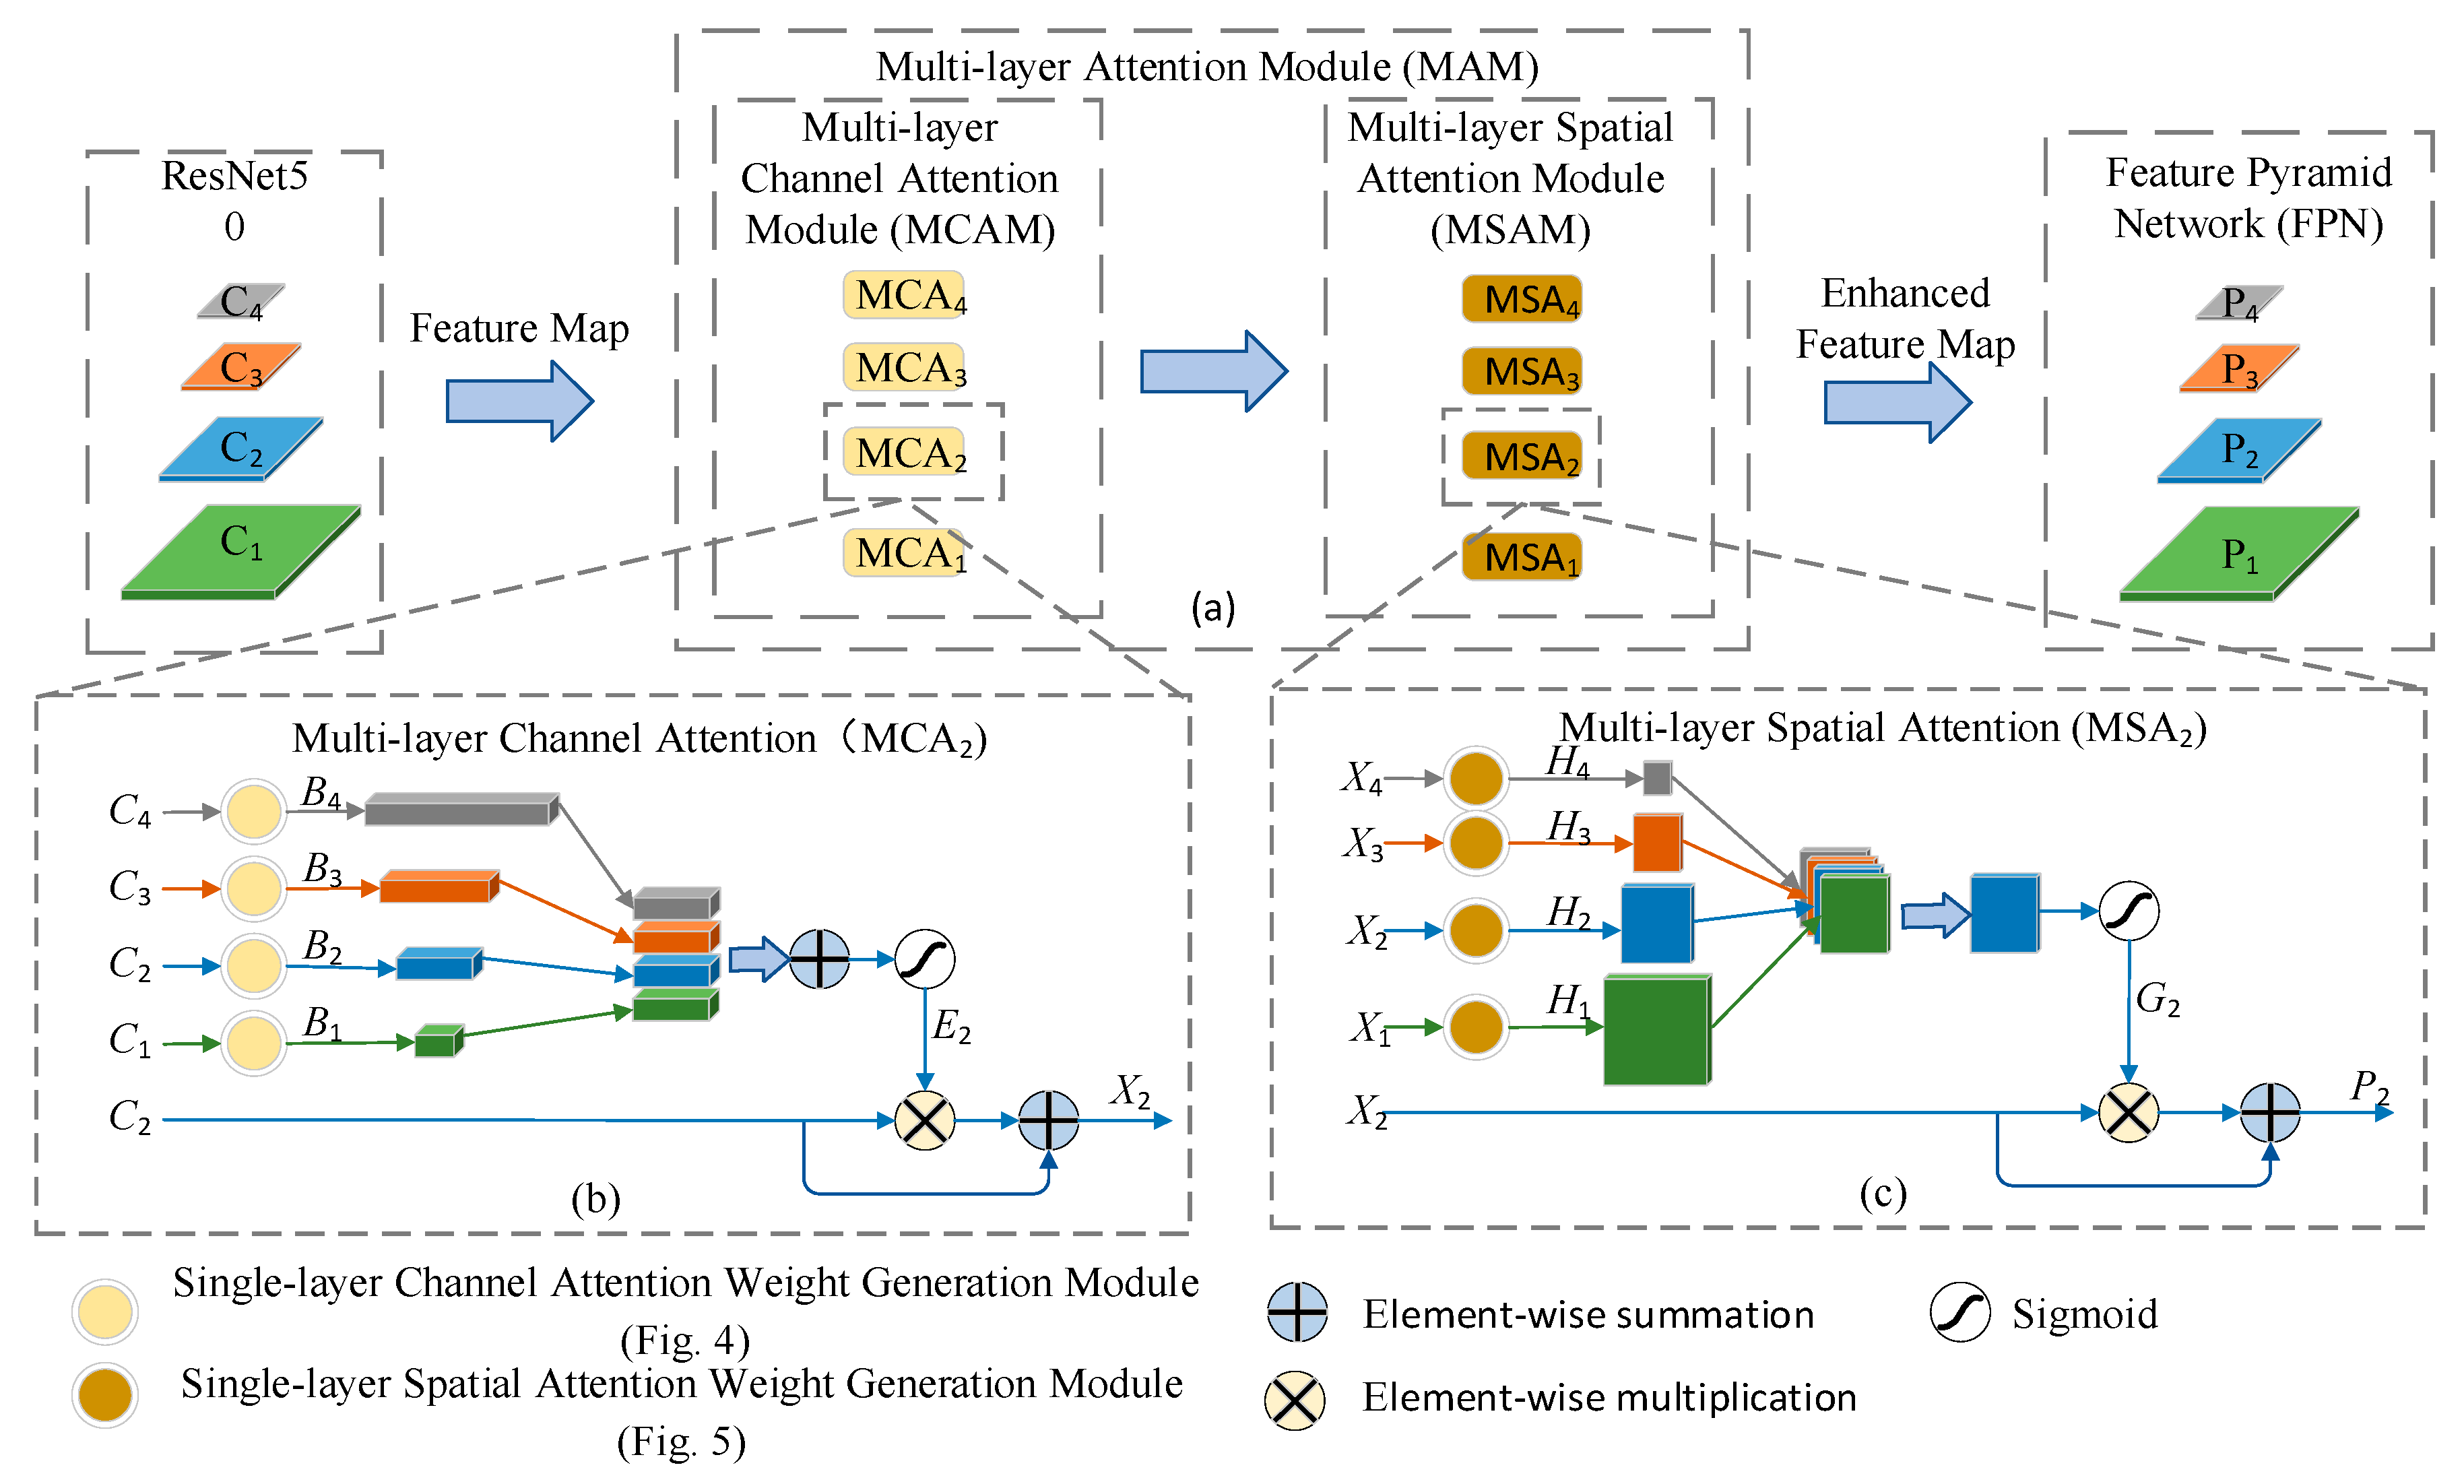
3.2. MAM
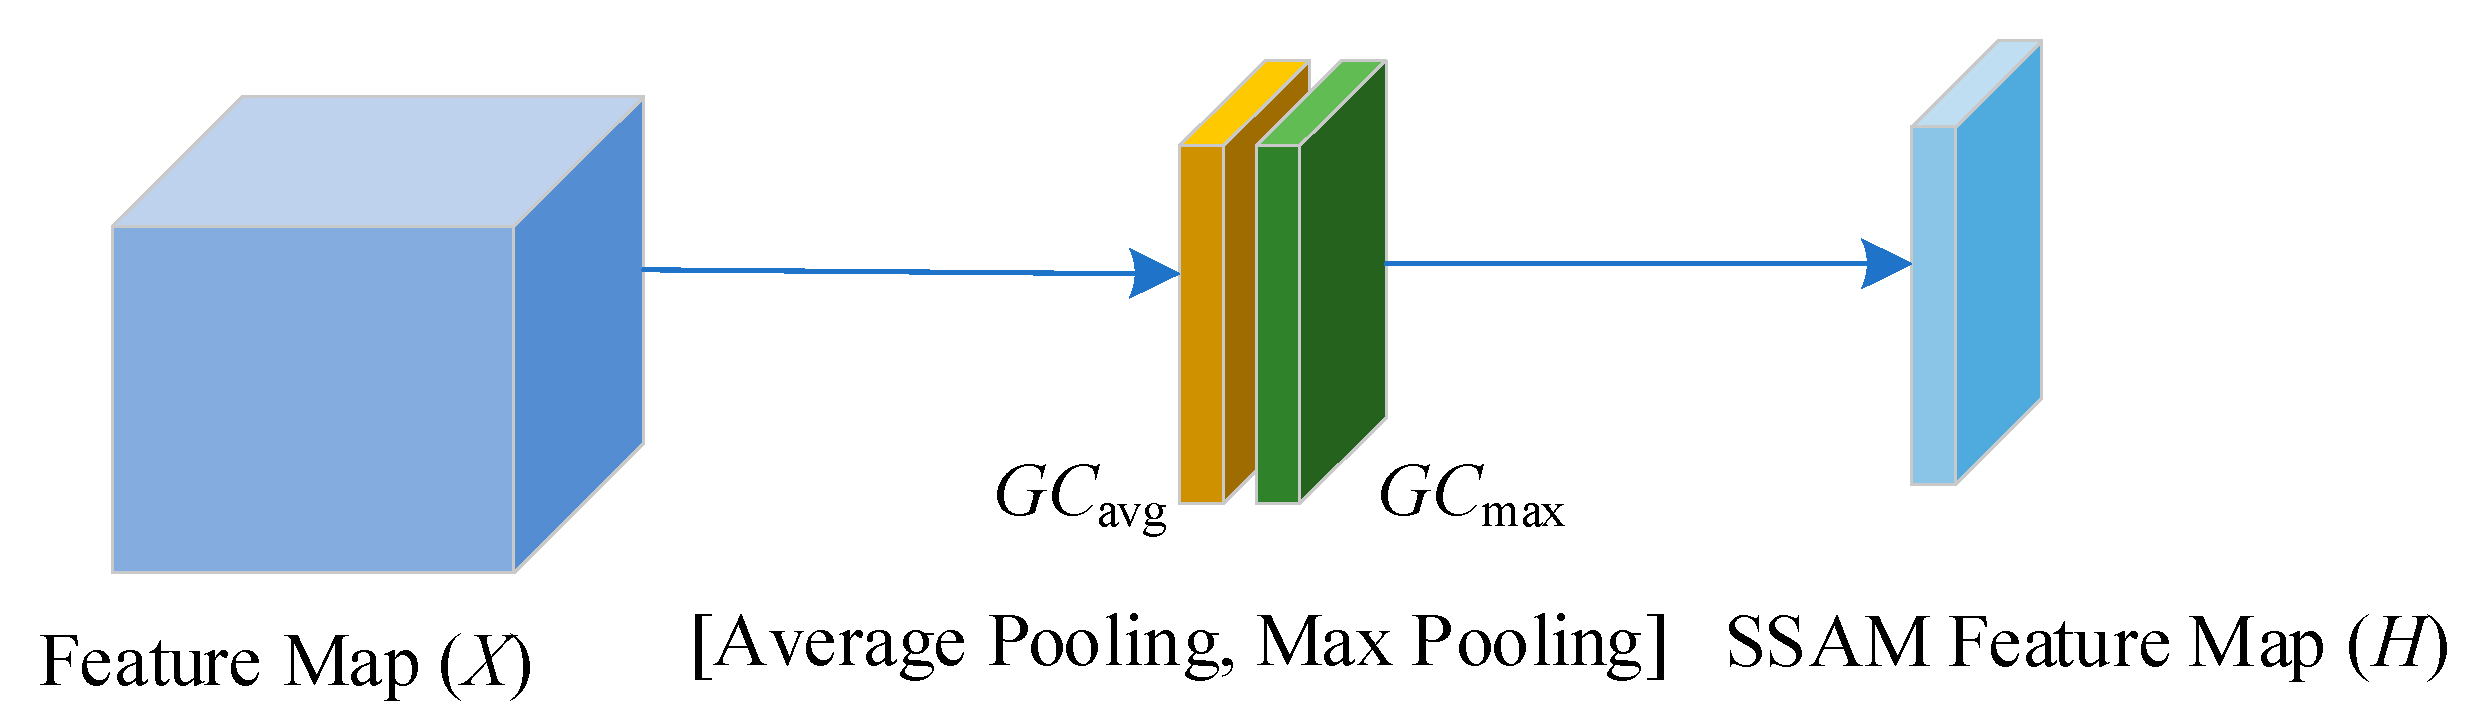
3.3. MCAM
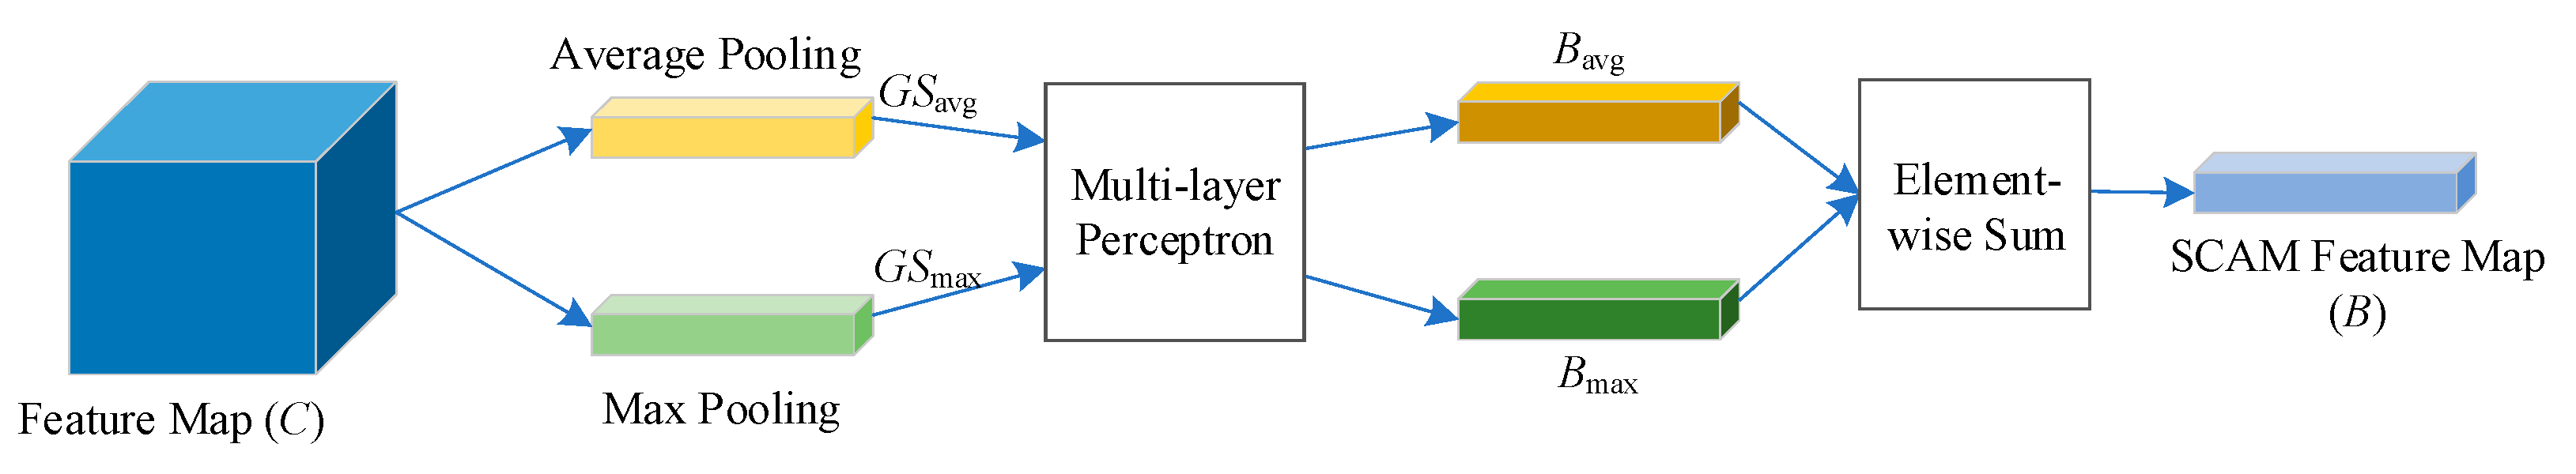
3.3.1. Generation of Single-Layer Channel Attention
3.3.2. Generation of MCA
3.3.3. Generation of the MCA Feature Map
3.4. MSAM
3.4.1. Generation of Single-Layer Spatial Attention
3.4.2. Generation of Multi-Layer Spatial Attention
3.4.3. Generation of the Multi-Layer Spatial Attention Feature Map
4. Experiments
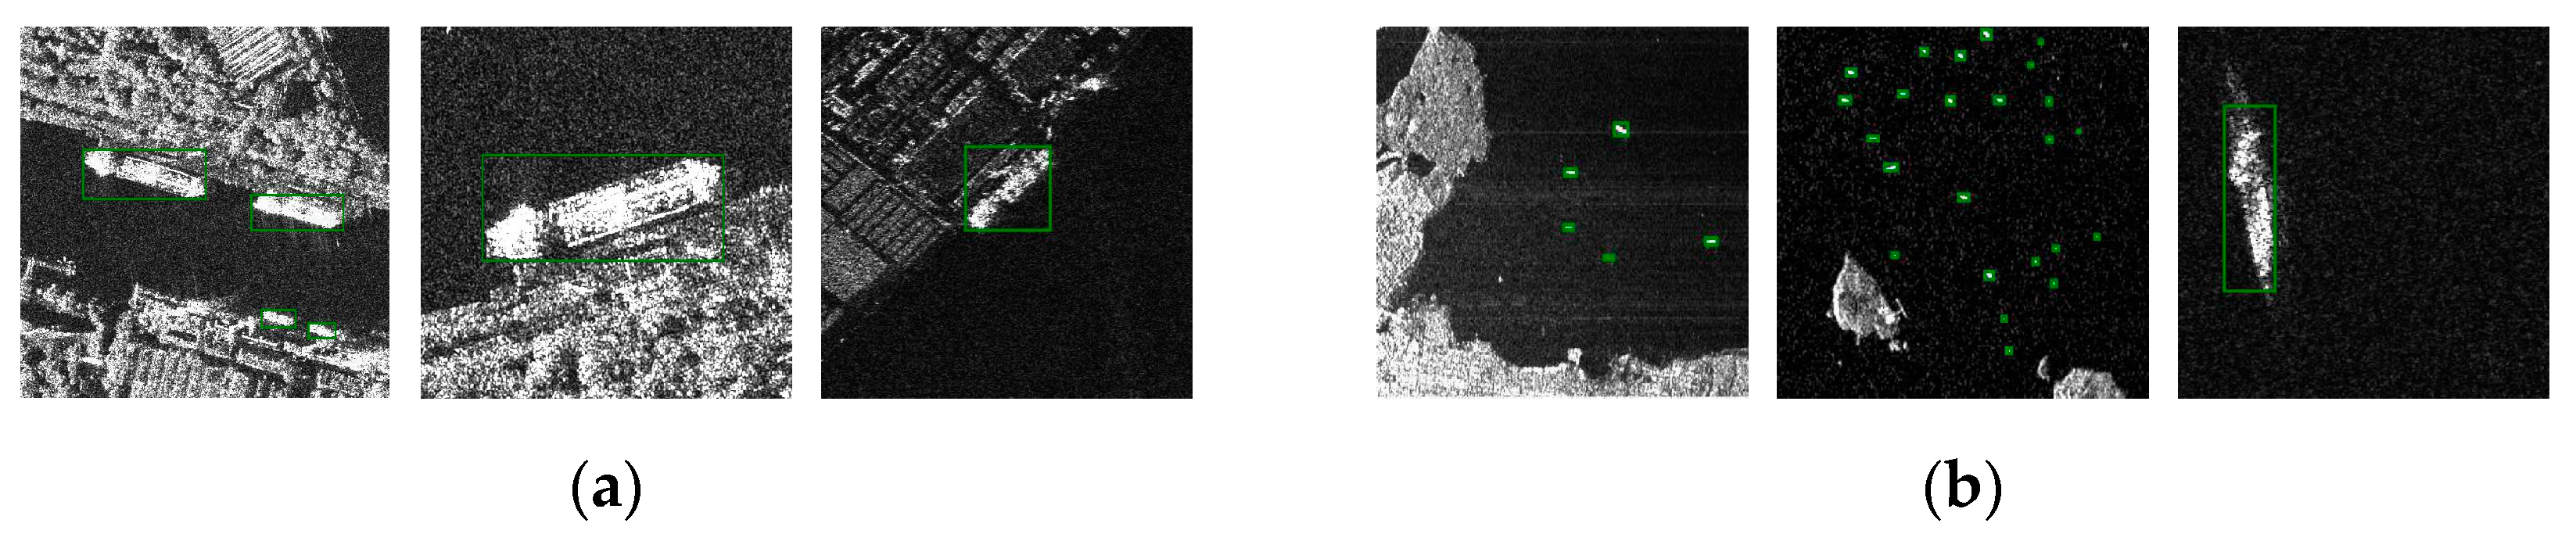
4.1. Datasets
4.2. Parameters and Metrics
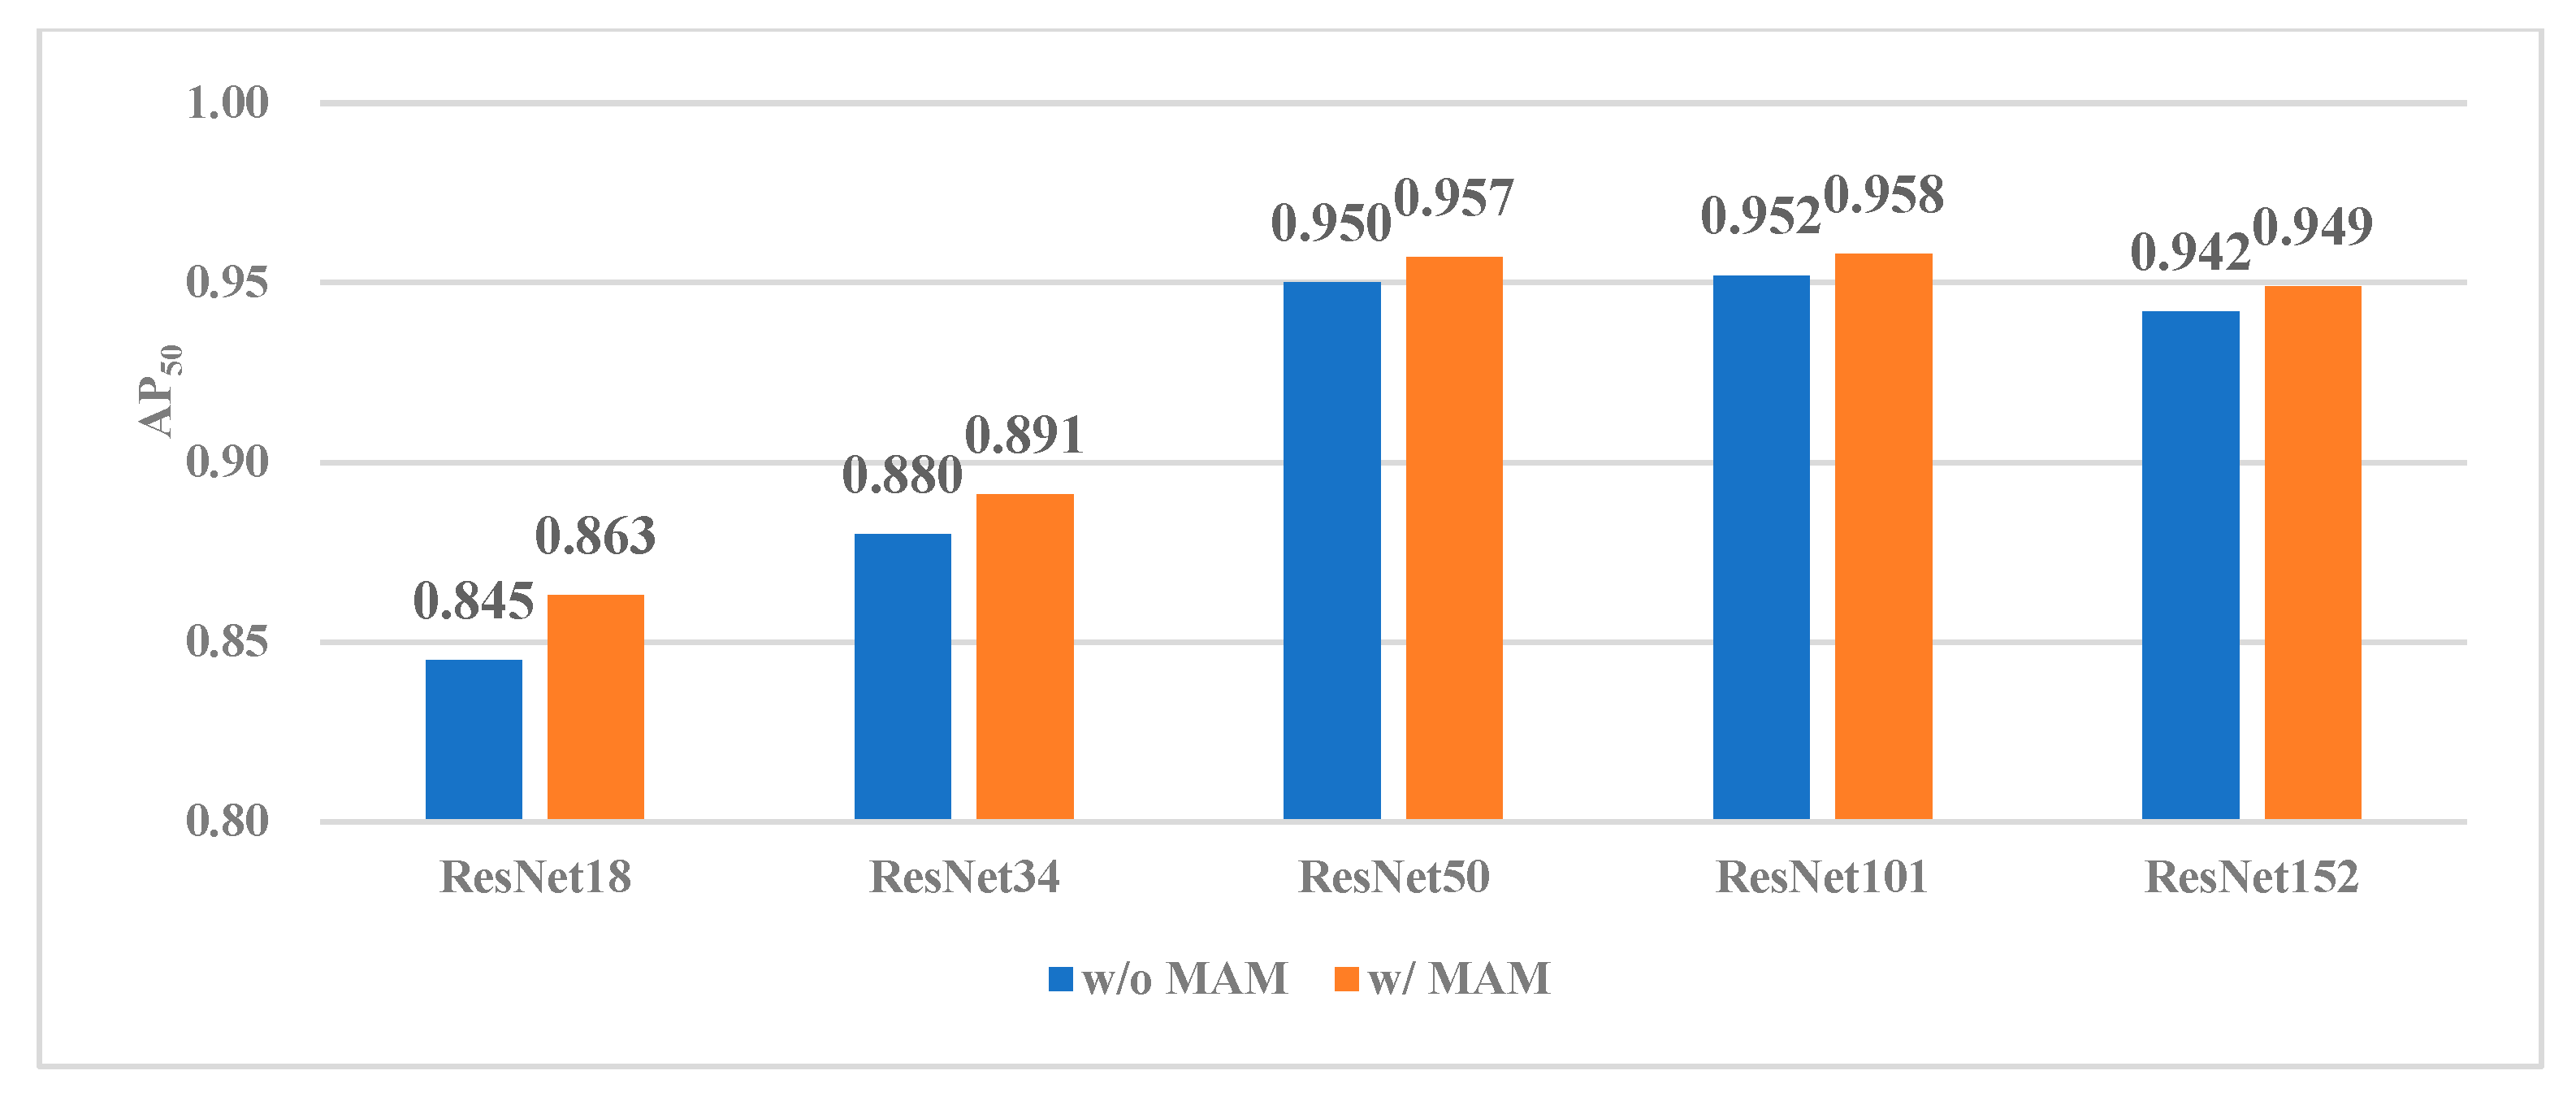
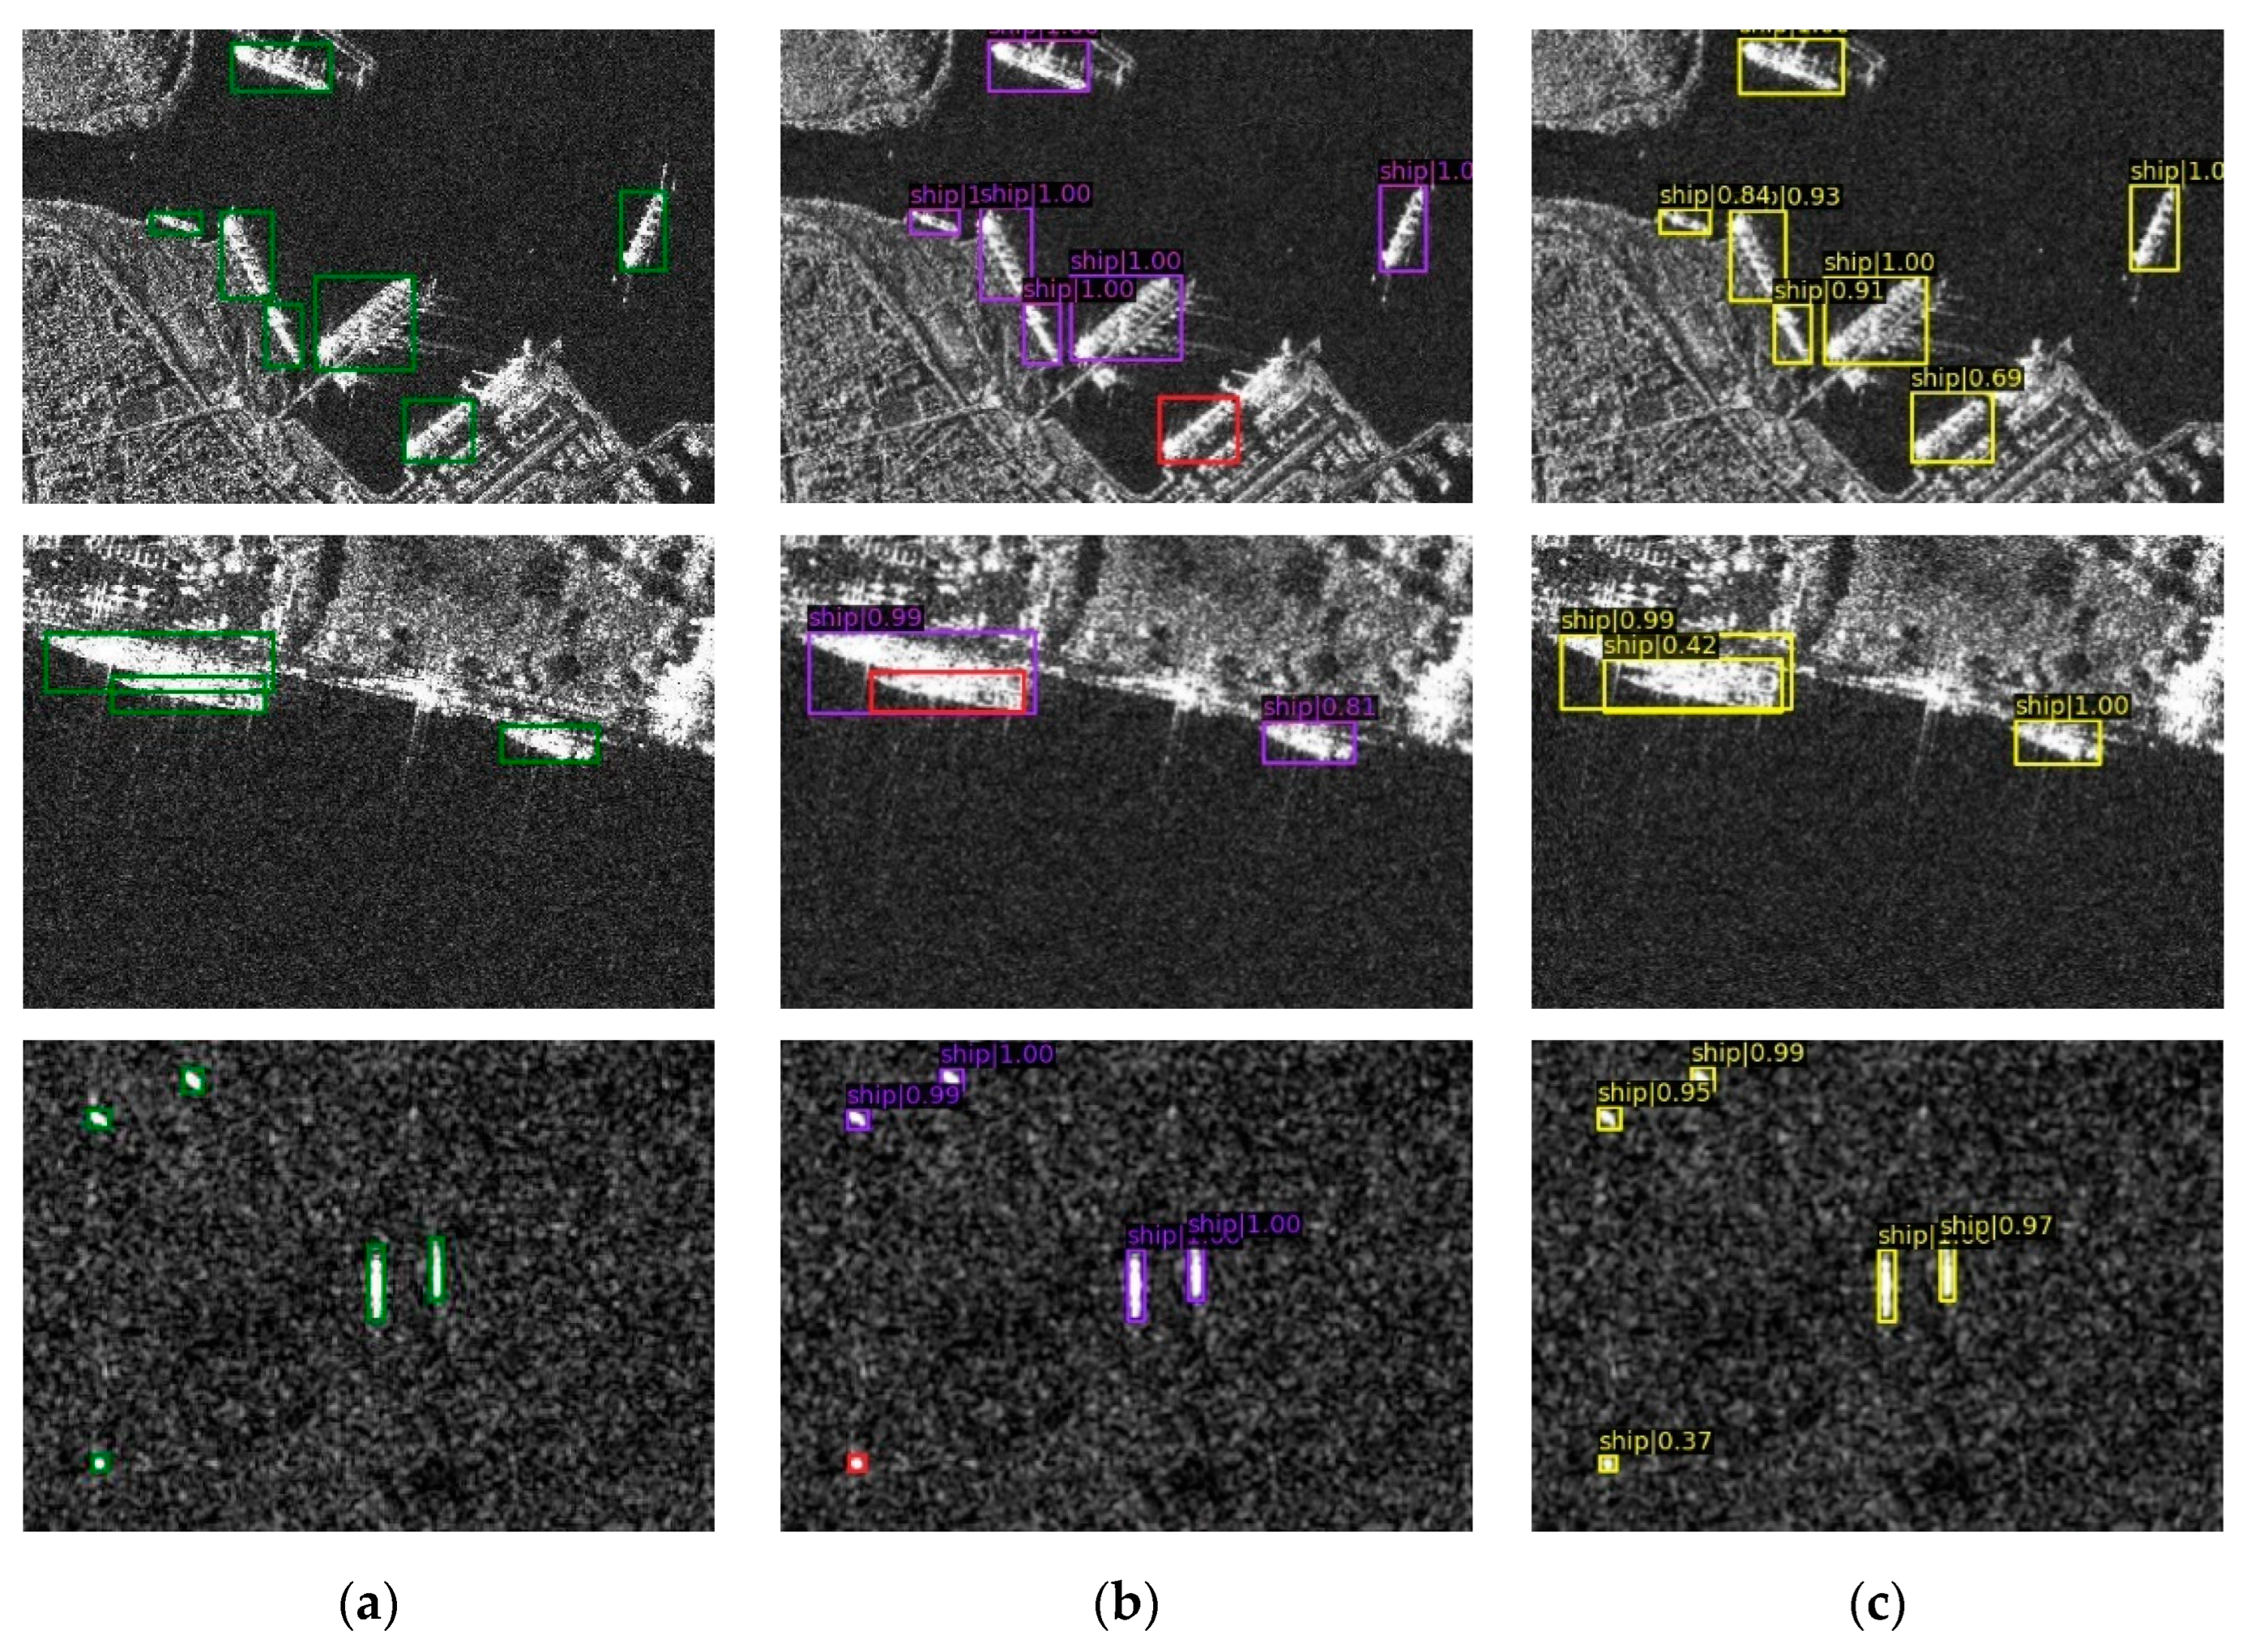
4.3. Results and Analysis
4.4. Limitations and Possible Improvements
5. Conclusions
Author Contributions
Funding
Institutional Review Board Statement
Informed Consent Statement
Data Availability Statement
Conflicts of Interest
References
- Karthäuser, J.F.; Koc, J.; Schönemann, E.; Wanka, R.; Aldred, N.; Clare, A.S.; Rosenhahn, A.; Laschewsky, A. Optimizing Fouling Resistance of Poly(Sulfabetaine)s through Backbone and Charge Separation. Adv. Mater. Interfaces 2022, 9, 2200677. [Google Scholar] [CrossRef]
- Crisp, D.J. The State-of-The-Art in Ship Detection in Synthetic Aperture Radar Imagery; Defence Science and Technology Group: Canberra, Australia, 2004. [Google Scholar]
- Pelich, R.; Longépé, N.; Mercier, G.; Hajduch, G.; Garello, R. AIS-Based Evaluation of Target Detectors and SAR Sensors Characteristics for Maritime Surveillance. IEEE J. Sel. Top. Appl. Earth Obs. Remote Sens. 2015, 8, 3892–3901. [Google Scholar] [CrossRef]
- Son, J.; Kim, D.-H.; Yun, S.-W.; Kim, H.-J.; Kim, S. The Development of Regional Vessel Traffic Congestion Forecasts Using Hybrid Data from an Automatic Identification System and a Port Management Information System. J. Mar. Sci. Eng. 2022, 10, 1956. [Google Scholar] [CrossRef]
- Sun, C.; Xue, M.; Zhao, N.; Zeng, Y.; Yuan, J.; Zhang, J. A Deep Learning Method for NLOS Error Mitigation in Coastal Scenes. J. Mar. Sci. Eng. 2022, 10, 1952. [Google Scholar] [CrossRef]
- Wang, C.; Jiang, S.; Zhang, H.; Wu, F.; Zhang, B. Ship Detection for High-Resolution SAR Images Based on Feature Analysis. IEEE Geosci. Remote Sens. Lett. 2013, 11, 119–123. [Google Scholar] [CrossRef]
- Leng, X.; Ji, K.; Yang, K.; Zou, H. A Bilateral CFAR Algorithm for Ship Detection in SAR Images. IEEE Geosci. Remote Sens. Lett. 2015, 12, 1536–1540. [Google Scholar] [CrossRef]
- Zhang, X.; Crisci, R.; Finlay, J.A.; Cai, H.; Clare, A.S.; Chen, Z.; Silberstein, M.N. Enabling Tunable Water-Responsive Surface Adaptation of PDMS via Metal–Ligand Coordinated Dynamic Networks. Adv. Mater. Interfaces 2022, 9, 2200430. [Google Scholar] [CrossRef]
- Zhang, T.W.; Zhang, X.L.; Li, J.W.; Xiao, X.; Wang, B.; Zhan, X.; Xu, Y.; Ke, X.; Zeng, T.; Su, H.; et al. SAR Ship Detection Dataset (SSDD): Official Release and Comprehensive Data Analysis. Remote Sens. 2021, 13, 3690. [Google Scholar] [CrossRef]
- Lin, T.-Y.; Dollar, P.; Girshick, R.; He, K.; Hariharan, B.; Belongie, S. Feature Pyramid Networks for Object Detection. In Proceedings of the IEEE Conference on Computer Vision and Pattern Recognition (CVPR), Honolulu, HI, USA, 22 July 2017. [Google Scholar]
- Ai, J.; Qi, X.; Yu, W.; Deng, Y.; Liu, F.; Shi, L. A New CFAR Ship Detection Algorithm Based on 2-D Joint Log-Normal Distribution in SAR Images. IEEE Geosci. Remote Sens. Lett. 2010, 7, 806–810. [Google Scholar] [CrossRef]
- He, K.; Zhang, X.; Ren, S.; Sun, J. Deep residual learning for image recognition. In Proceedings of the IEEE Conference on Computer Vision and Pattern Recognition (CVPR), Las Vegas, NV, USA, 26 June 2016. [Google Scholar]
- Wang, C.; Bi, F.; Zhang, W.; Chen, L. An Intensity-Space Domain CFAR Method for Ship Detection in HR SAR Images. IEEE Geosci. Remote Sens. Lett. 2017, 14, 529–533. [Google Scholar] [CrossRef]
- Pappas, O.; Achim, A.; Bull, D. Superpixel-Level CFAR Detectors for Ship Detection in SAR Imagery. IEEE Geosci. Remote Sens. Lett. 2018, 15, 1397–1401. [Google Scholar] [CrossRef]
- Li, T.; Liu, Z.; Xie, R.; Ran, L. An Improved Superpixel-Level CFAR Detection Method for Ship Targets in High-Resolution SAR Images. IEEE J. Sel. Top. Appl. Earth Obs. Remote Sens. 2018, 11, 184–194. [Google Scholar] [CrossRef]
- Ren, S.; He, K.; Girshick, R.; Sun, J. Faster R-CNN: Towards Real-Time Object Detection with Region Proposal Networks. IEEE Trans. Pattern Anal. Mach. Intell. 2017, 39, 1137–1149. [Google Scholar] [CrossRef]
- Redmon, J.; Divvala, S.; Girshick, R.; Farhadi, A. You Only Look Once: Unified, Real-Time Object Detection. In Proceedings of the IEEE Conference on Computer Vision and Pattern Recognition (CVPR), Las Vegas, NV, USA, 26 June 2016. [Google Scholar]
- Liu, W.; Anguelov, D.; Erhan, D.; Szegedy, C.; Reed, S.; Fu, C.-Y.; Berg, A.C. SSD: Single Shot MultiBox Detector. In Proceedings of the European Conference on Computer Vision, Amsterdam, The Netherlands, 11 October 2016. [Google Scholar] [CrossRef]
- Bochkovskiy, A.; Wang, C.-Y.; Liao, H.-Y.M. YOLOv4: Optimal Speed and Accuracy of Object Detection. arXiv 2004, arXiv:2004.10934. [Google Scholar]
- Li, J.; Qu, C.; Shao, J. Ship detection in SAR images based on an improved faster R-CNN. In Proceedings of the 2017 SAR in Big Data Era: Models, Methods and Applications (BIGSARDATA), Beijing, China, 13–14 November 2017. [Google Scholar] [CrossRef]
- Zhou, L.-Q.; Piao, J.-C. A Lightweight YOLOv4 Based SAR Image Ship Detection. In Proceedings of the 2021 IEEE 4th International Conference on Computer and Communication Engineering Technology (CCET), Beijing, China, 13 August 2021. [Google Scholar] [CrossRef]
- Chang, Y.-L.; Anagaw, A.; Chang, L.; Wang, Y.C.; Hsiao, C.-Y.; Lee, W.-H. Ship detection based on YOLOv2 for SAR imagery. Remote Sens. 2019, 11, 786. [Google Scholar] [CrossRef]
- Zhang, L.; Liu, Y.; Zhao, W.; Wang, X.; Li, G.; He, Y. Frequency-Adaptive Learning for SAR Ship Detection in Clutter Scenes. IEEE Trans. Geosci. Remote Sens. 2023; early access. [Google Scholar] [CrossRef]
- Wei, S.; Su, H.; Ming, J.; Wang, C.; Yan, M.; Kumar, D.; Shi, J.; Zhang, X. Precise and Robust Ship Detection for High-Resolution SAR Imagery Based on HR-SDNet. Remote Sens. 2020, 12, 167. [Google Scholar] [CrossRef]
- Sun, Z.; Dai, M.; Leng, X.; Lei, Y.; Xiong, B.; Ji, K.; Kuang, G. An Anchor-free Detection Method for Ship Targets in High-Resolution SAR Images. IEEE J. Sel. Top. Appl. Earth Obs. Remote Sens. 2021, 14, 7799–7816. [Google Scholar] [CrossRef]
- Mao, Y.; Yang, Y.; Ma, Z.; Li, M.; Su, H.; Zhang, J. Efficient Low-Cost Ship Detection for SAR Imagery Based on Simplified U-Net. IEEE Access 2020, 8, 69742–69753. [Google Scholar] [CrossRef]
- Zhou, L.; Wei, S.; Cui, Z.; Fang, J.; Yand, X.; Ding, W. Lira-YOLO: A Lightweight Model for Ship Detection in Radar Images. J. Syst. Eng. Electron. 2020, 31, 950–956. [Google Scholar] [CrossRef]
- Bai, L.; Yao, C.; Ye, Z.; Xue, D.; Lin, X.; Hui, M. A Novel Anchor-Free Detector Using Global Context-Guide Feature Balance Pyramid and United Attention for SAR Ship Detection. IEEE Geosci. Remote Sens. Lett. 2023, 20, 4003005. [Google Scholar] [CrossRef]
- Hu, J.; Shen, L.; Albanie, S.; Sun, G.; Wu, E. Squeeze-and-Excitation Networks. IEEE Trans. Pattern Anal. Mach. Intell. 2020, 42, 2011–2033. [Google Scholar] [CrossRef]
- Woo, S.; Park, J.; Lee, J.-Y.; Kweon, I.S. CBAM: Convolutional Block Attention Module. In Proceedings of the European Conference on Computer Vision (ECCV), Munich, Germany, 14 September 2018. [Google Scholar]
- Cui, Z.; Li, Q.; Cao, Z.; Liu, N. Dense Attention Pyramid Networks for Multi-Scale Ship Detection in SAR Images. IEEE Trans. Geosci. Remote Sens. 2019, 57, 8983–8997. [Google Scholar] [CrossRef]
- Zhao, Y.; Zhao, L.; Xiong, B.; Kuang, G. Attention Receptive Pyramid Network for Ship Detection in SAR Images. IEEE J. Sel. Top. Appl. Earth Obs. Remote Sens. 2020, 13, 2738–2756. [Google Scholar] [CrossRef]
- Yang, X.; Zhang, X.; Wang, N.; Gao, X. A Robust One-Stage Detector for Multiscale Ship Detection with Complex Background in Massive SAR Images. IEEE Trans. Geosci. Remote Sens. 2021, 60, 5217712. [Google Scholar] [CrossRef]
- Bai, L.; Yao, C.; Ye, Z.; Xue, D.; Lin, X.; Hui, M. Feature Enhancement Pyramid and Shallow Feature Reconstruction Network for SAR Ship Detection. IEEE J. Sel. Top. Appl. Earth Obs. Remote Sens. 2023, 16, 1042–1056. [Google Scholar] [CrossRef]
- Guo, Q.; Tang, F.; Rodrigues, T.K.; Kato, N. Five Disruptive Technologies in 6G to Support Digital Twin Networks. IEEE Wirel. Commun. 2023; early access. [Google Scholar] [CrossRef]
- Geudtner, D.; Gebert, N.; Tossaint, M.; Davidson, M.; Heliere, F.; Traver, I.N.; Furnell, R.; Torres, R. Copernicus and ESA SAR missions. In Proceedings of the 2021 IEEE Radar Conference (RadarConf21), Atlanta, GA, USA, 7–14 May 2021; pp. 1–6. [Google Scholar]
- Zhang, T.; Zhang, X.; Li, J.; Xu, X.; Wang, B.; Zhan, X.; Xu, Y.; Ke, X.; Zeng, T.; Su, H.; et al. A SAR Dataset of Ship Detection for Deep Learning under Complex Backgrounds. Remote Sens. 2019, 11, 765. [Google Scholar]
- Wei, S.; Zeng, X.; Qu, Q.; Wang, M.; Su, H.; Shi, J. HRSID: A High-Resolution SAR Images Dataset for Ship Detection and Instance Segmentation. IEEE Access 2020, 8, 120234–120254. [Google Scholar] [CrossRef]
- Chen, K.; Wang, J.; Pang, J.; Cao, Y.; Xiong, Y.; Li, X.; Sun, S.; Feng, W.; Liu, Z.; Xu, J.; et al. MMDetection: Open mmlab detection toolbox and benchmark. arXiv 2019, arXiv:1906.07155. [Google Scholar]
- Rodrigues, T.K.; Kato, N. Deep Q Networks with Centralized Learning Over LEO Satellite Networks in a 6G Cloud Environment. In Proceedings of the 2022 IEEE Global Communications Conference, Rio de Janeiro, Brazil, 4–8 December 2022. [Google Scholar] [CrossRef]
- Li, J.; Chen, J.; Cheng, P.; Yu, Z.; Yu, L.; Chi, C. A Survey on Deep-Learning-Based Real-Time SAR Ship Detection. IEEE J. Sel. Top. Appl. Earth Obs. Remote Sens. 2023, 16, 3218–3247. [Google Scholar] [CrossRef]
- Lin, T.-Y.; Goyal, P.; Girshick, R.; He, K.; Dollar, P. Focal Loss for Dense Object Detection. In Proceedings of the IEEE International Conference on Computer Vision (ICCV), Venice, Italy, 22 October 2017. [Google Scholar]
- Lin, T.-Y.; Maire, M.; Belongie, S.; Hays, J.; Perona, P.; Ramanan, D.; Dollár, P.; Zitnick, C.L. Microsoft COCO: Common Objects in Context. European Conference on Computer Vision. In Proceedings of the European Conference on Computer Vision, Zurich, Switzerland, 6 September 2014. [Google Scholar] [CrossRef]
- Cai, Z.; Vasconcelos, N. Cascade R-CNN: Delving into High Quality Object Detection. In Proceedings of the IEEE International Conference on Computer Vision (ICCV), Salt Lake City, UT, USA, 19 July 2018. [Google Scholar]
- Zhou, X.; Wang, D.; Krähenbühl, P. Objects as Points. arXiv 2019, arXiv:1904.07850. [Google Scholar]
- Guo, H.; Yang, X.; Wang, N.; Gao, X. A CenterNet++ model for ship detection in SAR images. Pattern Recognit. 2021, 112, 107787. [Google Scholar] [CrossRef]


| Batch Size | Initial Leaning Rate | Momentum Decay | Weight Decay | Number of Epochs |
|---|---|---|---|---|
| 1 | 1.25 × 10⁻⁴ | 1 × 10⁻⁴ | 0.9 | 30 |
| Method | Precision | Recall | F1 | AP50 |
|---|---|---|---|---|
| RetinaNet [43] | 0.910 | 0.915 | 0.912 | 0.896 |
| Cascade R-CNN [44] | 0.940 | 0.899 | 0.919 | 0.893 |
| SSD512 [18] | 0.929 | 0.896 | 0.912 | 0.937 |
| CenterNet [45] | 0.943 | 0.945 | 0.944 | 0.935 |
| CenterNet++ [46] | 0.932 | 0.945 | 0.938 | 0.927 |
| Baseline [16] | 0.946 | 0.935 | 0.940 | 0.950 |
| Proposal | 0.953 | 0.949 | 0.951 | 0.957 |
| Method | Precision | Recall | F1 | AP50 |
|---|---|---|---|---|
| RetinaNet [43] | 0.881 | 0.938 | 0.909 | 0.938 |
| Cascade R-CNN [44] | 0.910 | 0.926 | 0.918 | 0.920 |
| SSD512 [18] | 0.901 | 0.905 | 0.903 | 0.942 |
| CenterNet [45] | 0.927 | 0.935 | 0.931 | 0.950 |
| CenterNet++ [46] | 0.925 | 0.934 | 0.929 | 0.949 |
| Baseline [16] | 0.941 | 0.949 | 0.945 | 0.948 |
| Proposal | 0.952 | 0.950 | 0.951 | 0.954 |
| Method | Precision | Recall | F1 | AP50 |
|---|---|---|---|---|
| RetinaNet [43] | 0.701 | 0.838 | 0.763 | 0.826 |
| Cascade R-CNN [44] | 0.899 | 0.794 | 0.843 | 0.793 |
| SSD512 [18] | 0.909 | 0.855 | 0.881 | 0.888 |
| CenterNet [45] | 0.818 | 0.874 | 0.845 | 0.863 |
| CenterNet++ [46] | 0.822 | 0.873 | 0.847 | 0.863 |
| Baseline [16] | 0.926 | 0.891 | 0.908 | 0.923 |
| Proposal | 0.931 | 0.902 | 0.916 | 0.936 |
| Method | MCAM | MSAM | AP50 | AP75 | APS |
|---|---|---|---|---|---|
| Baseline | 0.950 | 0.823 | 0.683 | ||
| MCAM | √ | 0.953 | 0.830 | 0.684 | |
| MSAM | √ | 0.956 | 0.848 | 0.693 | |
| Ours (MANet) | √ | √ | 0.957 | 0.852 | 0.697 |
Disclaimer/Publisher’s Note: The statements, opinions and data contained in all publications are solely those of the individual author(s) and contributor(s) and not of MDPI and/or the editor(s). MDPI and/or the editor(s) disclaim responsibility for any injury to people or property resulting from any ideas, methods, instructions or products referred to in the content. |
© 2023 by the authors. Licensee MDPI, Basel, Switzerland. This article is an open access article distributed under the terms and conditions of the Creative Commons Attribution (CC BY) license (https://creativecommons.org/licenses/by/4.0/).
Share and Cite
Suo, Z.; Zhao, Y.; Hu, Y. An Effective Multi-Layer Attention Network for SAR Ship Detection. J. Mar. Sci. Eng. 2023, 11, 906. https://doi.org/10.3390/jmse11050906
Suo Z, Zhao Y, Hu Y. An Effective Multi-Layer Attention Network for SAR Ship Detection. Journal of Marine Science and Engineering. 2023; 11(5):906. https://doi.org/10.3390/jmse11050906
Chicago/Turabian StyleSuo, Zhiling, Yongbo Zhao, and Yili Hu. 2023. "An Effective Multi-Layer Attention Network for SAR Ship Detection" Journal of Marine Science and Engineering 11, no. 5: 906. https://doi.org/10.3390/jmse11050906