Article

Differences in Thermo-Rheological Structure between Qiongdongnan Basin and Pearl River Mouth Basin: Implications for the Extension Model in the Northwestern Margin of the South China Sea

1
College of Earth Science and Engineering, Shandong University of Science and Technology, Qingdao 266590, China
2
Key Laboratory of Submarine Geosciences, Ministry of Natural Resources, Hangzhou 310012, China
3
Key Laboratory of Marine Geology and Environment, Institute of Oceanology, Chinese Academy of Sciences, Qingdao 266071, China
4
Key Lab of Submarine Geosciences and Prospecting Techniques, Ministry of Education, and College of Marine Geosciences, Ocean University of China, Qingdao 266100, China
*
Author to whom correspondence should be addressed.
J. Mar. Sci. Eng. 2023, 11(2), 443; https://doi.org/10.3390/jmse11020443
Submission received: 19 January 2023 / Revised: 7 February 2023 / Accepted: 10 February 2023 / Published: 17 February 2023
(This article belongs to the Section Geological Oceanography)

Abstract

:
This study combines surface heat flow, multi-channel seismic reflection profiles, and ocean-bottom seismometer (OBS) profiles to determine the thermo-rheological structure of the Qiongdongnan Basin (QDNB) and Pearl River Mouth Basin (PRMB), with the aim of researching the west–east variation of the passive continental margin rifting. Based on the initial lithospheric rheological model of a jelly sandwich-1 (JS-1) regime, the current architecture of the continental margin is identified to be the result of a non-uniform extension. Due to the decoupled crust–mantle relationship caused by the weak lower crust, the non-uniform extension led to the rupture of the mantle lithosphere before the crust. The central Xisha Trough falls into the JS-2 regime with only one brittle load layer, which is close to the rigid oceanic lithosphere of the Northwest Sub-basin (NSB). The high-velocity layers (HVLs) and detachment faults beneath the Xisha Trough are considered to be the result of the cooling of a thinned lower crust with mantle underplating during the middle stage of continental margin rifting. A seaward-increasing trend of lithospheric rheological strength is exhibited across the PRMB, from the crème brûlée-1 (CB-1) regime at the continental shelf to the JS-2 regime at the NSB. Unlike the HVLs of the Xisha Trough, the lower crustal HVLs beneath the eastern PRMB formed during the late stage of continental margin rifting due to the mantle lateral flow. The absence of HVLs beneath the western PRMB may indicate that the mantle lateral flow demonstrates a limited impact.

1. Introduction

The South China Sea (SCS) is the largest continental marginal sea of the western Pacific region, and its marginal basins are characterized by the related spatial variation of thinned lithosphere, which is jointly controlled by the Indo-Australian, Eurasian, and Pacific plates [1,2,3,4] (Figure 1). The marginal basins located in the continent–ocean transition zone (COTZ) of the SCS are often considered to be the products of multistage oceanic spreading, and they preserve a great deal of information about lithospheric thinning, magmatic activity, detachment faults, HVLs, and ocean crust production [5,6,7]. Two typical end-member continental extension models have been proposed by previous scholars to distribute the characteristics occurring in the COTZ: the magma-poor margins model, characterized by very limited magmatism, seaward-dipping detachment faults, and serpentine peridotite, and the volcanic margins model, featuring seaward-dipping reflectors and HVLs observed at the base of lower crust [8,9,10]. However, the northwestern SCS exhibits characteristics different from those assumed by these two continental extension models, and its tectonic setting may be more complex due to the spatial variation in the lithospheric structure [11,12,13,14,15].
The northwestern SCS exhibits obvious west–east variation in the basin-controlling fault systems, especially in the QDNB and PRMB, as induced by the westwards opening of the SCS [3,4,16]. Bounded by the NE-trending accommodation zone, the two basins can be divided into two parts: the non-detachment extensional fault systems in the western part and the deep detachment fault systems in the eastern part [7,17] (Figure 1). According to the deep reflection seismic profiles, a heavily thinned crust (<10 km) and high crustal extension factor (>2.5) are also typically observed in the Xishan Trough, the Liwan Sag, and the Baiyun Sag, which are usually regarded as failed rifting basins and are located in the eastern QDNB and eastern PRMB [12,16,18,19,20]. The Xisha Trough is even named the hyper-extended rift systems ahead of the ocean crust production by some scholars [21]. Notably, compared with the typical features of deep detachment fault systems in magma-poor margins, lower crustal HVLs with P-velocities > 7.0 km/s, which are usually observed beneath the volcanic margins, have also been widely identified beneath the eastern PRMB [14,22,23] (Figure 1). Moreover, recent studies based on multichannel seismic reflection indicate the presence of a 4–6-km-thick lower crustal HVL beneath the central part of the Xisha Trough [24,25]. Oddly, deep reflection seismic profiles also indicate that lower crustal HVLs are not present in the western PRMB, which differentiates the Xisha Trough and eastern PRMB with respect to their HVLs [5,26]. However, the other features of magma-poor or volcanic margins are not recognized in the northwestern SCS, such as the makeable features of seaward-dipping reflectors and serpentine peridotite [15,27]. Given this fact, it is a very hasty decision to define the northwestern SCS as magma-poor or simply a volcanic margin. Research on the west–east variation of the lithospheric extension along the northwestern SCS could also contribute the additional information to help understand the passive continental margin rifting process.
An increasing numbers of studies indicate that the lithospheric structures play a crucial role in controlling the process of passive margin rifting, especially according to initial continental rheological models [28,29,30]. The coupled and decoupled relationships between crust and mantle are often taken as the typical initial rheological models for the numerical modeling of passive margin rifting [15,31]. Notably, the decoupled crust–mantle model, which considers a ductile lower crust in the non-uniform extension process, presents the significant delays of breakup in the brittle upper crust and is usually featured by lower crustal HVLs and mantle underplating [15,31]. The amount of ductile behavior is the key factor in determining the lithospheric thinning process and the configuration of passive margins [16,32]. Therefore, it should be an effective method to explore the non-uniform extension occurring at the northwestern SCS by constructing rheological structures. In this paper, we establish the details of crustal-scale structure models from the comprehensive interpretation of multi-channel seismic reflection profiles, deep seismic reflection profiles, and surface heats flow from deep well drilling [25,33,34,35], which were used to model the thermo-rheological structures and evaluate the process of continental margin rifting in the northwestern SCS.
Figure 1. Tectonic map of the northwestern SCS, including the QDNB and eastern PRMB. The green solid lines (L1, L2, and L3) denote the locations of multi-channel seismic reflection profiles, which were used to examine the thermo-rheological structures [14,25,26]. The thermo-rheological structure along profile L1 has been constructed in the previous research [36]. The brown lines indicate the ocean bottom seismometer profiles of OBS1993, OBS1996, and OBS2006, which are from Qiu et al. [37], Yan et al. [18], and Ding et al. [12]. Yellow dotted lines and red dotted lines represent the distribution range of COTZ and HVLs in the lower crust, respectively [22,23]. Yellow stars of P1-P14 show the locations of calculated typical lithospheric rheological structures. BY, Baiyun Sag; BJ, Beijiao Sag; BD, Baodao Sag; CC, Changchang Sag; CS, Chaoshan Sag; EP, Enping Sag; HS, Heshan Sag; LW, Liwan Sag; LD, Ledong Sag; LS, Lingshui Sag; KP, Kaiping Sag; SD, Songdong Sag; SN, Songnan Sag; SHD, Shunde Sag; SX, Songxi Sag; XJ, Xijiang Sag; YB, Yabei Sag; YL, Yongle Sag; ZS, Zhusan Sag; YN, Yanan Sag; COTZ, Continent–ocean transition zone; HVL, High velocity layer; RRF, Red River Fault; PRMB, Pear River Mouth Basin; QDNB, Qiongdongnan Basin; YGHB, Yinggehai Basin; TCNB, Taixinan Basin; LLB, Lile Basin; ZJNB, Zhongjiannan Basin.
Jmse 11 00443 g001

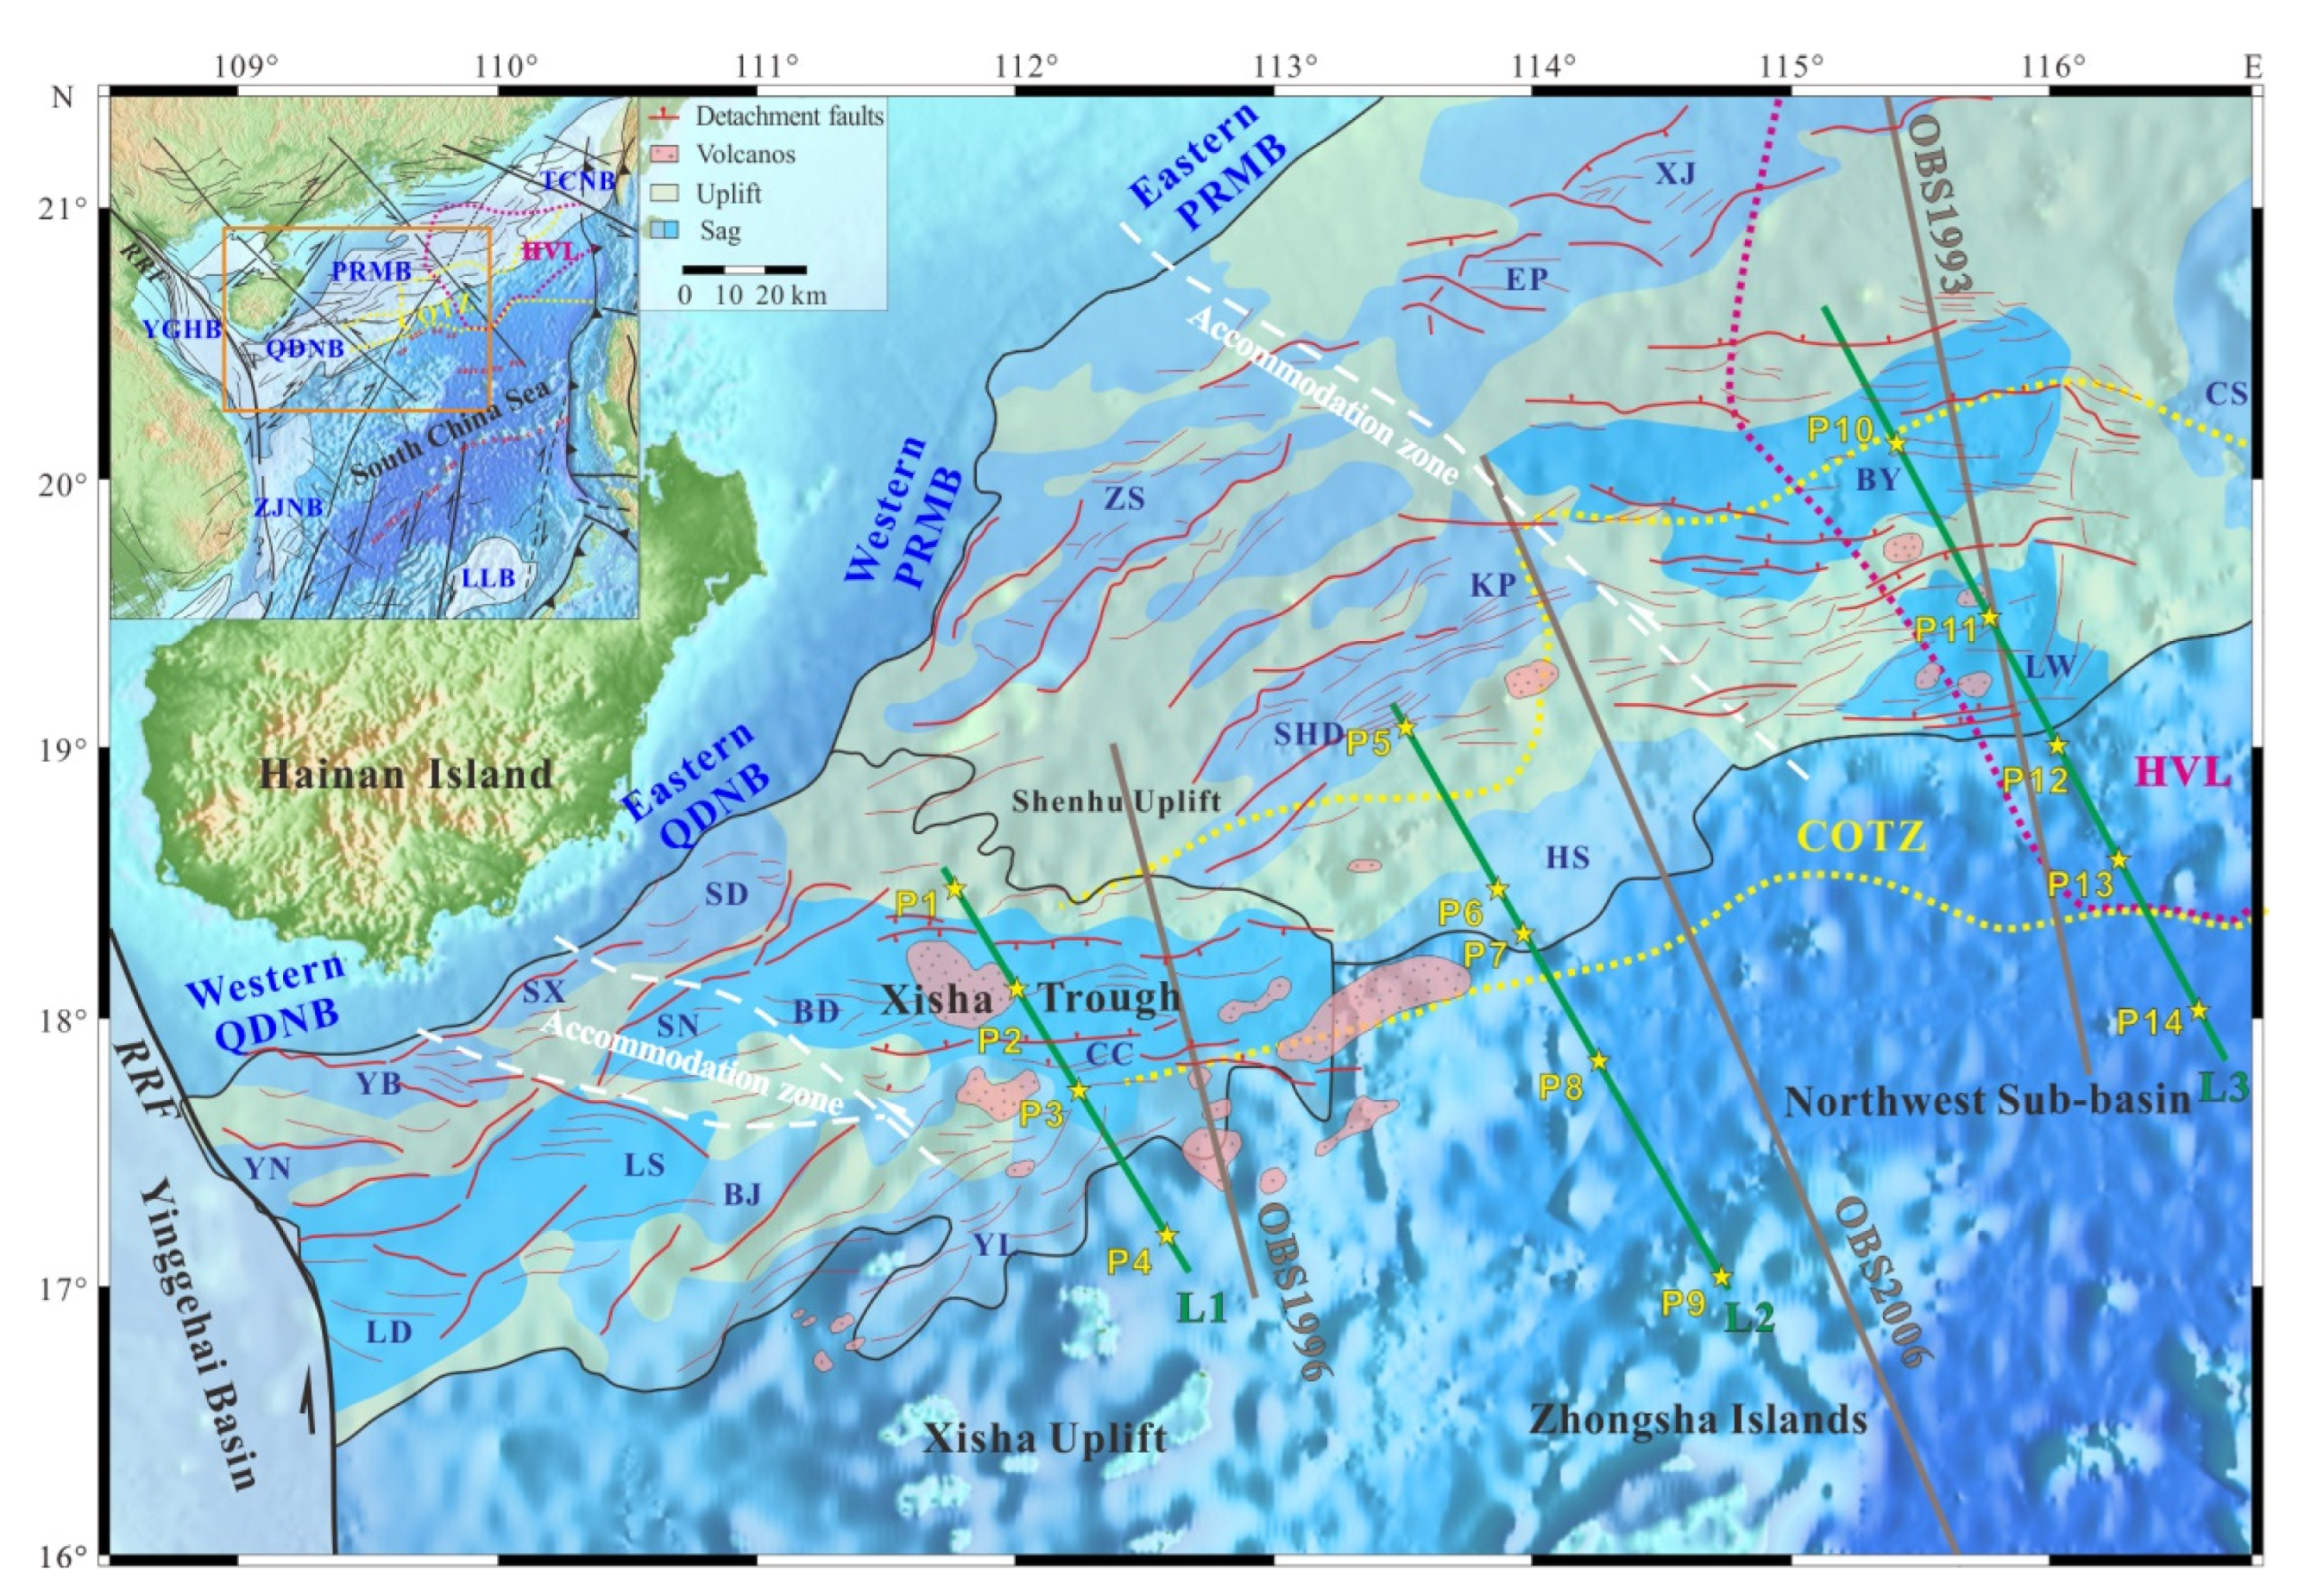
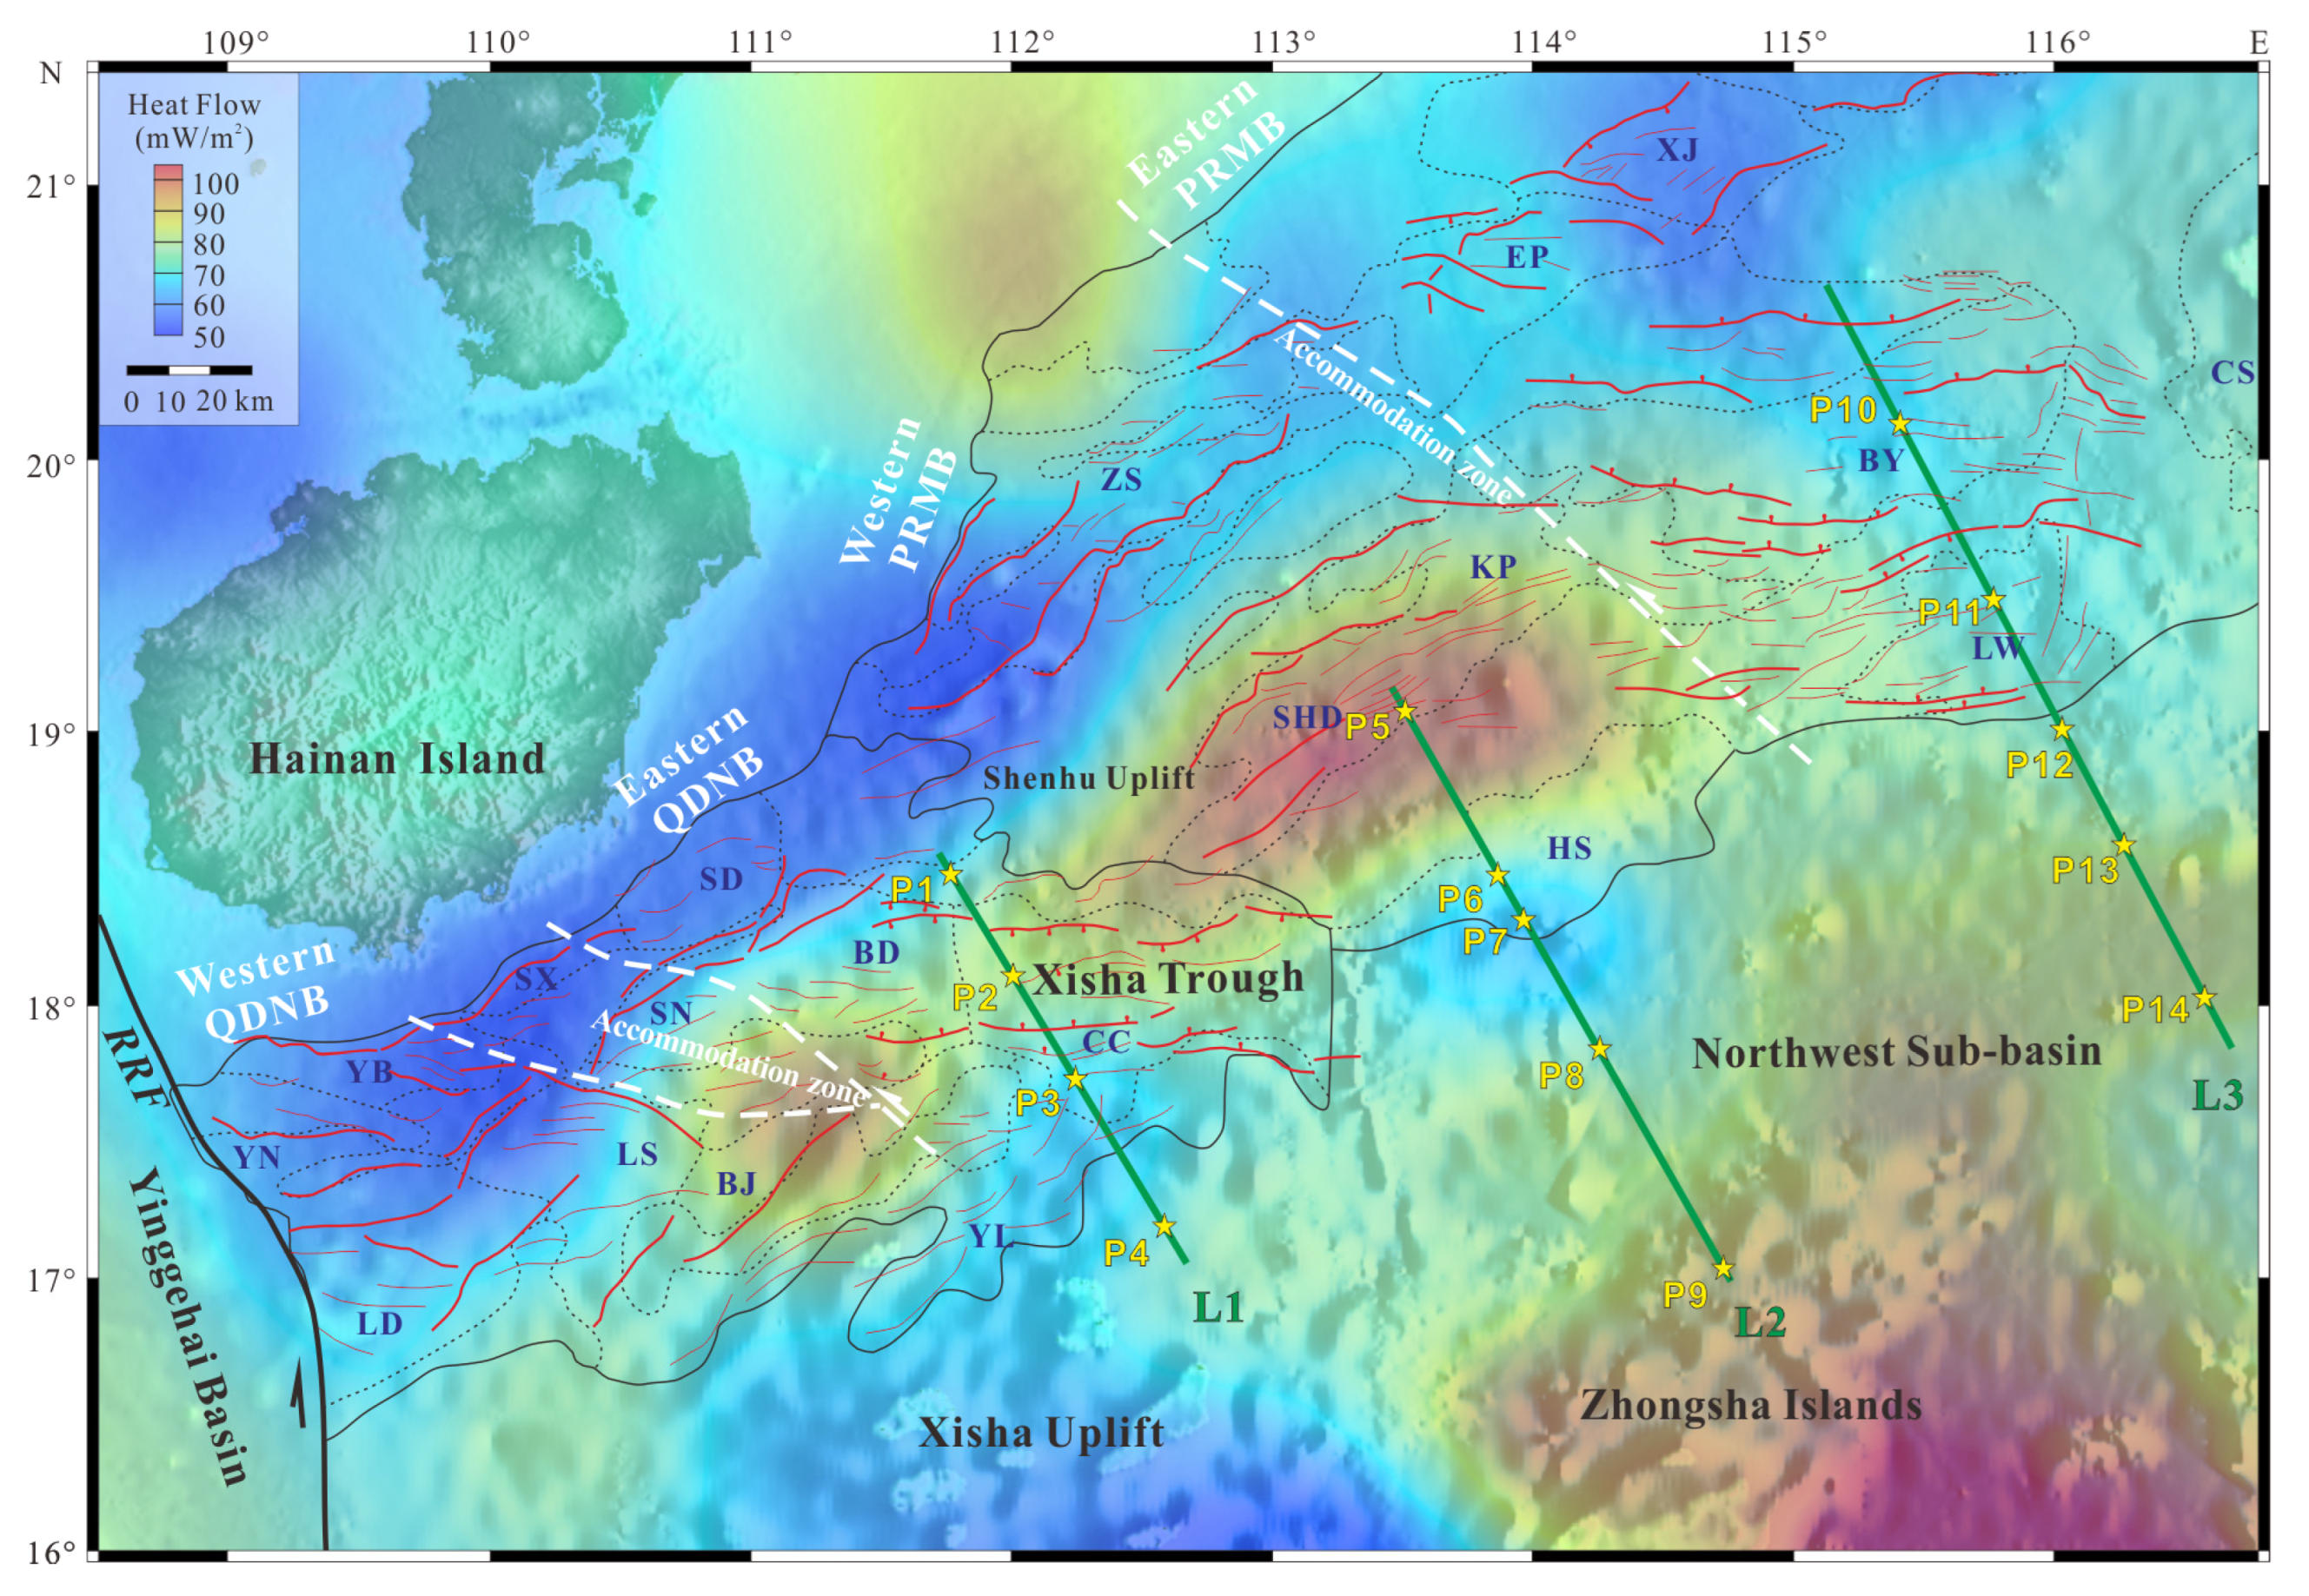
2. Geological Setting

As the typical passive margin of the SCS that is at least 400 km-wide, the northwestern margin, which is believed to be rich in oil and gas, is situated at the intersection of two tectonic boundaries: the subduction zone of the Manila Trench to the east and the strike-slip fault zone of Red River fault to the west [38,39,40,41,42] (Figure 1). Due to the stretching stress introduced by the slab pull of the paleo-SCS and the rollback of the paleo-Pacific plate, the regional stress field in the SCS changed from compression to extension, and the northwestern margin basins began to rift at the Late Cretaceous [4,22,41,42,43,44,45]. Although disagreements have always occurred, most scholars suggest that the seafloor spreading of the SCS occurred from ~32 to 15.5 Ma, including at least one ridge jump at approximately 23 Ma [42,46,47,48]. Owing to the westward seafloor spreading of SCS, the NW-trending accommodation faults in the QDNB and PRMB were activated, which divided these basins into categories: nearly WE-trending detachment faults to the east and NE-trending normal faults to the west [7,49]. In response to the ridge jump and the end of the seafloor spreading, the PRMB and QDNB successively entered the post-rift stage at 32 Ma and 23 Ma, respectively, and exhibited an eastward spatial temporal migration [4,41,42]. The tectonic activities of the western QDNB and PRMB are strongly weakened at 32–30 Ma, but the detachment faults of Baiyun Sag, Liwan Sag, and Xisha Trough located in the eastern PRMB and QDNB are still active until 23 Ma and 16 Ma [50,51,52]. Characterized by detachment faults developing at the crust–mantle boundary, the Xisha Tough, Baiyun Sag, and Liwan Sag in the northwestern SCS are usually regarded as typical failed rifting basins, with a hyperextended continental crust of <10 km [21,26,53,54]. However, only the Baiyun Sag and Liwan Sag are recognized as the scope of COTZ along the northwestern SCS [22,23] (Figure 1). Therefore, the west–east variation of the basin fault systems is an important indication of the margin rifting process along the northwestern SCS, revealing the spatial and temporal correlations with the seafloor spreading.
The lithospheric structures of the northwestern SCS have been studied in detail via multichannel seismic reflection profiles, deep seismic reflection profiles, gravity inversion, seismic tomography, and surface heat flow [5,12,14,18,25,26,55,56]. Numerous deep seismic reflection profiles revealed a decreasing trend in the crustal thickness southeastward from >26 km at the continental shelf to <10 km at the NSB, with 4–6-km Moho upheaval at the Xisha Trough, Baiyun Sag, and Liwan Sag [12,16,57,58]. In addition, widespread lower crustal 0.8–6-km-thick HVLs of >7.0 km/s can be identified beneath the northeastern SCS, including at the Baiyun Sag and Liwan Sag [18,22,59]. Unlike the HVLs observed beneath the Baiyun Sag and Liwan Sag, the entire portion of the lower crust beneath the central part of the Xisha Trough exhibits these high-velocity anomalies [24,25]. The lower crustal HVL beneath the central part of the Xisha Trough is recognized by the P-wave stack velocity calculated from multichannel seismic profiles, with much uncertainty [24,54]. HVLs are usually regarded as the effect of partial melting caused by an upwelling asthenosphere, as indicated by the mafic composition and high density of 2.92–2.97 g/cm3 [14,26,60]. However, the rheology of the HVLs has been identified as a weak ductile layer beneath the PRMB [61], but as a strong, brittle lower crustal layer beneath the Xisha Trough [62]. In addition, the extensive magmatism has been widely distributed in the most areas since 5.5 Ma, which still contributes about 10–25 mW/m2 to the present surface heat flow [63]. For the deeper mantle structures, the seismic tomography indicates a gigantic NW-trending low-velocity mantle zone along the Red River Fault, extending into the SCS, which may have driven continental lithospheric rifting and mantle exhumation [31,55,64]. A similar continuous low-velocity zone from the asthenosphere of Yangtze craton has also been observed beneath the northwestern SCS [55,65,66]. However, compared to the typical magma-robust type basins in the northeastern SCS, the Xisha Tough is usually identified as the magma-intermediate type basin due to the plate-interior rifting of northwestern SCS [46]. Therefore, thermo-rheological structures were constructed to provide better constraints for the non-uniform rifting process in northwestern SCS.

3. Data and Methods

3.1. Data

This dissertation is designed for constructing the lithospheric structures across the northwestern SCS. Data for inverting the lithospheric thermal-rheological structures are composed of the surface heat flow, multi-channel seismic reflection profiles, deep seismic reflection profiles, and density of gravity anomaly inversion.
A wealth of surface heat flow data in the northwestern SCS were obtained by previous studies through long-term observation of surface heat flow probes and analysis of oil-gas drilling data [33,34,57,67,68]. Based on 154 data values measured in the research area, a regional surface heat flow distribution map was constructed using interpolation at the grid accuracy of 0.5° × 0.5° (Figure 2). Bounded by the tectonic transition zone in the central PRMB, the surface heat flow in the research region was segmented into two anomalous areas. More precisely, the western anomaly area incorporates the QDNB and the western PRMB with the characteristic of linear distribution, whereas the eastern anomaly area consists of the eastern PRMB. The QDNB and western PRMB region exhibits uniform linear SW-trending surface heat flow anomalies, including a higher surface heat flow anomaly (70–110 mW/m2) in the southern part and a lower surface heat flow anomaly (50–60 mW/m2) in the northern part (Figure 2). Moreover, it is worth noting that an analogous narrow linear low surface heat flow anomaly (<70 mW/m2) is also found along the southern edge of the QDNB and is extended to the western PRMB. On the contrary, the surface heat flow of the eastern PRMB exhibits a gently seaward-increasing trend from a low surface heat flow (~70 mW/m2) at the continental shelf, to a high surface heat flow (~90 mW/m2) at the NSB. In addition to that, a low surface heat flow of <70 mW/m2 and a high surface heat flow (>90 mW/m2) can also be observed at the Xisha Uplift and Zhongsha Islands, respectively.
A variety of geophysical data such as multi-channel seismic profile and deep seismic profile in the research area are essential foundations for constructing the lithospheric structure model and determining the composition of various layers of the lithosphere. For the lithospheric structure model, the lithospheric structure, velocity, and composition across the QDNB and PRMB were constrained by the various seismic reflection profiles [12,14,18,25,26] (L1, L2 and L3 in Figure 1, Figure 2, Figure 3, Figure 4 and Figure S1). Particularly, the OBS profiles of OBS1993, OBS1996, and OBS2006 were used to effectively identify the HVLs and constrain the lower crustal thickness, which has often been poorly characterized in multichannel seismic reflection profiles [12,18,37] (Figure 1). Based on the constraints on standard velocity–density relationships for the initial crustal structure model, the density models were inversed along profiles L1, L2, and L3 using high-precision free-air gravity anomalies [14,24,25,26] (Figure 3, Figure 4 and Figure S1). A number of minor modifications were also made to the density models published by other scholars so that these profiles could be studied together, which exhibited a minor disturbance on the inversion of the thermo-rheological structures. Significant density anomalies of 2.92–2.97 g/cm3, related to lower crustal HVLs of >7.0 km/s, were observed beneath Baiyun Sag and Liwan Sag along profile L3 (Figure 4). The high density anomalies of 2.95 g/cm3 are also exhibited in the entire heavily thinned lower crust beneath the central Xisha Trough, which is probably related to the underplating of magma during margin rifting [69]. Notably, HVLs were not observed beneath the western PRMB along profile L2 (Figure 3). The results of inverting the thermo-rheological structure along profile L1 have been shown in a previous study [66] (Figure 7 and Figure S2).

3.2. Thermal Model

The lithospheric thermal structure refers primarily to the temperature distribution, which determines the heat obtained by the lithospheric structure from the mantle, the radiogenic heating, and heat conduction in the lithosphere as well as heat loss from the earth surface [70,71]. In this paper, the multi-channel seismic reflection profile and OBS profiles were first comprehensively explained. On this basis, the lithosphere was then chopped up into sedimentary formation layer, upper crustal layer, lower crustal layer, and upper mantle layer for invention of the lithospheric thermal structure as an initial model.
Heat transfer inside the lithosphere is principally in conformity with the law of heat conduction. Since parameters such as surface heat flow, thermal conductivity, and the heat production are given, lithospheric temperature and distribution of heat flow can be attained through solving the steady-state heat conduction equation. Then, the thermal structure of lithosphere can be determined. Moreover, according to the study conducted by Zhang et al. [72], under the 2D steady-state conditions, the temperature distribution inside the crust complies with the following governing formula:
x K T x + z K T z + A = 0
where z is the depth (km), K is the thermal conductivity (W/mK), A is the heat production (μW/m3), and T is the temperature (K). Further:
T x , z 0 = T 0 x T x x 0 , z = T x x 1 , z = 0 K ( x , z m ) T x x , z m = Q m x
where T0 is the average seabed temperature, being approximately 275.15 K, z 0 is the seabed depth, z m is the depth of the model bottom, which is set to 50 km as required, x 0 is the x-coordinate of the left boundary, x 1 is the x-coordinate of the right boundary, Q0 is the surface heat flow (mW/m2), and Qm is the heat flow value at the depth z m (mW/m2). Note that both the left and right boundaries are insulation conditions. If z m is equivalent to the Moho depth, Qm can be regarded as the heat flow from mantle. On this basis, the heat flow (Qc) from the crust can be calculated via Qc = Q0Qm. According to the 2D steady-state heat conduction equation mentioned previously, COMSOL Multiphysics 5.5 software was adopted to simulate two-dimensional finite elements. Constant trial calculations were performed on the bottom heat flow boundary Qm, so as to minimize the fitting error between the simulated and the observation surface heat flow Q0. Based on this, the deep temperature field distribution characteristics were obtained. Concretely, the root-mean-square errors of the surface heat flow values calculated by profile L1, L2, and L3 in simulation as well as the measured heat flow values were 3.18, 2.72, and 2.17, respectively, indicating that the calculation results are highly reliable (Figure 5a, Figure 6a and Figure S2a).
Significantly, basic thermophysical parameters such as heat production A and thermal conductivity K are in conformity with a variety of laws and affect the thermo-structure characteristics of lithosphere in the simulation of thermal structures of various layers [73]. In addition, regarding the huge sedimentary layers in the QDNB and PRMB, the thermal parameters K and A of the sediment layer can be obtained directly from the test on the drilling sample in the laboratory, since they have been vastly studied by other scholars [74,75]. For the deeper lithospheric thermal structure, the thermophysical parameters of A and K featuring remarkable inhomogeneity should be further deduced. By referring to the calculation methods of Shi et al. [62] and Tang et al. [35], thermal conductivity K, in general, adopts a temperature-dependent model with the relationship shown in Table 1 [62]. Conversely, the calculation of the heat production A is comparatively complicated. Normally, the heat production A of the upper crust takes advantage of the exponential model [76], namely:
A z = A 0 e z / D
where D is the characteristic thickness of the radioactive element enrichment (in km), in general, taking the upper crustal thickness [77]. However, considering the poor applicability of the exponential model, D is applied only for determining the heat generation rate within the top 10 km of the upper crust in the actual application. Hence, the layer is known as the UTK layer. Further, most of the heat production A of the lower crust and upper mantle are constants, which have been inferred from the established empirical relationship between heat production A and P-wave velocity in the laboratory as well as adopted by numerous researchers [35]. Related formulas have been shown in Table 1.

3.3. Rheological Structure

The lithosphere is characterized by rheological stratification. Specifically, the brittle deformation dominated in upper crust mainly releases strains by means of fracture, whereas the plastic deformation dominated in the lower crust mainly releases strain energy via plastic flow releases upon the increments in temperature and depth. Traditionally, the research on the lithospheric rheological structure suggests that two rheological mechanisms, including sliding friction and creep, can be observed in the lithosphere [78,79,80]. The rheological mechanism of sliding frictional obeys the Byerlee law [81]. Furthermore, the rheological strength of the lithosphere is independent of temperature and determined by the fault nature in the research area. Hence, the rheological strength of frictional sliding can be calculated by:
σ b r i t t l e = σ 1 σ 3 = α ρ g z 1 λ
Here, ρ is the average rock density, which is usually from the density structure inverted by gravity anomalies (kg/m3); σ1 and σ3 are the maximum and minimum principal stresses, respectively; g is the acceleration of gravity (m/s2); λ is the pore fluid factor (the ratio of pore fluid pressure to overburden pressure); and α is the fault type parameter, which is usually taken as 0.75, 1.2, and 3 for normal fault, strike-slip fault, and reverse fault, respectively. The parameter α is taken as 0.75 in this study, as the normal faults are dominant in the northwestern SCS. According to previous research experience, pore fluid factor λ and acceleration of gravity g and are 0.37 and 9.81, respectively [82].
As the temperature is on the rise, ductile deformation is dominated in the deep crust. It is characterized by the creep strength complying with the exponential creep law of rocks [83]:
σ c r e e p = σ 1 σ 3 = ( ε C ) 1 n e x p ( E n R T )
where T is the temperature; ε is the strain rate that should be determined by referring to the measured data; R is the gas constant, which is usually taken as 8.13447 J mol−1 K−1; and n, C, and E are laboratory parameters, which are not concerned with stress and temperature [82].
The computational formula proposed by Williams et al. [84] is adopted for obtaining the total lithospheric strength:
s = 0 l m i n σ b r i t t l e ,   σ c r e e p d z
where s is the total lithospheric strength with the thickness of l and unit width.
Generally speaking, the strain rate ε ranges from 10−17 to 10−12. Based on the GPS research data of previous studies in the northwestern SCS, the strain rate ε is taken as 10−16 [56,85]. In this study, the rheological parameters of rocks were determined cautiously considering the impact of HVLs on the lower crustal strength. As per the observations from large amounts of previous geophysical prospecting studies, the lower crust of the QDNB shows the characteristics of intermediate composition, whereas the lower crust of the PRMB has the features of mafic composition [62,63]. Due to the limited research on the exact material composition of HVLs, great uncertainty exists regarding the material properties used for the construction of rheology models. The material composition of lower crustal HVLs might be between intermediate granulite and mafic granulite. To carefully qualify the impact of HVLs on lower crustal strength, both intermediate granulite and mafic granulite were used here to define the rheological properties of the lower crust beneath the eastern PRMB along profile L3. Parameters for the inversion of the lithospheric rheological structure are presented in Table 2.

4. Results

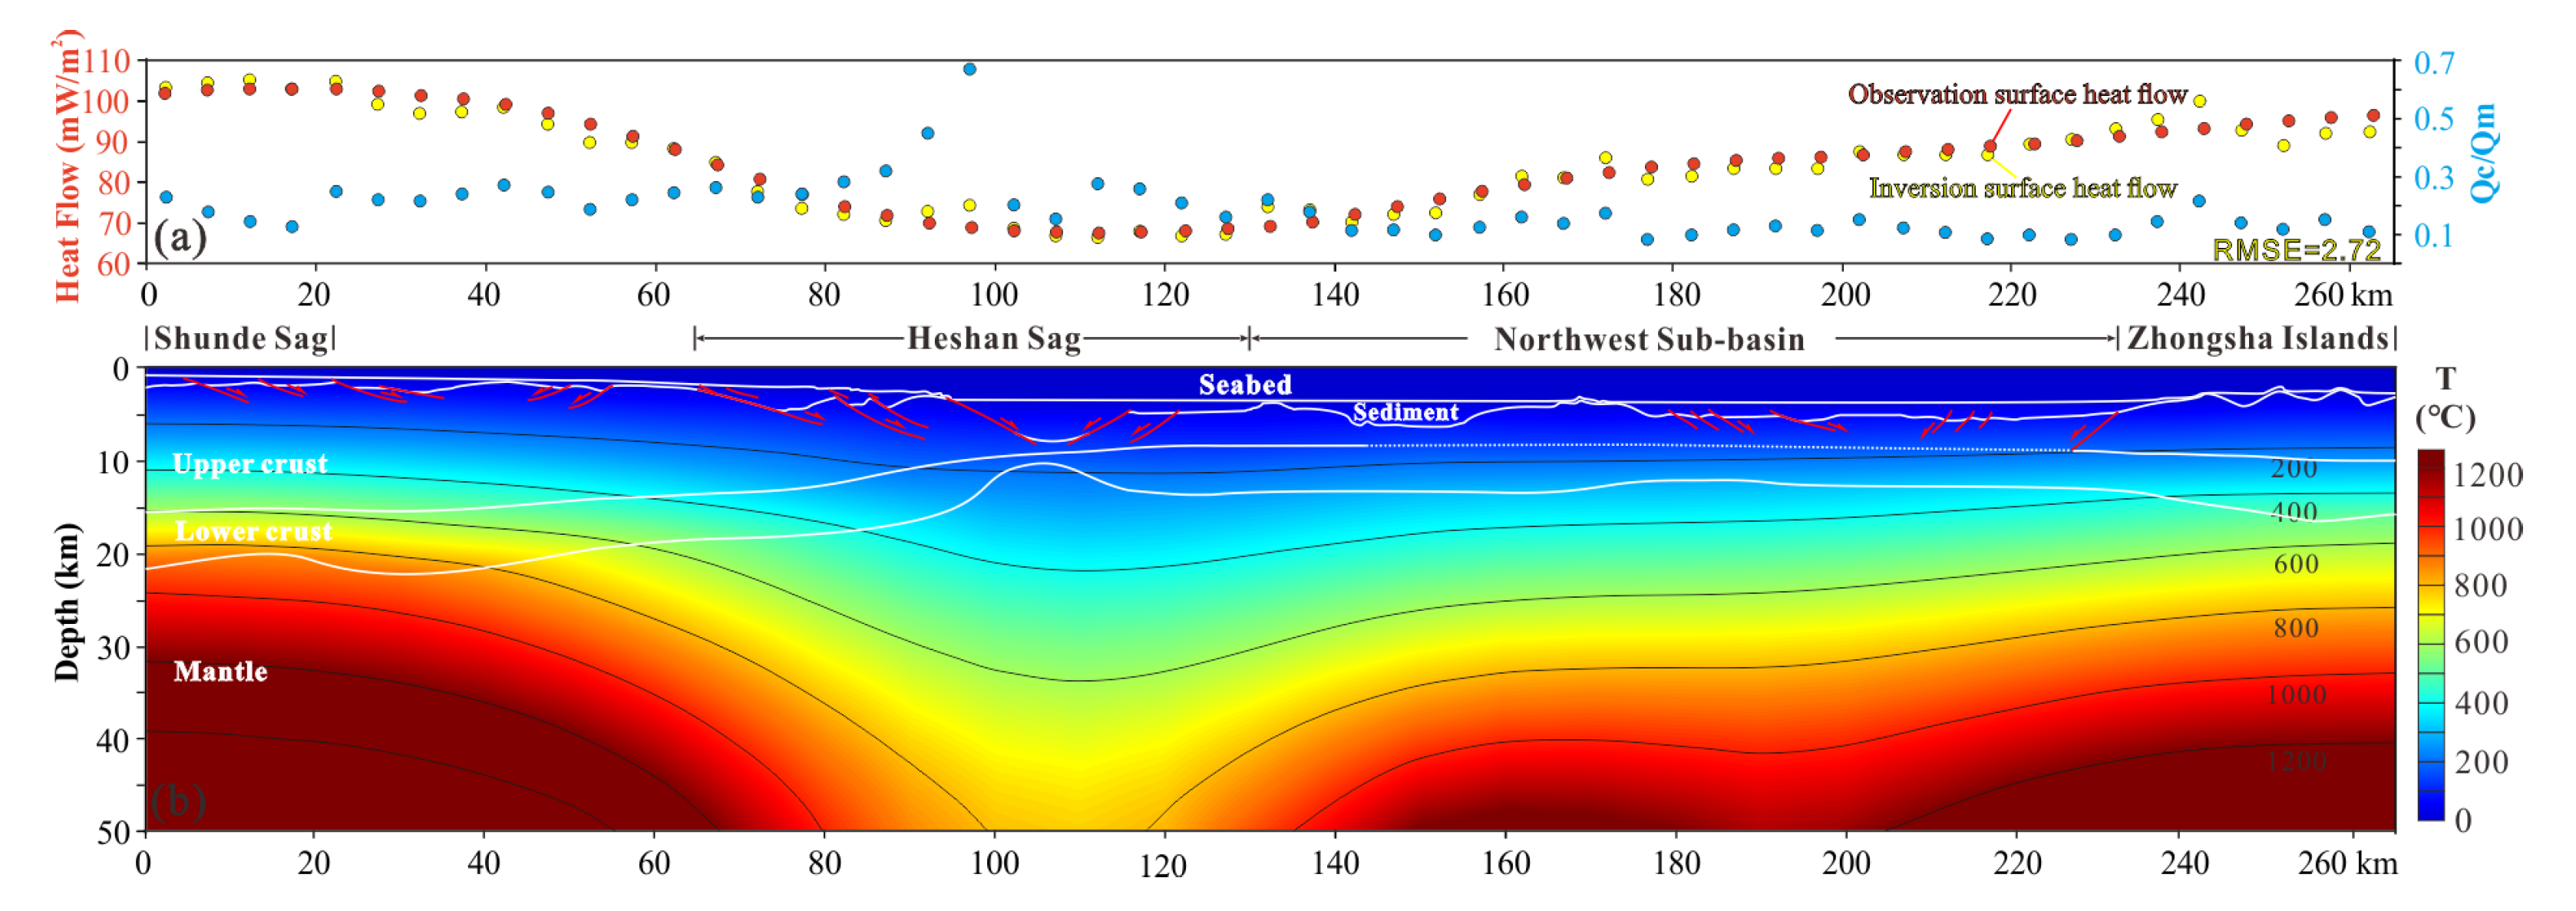
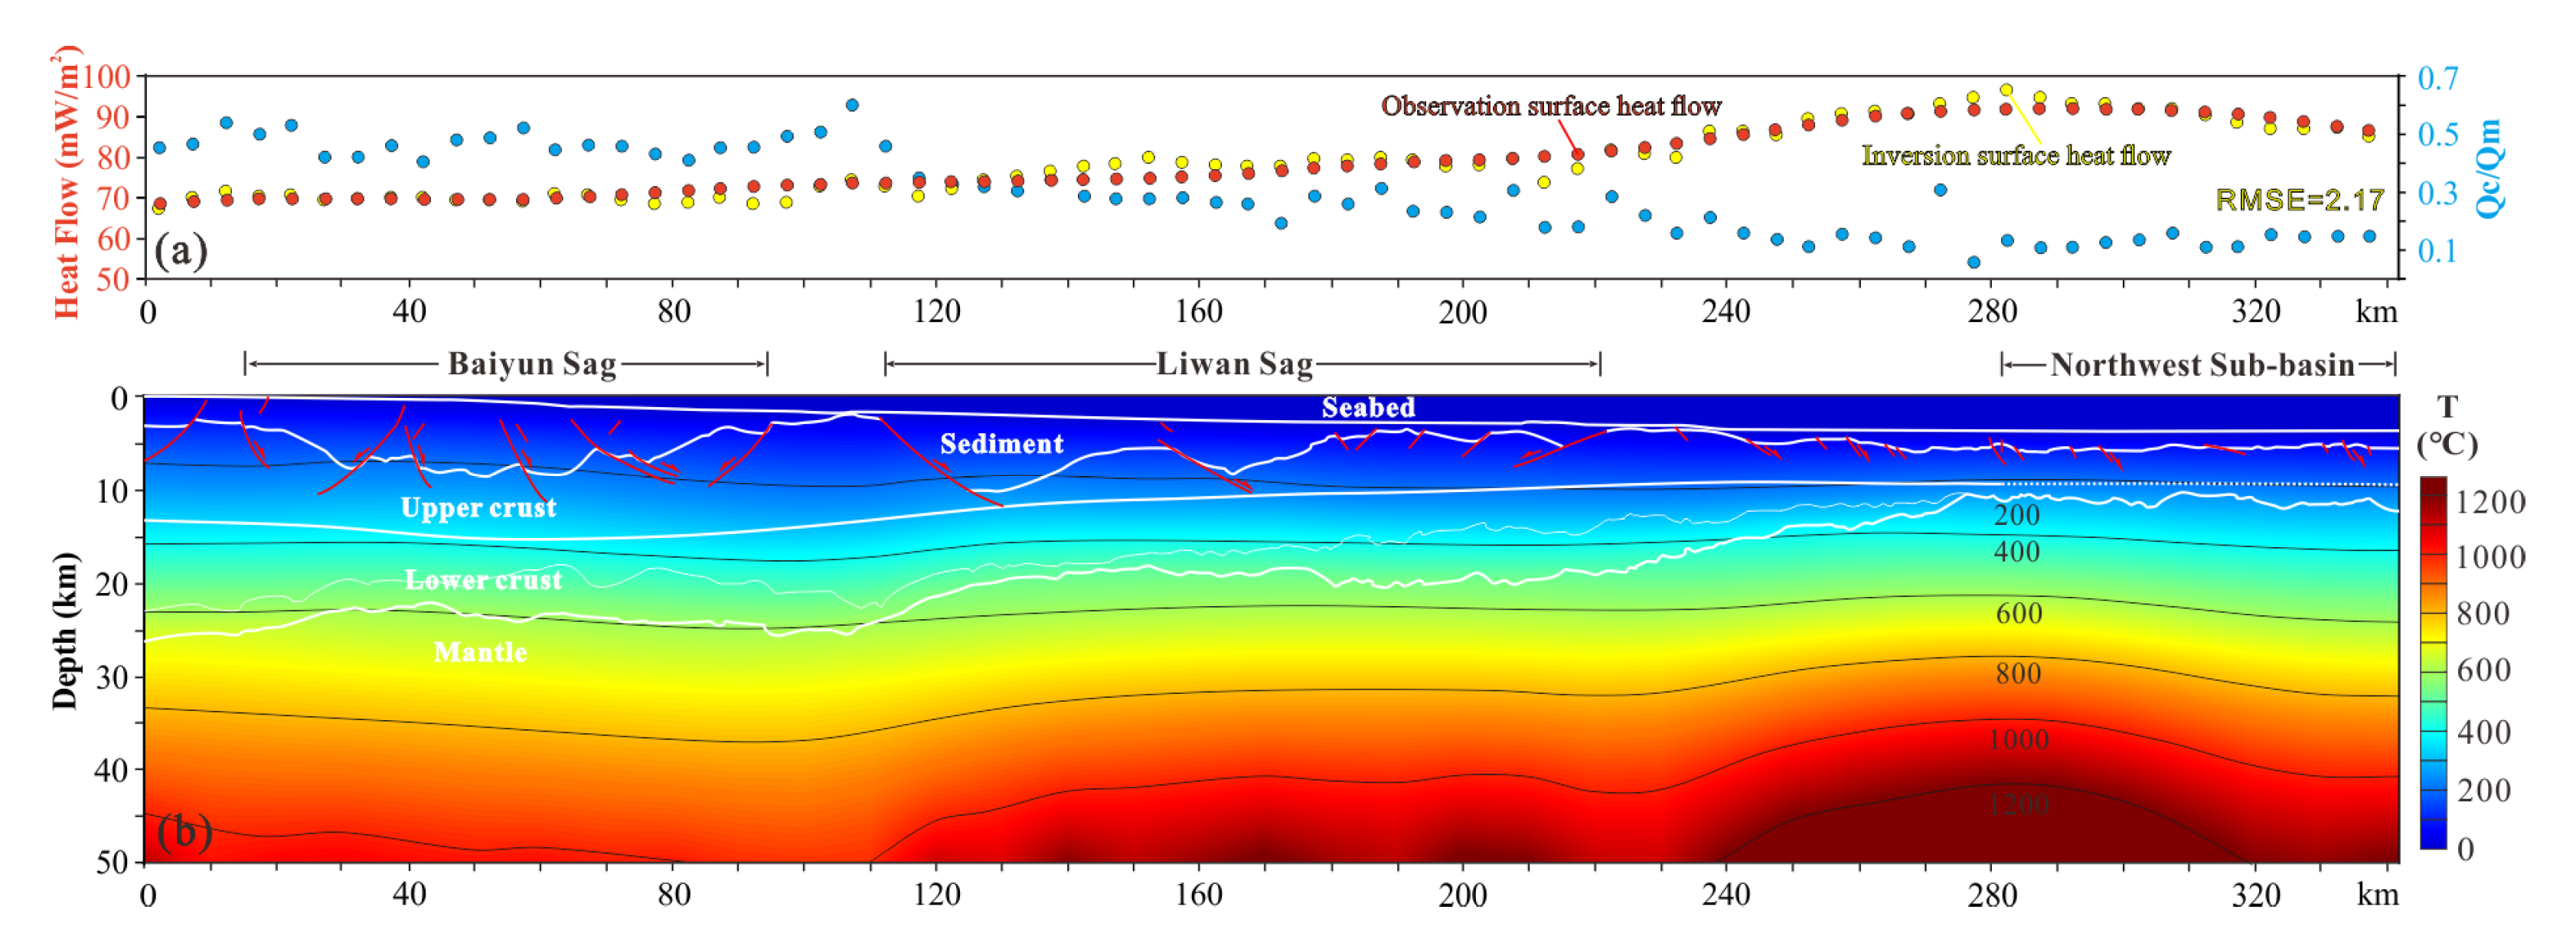
4.1. Temperature Distribution

According to the 2D steady-state heat conduction equation from Zhang et al. [72], the lithospheric temperature distribution was calculated along profiles L1–L3 (Figure 5, Figure 6 and Figure S2). The lithospheric temperature distribution along profile L1 has been given in our previous research results [36] (Supplementary Figure S2). The surface heat flow could be divided into two parts of crustal heat flow (Qc) and mantle heat flow (Qm). The ratio between crustal heat flow and mantle heat flow (Qc/Qm) is given in Figure 5a and Figure 6a to evaluate the contribution of heat flow from the crust and mantle, respectively.
Along profile L2, the lithospheric temperature distribution is significantly influenced by the surface heat flow (Figure 5). Similar to the changing trend of surface heat flow, the temperature distribution beneath the western PRMB, NSB, and Zhongdian Islands exhibits prominent lateral changes, with a sharp temperature gradient occurring at the southern part of Heshan Sag. Consistent with the maximum surface heat flow of ~100 mW/m2, the Moho temperature beneath the Shunde Sag in the southern PRMB exceeds 800 °C. In contrast, the Moho temperature beneath the southern part of the Heshan Sag is only ~400 °C, with a minimum surface heat flow of ~70 mW/m2. It is also noted that the oceanic lithosphere of NSB exhibits a slightly lower temperature anomaly than the continental lithosphere of the western PRMB but with a rather low Moho temperature of 200–400 °C due to the thin oceanic crust of approximately 10 km. The Zhongdian Islands exhibit similar characteristics with the Shunde Sag regarding lithospheric temperature distribution, with a slightly lower Moho temperature of approximately 500 °C. In addition, the value of Qc/Qm exhibited a changing trend obviously opposite that of surface heat flow, with all values being below 1 (0.10–0.70; Figure 5a). Significantly, the temperature distribution along profile L2 is almost entirely controlled by the mantle heat flow. The lower values of 0.10–0.30 in the NSB contrast with the higher values of 0.30–0.70 in the western PRMB. Similar to the maximum Qc/Qm of 0.6 present in the central Xisha Trough along profile L1, a maximum value of 0.7 was also observed at the southern part of Heshan Sag along profile L2 (Figure 5a). In addition, the lower surface heat flow at Heshan Sag and Xisha Trough appears to be a continuous or uniform anomaly, as is clearly shown in Figure 2. These features may indicate a genetic connection between the Heshan Sag and Xisha Trough.
Unlike the obvious lower temperature anomaly observed in the central part of profiles L1 and L2, the temperature distribution along profile L3 exhibits a lateral change from the eastern PRMB to NSB, with a gentle gradient of temperature (Figure 6). The oceanic lithosphere of NSB also exhibits a higher temperature anomaly than the continental lithosphere of the eastern PRMB, with a temperature of ~1000 °C at 40 km depth. According to the differences in measured crustal thickness between the eastern PRMB and NSB, the Moho temperature beneath the Baiyun Sag is ~600 °C, whereas it is only ~400 °C beneath the NSB. A gentle lateral change in the Qc/Qm value is also exhibited from higher values ranging from 0.50–0.70 in the continental lithosphere of the eastern PRMB to lower values ranging from 0.10–0.30 in the oceanic lithosphere of NSB, indicating that additional heat is received from the deep mantle (Figure 6a). These seaward variations in temperature are also observed by other studies conducted in the PRMB [61].

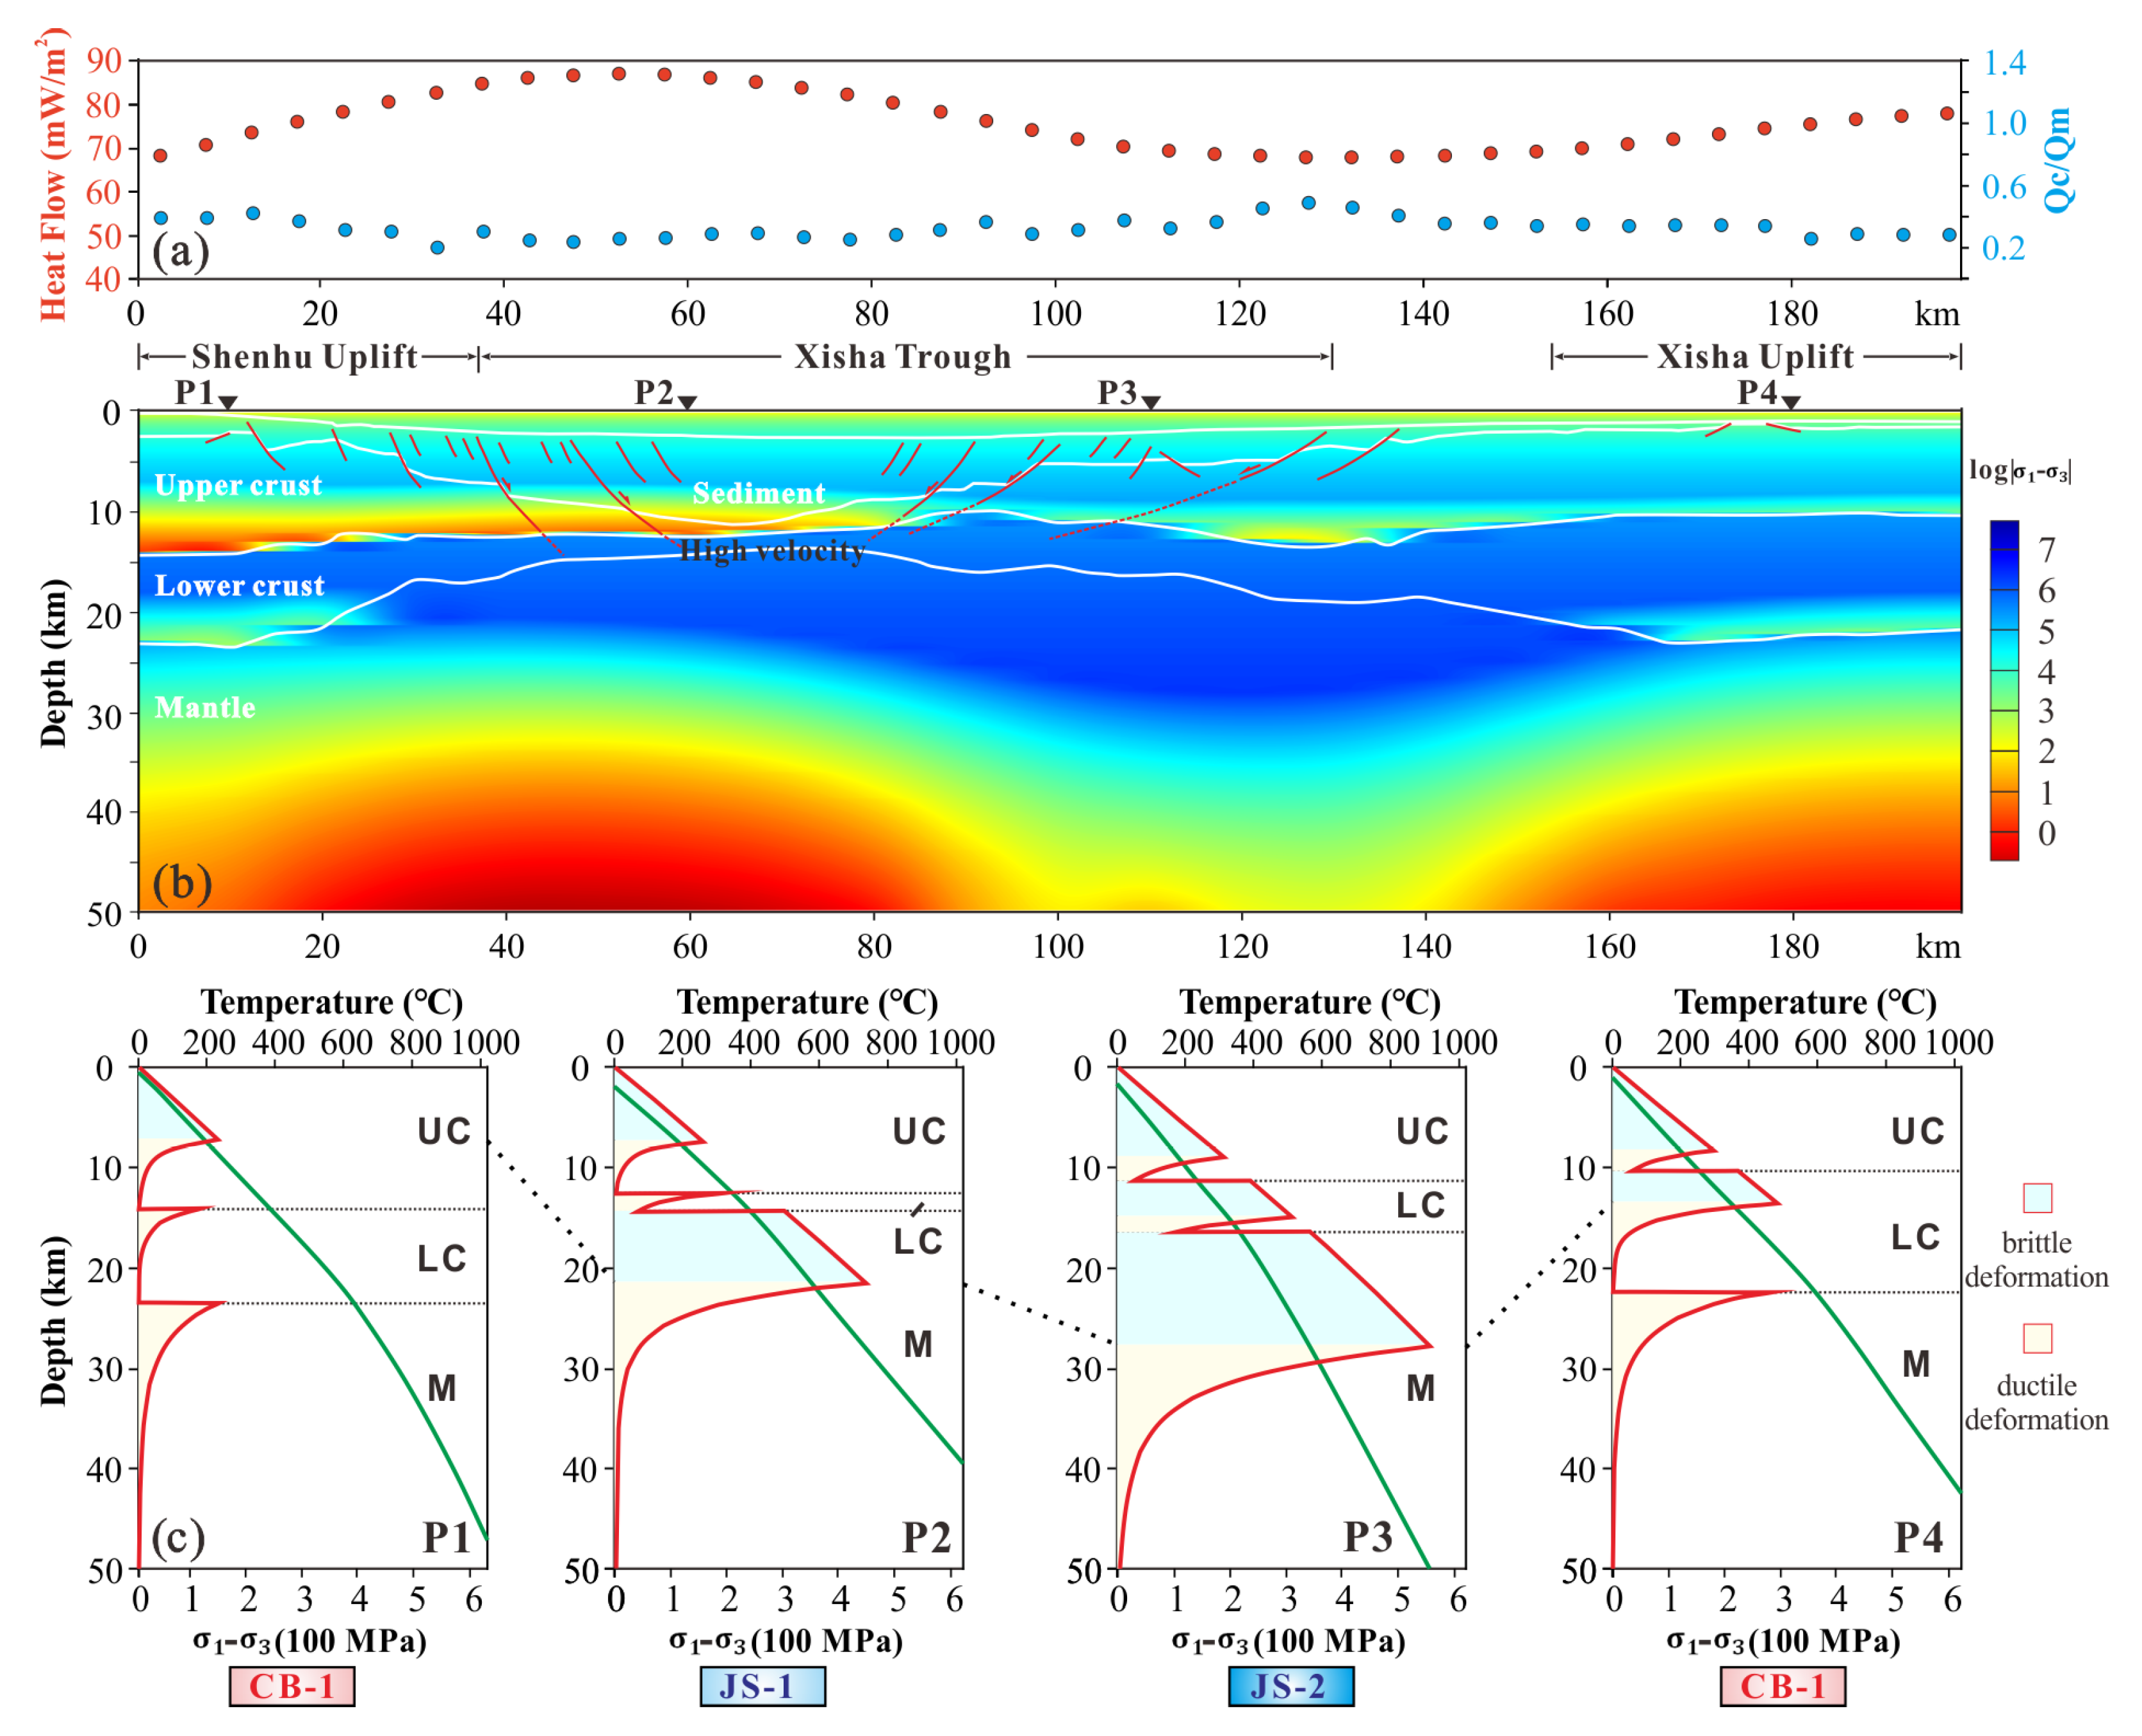
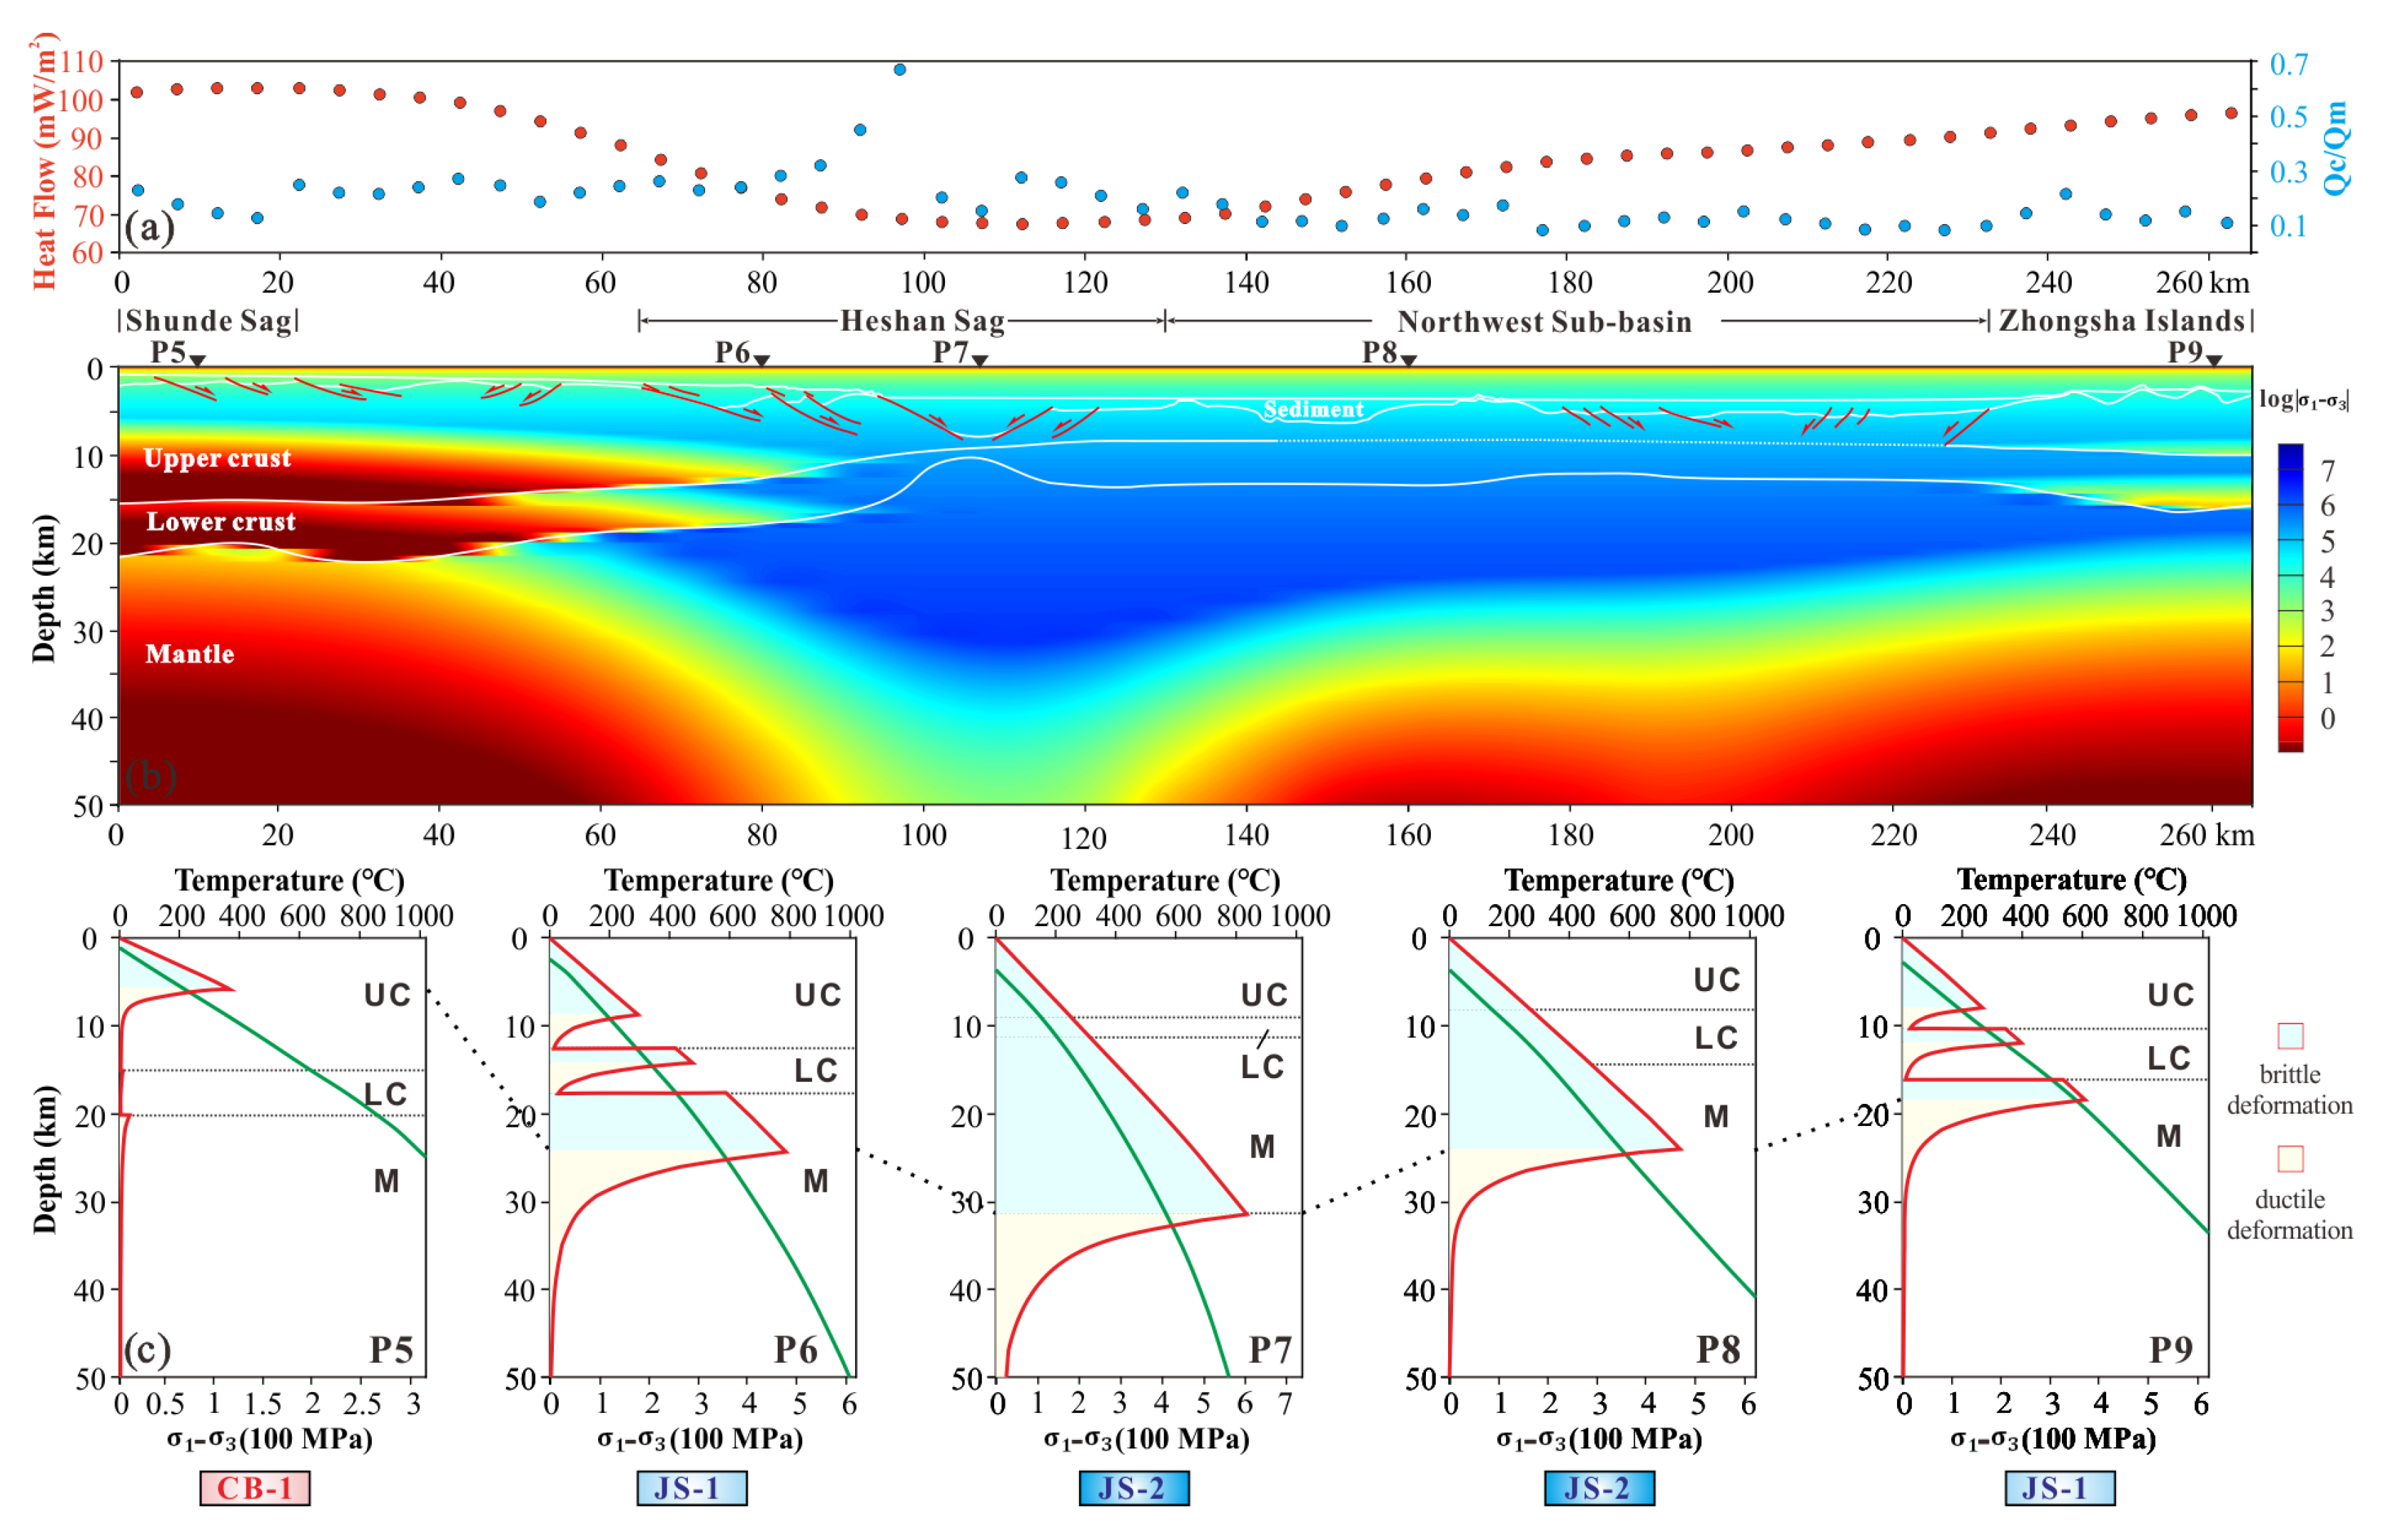
4.2. Rheological Structure

The estimated lithospheric rheological structures along profiles L1, L2, and L3 are shown in Figure 7, Figure 8 and Figure 9, respectively. The lithospheric rheological structure of profile L1 has been constructed in a previous study, and its features have been discussed in detail [36]. In simple terms, profile L1 is characterized by a very strong lithosphere with brittle deformation occurring throughout nearly the whole crust of the Xisha Trough, with a typical lower crustal HVL layer (P2 and P3 Figure 7). The Xisha Uplift and Shenhu Uplift show the characteristics of ductile deformation in the lower crust and upper mantle, with limited brittle deformation in the upper crust (P1 and P4 in Figure 7). In particular, the Xisha Trough exhibits similar characteristics to a cold and rigid oceanic lithosphere.
Figure 7. (a) The values of Qc/Qm and surface heat flow are represented by the blue points and red points, respectively. (b) The constructed lithospheric rheological structure of profile L1. (c) The thermo-rheological models estimated at the typical locations of P1−P4. Green and red lines denote the geothermal curve and yield stress envelope (YSE), respectively. The classical rheological models of JS−1, JS−2, and CB−1 were recognized along profile L1 by the light blue, dark blue, and pink rectangles, respectively. JS−1, jelly sandwich regime with weak lower crust; JS−2, jelly sandwich regime with relatively strong lower crust; CB-1, crème brûlée regime with weak lower crust. Qc, crustal heat flow; Qm, mantle heat flow; UC, upper crust; LC, lower crust; M, upper mantle.
Jmse 11 00443 g007
Similar lateral changing trends in rheological strength are also presented along profile L2, with a stiff lithosphere in its central part, including the southern part of the Heshan Sag and the NSB (Figure 8). The NSB exhibits the typical rigidity and coldness of the oceanic lithosphere, with only one brittle layer and peak strength exceeding 500 MPa at the depth of 25 km (P8 in Figure 8). Unlike the rigid oceanic lithosphere, the Shunde Sag in the eastern PRMB exhibits a relatively weak continental lithosphere, with ductile deformation distributed in the whole lower crust and upper mantle (P5 in Figure 8). Transitional rheological structure characteristics are present at the Heshan Sag and Zhongsha Islands, which can be divided into four load-bearing layers with a weak, ductile lower crustal layer sandwiched between two hard, brittle layers constituted by the upper crust and upper mantle (P6 and P9 in Figure 8). In particular, the southern part of the Heshan Sag begins to exhibit characteristics similar to the rigid oceanic lithosphere, which may indicate a heavily thinned continental crust between the normal continent crust and ocean crust (P7 in Figure 8).
An entirely different pattern of lateral changing trend in rheological structures is presented along profile L3 (Figure 9). Considering the widespread lower crustal HVLs, the lower crust of the eastern PRMB is usually taken to be closer to the rheology of mafic granulite, which exhibits a higher strength [63] (Table 2). As a comparative study, the results on intermediate and mafic granulite taken in the lower crust are presented together in Figure 9, indicated by red dotted lines and red solid lines, respectively. The small crustal strength range is constrained by these two assumptions regarding the lower crustal composition. The lithospheric rheological strength gradually increases from the continental lithosphere of the eastern PRMB to the oceanic lithosphere of NSB. Considering the uncertainty of the exact lower crustal composition influenced by the HVLs, the results of a lower crustal ductile layer beneath the eastern PRMB and a lower crustal brittle layer beneath the NSB are acceptable to investigate this. Combined with the constructed rheological structure along profiles L1 and L2, the existence of HVLs should increase the lower crustal strength, which differs slightly from the results obtained by Hu et al. [61].

5. Discussion

5.1. Differences in Thermo-Rheological Structure between QDNB and PRMB

The construction of the thermo-rheological structure is a practical and effective means to evaluate the lithospheric deformation model and geodynamic processes [36,79]. The characteristics of lithospheric structures are usually described by two end-member rheological regimes. One is the jelly sandwich regime (JS), which consists of a relatively strong, possibly brittle upper crust and upper mantle layers separated by a weak, possibly ductile lower crust layer [17,36,87]. The other is the crème brûlée regime (CB), which is characterized by the relatively strong crust and significantly weaker upper mantle, caused by the weakening by high temperature and water [17,78]. The CB and JS regimes can both be further divided into two sub-groups: CB-1 and JS-1, characterized by a weak lower crust, and CB-2 and JS-2, characterized by a stiff lower crust [36,79,80]. The JS-2 regime is characterized by only one load-bearing layer, which is also usually used to describe the rigid oceanic lithosphere, which is also called the Christmas tree regime [59,88].
Based on the calculated thermo-rheological structures along profiles L1, L2, and L3, CB-1, JB-1, and JB-2 rheological regimes were identified in this study (Figure 7, Figure 8, and Figure 9, respectively). Except for the impact of the surface heat flow, the rheological regimes appeared to be influenced mostly by the thickness of the crust, otherwise called the degree of continental crustal thinning [85] (Figure 10). Most locations with a lightly thinned continental crust of >20 km fall into the CB-1 regime, demonstrating a relatively weak lower crust and upper mantle and marked by a maximum Moho temperature of 600–800 °C (P1, P5 and P10 in Figure 7, Figure 8, Figure 9 and Figure 10). In addition to most sections of the continental shelf, the southern part of the QDNB is recognized as a CB-1 regime with a lightly thinned continental crust (P4 in Figure 7 and Figure 10). In contrast, a JS-2 regime is usually identified in areas with a heavily thinned continental crust or oceanic crust of <15 km and with only one stiff layer for the entire crust and topmost upper mantle (P3, P7, P8, P13, and P14 in Figure 7, Figure 8, Figure 9 and Figure 10). These locations are characterized as exhibiting a cold and rigid crust, with a minimum Moho temperature of only 200–400 °C. The Xisha Tough, Baiyun Sag, and Liwan Sag are usually regarded as failed rift basins with a heavily thinned crust of <10 km, though the JS-2 regime is only observed in the Xisha Trough, which may indicate different passive continental margin rifting stages. The southern part of the Heshan Sag also shows the similar strongly thinned crust with the Xisha Trough, and is marked by JS-2 regime. However, it is hard to recognize its tectonic setting, due to its location very closer to oceanic crust (P7 in Figure 10). Considering the thinnest crust of the central Baiyun Sag is not included in profile L3, further research is required to determine the rheological structures across the Baiyun Sag in more detail. According to the comparable crustal extension factors of the Baiyun Sag with the Xisha Trough [16], the central Baiyun Sag is predicted to fall into the JS-2 regime (M2 in Figure 10).
In addition, a typical JS-1 regime includes characteristics reflecting the transition from a warm and weak continental crust to a cold and strong oceanic crust, with a weaker lower crust and a stronger uppermost mantle (P2, P6, P11, and P12 in Figure 7, Figure 8, Figure 9 and Figure 10). At the COTZ, there appears to be an obvious change in rheological structure from a CB-1 regime to a JB-2 regime (Yellow lines in Figure 10). However, the lithospheric rheological structure of the Xisha Trough is closer to an oceanic lithosphere, which is very unlikely to be the westward extending part of the COTZ in the PRMB. For the west–east change, the temperature distribution of profile L2 is closer to that of profile L1, but its rheological regimes are closer to those of profile L3.

5.2. Variation of Rifting Stage in the Northwestern SCS

Thermomechanical numerical experiments processed in previous researches highlight thermo-rheological structures as critical parameters controlling in the rifting process of the passive margin [30,32,36,46,90]. Varying initial amounts of ductile crust also result in different widths and shapes [32]. Considering an initial continental lithosphere model with little thermal disturbance and tectonic reworking, the location of M1 at the northern QDNB margin with a slightly thinner crust > 25 km, a lower surface heat flow of 50–60 mW/m2, and a lower whole crustal extension factor of 1.0–1.20 is estimated as being closer to the initial continental crust with little rifting [16,25,74]. The rheological structure at M1 falls into the category of a JS-1 regime with a lower crustal viscous layer, as has been previously reported [36] (M1 in Figure 10). This initial rheological model of a JS-1 regime is also supported by research performed by Gao et al. [26] and Zhang et al. [16]. Due to the decoupled crust–mantle relationship caused by the weak lower crust, the continental margin lithosphere rifting follows a non-uniform extension model, resulting in the breakup of the upper crust after that of the mantle lithosphere [31].
In the early stage of rifting, the upwelled hot asthenosphere caused early stretching occurs in a wide region, with low-grade necking of the continental crust, with the mantle lithosphere beginning to break up before the crust. The locations of P1, P5, and P10 at the continental shelf remained the same at this stage, representing a CB-1 regime with a relatively weak lower crust and upper mantle. Notably, the location of P10 at the margin of the Baiyun Sag remained the same in this stage, with only a slightly thinner crust.
In the middle stage, considering the decoupled relationship between the brittle upper crust and ductile lower crust, most of the continental crustal extension occurs in the lower crust, which is heavily thinned and modified by the mantle underplating (Figure 10). If the continental crustal rifting stops at this stage, the lower crustal rheology will become a brittle deformation with detachment faults developing in the lower crust due to the cooling in the post-rift stage. As a typical failed rifting basin, the Xisha Trough is currently in this stage and falls into a JS-2 regime with an only 4–6-km-thick lower crust, featured by high-velocity anomalies (P3 in Figure 10). The extreme crustal thinning in the Xisha Trough ahead of a propagating ocean is also recognized by Lei and Ren [21]. In particular, the southern part of Heshan Sag also falls into the category of a JS-2 regime, and it may also be in this stage and exhibit features similar to those of the Xisha Trough (P7 in Figure 10).
In the late stage, with the breakup of the brittle upper crust, the hot asthenosphere cools to form the new oceanic crust, which falls into the category of a JS-2 regime with only one brittle load layer (P8, P13, and P14 in Figure 8, Figure 9 and Figure 10). In this stage, the mantle lateral flow will facilitate the mantle underplating at the bottom of the lower crust, which typically results in lower crustal HVLs [31] (Figure 10). The HVLs are widely distributed beneath the eastern PRMB. According to previous research, a variety of causes may induce mantle lateral flow, such as the crustal Red River Fault related to the mantle low-velocity zone [36,55], the similar low-velocity zone originating from the Yangtze craton [66], the destructive tectonic movement of Cathaysian continental marginal orogenic belt [91], and the mantle upwelling due to the Pacific Plate subduction [3]. However, the absence of HVLs discovered along profile L2 may suggest the low level of mantle lateral flow in this area.
In conclusion, the east–west variation of the thermo-rheological structure along the northwestern margin of the SCS indicates different stages of continental margin extension. The lower crustal HVLs beneath the Xisha Trough and the eastern PRMB formed in the early stage and last stage continental margin rifting, respectively. The absence of HVLs in the western PRMB may indicate the limited impact of mantle lateral flow.

6. Conclusions

(1)
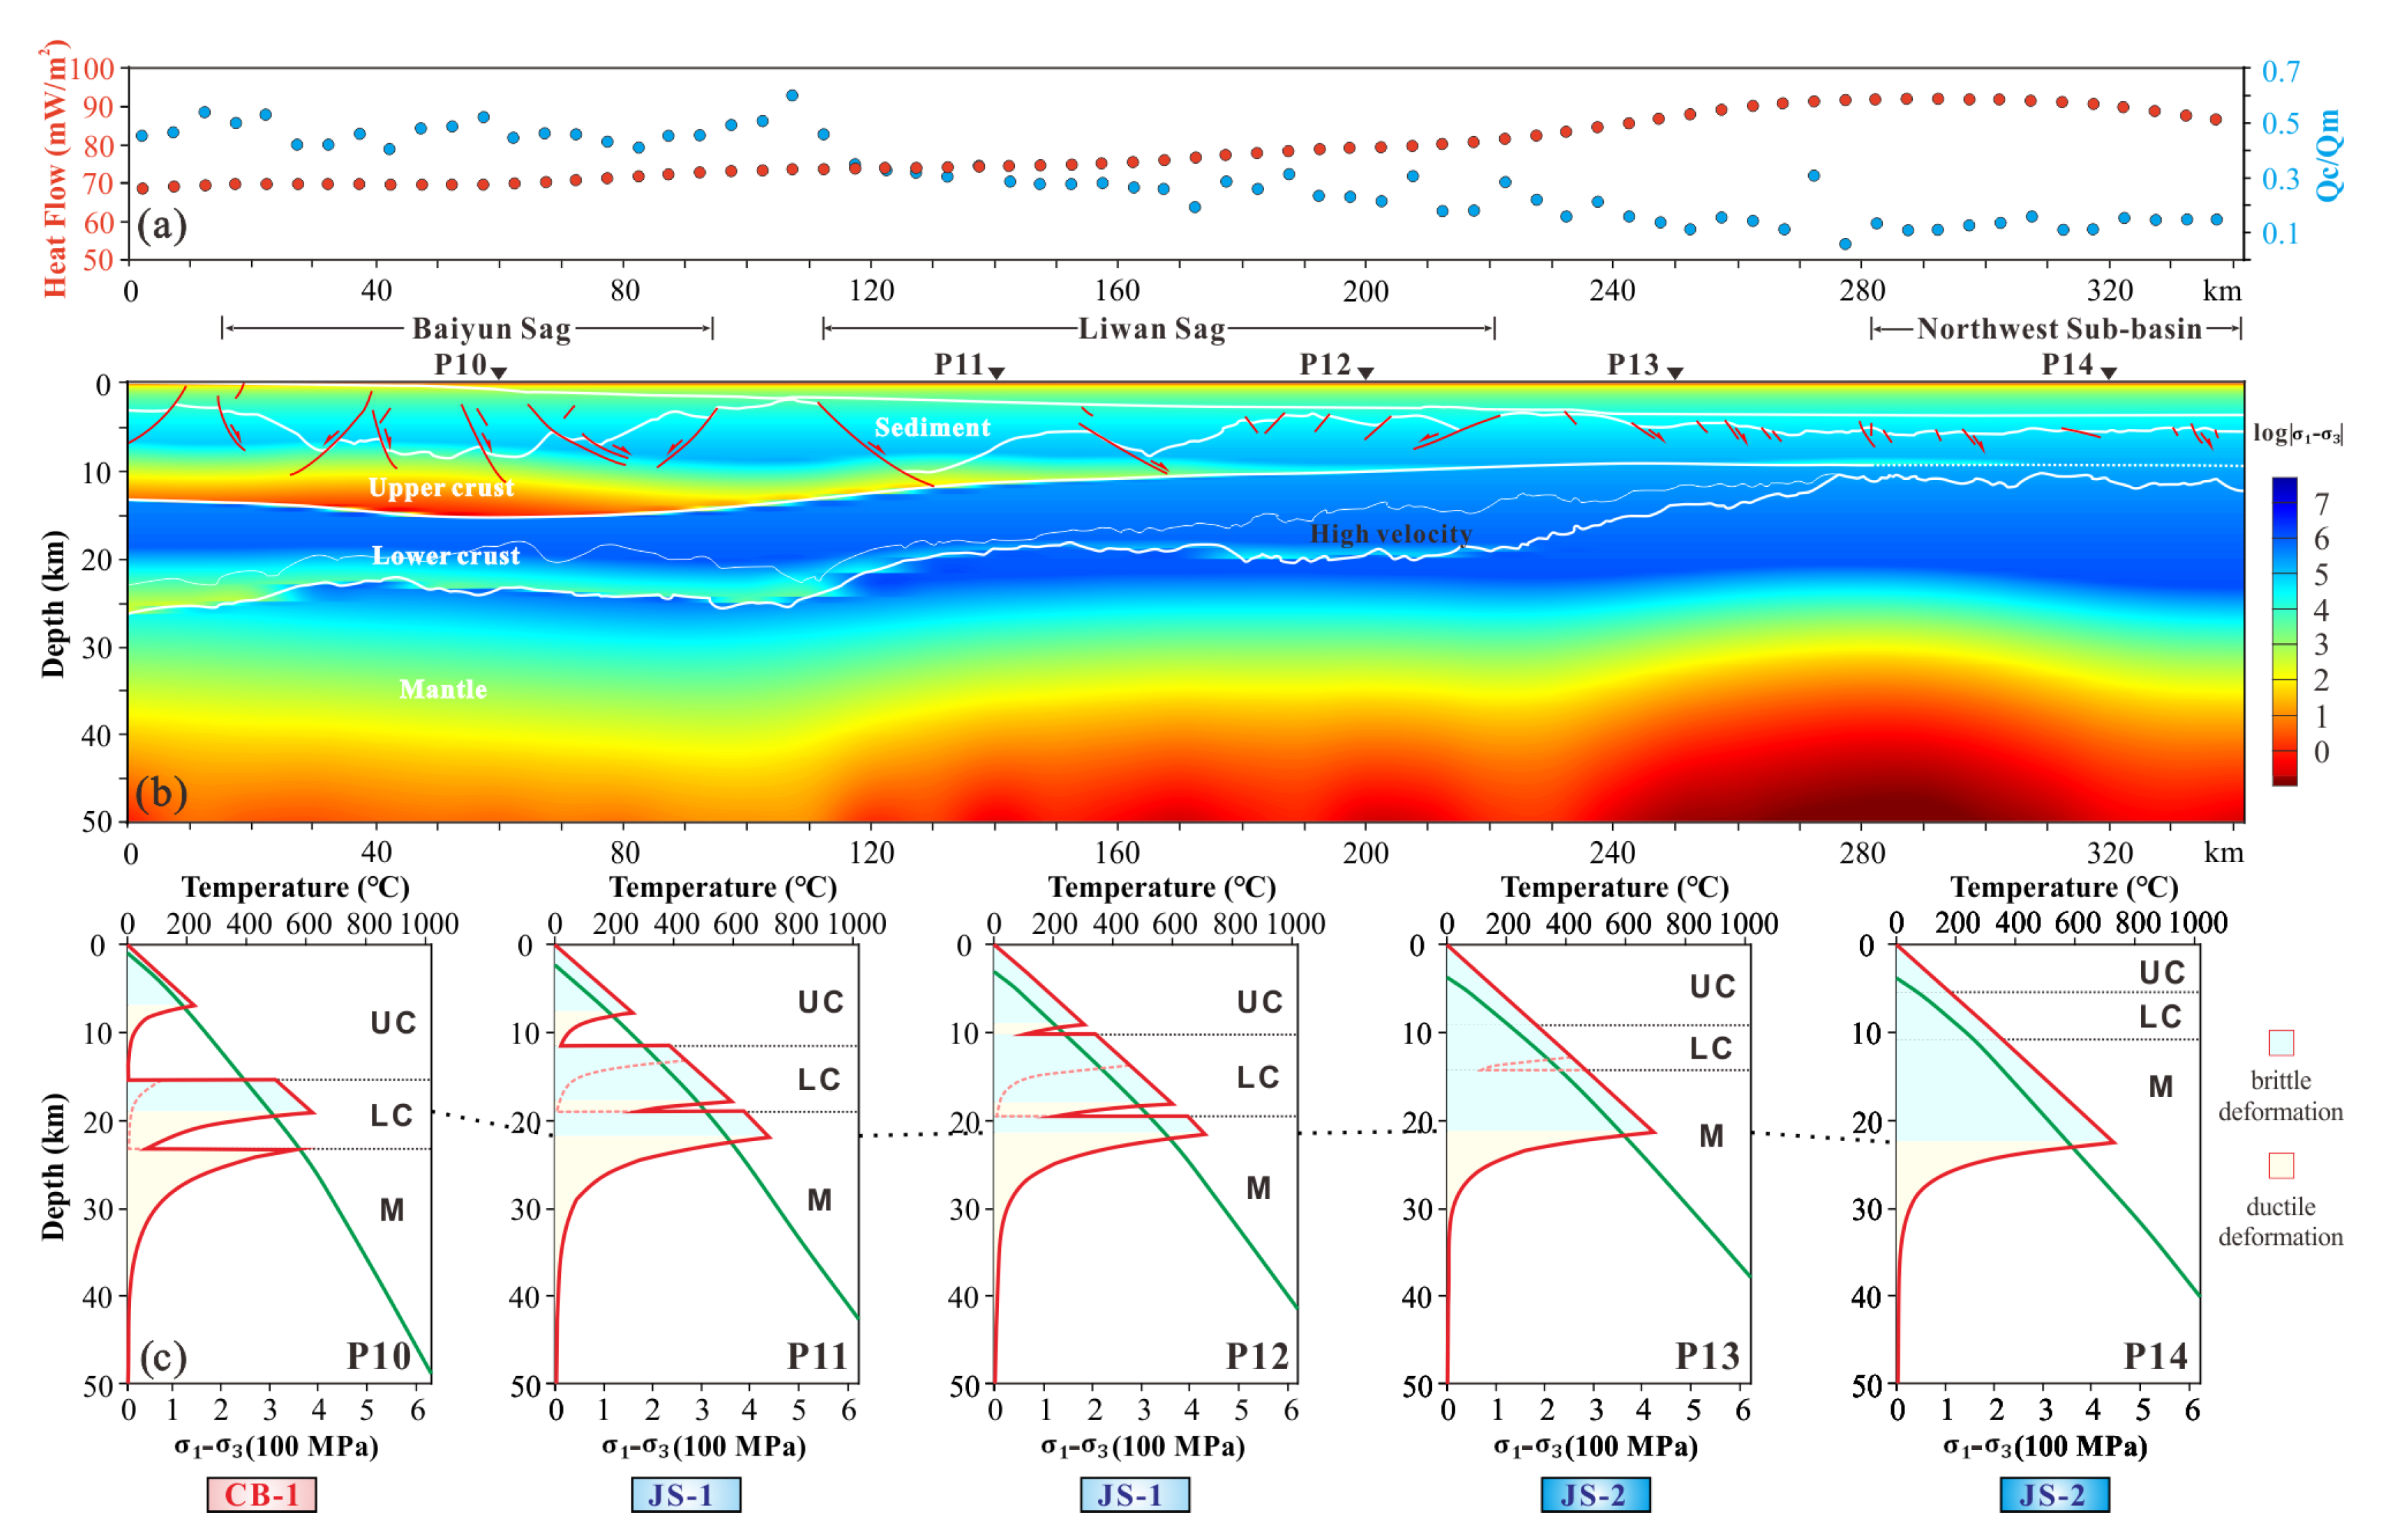
The east–west variation of thermo-rheological structures has been presented along the northwestern SCS. The PRMB exhibits a seaward-increasing trend in lithospheric rheological strength, from the CB-1 regime at the continental shelf to the JS-2 regime at the NSB. The central Xisha Trough falls is a JS-2 regime caused by the cooling of the heavily thinned lower crust in the middle continental margin rifting stage.
(2)
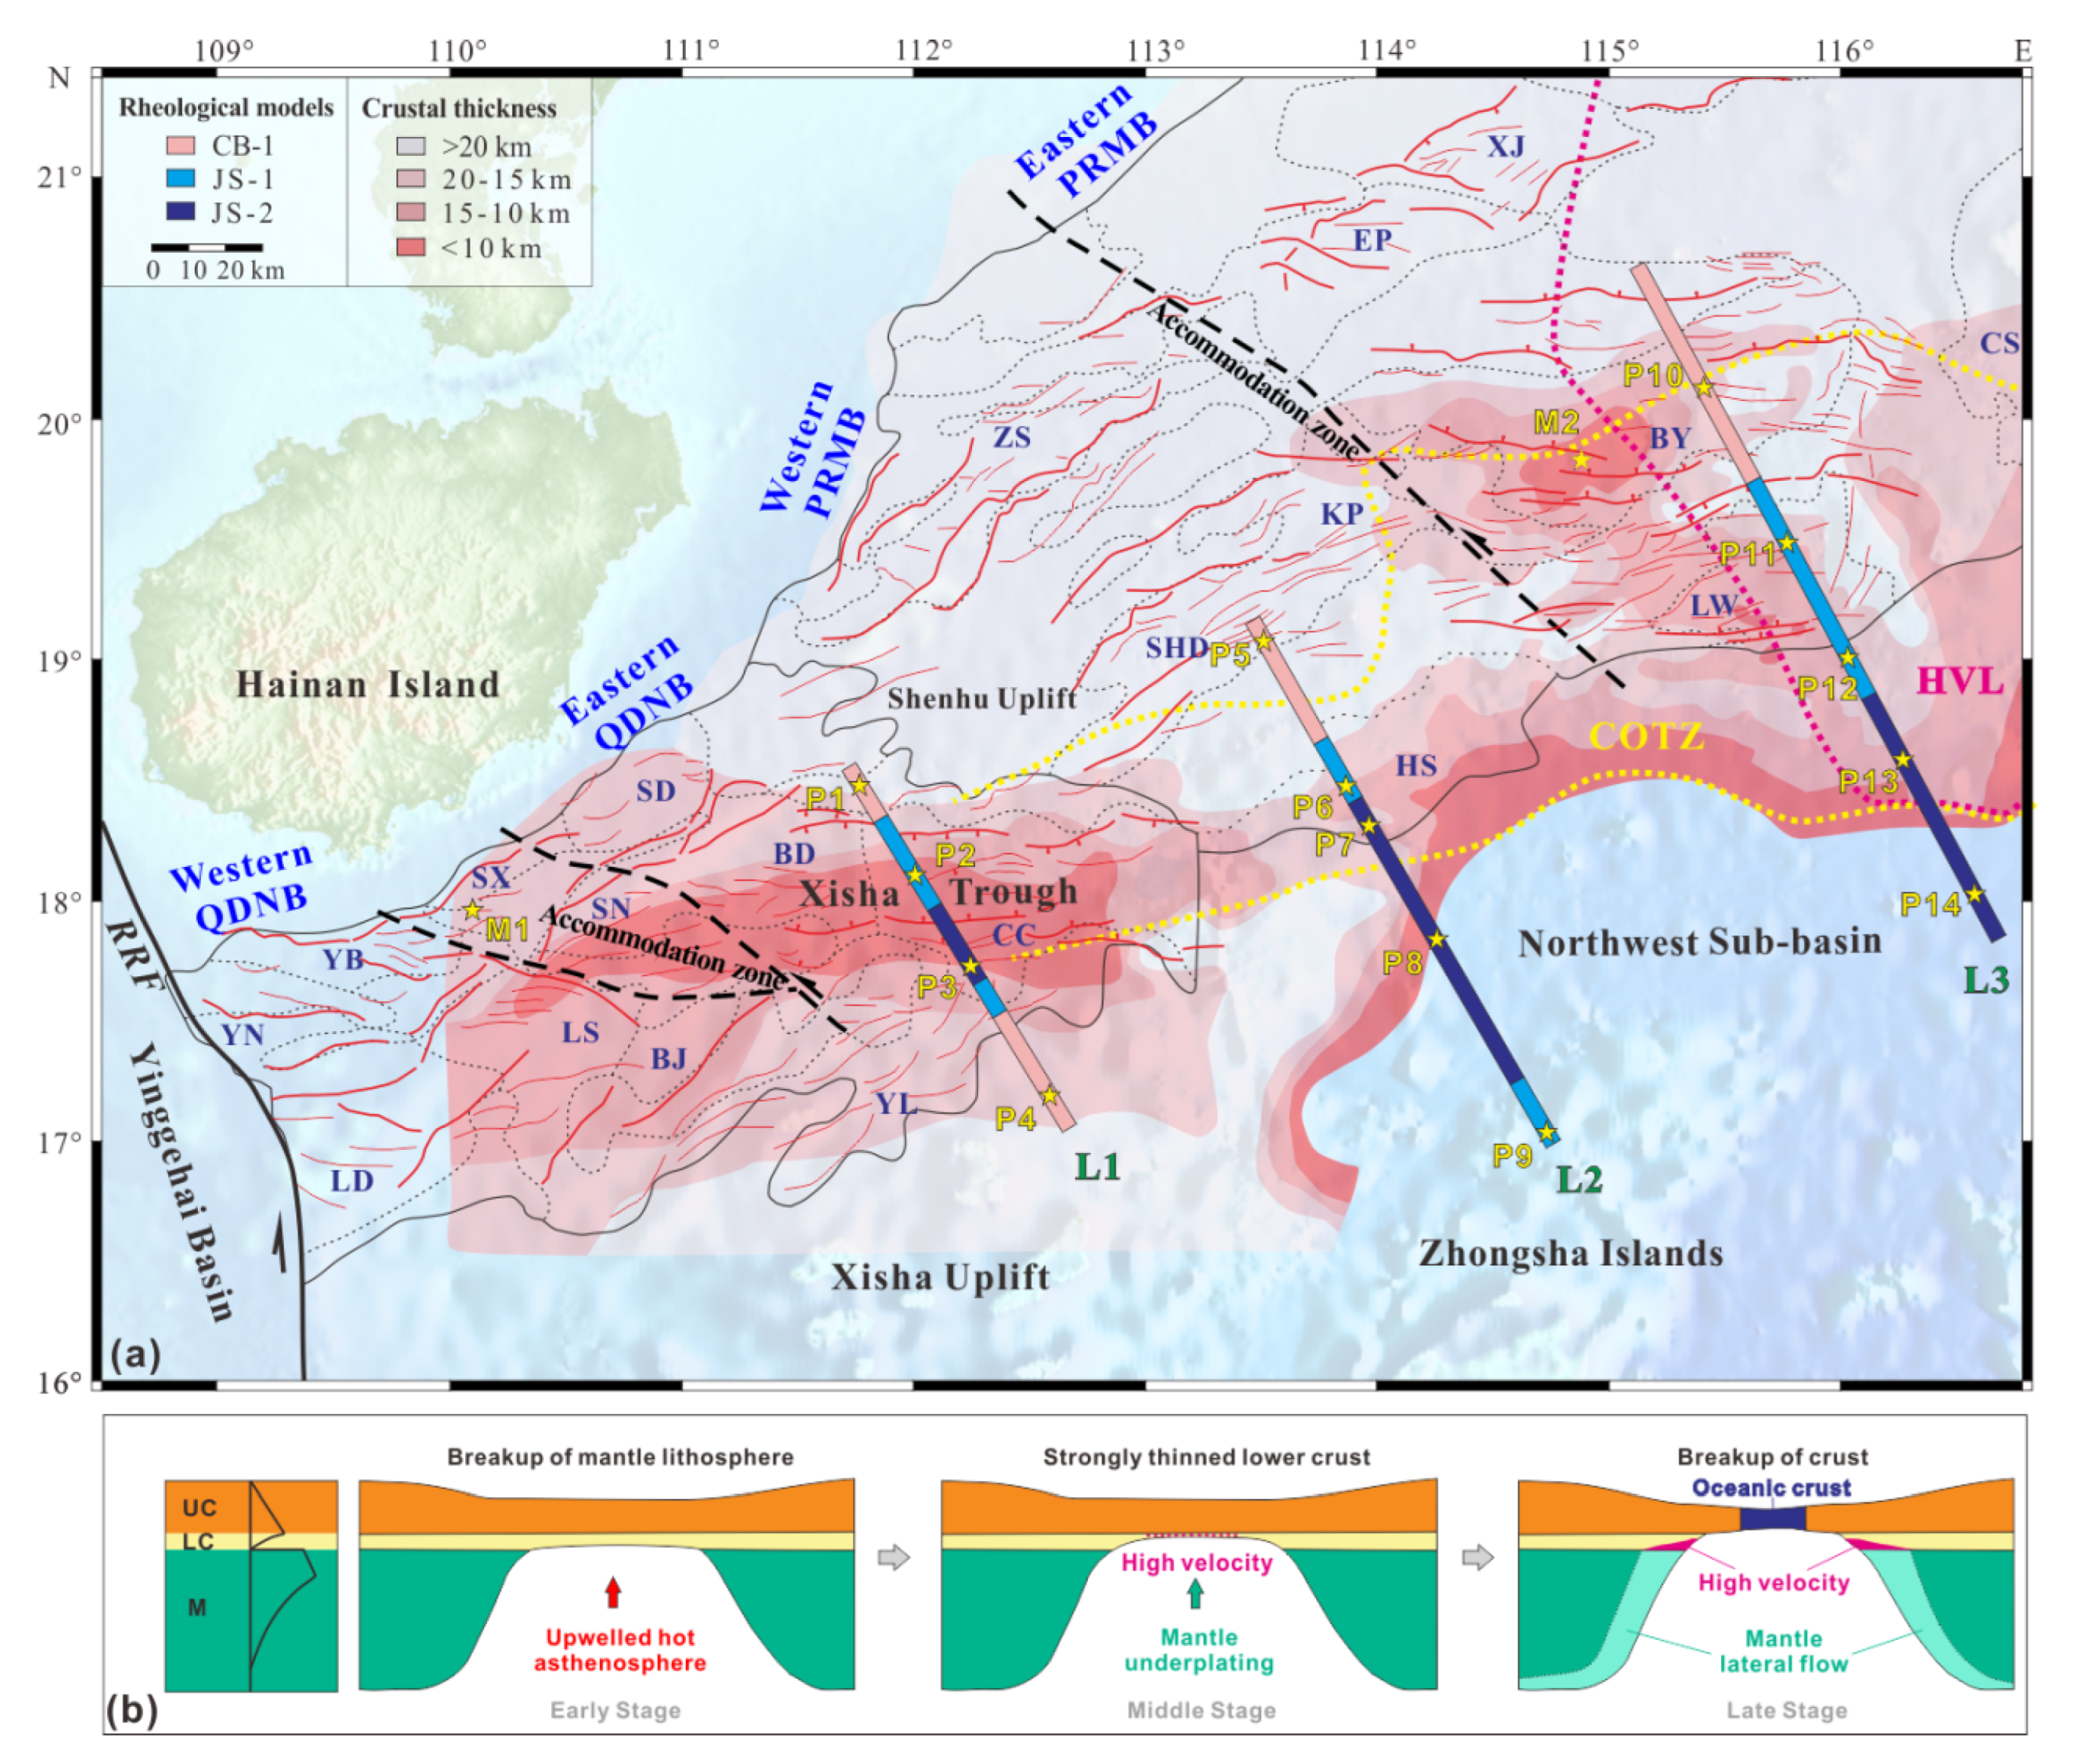
The lower crustal HVLs beneath the eastern PRMB increase the lower crustal strength, which forms at the late stage of continental rifting due to the mantle lateral flow, facilitated by the tectonic activities of the surrounding blocks.
(3)
The absence of HVLs in the western PRMB may indicate the limited impact of mantle lateral flow. This area exhibits a characteristically transitional thermo-rheological structure from the Xisha Trough to the eastern PRMB.

Supplementary Materials

The following supporting information can be downloaded at: https://www.mdpi.com/article/10.3390/jmse11020443/s1, Figure S1: (a) The variation of surface heat flow digitized from the heat flow map of Figure 2 along profile L1. (b) Crustal structure from the multi-channel seismic reflection profile L1 [25]. (c) 2D density structure of lithosphere along profile L1 [25]. N–Q, late Oligocene–Holocene; E, Paleocene–early Oligocene. See Figure 1 for locations; Figure S2: (a) The heat flow from observation and inversion along profile L1 are represented by red and blue points, respectively. The ratio between crustal heat flow and mantle heat flow is indicated by yellow points. Qc, crustal heat flow; Qm, mantle heat flow. (b) Thermal structure calculated from the simulation of profile L1.

Author Contributions

Conceptualization, C.L. and Writing—original drat, C.L.; Methodology, P.Z.; Writing—review & editing, R.D.; Formal analysis, L.Z.; Data curation, W.G.; Visualization, Z.L.; Visualization, J.G. All authors have read and agreed to the published version of the manuscript.

Funding

This research was supported by the Shandong Provincial Natural Science Foundation, China [Grant No. ZR2022QD087], the National Natural Science Foundation of China [Grants No. 92058213], the Open Fund of the Key Laboratory of Submarine Geosciences, Ministry of Natural Resources [Grants No. KLSG2207], and the Open Fund of the Key Laboratory of Marine Geology and Environment, Chinese Academy of Sciences [Grants No. MGE2022KG2].

Institutional Review Board Statement

Not applicable.

Informed Consent Statement

Not applicable.

Data Availability Statement

All data presented in this study are available.

Acknowledgments

We are extremely grateful to the anonymous referees for their insightful comments, which have improved this paper.

Conflicts of Interest

The authors declare no conflict of interest.

References

  1. Guo, L.; Shi, Y.; Ma, R. On the formation and evolution of the Mesozoic-Cenozoic active continental margin and island arc tectonic of the western Pacific Ocean. Acta Geol. Sin. 1983, 1, 11–21, (In Chinese with English Abstract). [Google Scholar]
  2. Hall, R. Cenozoic geological and plate tectonic evolution of SE Asia and the SW Pacific: Computer-based reconstructions, model and animations. J. Asian Earth Sci. 2002, 20, 353–431. [Google Scholar] [CrossRef]
  3. Li, S.; Suo, Y.; Liu, X.; Dai, L.; Yu, S.; Zhao, S.; Ma, Y.; Wang, X.; Cheng, S.; Xu, Y. Basic Structural Pattern and Tectonic Models of the South China Sea: Problems, Advances and Controversies. Mar. Geol. Quat. Geol. 2012, 32, 35–53, (In Chinese with English Abstract). [Google Scholar] [CrossRef]
  4. Wang, P.; Li, S.; Suo, Y.; Guo, L.; Wang, G.; Hui, G.; Santosh, M.; Somerville, I.D.; Cao, X.; Li, Y. Plate tectonic control on the formation and tectonic migration of Cenozoic basins in northern margin of the South China Sea. Geosci. Front. 2020, 11, 1231–1251. [Google Scholar] [CrossRef]
  5. Nissen, S.; Hayes, D.; Buhl, P.; Diebold, J. Deep penetration seismic soundings across the northern margin of the South China Sea. J. Geophys. Res.-Solid Earth 1995, 100, 22407–22433. [Google Scholar] [CrossRef]
  6. Zhu, W.; Wu, F.; Zhang, G.; Ren, J.; Zhao, Z.; Wu, K.; Zhong, K.; Liu, S. Discrepancy tectonic evolution and petroleum exploration in China offshore Cenozoic basins. Earth Sci. Front. 2015, 22, 88–101, (In Chinese with English Abstract). [Google Scholar]
  7. Zhang, Y.; Qi, J.; Wu, J. Cenozoic Faults Systems and its Geodynamics of the Continental Margin Basins in the Northern of South China Sea. J. China Univ. Geosci. (Chin. Ed.) 2019, 44, 603–625, (In Chinese with English Abstract). [Google Scholar]
  8. Dean, S.M.; Minshull, T.A.; Whitmarsh, R.B.; Louden, K.E. Deep structure of the ocean-continent transition in the southern Iberia Abyssal Plain from seismic refraction profiles: The IAM-9 transect at 40°20′N. J. Geophys. Res.-Solid Earth 2000, 105, 5859–5885. [Google Scholar] [CrossRef] [Green Version]
  9. Hopkinson, L.; Beard, J.S.; Boulter, C.A. The hydrothermal plumbing of a serpentinite-hosted detachment: Evidence from the West Iberia non-volcanic rifted continental margin. Mar. Geol. 2004, 204, 301–315. [Google Scholar] [CrossRef]
  10. Pérez-Gussinyé, M.; Morgan, J.P.; Reston, T.J.; Ranero, C.R. The rift to drift transition at non-volcanic margins: Insights from numerical modeling. Earth Planet. Sci. Lett. 2006, 244, 458–473. [Google Scholar] [CrossRef]
  11. Wu, S.; Zhou, D.; Qiu, X. Tectonic Setting of the Northern Margin of South China Sea. Geol. J. China Univ. 2001, 7, 419–426, (In Chinese with English Abstract). [Google Scholar]
  12. Ding, W.; Schnabel, M.; Franke, D.; Ruan, A.; Wu, Z. Crustal Structure across the Northwestern Margin of South China Sea: Evidence for Magma-poor Rifting from a Wide-angle Seismic Profile. Acta Geol. Sin. 2012, 86, 854–866. [Google Scholar]
  13. Franke, D. Rifting, lithosphere breakup and volcanism: Comparison of magma-poor and volcanic rifted margins. Mar. Pet. Geol. 2013, 43, 63–87. [Google Scholar] [CrossRef]
  14. Gao, J.; Wu, S.; Mcintosh, K.; Mi, L.; Yao, B.; Zhen, Z.; Jia, L. The continent–ocean transition at the mid-northern margin of the South China Sea. Tectonophysics 2015, 654, 1–19. [Google Scholar] [CrossRef]
  15. Ren, J.; Pang, X.; Lei, C.; Yuan, L.; Liu, J.; Yang, L. Ocean and continent transition in passive continental margins and analysis of lithospheric extension and breakup process: Implication for research of the deepwater basins in the continental margins of South China Sea. Earth Sci. Front. 2015, 22, 102–114, (In Chinese with English Abstract). [Google Scholar]
  16. Zhang, Y.; Sun, Z.; Zhou, D.; Guo, X.; Shi, X.; Wu, X.; Pang, X. Cenozoic crustal thinning in the northern margin of the South China Sea and its dynamical significance. Sci. China Ser. D 2007, 37, 1609–1616. (In Chinese) [Google Scholar]
  17. Zhang, Z.; Deng, Y.; Chen, L.; Wu, J.; Teng, J.; Giuliano, P. Seismic structure and rheology of the crust under mainland China. Gondwana Res. 2013, 23, 1455–1483. [Google Scholar] [CrossRef]
  18. Yan, P.; Zhou, D.; Liu, Z. A crustal structure profile across the northern continental margin of the South China Sea. Tectonophysics 2001, 338, 1–21. [Google Scholar]
  19. Clift, P.; Sun, Z. The sedimentary and tectonic evolution of the Yinggehai-Song Hong basin and the southern Hainan margin, South China Sea: Implications for Tibetan uplift and monsoon intensification. J. Geophys. Res.-Solid Earth 2006, 111, B06405. [Google Scholar] [CrossRef]
  20. Zhang, Z.; Liu, Y.; Zhang, S.; Fan, W.; Chen, L. The depth-dependence of crustal extension beneath Qiongdongnan basin area and its tectonic implications. Chin. J. Geophys. 2010, 53, 57–66, (In Chinese with English Abstract). [Google Scholar]
  21. Lei, C.; Ren, J. Hyper-extended rift systems in the Xisha Trough, northwestern South China Sea: Implications for extreme crustal thinning ahead of a propagating ocean. Mar. Pet. Geol. 2016, 77, 846–864. [Google Scholar] [CrossRef]
  22. Wang, T.; Chen, M.; Lee, C.; Xia, K. Seismic imaging of the transitional crust across the northeastern margin of the South China Sea. Tectonophysics 2006, 412, 237–254. [Google Scholar] [CrossRef]
  23. Zhu, J.; Qiu, X.; Kopp, H.; Xu, H.; Sun, Z.; Ruan, A.; Sun, J.; Wei, X. Shallow anatomy of a continent–ocean transition zone in the northern South China Sea from multichannel seismic data. Tectonophysics 2012, 554, 18–29. [Google Scholar] [CrossRef]
  24. Zhang, Z.; Liu, Y.; Zhang, S.; Zhang, G.; Fan, W. Crustal P-wave velocity structure and layering beneath Zhujiangkou-Qiongdongnan basins, the northern continental margin of South China Sea. Chin. J. Geophys. 2009, 52, 2461–2471, (In Chinese with English Abstract). [Google Scholar] [CrossRef]
  25. Qiu, N.; Wang, Z.; Xie, H.; Sun, Z.; Wang, Z.; Sun, Z.; Zhou, D. Geophysical investigations of crust-scale structural model of the Qiongdongnan Basin, Northern South China Sea. Mar. Geophys. Res. 2013, 34, 259–279. [Google Scholar] [CrossRef]
  26. Gao, J.; Wu, S.; Mcintosh, K.; Mi, L.; Liu, Z.; Spence, G. Crustal structure and extension mode in the northwestern margin of the South China Sea. Geochem. Geophys. Geosyst. 2016, 17, 2143–2167. [Google Scholar] [CrossRef] [Green Version]
  27. Li, J. Dynamics of the continental margin of South China Sea: Scientific experiments and research progresses. Chin. J. Geophys. 2011, 54, 2993–3003, (In Chinese with English Abstract). [Google Scholar] [CrossRef]
  28. He, L.; Xiong, L.; Wang, J.; Yang, J.; Dong, S. Tectono-thermal modeling of the Yinggehai Basin, South China Sea. Sci. China Ser. D 2001, 44, 7–13. [Google Scholar] [CrossRef]
  29. Liu, S.; Shi, X.; Wang, L.; Gao, S.; Hu, X.; Feng, C. Recent advances in studies on the formation mechanism of the South China Sea and thermo-rheological structure of lithosphere in its northern margin: An overview. Mar. Geol. Quat. Geol. 2006, 26, 117–124, (In Chinese with English Abstract). [Google Scholar]
  30. Peron-Pinvidic, G.; Manatschal, G. Rifted Margins: State of the Art and Future Challenges. Front. Earth Sci. 2019, 7, 1–8. [Google Scholar] [CrossRef] [Green Version]
  31. Huismans, R.; Beaumont, C. Depth-dependent extension, two-stage breakup and cratonic underplating at rifted margins. Nature 2011, 473, 74–78. [Google Scholar] [CrossRef]
  32. Tetreault, J.L.; Buiter, S.J.H. The influence of extension rate and crustal rheology on the evolution of passive margins from rifting to break-up. Tectonophysics 2018, 746, 155–172. [Google Scholar] [CrossRef]
  33. Zhang, J.; Wang, J. Deep geothermal characteristics in the northern continental margin of the South China Sea. Scientia 2000, 45, 1095–1100. (In Chinese) [Google Scholar]
  34. Shi, X.; Yu, C.; Chen, M.; Yang, X.; Zhao, J. Analyses of variation features and influential factors of heat flow in the northern margin of the South China Sea. Earth Sci. Front. 2017, 24, 56–64, (In Chinese with English Abstract). [Google Scholar]
  35. Tang, X.; Huang, S.; Zhang, G.; Yang, S.; Hu, S. Lithospheric thermal structure of the Pearl River Mouth Basin, northern South China Sea. Chin. J. Geophys. 2018, 61, 3749–3759, (In Chinese with English Abstract). [Google Scholar]
  36. Li, C.; Jiang, X.; Gong, W. Thermo-rheological structure and passive continental margin rifting in the Qiongdongnan Basin, South China Sea, China. J. Ocean Univ. China 2022, 21, 347–360. [Google Scholar] [CrossRef]
  37. Qiu, X.; Ye, S.; Wu, S.; Shi, X.; Zhou, D.; Xia, K.; Flueh, E.R. Crustal structure across the Xisha Trough, northwestern South China Sea. Tectonophysics 2001, 341, 179–193. [Google Scholar] [CrossRef]
  38. Ren, J.; Lei, C. Tectonic stratigraphic framework of Yinggehai-Qiongdongnan Basins and its implication for tectonic province division in South China Sea. Chin. J. Geophys. 2011, 54, 3303–3314, (In Chinese with English Abstract). [Google Scholar] [CrossRef]
  39. Lin, J.; Sun, Z.; Li, J.; Zhou, Z.; Zhang, F.; Luo, Y. South China Sea basin opening: Lithospheric rifting and interaction with surrounding subduction zones. Sci. Tech. Rev. 2020, 38, 35–39. [Google Scholar]
  40. Liu, H.; Yao, Y.; Shen, B.; Cai, Z.; Zhang, Z.; Xu, H.; Wang, S.; Wei, C.; Chen, J. On Linkage of Western Boundary Faults of the South China Sea. J. China Univ. Geosci. (Chin. Ed.) 2015, 40, 615–632, (In Chinese with English Abstract). [Google Scholar]
  41. Xie, X.; Ren, J.; Wang, Z.; Li, X.; Lei, C. Difference of tectonic evolution of continental marginal basins of South China Sea and relationship with SCS spreading. Earth Sci. Front. 2015, 22, 77–87, (In Chinese with English Abstract). [Google Scholar]
  42. Sun, Z.; Lin, J.; Qiu, N.; Jian, Z.; Wang, P.; Pang, X.; Zheng, J.; Zhu, B. The role of magmatism in the thinning and breakup of the South China Sea continental margin. Natl. Sci. Rev. 2019, 6, 871–876. [Google Scholar] [CrossRef] [PubMed]
  43. Sun, Z.; Zhong, Z.; Keep, M.; Zhou, D.; Cai, D.; Li, X.; Wu, S.; Jiang, J. 3D analogue modeling of the South China Sea: A discussion on breakup pattern. J. Asian Earth Sci. 2009, 34, 544–556. [Google Scholar] [CrossRef]
  44. Yin, A. Cenozoic tectonic evolution of Asia: A preliminary synthesis. Tectonophysics 2010, 488, 293–325. [Google Scholar] [CrossRef]
  45. Doust, H.; Sumner, H.S. Petroleum systems in rift basins—A collective approach in Southeast Asian basins. Pet. Geosci. 2007, 13, 127–144. [Google Scholar] [CrossRef] [Green Version]
  46. Briais, A.; Patriat, P.; Tapponnier, P. Updated Interpretation of Magnetic Anomalies and Seafloor Spreading Stages in the South China Sea Implications for the Tertiary Tectonics of Southeast Asia. J. Geophys. Res.-Solid Earth 1993, 98, 6299–6328. [Google Scholar] [CrossRef] [Green Version]
  47. Braitenberg, C.; Wienecke, S.; Wang, Y. Basement structures from satellite-derived gravity field: South China Sea ridge. J. Geophys. Res.-Solid Earth 2006, 111, B05407. [Google Scholar] [CrossRef]
  48. Barckhausen, U.; Engels, M.; Franke, D.; Ladage, S.; Pubellier, M. Evolution of the South China Sea: Revised ages for breakup and seafloor spreading. Mar. Pet. Geol. 2014, 58, 599–611. [Google Scholar] [CrossRef]
  49. Gong, W.; Li, C.; Jiang, X. Connection between uplifting of the Tibetan Plateau and opening of the South China Sea (SCS): The basin-mountain coupling in the northwestern margin of the SCS. Earth Sci. Front. 2017, 24, 268–283, (In Chinese with English Abstract). [Google Scholar]
  50. Dong, D.; Wang, D.; Zhang, G.; Wu, S.; Yuan, S. Cenozoic tectonic and sedimentary evolution of deepwater area, Pearl River Mouth Basin. J. China Univ. Pet. 2009, 53, 17–29, (In Chinese with English Abstract). [Google Scholar]
  51. Lei, C.; Ren, J.; Pei, X.; Lin, H.; Yin, X.; Tong, D. Tectonic Framework and Multiple Episode Tectonic Evolution in Deepwater Area of Qiongdongnan Basin, Northern Continental Margin of South China Sea. J. China Univ. Geosci. (Chin. Ed.) 2011, 36, 151–162. [Google Scholar]
  52. Morley, C.K. Major Unconformities/termination of Extension Events and Associated Surfaces in the South China Seas: Review and Implications for Tectonic Development. J. Asian Earth Sci. 2016, 120, 62–86. [Google Scholar] [CrossRef]
  53. Xia, S.; Fan, C.; Wang, D.; Cao, J.; Zhao, F. Hyperextended crustal structure of the Qiongdongnan Basin and subsequent magmatic influence from the Hainan mantle plume. Sci. China Ser. D 2022, 65, 845–862, (In Chinese with English Abstract). [Google Scholar] [CrossRef]
  54. Wang, Z.; Sun, Z.; Qiu, N.; Liu, J.; Wang, Z.; Sun, Z. Crustal structure of Changchang sag in the deepwater area of Qiongdongnan Basin. Mar. Geol. Front. 2013, 29, 7–17, (In Chinese with English Abstract). [Google Scholar]
  55. Yao, B.; Wan, L.; Wu, N. Cenozoic tectonic evolution and the 3D structure of the lithosphere of the South China Sea. Geol. Bull. China 2005, 24, 1–8, (In Chinese with English Abstract). [Google Scholar]
  56. Shi, X.; Zhou, D. Lithospheric thermal-rheological structure of the northern continental margin of the South China Sea. Scientia 2000, 45, 1660–1665. (In Chinese) [Google Scholar] [CrossRef]
  57. Tong, D.; Ren, J.; Lei, C.; Yang, H.; Yin, X. Lithosphere Stretching Model of Deep Water in Qiongdongnan Basin, Northern Continental Margin of South China Sea, and Controlling of the Post-Rift Subsidence. J. China Univ. Geosci. (Chin. Ed.) 2009, 34, 963–974, (In Chinese with English Abstract). [Google Scholar]
  58. Zhao, B.; Zhang, S.; Li, S. Crustal density and composition models beneath Qiongdongnan basin. Chin. J. Geophys. 2011, 54, 98–107, (In Chinese with English Abstract). [Google Scholar]
  59. Lester, R.; Van Avendonk, H.J.; Mcintosh, K.; Lavier, L.; Liu, C.S.; Wang, T.K.; Wu, F. Rifting and magmatism in the northeastern South China Sea from wide-angle tomography and seismic reflection imaging. J. Geophys. Res.-Solid Earth 2014, 119, 2305–2323. [Google Scholar] [CrossRef]
  60. Wang, Y. Petrology and chemical composition models of the lower crust of the Xisha Trough, northern continental margin of the South China Sea. Bull. Mineral. Petrol. Geochem. 2007, 26, 29–30. (In Chinese) [Google Scholar]
  61. Hu, J.; Tian, Y.; Long, Z.; Hu, D.; Hu, S. Thermo-rheological structure of the northern margin of the South China Sea: Structural and geodynamic implications. Tectonophysics 2020, 777, 228338. [Google Scholar] [CrossRef]
  62. Shi, X.; Zhou, D.; Qiu, X.; Zhang, Y. Thermal and rheological structures of the Xisha Trough, South China Sea. Tectonophysics 2002, 351, 285–300. [Google Scholar] [CrossRef]
  63. Wang, Z.; Shi, X.; Yang, J.; Huang, B.; Sun, Z.; Wang, Y.; Jiang, H.; Yu, C.; Yang, X. Analyses on the tectonic thermal evolution and influence factors in the deep-water Qiongdongnan Basin. Acta Oceanol. Sin. 2014, 33, 107–117. [Google Scholar] [CrossRef]
  64. Sun, Z.; Zhou, D.; Zhong, Z.; Qiu, X.; Zeng, Z. A study on basal controlling fault pattern of Ying-Qiong basin through analogue modeling. J. Trop. Oceanogr. 2005, 24, 70–78, (In Chinese with English Abstract). [Google Scholar]
  65. Lebedev, S.; Nolet, G. Upper mantle beneath Southeast Asia from S velocity tomography. J. Geophys. Res.-Solid Earth 2003, 108, 2048. [Google Scholar] [CrossRef] [Green Version]
  66. Huang, Z.; Xu, Y. S-wave velocity structure of South China Sea and surrounding regions from surface wave tomography. Chin. J. Geophys. 2011, 54, 3089–3097, (In Chinese with English Abstract). [Google Scholar] [CrossRef]
  67. Mi, L.; Yuan, Y.; Zhang, G.; Hu, S.; He, L.; Yang, S. Characteristics and genesis of geothermal field in deep-water area of the northern South China Sea. Acta Pet. Sin. 2009, 30, 27–32, (In Chinese with English Abstract). [Google Scholar]
  68. Li, Y.; Luo, X.; Xu, X.; Yang, X.; Shi, X. Seafloor in-situ heat flow measurements in the deep-water area of the northern slope, South China Sea. Chin. J. Geophys. 2010, 53, 2161–2170, (In Chinese with English Abstract). [Google Scholar] [CrossRef]
  69. Fan, C.; Xia, S.; Cao, J.; Zhao, F.; Sun, J.; Wan, K.; Xu, H. Lateral crustal variation and post-rift magmatism in the northeastern South China Sea determined by wide-angle seismic data. Mar. Geol. 2019, 410, 70–87. [Google Scholar] [CrossRef]
  70. Ma, H.; Xu, H.; Zhao, J.; Wan, J.; Chen, A.; Liu, T. Thermal structure of Nansha Trough Foreland Basin. J. Trop. Oceanogr. 2012, 31, 155–161, (In Chinese with English Abstract). [Google Scholar]
  71. Zhang, J.; Dong, M.; Wu, S.; Gao, L. Lithosphere thermal-rheological structure and geodynamic evolution model of the Nansha trough basin, South China Sea. Earth Sci. Front. 2017, 24, 27–40, (In Chinese with English Abstract). [Google Scholar]
  72. Zhang, L.; Liu, Q.; He, L. The different lithospheric thermal structure of North China Craton and its implications. Chin. J. Geophys. 2016, 59, 3618–3626, (In Chinese with English Abstract). [Google Scholar]
  73. He, L. Permian to Late Triassic evolution of the Longmen Shan Foreland Basin (Western Sichuan): Model results from both the lithospheric extension and flexure. J. Asian Earth Sci. 2014, 93, 49–59. [Google Scholar] [CrossRef]
  74. Shi, X.; Wang, Z.; Jiang, H.; Sun, Z.; Sun, Z.; Yang, J.; Yu, C.; Yang, X. Vertical variations of geothermal parameters in rifted basins and heat flow distribution features of the Qiongdongnan Basin. Chin. J. Geophys. 2015, 58, 939–952, (In Chinese with English Abstract). [Google Scholar]
  75. Cai, L.; Li, X.; Liu, S.; Zhu, J.; Xiong, X.; Li, X.; Yin, H. Thermal Properties Characterization of the Rocks in the Qiongdongnan Basin, Northern Margin of the South China Sea. Geol. J. China Univ. 2019, 25, 538–547, (In Chinese with English Abstract). [Google Scholar]
  76. Cermák, V. Crustal heat production and mantle heat flow in Central and Eastern Europe. Tectonophysics 1989, 159, 195–215. [Google Scholar] [CrossRef]
  77. Zhou, H.; Jiang, X.; Li, D.; Xing, J.; Gong, W. Thermal-rheological property of lithosphere beneath Xihu Sag, East China Sea Shelf Basin. Geotecton. Metallog. 2017, 41, 481–490, (In Chinese with English Abstract). [Google Scholar]
  78. Jackson, J. Faulting, Flow, and the Strength of the Continental Lithosphere. Int. Geol. Rev. 2002, 44, 39–61. [Google Scholar] [CrossRef]
  79. Burov, E.B.; Watts, A.B. The long-term strength of continental lithosphere: “Jelly sandwich” or “crème brûlée”? GSA Today 2006, 16, 4–10. [Google Scholar] [CrossRef]
  80. Zhang, C.; Wang, Z.; Sun, Z.; Sun, Z.; Liu, J.; Wang, Z. Structural differences between the western and eastern Qiongdongnan Basin: Evidence of Indochina block extrusion and South China Sea seafloor spreading. Mar. Geophys. Res. 2013, 34, 309–323. [Google Scholar] [CrossRef]
  81. Ranalli, G. Regional variations in lithosphere rheology from heat flow observations. In Terrestrial Heat Flow and the Lithosphere Structure; Cermak, V., Rybach, L., Eds.; Springer: Berlin/Heidelberg, Germany, 1991; pp. 1–22. [Google Scholar]
  82. Wang, Y. Heat flow pattern and lateral variations of lithosphere strength in China mainland: Constraints on active deformation. Phys. Earth Planet. Inter. 2001, 126, 121–146. [Google Scholar] [CrossRef]
  83. Kirby, S.H. Rheology of the lithosphere. Rev. Geophys. 1983, 21, 1458–1487. [Google Scholar] [CrossRef]
  84. Williams, J.P.; Ruiz, J.; Rosenburg, M.A.; Aharonson, M.A.; Phillips, O.; Roger, J. Insolation driven variations of Mercury’s lithospheric strength. J. Geophys. Res-Planet. 2011, 116, E01008. [Google Scholar] [CrossRef] [Green Version]
  85. Michel, G.W.; Yu, Y.Q.; Zhu, S.Y.; Reigber, C.; Becker, M.; Reinhartb, E.; Simons, W.; Ambrosius, B.; Vigny, C.; Chamot-Rooke, N. Crustal motion and block behavior in SE-Asia from GPS measurements. Earth Planet. Sci. Lett. 2001, 187, 239–244. [Google Scholar] [CrossRef] [Green Version]
  86. Zang, S.; Li, Y.; Wei, R. The Determination of Rheological Mechanics of Lithosphere and the Influencing Factors on the Rheological Strength of Lithosphere. Prog. Geophys. 2002, 17, 50–60, (In Chinese with English Abstract). [Google Scholar]
  87. Burov, E.B.; Diament, M. The effective elastic thickness (Te) of continental lithosphere: What does it really mean? J. Geophys. Res.-Solid Earth 1995, 100, 3905–3927. [Google Scholar] [CrossRef] [Green Version]
  88. Jackson, J.; McKenzie, D.; Priestley, K.; Emmerson, B. New views on the structure and rheology of the lithosphere. J. Geol. Soc. Lond. 2008, 165, 453–465. [Google Scholar] [CrossRef]
  89. Zhou, Z. The Cenozoic Crustal Thinning and Development of Hyper-Extended Rift System in the Northern South China Sea. Ph.D. Thesis, China University of Geosciences, Wuhan, China, 2018. (In Chinese with English Abstract). [Google Scholar]
  90. Buck, W.R. The dynamics of continental breakup and extension. In Crustal and Lithosphere Dynamics; Watts, A.B., Ed.; Columbia University: New York, NY, USA, 2007; pp. 325–379. [Google Scholar]
  91. Zou, H. Continental marginal rifting along the northern South China Sea: The crustal response to the lower lithospheric delamination. Mar. Geol. Quat. Geol. 2001, 21, 39–44, (In Chinese with English Abstract). [Google Scholar]
Figure 2. The distribution of surface heat flow in the northwestern SCS, the heat flow date is from Mi et al. [67], Zhang and Wang [33], Li et al. [68], Wang et al. [69], and Shi et al. [34]. The green solid lines (L1, L2, and L3) denote the locations of multi-channel seismic reflection profiles, which were used to examine the thermo-rheological structures [14,25,26]. Yellow stars of P1–P14 show the locations of calculated typical lithospheric rheological structures.
Jmse 11 00443 g002
Figure 3. (a) The variation of surface heat flow digitized from the heat flow map of Figure 2 along profile L2. (b) Crustal structure from the multi–channel seismic reflection profile L2 [26]. The crustal P−wave velocity is from the OBS profiles of OBS2006, which is almost parallel to profile L2 [12] (Figure 1). (c) 2D density structure of lithosphere along profile L2 [25,26]. N–Q, late Oligocene–Holocene; E, Paleocene–early Oligocene. See Figure 1 for locations.
Jmse 11 00443 g003
Figure 4. (a) The variation of surface heat flow digitized from the heat flow map of Figure 2 along profile L3. (b) Crustal structure from the multi−channel seismic reflection profile L3 [14]. The crustal P−wave velocity is from the OBS profiles of OBS1993, which is almost parallel to profile L3 [18] (Figure 1). (c) 2D density structure of lithosphere along profile L3 [14,25]. N–Q, late Oligocene–Holocene; E, Paleocene–early Oligocene. See Figure 1 for locations.
Jmse 11 00443 g004
Figure 5. (a) The heat flow from observation and inversion along profile L2 are represented by red and blue points, respectively. The ratio between crustal heat flow and mantle heat flow is indicated by yellow points. Qc, crustal heat flow; Qm, mantle heat flow. (b) Thermal structure calculated from the simulation of profile L2.
Jmse 11 00443 g005
Figure 6. (a) The heat flow from observation and inversion along profile L3 are represented by red and blue points, respectively. The ratio between crustal heat flow and mantle heat flow is indicated by yellow points. Qc, crustal heat flow; Qm, mantle heat flow. (b) Thermal structure calculated from the simulation of profile L3.
Jmse 11 00443 g006
Figure 8. (a) The values of Qc/Qm and surface heat flow are represented by the blue points and red points, respectively. (b) The constructed lithospheric rheological structure of profile L2. (c) The thermo-rheological models estimated at the typical locations of P5−P9. Green and red lines denote the geothermal curve and yield stress envelope (YSE), respectively. The classical rheological models of JS−1, JS−2, and CB−1 were recognized along profile L1 by the light blue, dark blue, and pink rectangles, respectively. JS−1, jelly sandwich regime with weak lower crust; JS−2, jelly sandwich regime with relatively strong lower crust; CB−1, crème brûlée regime with weak lower crust. Qc, crustal heat flow; Qm, mantle heat flow; UC, upper crust; LC, lower crust; M, upper mantle.
Jmse 11 00443 g008
Figure 9. (a) The values of Qc/Qm and surface heat flow are represented by the blue points and red points, respectively. (b) The constructed lithospheric rheological structure of profile L3. (c) The thermo-rheological models estimated at the typical locations of P10–P14. Green lines denote the geothermal curve. Red dotted lines and red solid lines indicate the yield stress envelope (YSE) of intermediate granulite and mafic granulite taken in lower crust model, respectively. The classical rheological models of JS−1, JS−2, and CB−1 were recognized along profile L1 by the light blue, dark blue, and pink rectangles, respectively. JS−1, jelly sandwich regime with weak lower crust; JS−2, jelly sandwich regime with relatively strong lower crust; CB-1, crème brûlée regime with weak lower crust. Qc, crustal heat flow; Qm, mantle heat flow; UC, upper crust; LC, lower crust; M, upper mantle.
Jmse 11 00443 g009
Figure 10. (a) Estimated distribution of crustal thickness [89] and rheological models. The classical rheological models of CB-1, JS-1, and JS-2 were recognized by the pink, light blue, and dark blue rectangles, respectively. The locations of M1 and M2 are the typical locations for comparative research in the paper. (b) The non-uniform extension model modified from Huismans and Beaumont [31].
Jmse 11 00443 g010
Table 1. Lithospheric thermophysical parameters used in calculations of temperature distribution.
LayersThermal Conductivity
K (W/mK)
Heat Production
A (μW/m3)
References
SedimentsN-Q2.012.08Tang et al. [35]
E2.202.35Hu et al. [61]
Upper crustUTKK = (0.33 + 0.33 × 10⁻³T)−1A = A0exp(−z/D)Shi et al. [62]
other partslnA = 12.6–2.17Vp
Lower crust K = (0.41 + 0.29 × 10⁻³T)−1lnA = 12.6–2.17VpMa et al. [70]
Upper mantle K = (0.21 + 0.50 × 10⁻³T)−1
−0.52 + 2.3 × 10⁻³T
0.003Cai et al. [75]
Table 2. Material properties used for construction of initial lithospheric rheology models.
LayersLithologyPre-Exponential Constant
A (MPa-n/s)
Powerlaw Exponent
n
Powerlaw Activation Energy
E (KJ/mol)
References
SedimentsWet quartz3.20 × 10−62.3154Hu et al. [61]
Upper crustWet quartz3.20 × 10−62.3154Shi et al. [63]
Lower crustIntermediate granulite
(L1, L2 and L3)
1.30 × 10−32.4219Zhou et al. [77]
Mafic granulite
(L3)
1.24 × 1044.2445Wang [82]
Upper mantleAheim dunite3.98 × 10−24.5498Zang [86]
Disclaimer/Publisher’s Note: The statements, opinions and data contained in all publications are solely those of the individual author(s) and contributor(s) and not of MDPI and/or the editor(s). MDPI and/or the editor(s) disclaim responsibility for any injury to people or property resulting from any ideas, methods, instructions or products referred to in the content.

