Article

The Use of Tunable Encapsulation for Long-Term Fouling Control

Department of Ocean Engineering & Marine Sciences, Florida Institute of Technology, Melbourne, FL 32901, USA
*
Author to whom correspondence should be addressed.
J. Mar. Sci. Eng. 2023, 11(10), 1947; https://doi.org/10.3390/jmse11101947
Submission received: 27 August 2023 / Revised: 1 October 2023 / Accepted: 3 October 2023 / Published: 9 October 2023
(This article belongs to the Special Issue Tenth Anniversary of JMSE – Recent Advances and Future Perspectives)

Abstract

:
Biofouling is a universal problem in the marine environment. Static structures and niche areas on ships, such as propellers, are not protected sufficiently by antifouling coatings. Encapsulation has previously been used as a fouling mitigation technique via application of an impermeable wrap or bag to a fouled hull or structure when it arrives in port or on station. This experiment investigated the use of a novel semipermeable encapsulation to proactively protect propeller mimics from biofouling. Sleeves were installed over propeller mimic panels and deployed in an active, multiuse port for 20 months. The sleeves completely prevented macrofouling on the panels for up to 13 months and maintained surfaces below 5% cover for the entire experimental period. This shows improvement over traditional antifouling without negative impacts on water quality like dissolved oxygen, pH, etc.

1. Introduction

All structures in the marine environment are subject to biofouling or simply fouling [1]. Fouling occurs primarily in ports and harbors, which are aggressive fouling environments. This is because of the high proportion of anthropogenic substrates that are often heavily fouled, leading to a high number of settling propagules, which, along with high water retention, concentrate and increase fouling pressure [2,3,4,5,6,7]. Fouling on ship hulls and other mobile structures increases frictional drag, which increases fuel costs, greenhouse gas emissions, and maintenance costs. Moving structures increase the risk of transportation of non-indigenous species. Additionally, the weight and interference of fouling lead to structural damage [1,7,8,9,10].
Many resources have been devoted to developing antifouling coatings that protect ship hulls from fouling; however, coatings are less effective on static structures such as instruments and pilings [1,6,9]. Additionally, coatings cannot effectively protect certain areas of ship hulls typically referred to as niche areas, such as intakes, propellers, dock block areas, etc. [5,11,12,13,14]. Niche areas have been estimated to comprise approximately 10% of the global commercial shipping fleet’s total hull wetted surface area. Of these, thruster tunnels, dry dock support strips, and bilge keels made up more than ¾ of the total niche area [14]. Coatings are also less effective on vessels that only travel slowly or infrequently, which includes many recreational vessels and naval ships [5,15,16,17].
Encapsulation has been used in limited circumstances as a fouling mitigation technique. The typical wrap or bag is impermeable and applied to a fouled hull or structure when it arrives in port or on station. The intention is to allow an anoxic environment to form, killing fouling on the structure [5,6,12,17,18,19,20,21]. This process is sometimes aided by adding chemicals or freshwater, or pumping water out of the bag to decrease the time necessary to kill fouling [5,12,18,21,22]. Niche areas are harder to treat and often require additional time encapsulated or additional chemicals to complete treatment and kill all fouling [5,23]. Additionally, this method is reactive and intended to kill fouling but does not address the need to remove the dead fouling after treatment [17,23].
To mitigate the risk of transporting non-indigenous species, many countries and the international community have recently begun to codify best practice and introduce requirements aiming to reduce fouling [9,24,25,26]. These changes indicate a shift from efficiency-driven antifouling practices focusing solely on ship hulls to an approach emphasizing both efficiency and biosecurity, which includes niche areas and non-ship structures [8,9]. Best management practice is to maintain ship hulls and other surfaces as free from fouling as possible [13,14,24,26,27,28]. Most encapsulation methods are intended to treat a fouled surface. The novel technology tested in this experiment is designed to prevent fouling on all surfaces, while the structures are static in port. This includes those surfaces that are difficult to treat with antifouling coatings like niche areas and propellers. This experiment aims to investigate the efficacy of this antifouling encapsulation technology and starts to investigate the potential mechanisms by which it works.

2. Materials and Methods

Sleeves were fabricated in three coated polyester fabrics, 40 TXT, 50 TXT and Spun (Figure 1). The sleeves consisted of a fabric that had been coated with a proprietary antifouling coating that was designed to ablate during immersion. The biocides were copper-free and were selected because they are considered to be a green, more environmentally friendly alternative. Prior to immersion, the pores per square inch (approximately 2.5 cm2) and permeability of the fabrics were measured. A plastic mask was developed to standardize the area for counting to quantify the number of pores. Approximately one meter (yard) of each fabric was randomly selected and placed over a light table. The mask was placed randomly over the fabric and photographed. This process was repeated five times for each fabric. The number of pores within the mask was manually counted from the images. Because of the size and number of the pores, a device (Figure 2) was designed to measure permeability. A pump was placed in a bucket and attached to a PVC pipe with a 19.63 cm diameter. The pipe length was set to create a head pressure of 1.72 kPa (0.25 psi). Three samples measuring 10.16 cm × 10.16 cm were cut randomly from each fabric type. The samples were soaked in water overnight for a minimum of 8 h to saturate them fully. This process ensured that water would flow through the samples over the entire area when installed in the permeability test unit. During testing, fabric samples were installed over the end of the PVC pipe. The pump was turned on, and the pipe was allowed to fill and began to flow through the overflow. At that point, a beaker was placed below the sample, and a timer started. Once 1000 mL had flowed into the beaker, the timer was stopped. This process was used to calculate permeability in mL/cm2/s.
The sleeves were installed over propeller mimic panels. These panels (10 cm × 20 cm) consisted of propeller bronze with a sacrificial zinc anode (5 cm × 7.5 cm × 1.3 cm). The zinc was attached with a stainless-steel bolt to mimic a cathodically protected propeller attached to a shaft. The panels were held by two Delrin plastic caps each, which allowed them to be attached to frames and provided a way to suspend the sleeves without touching the panels while maintaining a standardized distance between panel and sleeve (Figure 1). Three replicates of each treatment were randomized and placed onto frames. Two sets of frames were assembled, one for monthly visual assessment and one for relatively undisturbed water quality measurements.
In addition, a set of visual assessment control panels with no antifouling protection was immersed. Four clean replicates were immersed at the same time as the experimental panels. At the one- and two-month assessments, an additional four clean replicates were immersed. In the third month, the first set of replicates was replaced. This process continually tracked recruitment, despite the high fouling levels that accumulate over time at this study site, and provided 1-, 2- and 3-month controls.
Panels were immersed in spring (28 March 2017) at the Florida Institute of Technology static immersion site at Port Canaveral, Fl (Figure 3). Panels were immersed with their centers at 0.5 m depth. The experiment ran for 20 months. During the experimental period, one hurricane evacuation occurred, in which samples were removed from the water during transit to and from the evacuation site. The evacuation site was through the locks in the Indian River Lagoon and consisted of considerably different water conditions. No assessments were performed while the samples were at the evacuation site.
Visual assessment was performed monthly according to ASTM D6990. For assessment, frames were removed from the water and photographed with sleeves in place. Sleeves were removed, and the panels and end caps were photographed. Visual assessment was performed on the panels in the field to determine the cover of organisms attached directly to the panel surface. Results were reported as percent cover of macrofouling and composition of fouling rather than the fouling rating indicated in the standard. Panels were also visually assessed for corrosion or other signs of physical degradation.
Water quality was measured monthly in situ. During an assessment, a port on the top cap was unscrewed, and water quality probes were inserted one at a time. Yellow Springs Instruments (YSI) ProODO, Pro10 and Pro30 probes were used to measure dissolved oxygen, pH and temperature, and salinity within the sleeves, respectively. Open readings were taken as controls throughout sampling (one at the start, one in the middle and the final at the end, for a total of three readings). The only time these frames were removed during the experiment was during a hurricane evacuation six months after immersion. When samples were returned to Port Canaveral, a visual assessment was performed on the panels, and water quality sampling continued monthly with no additional disturbance.
Water quality parameters (temperature, salinity, dissolved oxygen and pH) were compared among treatments using one-way ANOVA (SigmaPlot 11). Assumptions for normality and equal distribution were met. The p-value was set at 0.05 for significance. Post hoc testing determined where significant differences lay. Data from the visual assessments were not normally distributed because of the high number of 0 values for percent cover in the sleeve treatments throughout the experiment. ANOVA could not be used effectively, so a principal components analysis (PCA, Primer7) was used to compare fouling cover for the fouling communities among treatments. Diversity measures, including number of taxa, number of individuals, species richness, evenness, Shannon index and Hill index, were calculated in Primer7 and analyses were performed using Kruskal–Wallis one-way ANOVA on ranks (p < 0.05).

3. Results

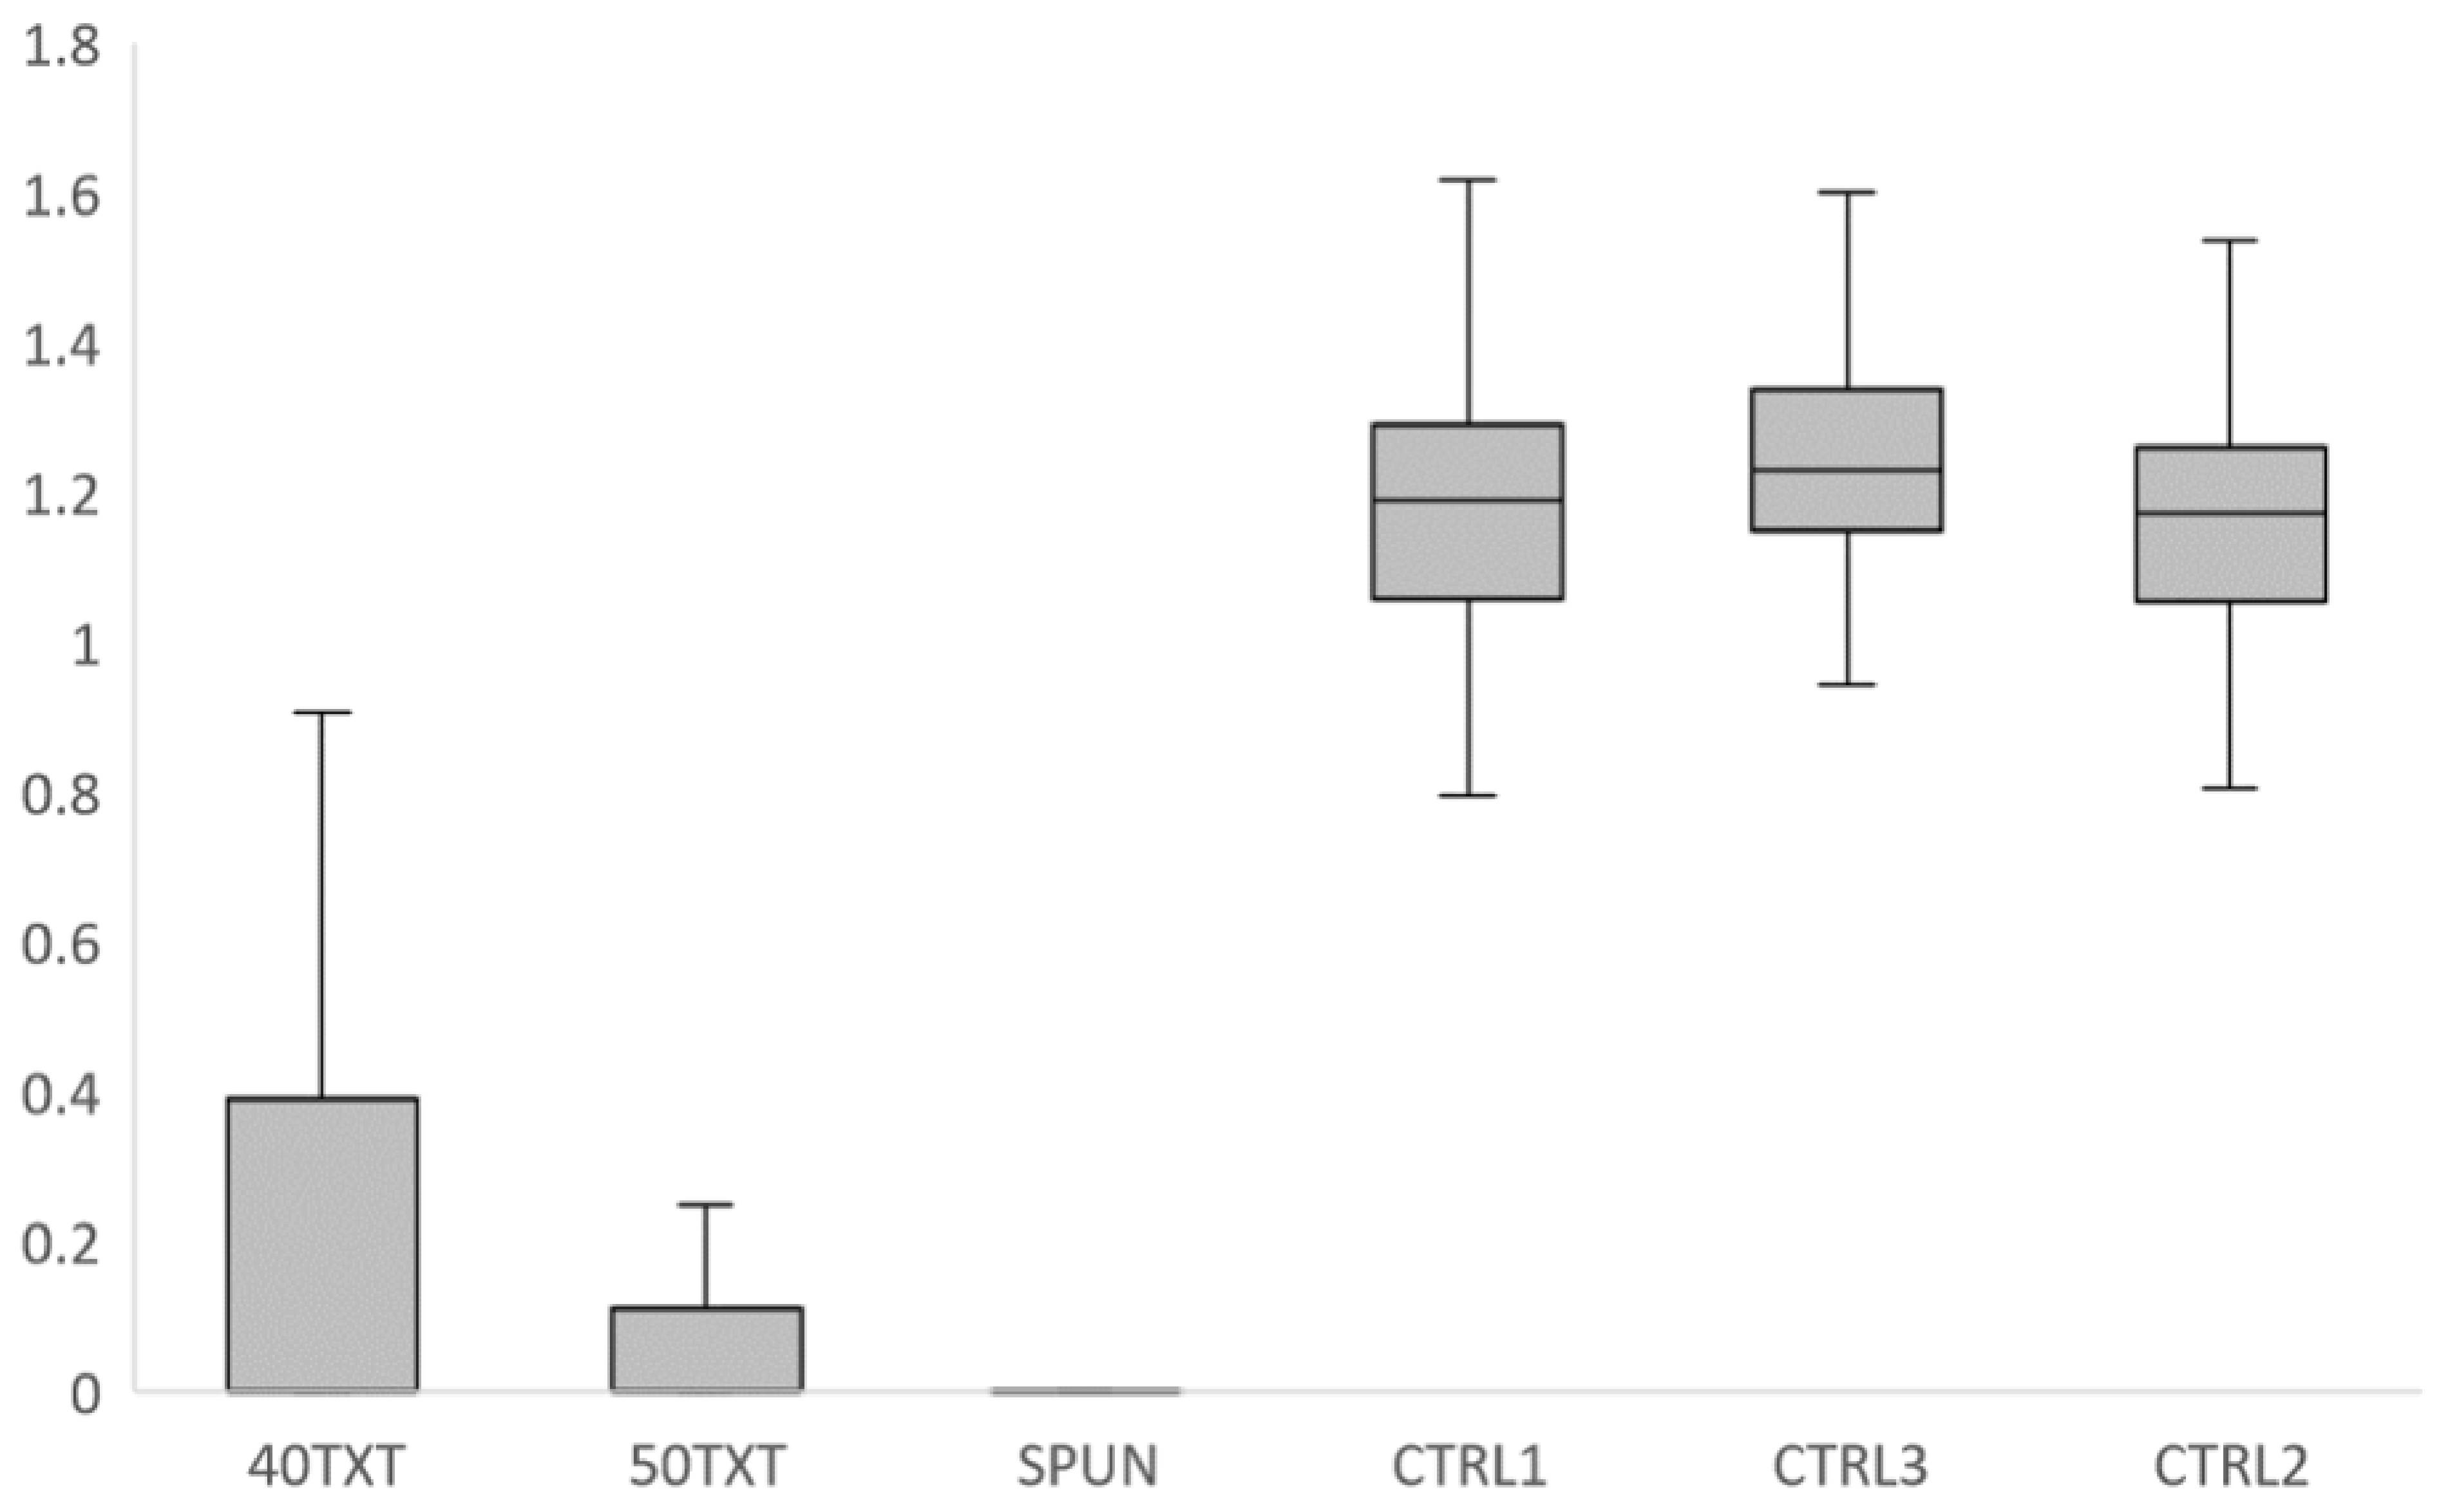
Permeability and the number of pores differed among the treatments (Table 1). Standard error (stderr) was calculated using the following equation:
s t d e r r = s t a n d a r d   d e v i a t i o n s a m p l e   s i z e
The two TXT fabrics had significantly higher numbers of pores per square inch than the Spun. Similarly, the TXT fabrics had significantly higher levels of permeability than the Spun fabric.
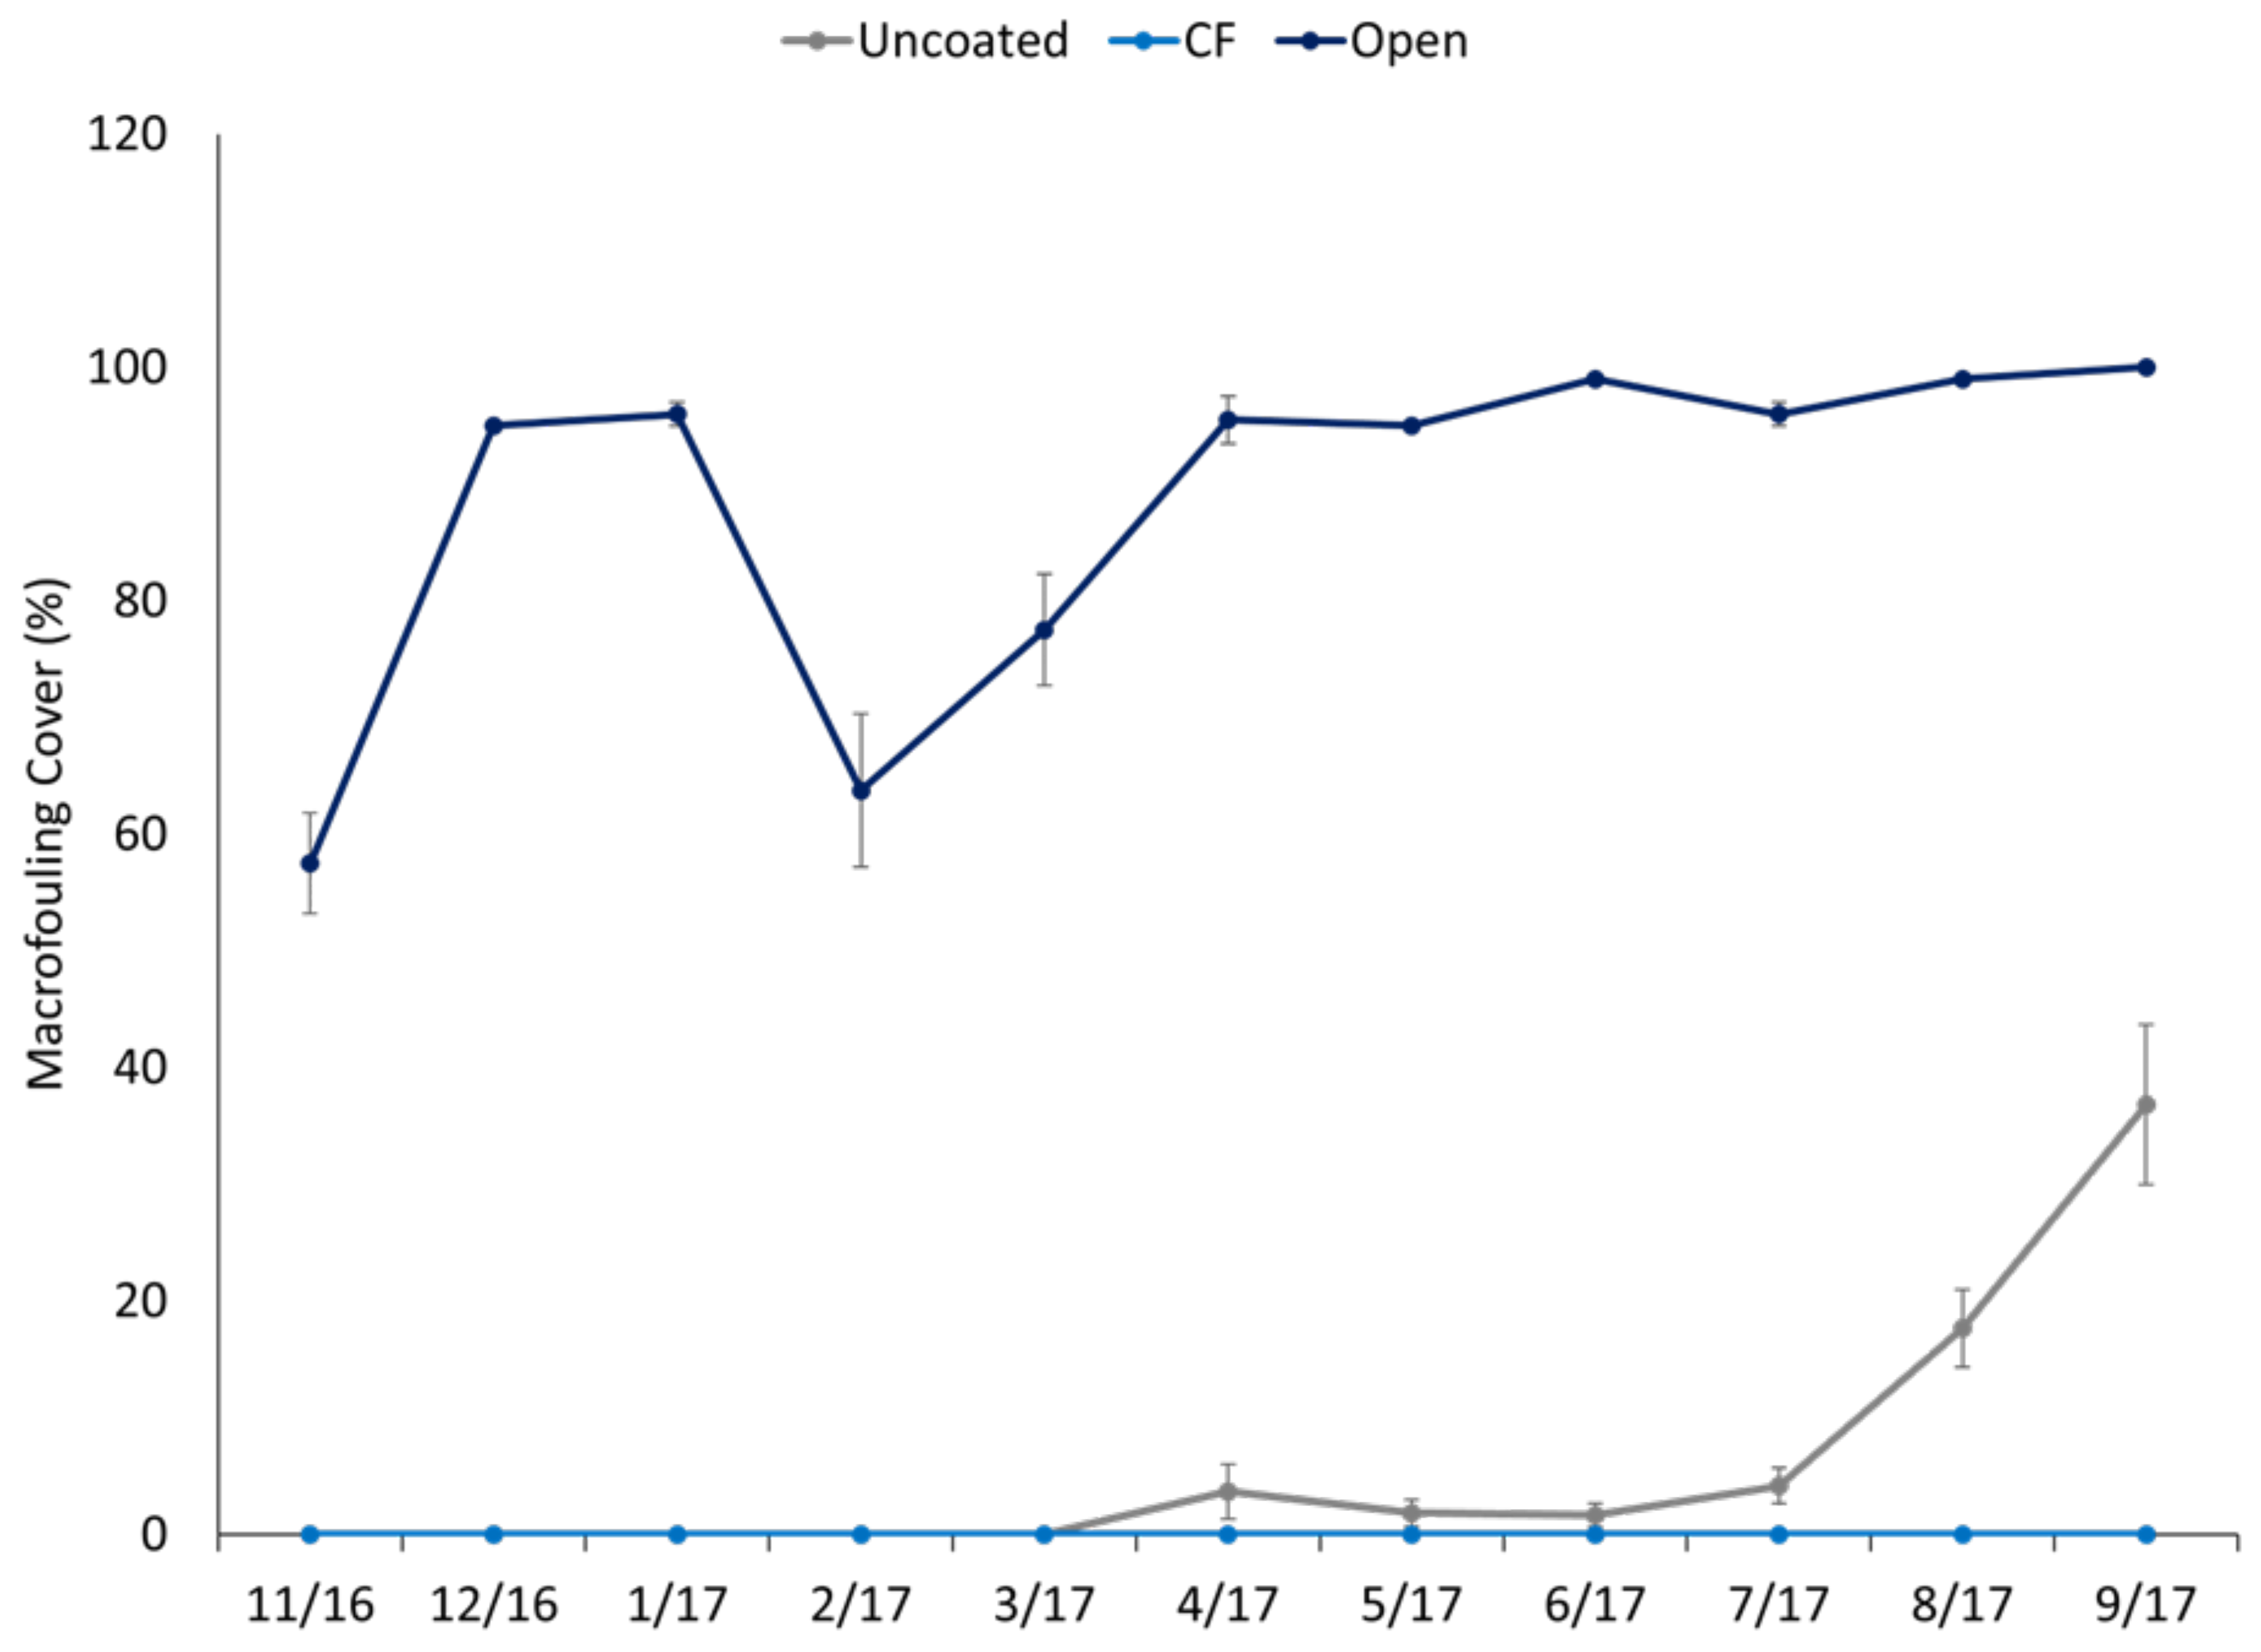
There was no macrofouling on any of the bronze bars in the sleeves for the first eight months of immersion (Figure 4). In month nine of immersion, the 40TXT started to accumulate very low cover (<2%) of hydroids and tube worms (Figure 5). The 50TXT and Spun sleeves prevented any macrofouling until 13 months of immersion. Fouling on the bars inside sleeves never covered more than 5% of the surface and covered less than 2%, on average. Macrofouling inside the sleeves consisted of hydroids, arborescent bryozoans, and tube worms only. The control surfaces fouled heavily from the first month of immersion, with macrofouling cover exceeding 80%. The fouling community on the control bars varied seasonally, and included algae, hydroids, encrusting and arborescent bryozoans, barnacles, tube worms, oysters, and tunicates. Over the course of the immersion, no corrosion or physical degradation was observed on the protected panels. The control panels were only immersed for 3 months at a time and were so heavily fouled at the end of the immersion that minor corrosion would not have been visible. However, no major degradation or corrosion was observed on the control panels.
The differences in fouling can be seen in the principal components analysis (Figure 6). The treatment surfaces in the sleeves clustered together while the control surfaces split into several groups but were always distinct from the sleeves, regardless of the treatment type. The first principal component was responsible for 70.5% of the variability and was primarily due to macrofouling cover. The second principal component was responsible for 14.9% of the variability and was primarily due to arborescent bryozoans. The third principal component was responsible for 8% of the variability and was mostly due to the cover of encrusting bryozoans.
Diversity analysis was performed using a Kruskal–Wallis one-way analysis of variance on ranks. Across all treatments, there was a significant (p < 0.001) difference in median values when examining the number of species, total coverage, species richness, evenness, Shannon Index, and Hill Index values (Figure 7 and Figure 8). Pairwise comparison using Dunn’s method revealed that for all examined diversity measures, the three treatment groups were significantly different from the controls (p < 0.05). In contrast, the controls did not vary significantly based on the immersion length of the control.
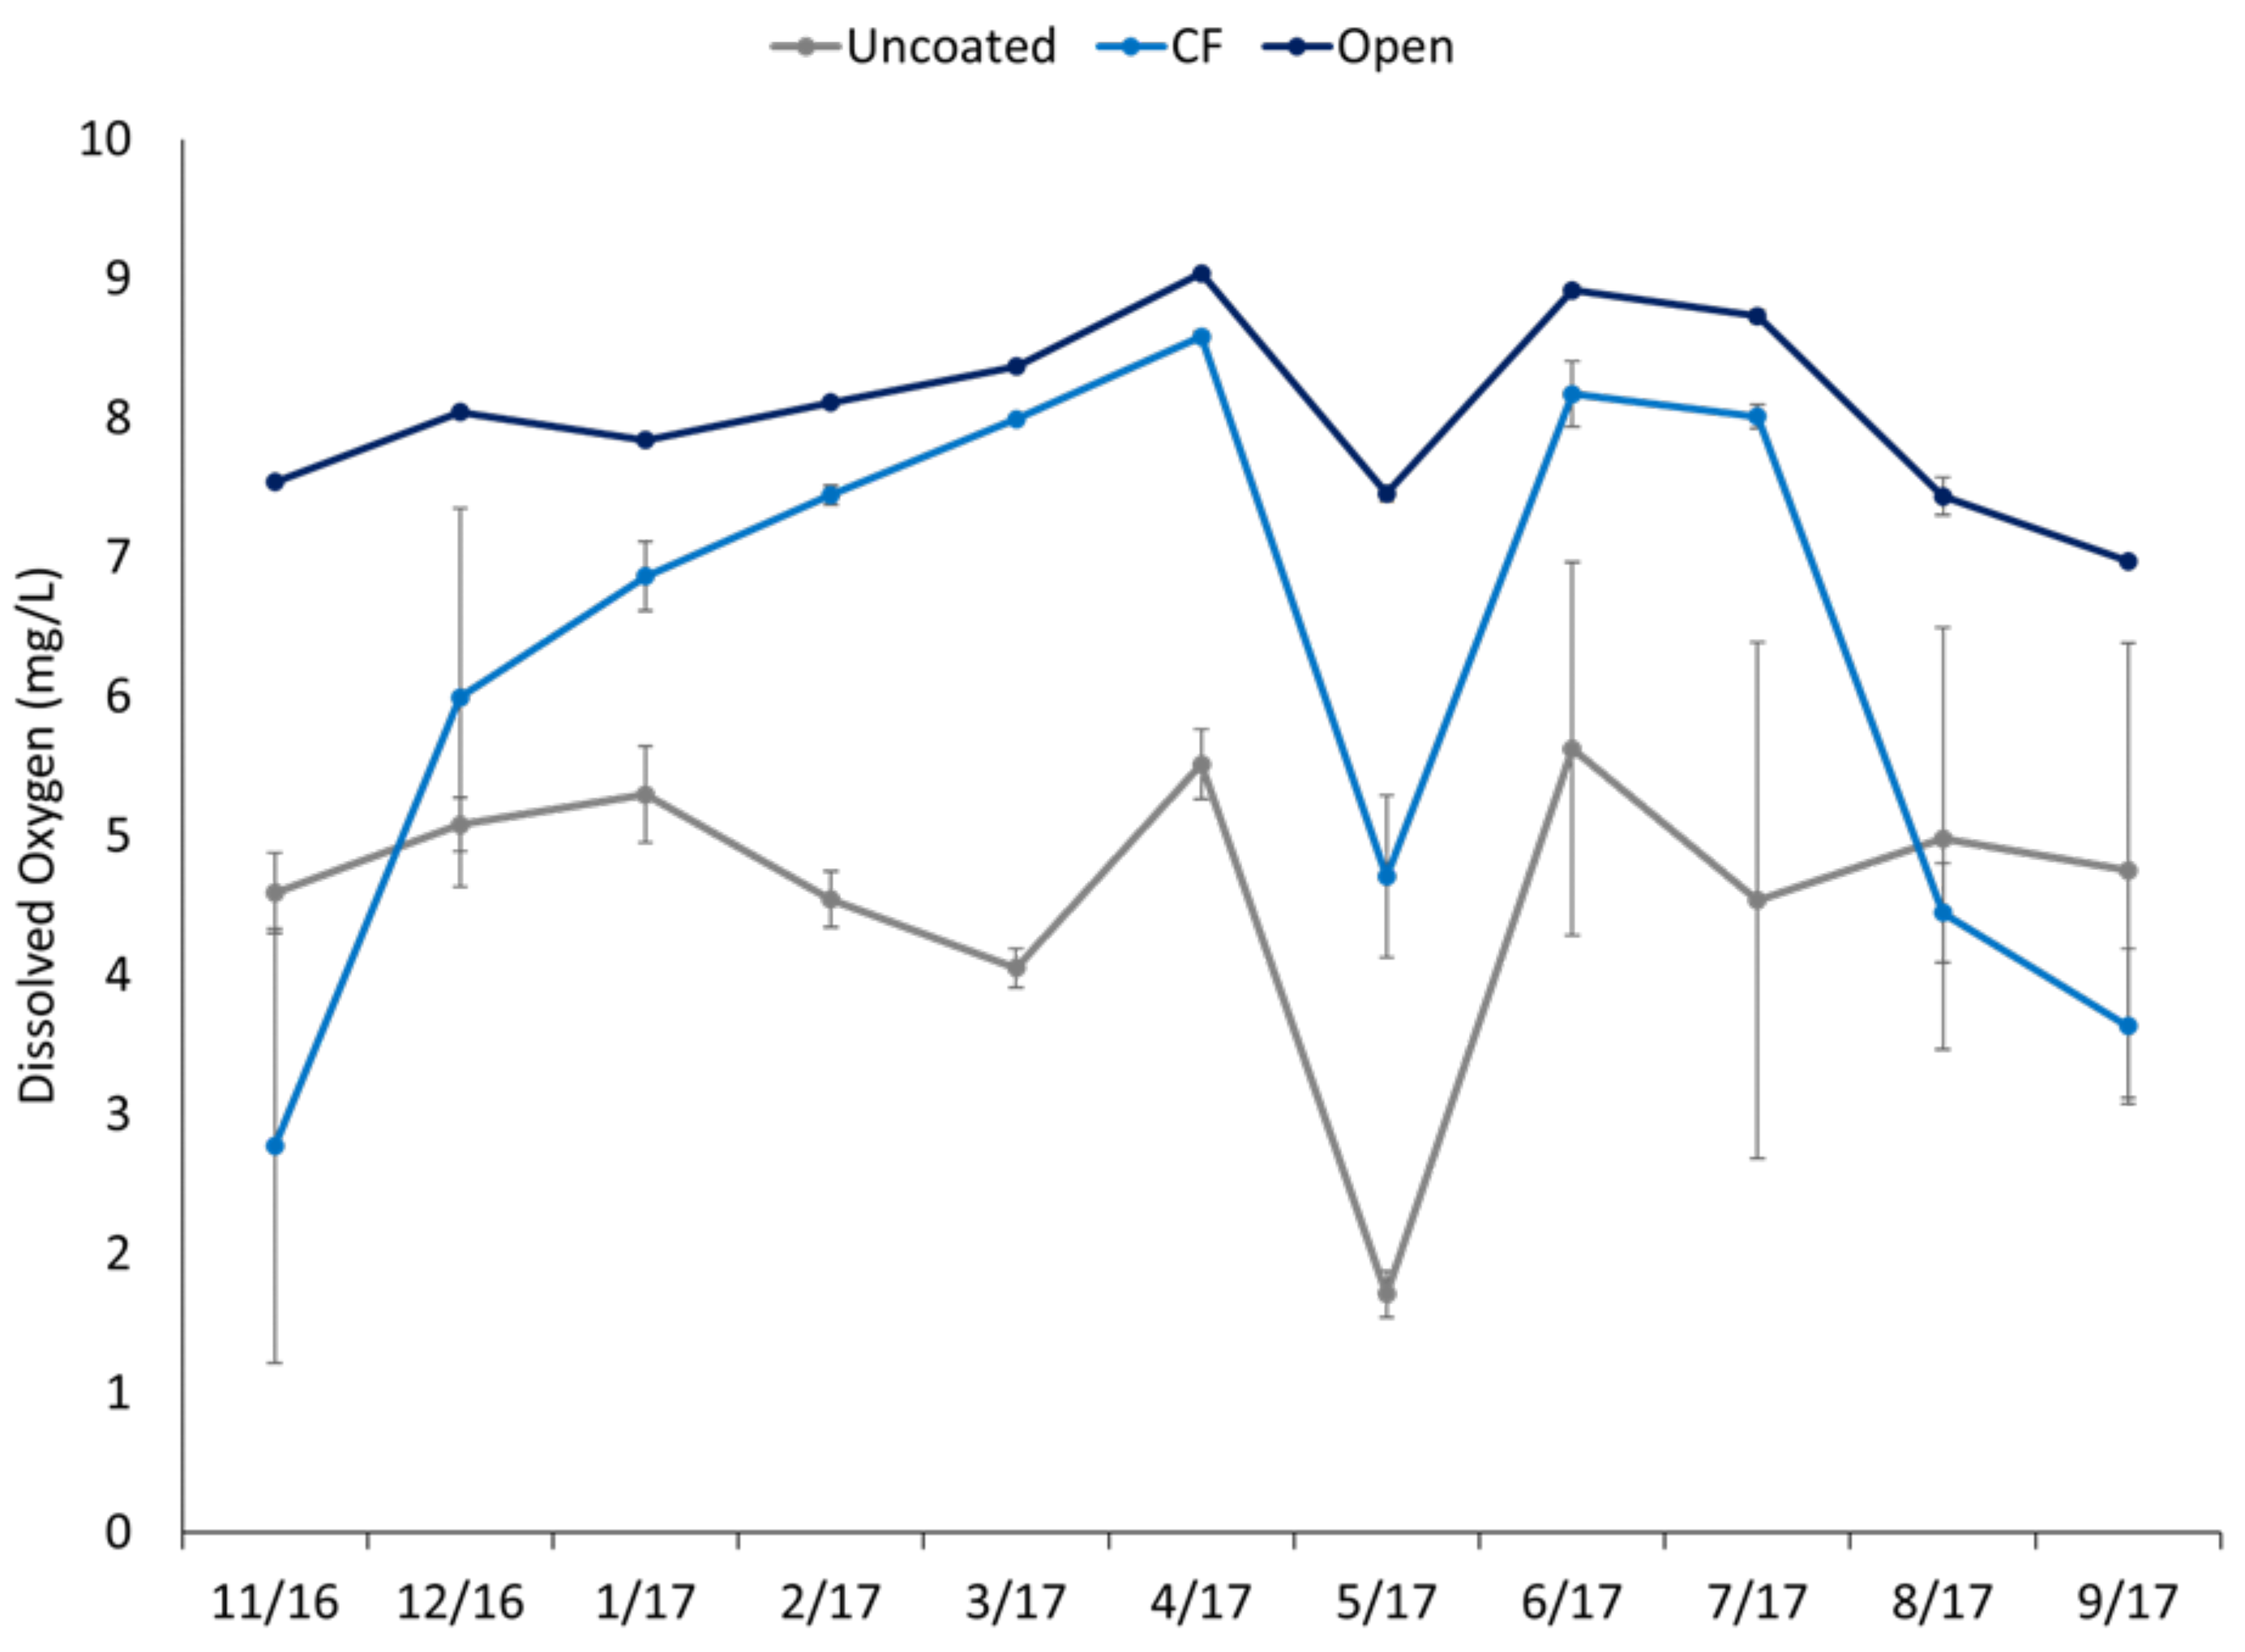
Water quality varied significantly between the sleeves and the open readings (Figure 9). Dissolved oxygen was significantly lower in the sleeves than in the open readings. Dissolved oxygen was significantly lower in the Spun sleeves than in the open readings in all months and lower than the two other treatments in all but 5 months. The TXT sleeves had significantly lower oxygen than the open readings starting in August 2017. However, after reimmersion following the hurricane evacuation, DO became more similar between the TXT sleeves and open readings until January 2018. Dissolved oxygen was significantly higher in the open readings than in the TXT sleeves for the remainder of the experiment except the last month. Temperature and salinity never varied significantly inside or outside of the sleeves in any sampling months. The pH only varied significantly in three months: June, September and October 2018. In June, pH was significantly higher in Spun than open. In September, open had significantly higher pH than all other treatments. In October, open had significantly higher pH than Spun.

4. Discussion

The sleeves completely protected propeller mimic panels from macrofouling for a minimum of 8 months and a maximum of 13 months. Traditional biocide containing antifouling coatings has been shown to accumulate fouling after 2–4 months at this site in previous studies [29]. Even after macrofouling began to accumulate, the cover and diversity of fouling were low compared to unprotected control surfaces. The cover on protected panels never exceeded 5% over the 20 months of immersion. The only organisms that settled on protected bars were the arborescent bryozoans Bugula neritina in the 40TXT and 50TXT and tube worms Hydroides sp. and Spirorbis spp. in all sleeves.
Encapsulation, when used as mitigation in response to an already fouled surface, is theorized to work because of the creation of anoxic conditions [5,6,12,17,18,19,20,21]. The sleeves, especially the Spun, had decreases in dissolved oxygen compared to open readings. Dissolved oxygen did not dip into anoxic conditions and only became hypoxic or nearly hypoxic in spring 2018, 15 months after immersion. Settling larvae may detect the decreased oxygen, although the levels measured should not have caused mortality. This will be investigated in future studies, to determine whether larvae are dying or just not settling/recruiting.
The number of pores and the permeability of the different treatments could be used to predict changes in dissolved oxygen. The Spun had a significantly lower permeability and fewer pores per square inch than the other two treatments. In 15 of 20 months, Spun had significantly lower dissolved oxygen than the other two treatments. Rarely did the dissolved oxygen vary between the 40TXT and 50TXT.
Typically, a decrease in dissolved oxygen is followed by a decrease in pH. In this experiment, pH only varied significantly in three months. This variation may have been an artifact of sampling, which occurred at discrete times. Therefore, additional changes in pH may have been missed. Conversely, it may have been due to the magnitude of the decrease in DO. The majority of significant pH changes occurred in the experiment’s final months when DO was lowest and approaching or within the hypoxic zone. Anoxia and hypoxia can cause materials to degrade because of decreases in pH and changes in the protective, passivating film on metals enhancing corrosion [30,31]. An impermeable wrap or sleeve works by creating an anoxic environment, which could cause the enclosed materials to degrade. Additionally, any physical damage that goes through the impermeable wrap opens the protected surfaces to fouling, at least near the damage [6,21]. There was no visible degradation of the bronze panels in this experiment and fouling was prevented for over a year.
The treatments differed in appearance. The TXT treatments had smooth fibers, while the Spun treatments had rougher fibers with strands of coated material partially and fully blocking the pores. These differences would increase the likelihood that settling larvae would contact biocide-coated mesh rather than an open pore. Incidental contact with the fabric on the way into the sleeves would potentially have decreased the fitness of settling larvae or acted as a deterrent.
In previous long- and short-term experiments, bare fabric was tested (unpublished data, Appendix A). Macrofouling began to accumulate on panels in as little as one to two months. The bare fabric also quickly became heavily fouled with a community that matched the fouling on the control panels. This fouling was heavy enough to deform the sleeves and cause failure due to sleeves slipping, exposing the panels to fouling. This heavy covering of macrofouling caused dissolved oxygen to decrease over the course of a few months until they reached hypoxic and anoxic levels. The fabric with the biocide, conversely, protected the panels for over a year without dissolved oxygen entering the hypoxic or anoxic condition.
Since the banning of tributyl tin in 2008, increased attention has been paid to biocides in antifouling and their impacts on the environment and non-target species. The biocides utilized in this experiment were selected because they are considered “green” or more environmentally friendly. They are known to break down quickly under natural environmental conditions [10,32,33]. To prevent translocation of non-indigenous species, decrease the production of greenhouse gases, and decrease maintenance and operational costs, there is a strong emphasis on maintaining ship hulls and other surfaces in a clean, fouling-free condition as a best management practice [13,14,24,26,27,28]. Instruments and other sensitive static structures experience degraded performance with even small amounts of fouling. Often, these structures are not easily accessible and may go long periods of time (6–12 months) without maintenance. This patent-pending technology offers long-term fouling protection of up to a year or more to ships and other structures while they are static and most susceptible to fouling. The novel coated fabric design allows for easy installation and is effective for long periods of time without maintenance or replacement. This protection should prove scalable, adaptable and configurable to any surface in need of protection, including niche areas, instruments, and other structures that are not well protected using traditional antifouling methods including pilings, chains, slow moving ships, barges, etc.
In conclusion, sleeves were very effective at protecting surfaces from macrofouling for extended periods of time. This protection may be attributed to decreases in dissolved oxygen, filtering of larger larvae, the likelihood of contacting a biocide-coated surface on the tortuous path to the panel or, more likely, a combination of factors. Future experiments will look more deeply into the mechanisms and limits of this effect and begin to examine application-specific designs.

Author Contributions

Each author has provided contributions. E.R. provided conceptualization, methodology, validation, formal analysis, investigation, writing, project administration, funding acquisition and supervision. S.P. provided formal analysis, data curation and writing. All authors have read and agreed to the published version of the manuscript.

Funding

This research was funded by Biofouling Technologies, Inc.

Institutional Review Board Statement

Not applicable.

Data Availability Statement

Data may be available upon request.

Acknowledgments

We would like to acknowledge the inexhaustible field and lab support from Abe Stephens and colleagues at Florida Tech.

Conflicts of Interest

The authors declare no conflict of interest.

Appendix A

Figure A1. Macrofouling cover on propeller mimics over an 11-month immersion. These are unpublished data used to illustrate the shorter effect of uncoated fabric. The coated fabric (CF) lasted a similar amount of time to the samples extensively reported on in this manuscript. Error bars represent one standard error.
Jmse 11 01947 g0a1
Figure A2. Dissolved oxygen (mg/L) in uncoated fabric sleeves, coated fabric sleeves (CF) and open. The DO in the uncoated sleeve quickly drops and remains low through the immersion and enters the hypoxic region. Low oxygen can lead to material degradation. Error bars represent one standard error.
Jmse 11 01947 g0a2
Figure A3. Selected images of fouling under different fabric combinations. The top row shows coated fabrics, and the bottom fabrics are uncoated. Images (AE) were taken after 31 days immersion. Images (F,G) were taken after 23 days immersion in a different experiment. The circles measure 7.5 cm diameter. The PVC under the coated fabrics had no visible macrofouling. The PVC with uncoated fabric had developed macrofouling. The TXT (D) had tube worms and hydroid. The Spun (F) had hydroid in the upper left. The open PVC was heavily fouled with arborescent bryozoans, barnacles, tube worms, and tunicates.
Jmse 11 01947 g0a3

References

  1. Dafforn, K.; Lewis, J.; Johnston, E. Antifouling strategies: History and regulation, ecological impacts and mitigation. Mar. Poll. Bull. 2011, 62, 453–465. [Google Scholar] [CrossRef] [PubMed]
  2. Floerl, O.; Inglis, G. Boat harbour design can exacerbate hull fouling. Aust. Ecol. 2003, 28, 116–127. [Google Scholar] [CrossRef]
  3. Floerl, O.; Inglis, G.; Marsh, H. Selectivity in vector management: An investigation of the effectiveness of measures used to prevent transport of non-indigenous species. Biol. Invasion 2005, 7, 459–475. [Google Scholar] [CrossRef]
  4. Piola, R.; Dafforn, K.; Johnston, E. The influence of antifouling practices on marine invasions. Biofouling 2009, 25, 633–644. [Google Scholar] [CrossRef] [PubMed]
  5. Roche, R.; Monnington, J.; Newstead, R.; Sambrook, K.; Griffith, K.; Holt, R.; Jenkins, S. Recreational vessels as a vector for marine non-natives: Developing biosecurity measures and managing risk through an in-water encapsulation system. Hydrobiologia 2015, 750, 187–199. [Google Scholar] [CrossRef]
  6. Hopkins, G.; Davidson, I.; Georgiades, E.; Floerl, O.; Morrisey, D.; Cahill, P. Managing biofouling on submerged static artificial structures in the marine environment-assessment of current and emerging approaches. Front. Mar. Sci. 2021, 8, 759194. [Google Scholar] [CrossRef]
  7. Floerl, O.; Atalah, J.; Bugnot, A.; Chandler, M.; Dafforn, K.; Floerl, L.; Zaiko, A.; Major, R. A global model to forecast coastal hardening and mitigate associated socioecological risks. Nat. Sustain. 2021, 4, 1060–1067. [Google Scholar] [CrossRef]
  8. Davidson, I.; Ruiz, G.; Scianni, C.; Hewitt, C.; Everett, R.; Holm, E.; Tamburri, M. Assessing the drivers of ship biofouling management-aligning industry and biosecurity goals. Biofouling 2016, 32, 411–428. [Google Scholar] [CrossRef]
  9. Zabin, C.; Davidson, I.; Holzer, K.; Smith, G.; Ashton, G.; Tamburri, M.; Ruiz, G. How will vessels be inspected to meet emerging biofouling regulations for the prevention of marine invasions? Manag. Biol. Invasion 2018, 9, 195–208. [Google Scholar] [CrossRef]
  10. Weber, F.; Esmaeili, N. Marine biofouling and the role of biocidal coatings in balancing environmental impacts. Biofouling 2023, 39, 661–681. [Google Scholar] [CrossRef]
  11. Murray, C.; Pakhomov, E.; Therriault, T. Recreational boating: A large unregulated vector transporting marine invasive species. Biodivers. Res. 2011, 17, 1161–1172. [Google Scholar] [CrossRef]
  12. Cook, E.; Payne, R.; Macleod, A.; Brown, S. Marine biosecurity: Protecting indigenous marine species. Res. Rep. Biodivers. Stud. 2016, 5, 1–14. [Google Scholar] [CrossRef]
  13. Georgiades, E.; Kluza, D. Evidence-based decision making to underpin the thresholds in New Zealand’s craft risk management standard: Biofouling on vessels arriving to New Zealand. Mar. Technol. Soc. J. 2017, 51, 76–88. [Google Scholar] [CrossRef]
  14. Moser, C.; Wier, T.; First, M.; Grant, J.; Riley, S.; Robbins-Wamsley, S.; Tamburri, M.; Ruiz, G.; Miller, A.; Drake, I. Quantifying the extent of niche areas in the global fleet of commercial ships: The potential for “super-hot spots” of biofouling. Biol. Invasions 2017, 19, 1745–1759. [Google Scholar] [CrossRef]
  15. Ashton, G.; Boos, K.; Shucksmith, R.; Cook, E. Risk assessment of hull fouling as a vector for marine non-natives in Scotland. Aquat. Invaions 2006, 1, 214–218. [Google Scholar] [CrossRef]
  16. Davidson, I.; McCann, L.; Fofonoff, P.; Sytsma, M.; Ruiz, G. The potential for hull-mediated species transfers by obsolete ships on their final voyages. Divers. Distrib. 2008, 14, 518–529. [Google Scholar] [CrossRef]
  17. Hopkins, G.; Forrest, B. Management options for vessel hull fouling: An overview of risks posed by in-water cleaning. ICES J. Mar. Sci. 2008, 65, 811–815. [Google Scholar] [CrossRef]
  18. Atalah, J.; Brook, R.; Cahill, P.; Fletcher, L.; Hopkins, G. It’s a wrap: Encapsulation as a management tool for marine biofouling. Biofouling 2016, 32, 277–286. [Google Scholar] [CrossRef]
  19. Growcott, A.; Kluza, D.; Georgiades, E. In-water systems to reactively manage biofouling in sea chests and internal pipework. Mar. Technol. Soc. J. 2017, 51, 89–104. [Google Scholar] [CrossRef]
  20. Keanly, C.; Robinson, T. Encapsulation as a biosecurity tool for managing fouling on recreational vessels. Aquat. Invasion 2020, 15, 81–97. [Google Scholar] [CrossRef]
  21. Ammon, U.; Swift, L.; Brand, S.; Jeffs, A.; Swift, S. Review of In-Water Hull Encapsulation and Enclosure Treatments for Eliminating Marine Biofouling; MPI Technical Paper No: 2019/06; Ministry of Primary Industries: Wellington, New Zealand, 2019; ISBN 978-1-98-859441-5.
  22. McKenzie, C.; Matheson, K.; Reid, V.; Wells, T.; Mouland, D.; Green, D.; Pilgrim, B.; Perry, G. The development of a rapid response plan to control the spread of the solitary invasive tunicate, Ciona intestinalis (Linneaus, 1767), in Newfoundland and Labrador, Canada. Manag. Biol. Invasions 2016, 7, 87–100. [Google Scholar] [CrossRef]
  23. Inglis, G.; Floerl, O.; Woods, C. Scenarios of Vessel Biofouling Risk and Their Management; MAF Technical Paper No: 2012/07; Ministry of Agriculture and Forestry: Wellington, New Zealand, 2012. [CrossRef]
  24. IMO. Guidelines for the control and management of ships’ biofouling to minimizing the transfer of invasive species. In Marine Environment Protection Committee; Annex 26, Resolution MEPC.207(62); International Maritime Organization: London, UK, 2011; 25p. [Google Scholar]
  25. Bailey, S.; Brown, L.; Campbell, M.; Canning-Clode, J.; Carlton, J.; Castro, N.; Chainho, P.; Chan, F.; Creed, J.; Curd, A.; et al. Trends in the detection of aquatic non-indigenous species across global marine, estuarine and freshwater ecosystems: A 50-year perspective. Biodivers. Res. 2020, 26, 1780–1797. [Google Scholar] [CrossRef] [PubMed]
  26. Georgiades, E.; Kluza, D.; Bates, T.; Lubarsky, K.; Brunton, J.; Growcott, A.; Smith, T.; McDonald, S.; Gould, B.; Parker, N.; et al. Regulating vessel biofouling to support New Zealand’s marine biosecurity system—A blue print for evidence-based decision making. Front. Mar. Sci. 2020, 7, 390. [Google Scholar] [CrossRef]
  27. McClay, T.; Zabin, C.; Davidson, I.; Young, R.; Elam, D. Vessel Biofouling Prevention and Management Options Report; United States Coast Guard: Washington, DC, USA, 2015. [Google Scholar]
  28. Scianni, C.; Georgiades, E. Vessel in-water cleaning or treatment: Identification of environmental risks and science needs for evidence-based decision making. Front. Mar. Sci. 2019, 6, 467. [Google Scholar] [CrossRef]
  29. Ralston, E.; Gardner, H.; Hunsucker, K.; Swain, G. The effect of grooming on five commercial antifouling coatings. Front. Mar. Sci. 2022, 9, 836555. [Google Scholar] [CrossRef]
  30. Little, B.; Lee, J.; Ray, R. The influence of marine biofilms on corrosion: A concise review. Electrochim. Acta 2008, 54, 2–7. [Google Scholar] [CrossRef]
  31. Kong, D.; Dong, C.; Xu, A.; Man, C.; He, C.; Li, X. Effect of sulfide concentration on copper corrosion in anoxic chloride-containing solutions. J. Mat. Engr. Perf. 2017, 26, 1741–1750. [Google Scholar] [CrossRef]
  32. Paz-Villarraga, C.; Castro, I.; Fillmann, G. Biocides in antifouling paint formulations currently registered for use. Environ. Sci. Poll. Res. 2022, 29, 30090–30101. [Google Scholar] [CrossRef]
  33. Kim, H. Strategic actions for sustainable vessel hull coatins in line with UN SDGs. J. Adv. Mar. Eng. Technol. 2021, 45, 231–242. [Google Scholar] [CrossRef]
Figure 1. Photograph of the samples before installation of the sleeve and one of the frames just before immersion. (a) An example of a visual assessment sample. (b) An example of the water quality sample frame, with the sampling ports and caps visible.
Jmse 11 01947 g001
Figure 2. (a) Diagram of the permeability test apparatus. The pump sits in the bucket. The fabric sample is installed at the end of the pipe. The overflow pipe ensures that water pressure remains consistent throughout the test run. (bd) show microscope images of the different treatments. Magnification is 2× on the left and 4× on the right. Scale bars are 1000 μm for the 2× (left) images and 500 μm for the 4× (right) images. (b) 40TXT, (c) 50 TXT, (d) Spun.
Jmse 11 01947 g002
Figure 3. Map of study location at Port Canaveral and surrounding area on the east coast of central Florida. The map includes the location whither the barge was moved during a hurricane evacuation during the 6th month of immersion. The inset shows the Florida Tech research barge with immersion frames visible at the end of the barge.
Jmse 11 01947 g003
Figure 4. (a) Average cover of macrofouling on the propeller mimic panels over the 20-month immersion. Error bars represent one standard error. Assessment month and year are located on the x-axis. (b) Selected images of panels from the course of the experimental immersion.
Jmse 11 01947 g004
Figure 5. Comparison of fouling composition on the propeller mimic panels over the 20-month immersion. Data collection began in April 2017, one month after immersion and was completed in November 2018. Treatments are (a) 40TXT, (b) 50TXT, (c) Spun, (d) Control 1 mo, (e) Control 2 mo and (f) Control 3 mo. The gaps at the start of the two and three-month controls are before they were immersed in the first few months of the experiment.
Jmse 11 01947 g005
Figure 6. Principal components analysis (PCA) comparing fouling on the propeller mimic panels. Panels in the sleeves cluster into a single group. The control panels cluster loosely into several groups that are distinct from the treated panels.
Jmse 11 01947 g006
Figure 7. Box and whisker plot representing the number of fouling groups present on panels over the entire study period. The three treatments (40TXT, 50TXT, and SPUN) had a median of one fouling group, while the three controls (1, 2, and 3 months of immersion) had a median of 5 fouling groups present on the panels (p < 0.005). Boxes represent the 25–75% quartile, while whiskers represent the spread of all values.
Jmse 11 01947 g007
Figure 8. Box and whisker plot examining diversity based on the Shannon index. The three treatments (40TXT, 50TXT, and SPUN) had a median Shannon index value of 0, while the three controls (1, 2, and 3 months of immersion) had a median of 1.2–1.3, indicating that the controls had a more diverse community than the treatments (p < 0.005). Boxes represent the 25–75% quartile while whiskers represent the spread of all values.
Jmse 11 01947 g008
Figure 9. Water quality over the course of the experiment. Temperature and salinity never varied significantly among treatments, so these data were pooled and included in one figure (a). Dissolved oxygen (b,c) varied significantly in all months. pH (d) only varied significantly in three months. Error bars represent one standard error. Please note, y-axes vary based on the parameter.
Jmse 11 01947 g009
Table 1. Comparison of the pores per square inch and permeability of the three treatments. TXT treatments had significantly higher permeability and pores per square inch than the Spun. Stderr represents the standard error.
TreatmentPores/in2stderrPermeability (mL/cm2/s)stderr
40TXT546.652.4714.190.35
50TXT547.853.3213.910.69
Spun407.8317.412.470.33
Disclaimer/Publisher’s Note: The statements, opinions and data contained in all publications are solely those of the individual author(s) and contributor(s) and not of MDPI and/or the editor(s). MDPI and/or the editor(s) disclaim responsibility for any injury to people or property resulting from any ideas, methods, instructions or products referred to in the content.

