
Effectiveness of Dune Reconstruction and Beach Nourishment to Mitigate Coastal Erosion of the Ebro Delta (Spain)


Abstract
:1. Introduction
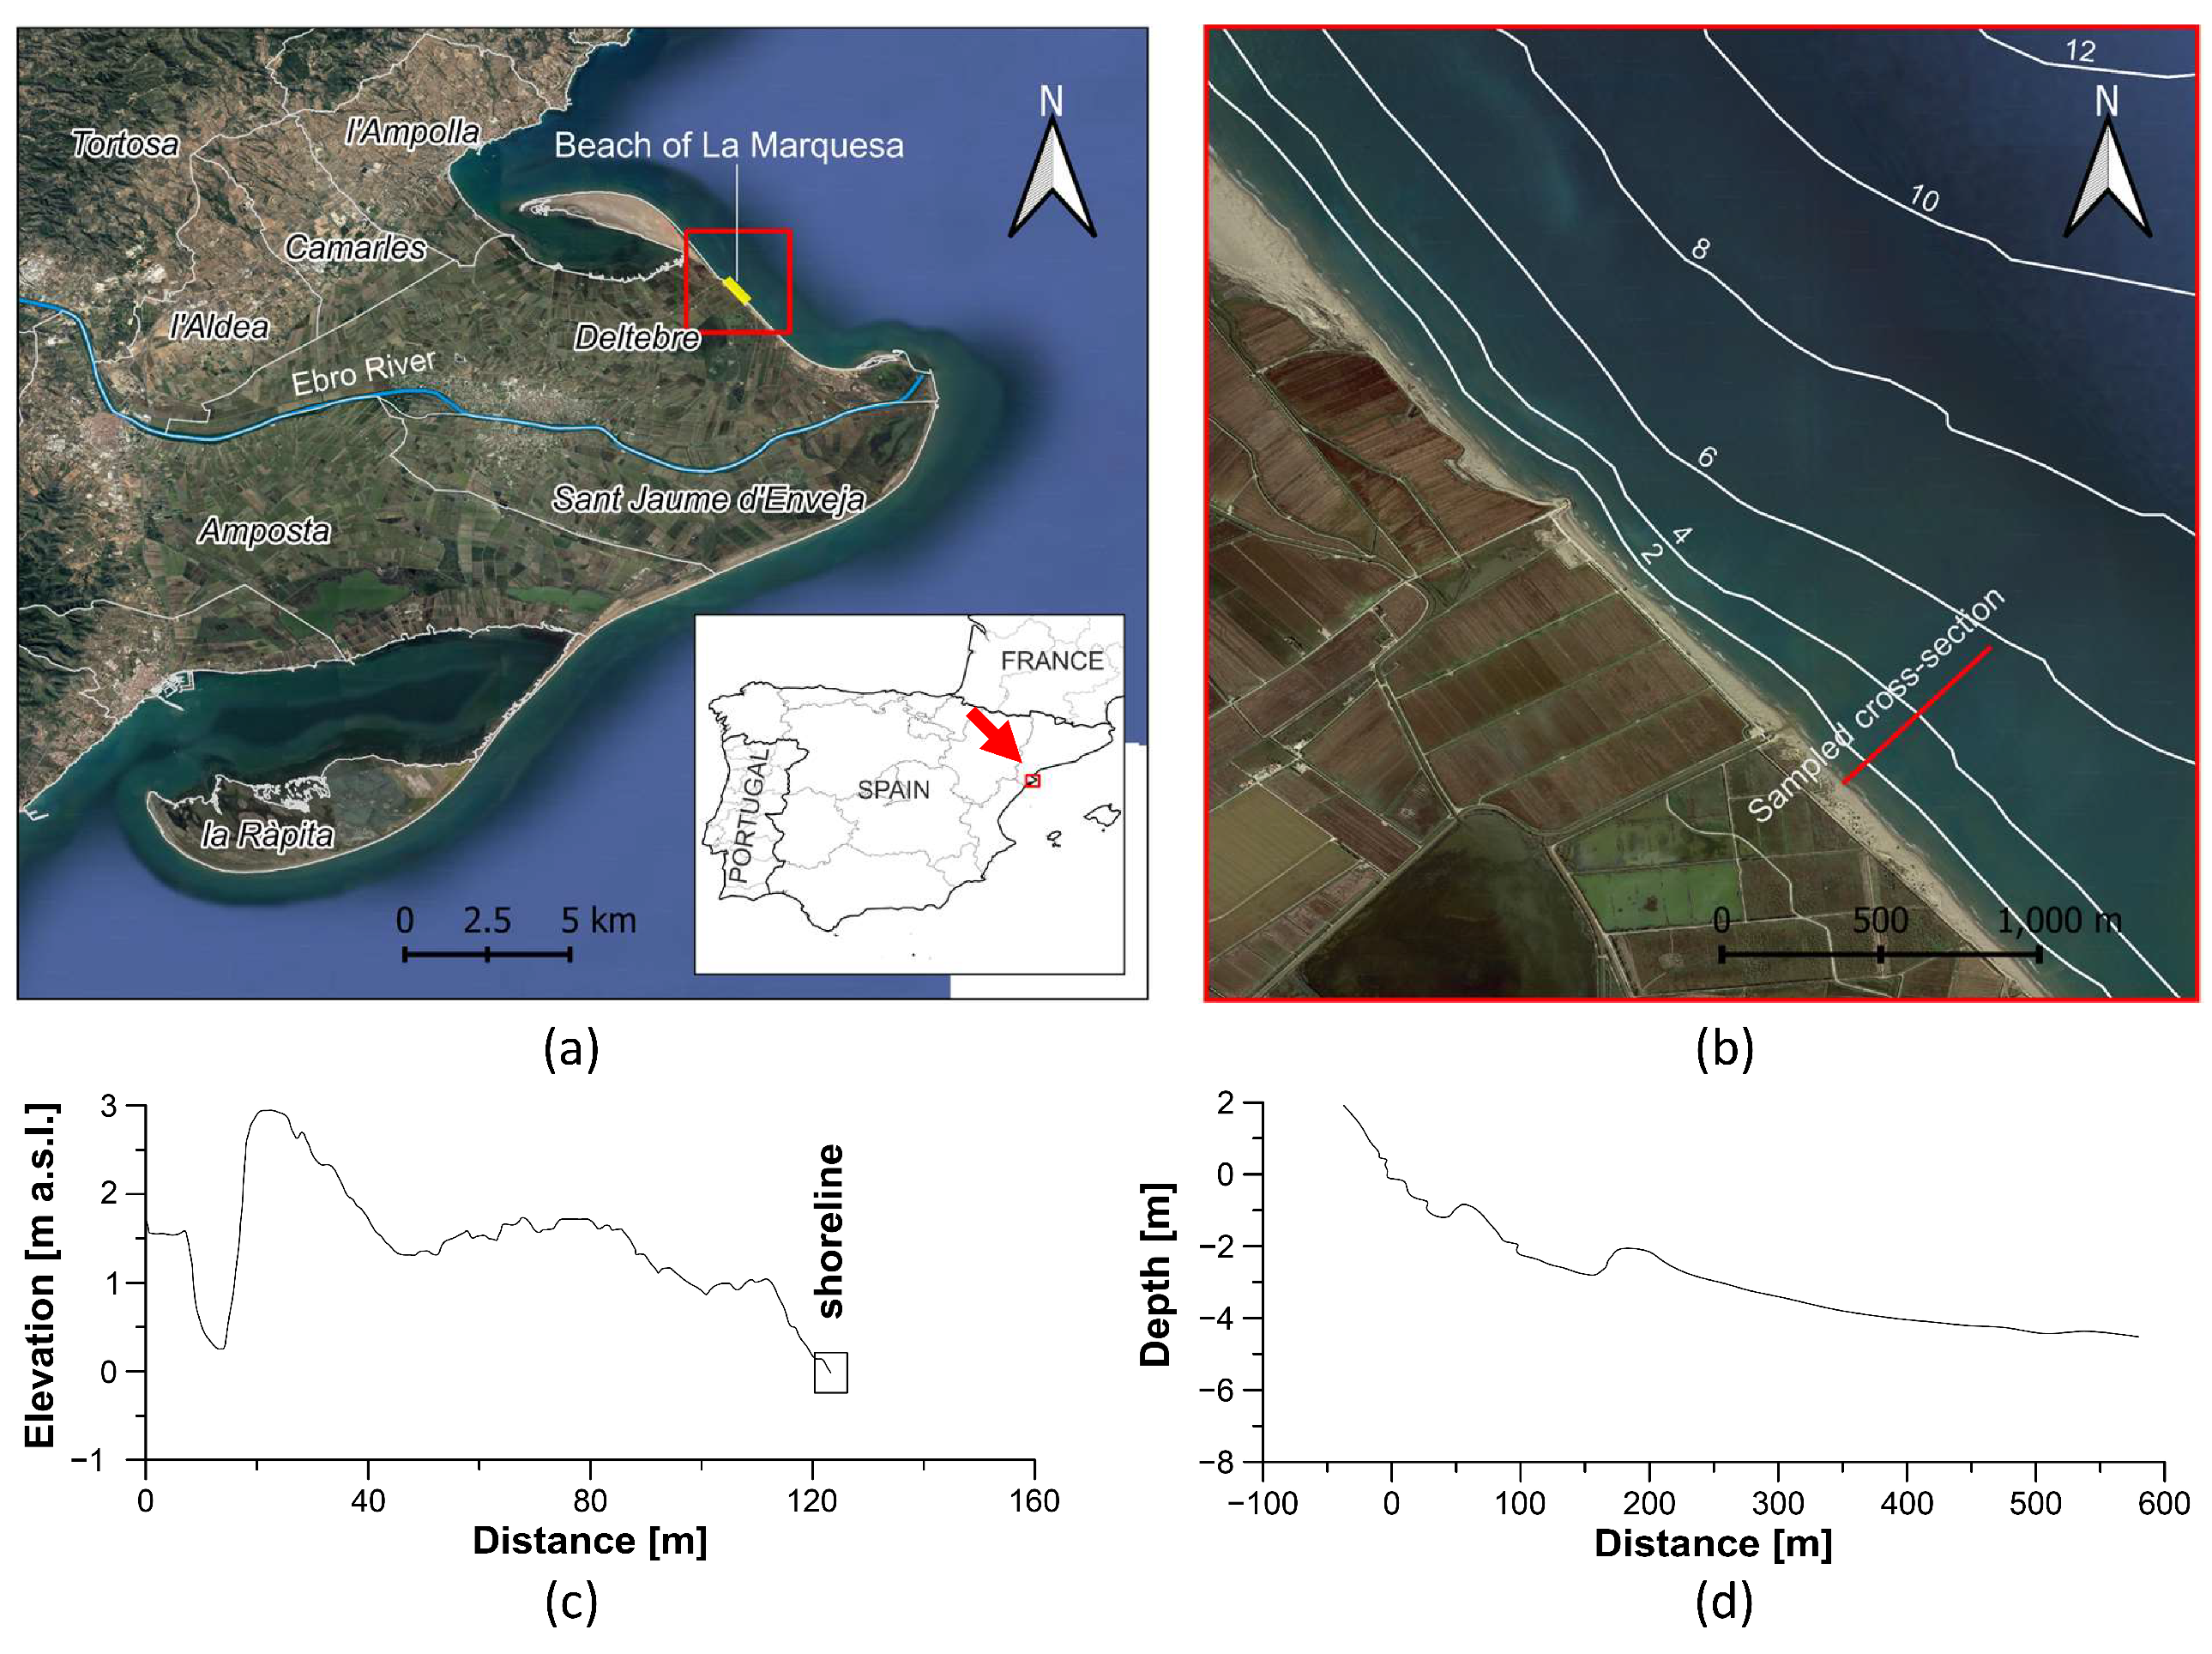
2. Case Study
3. Materials and Methods
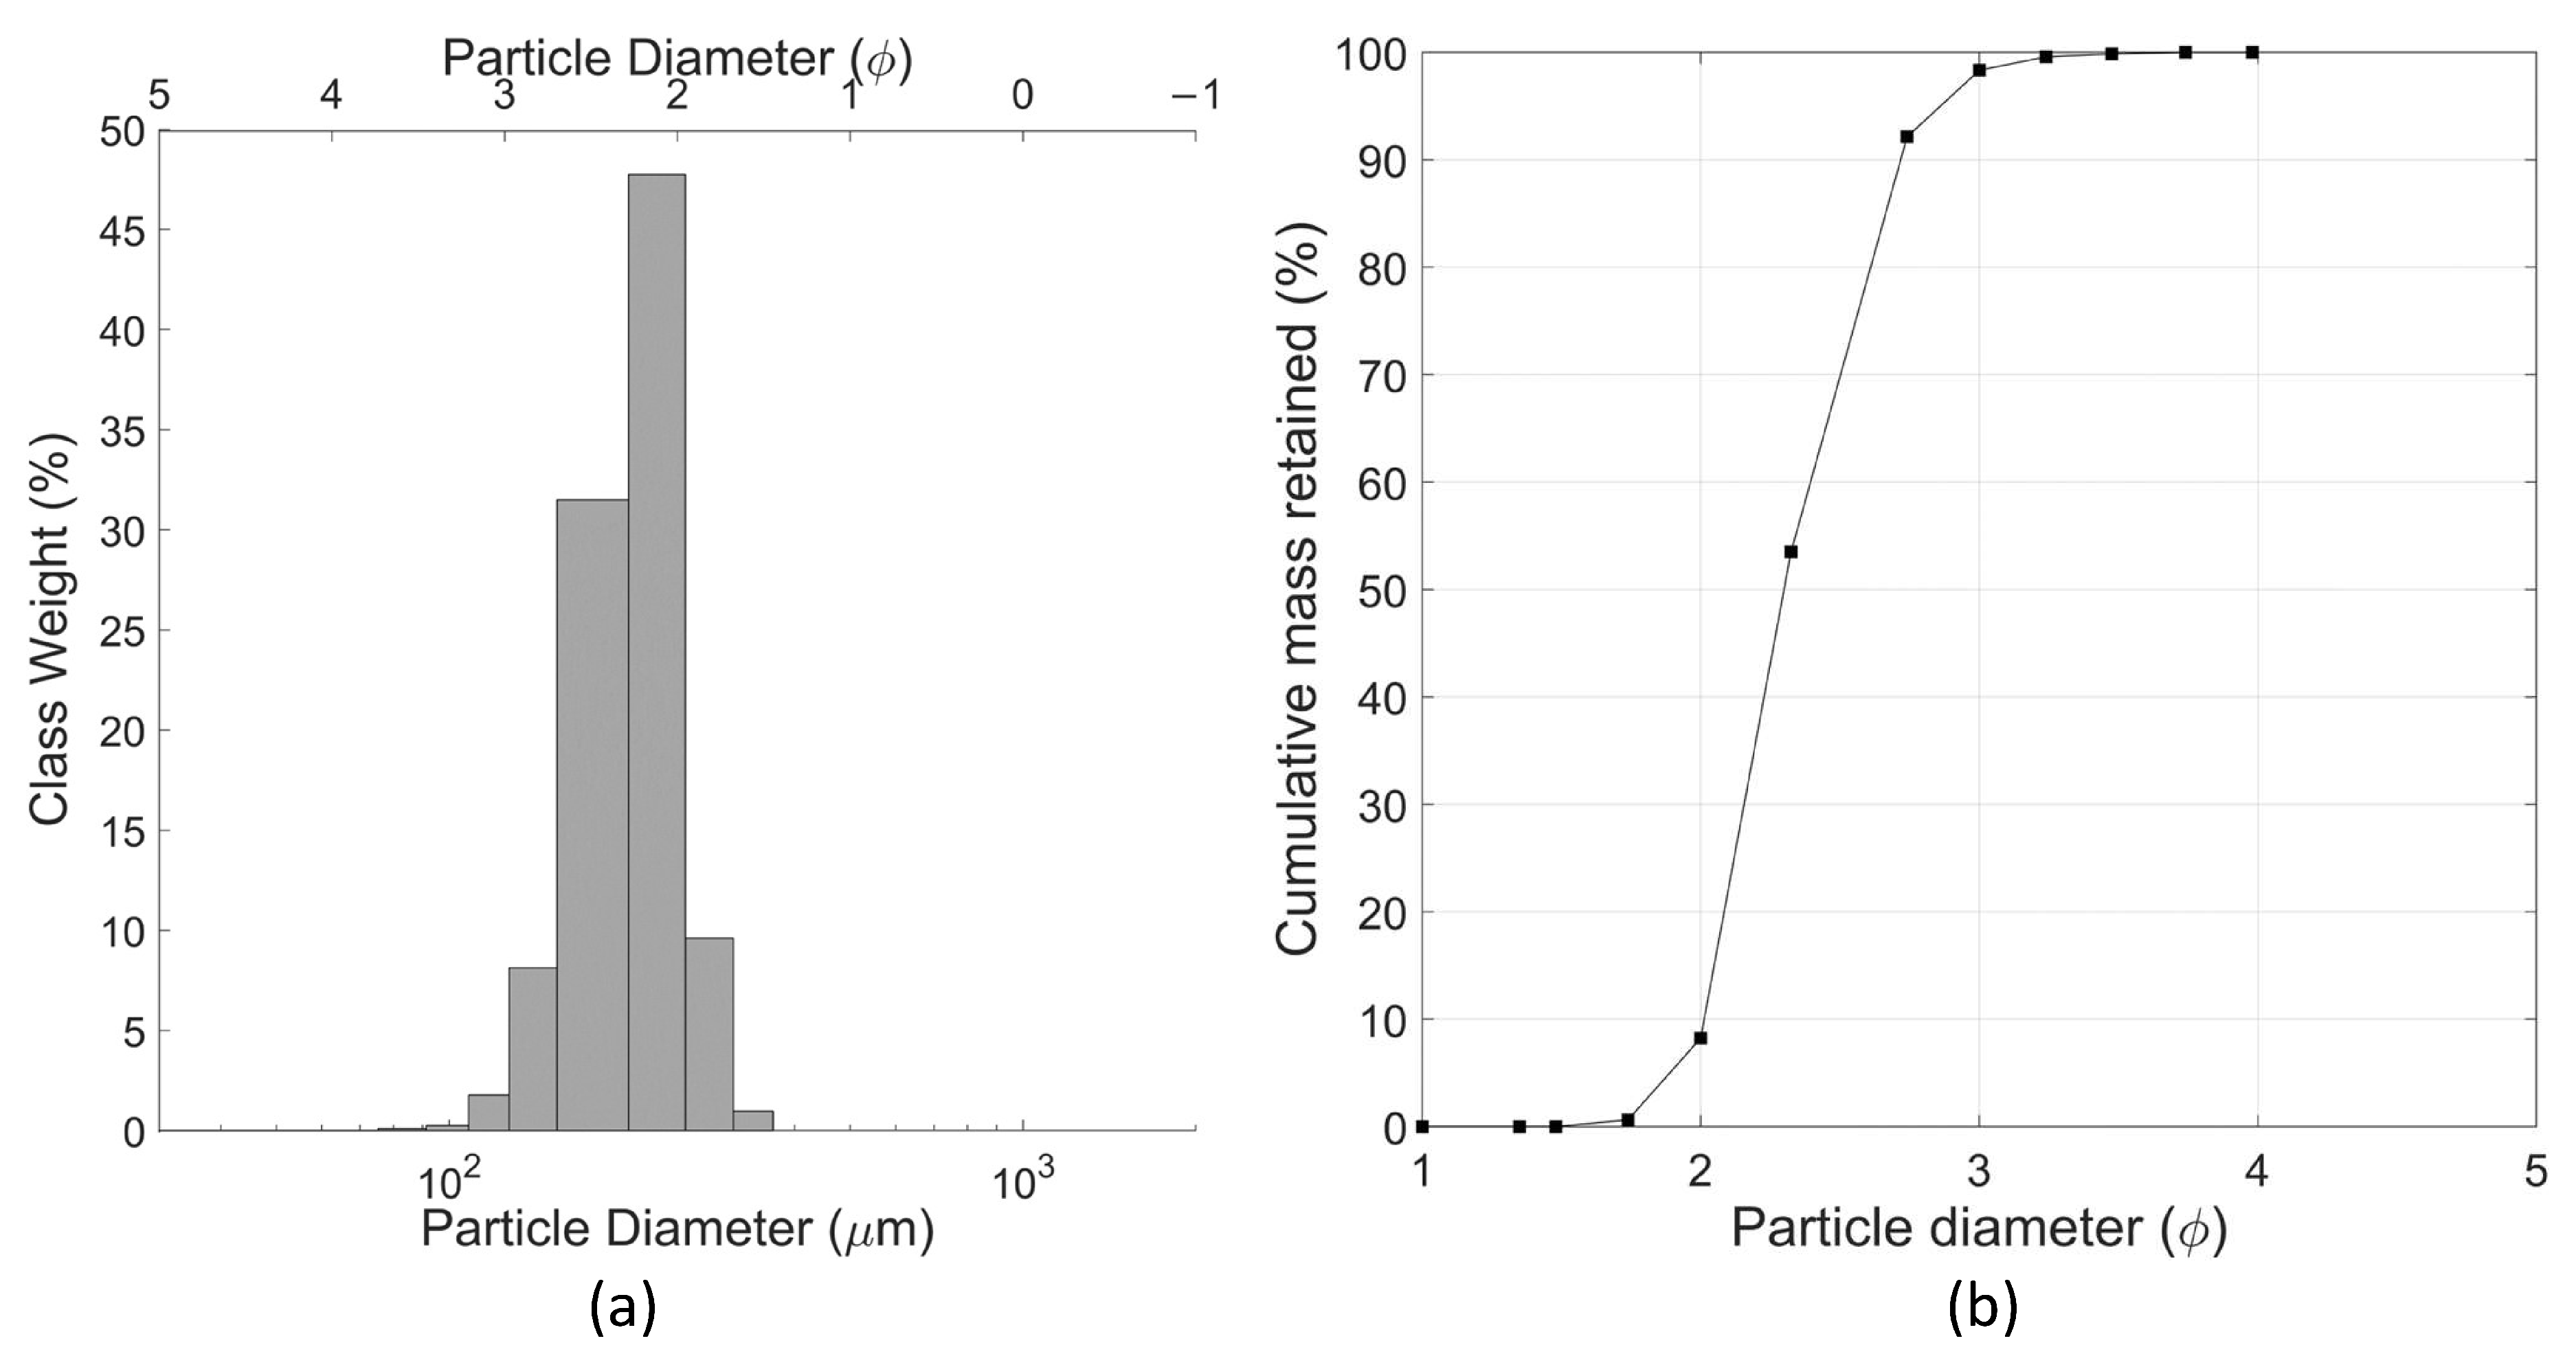
3.1. Data
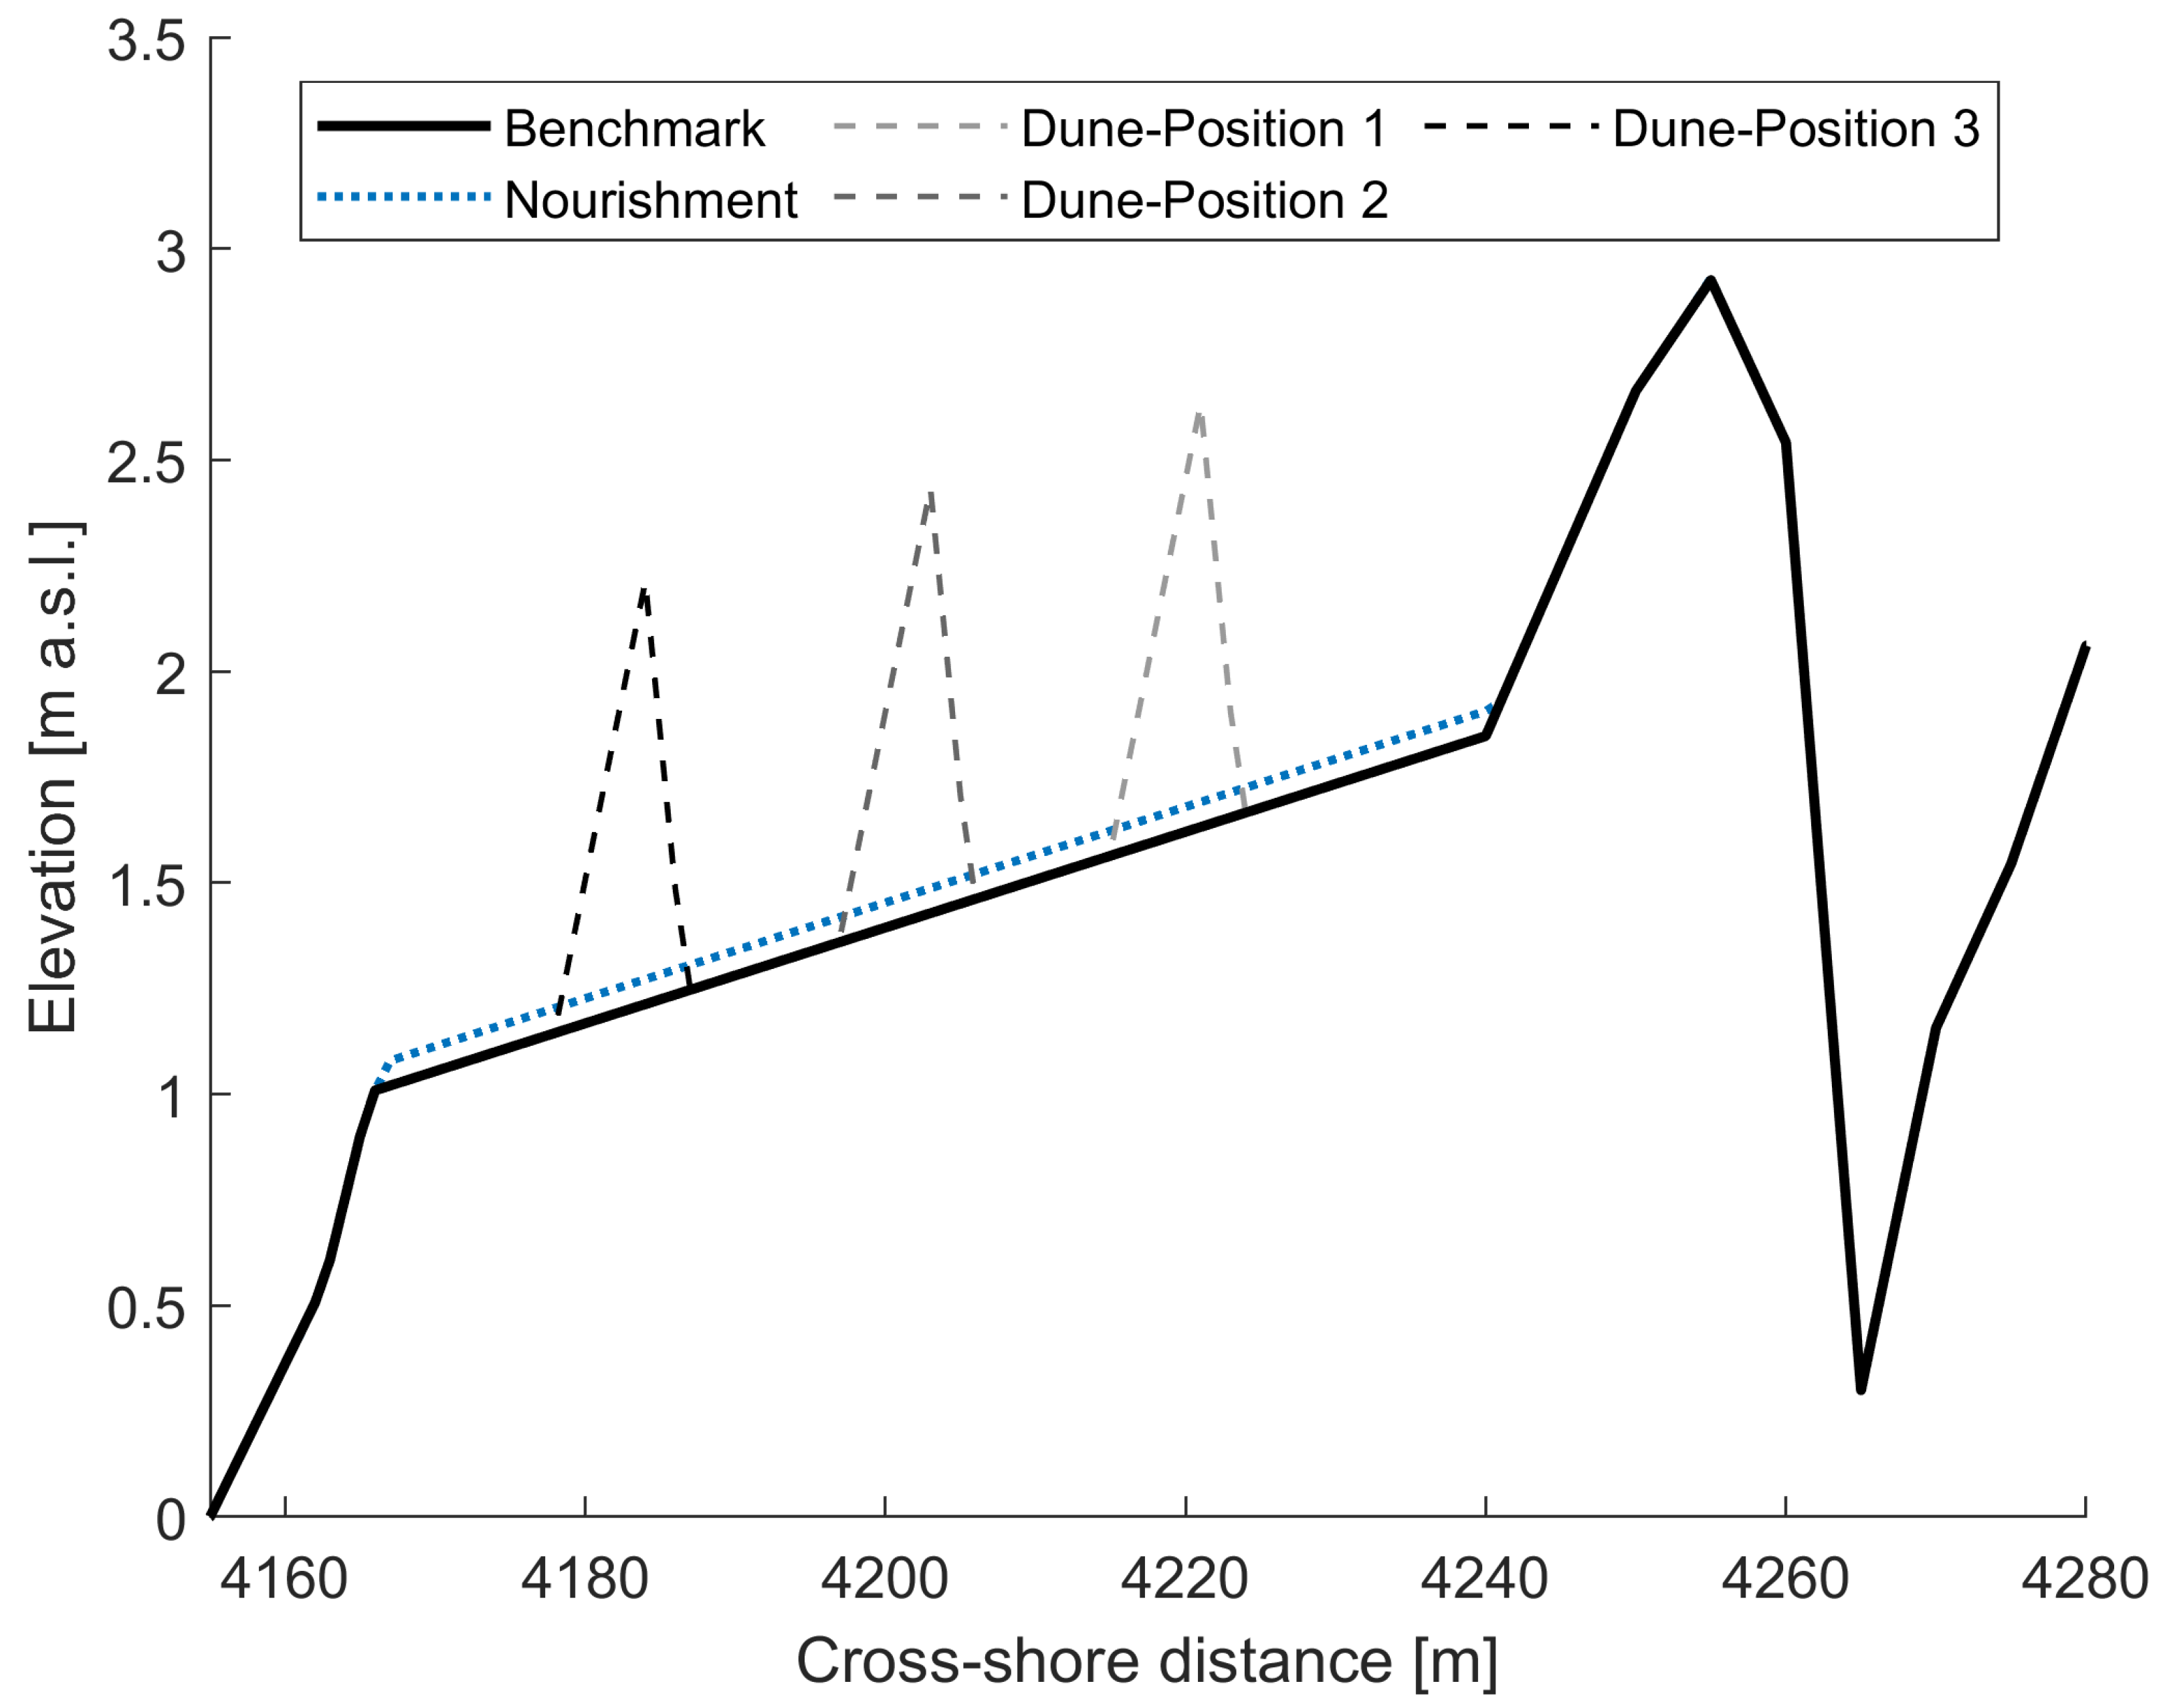
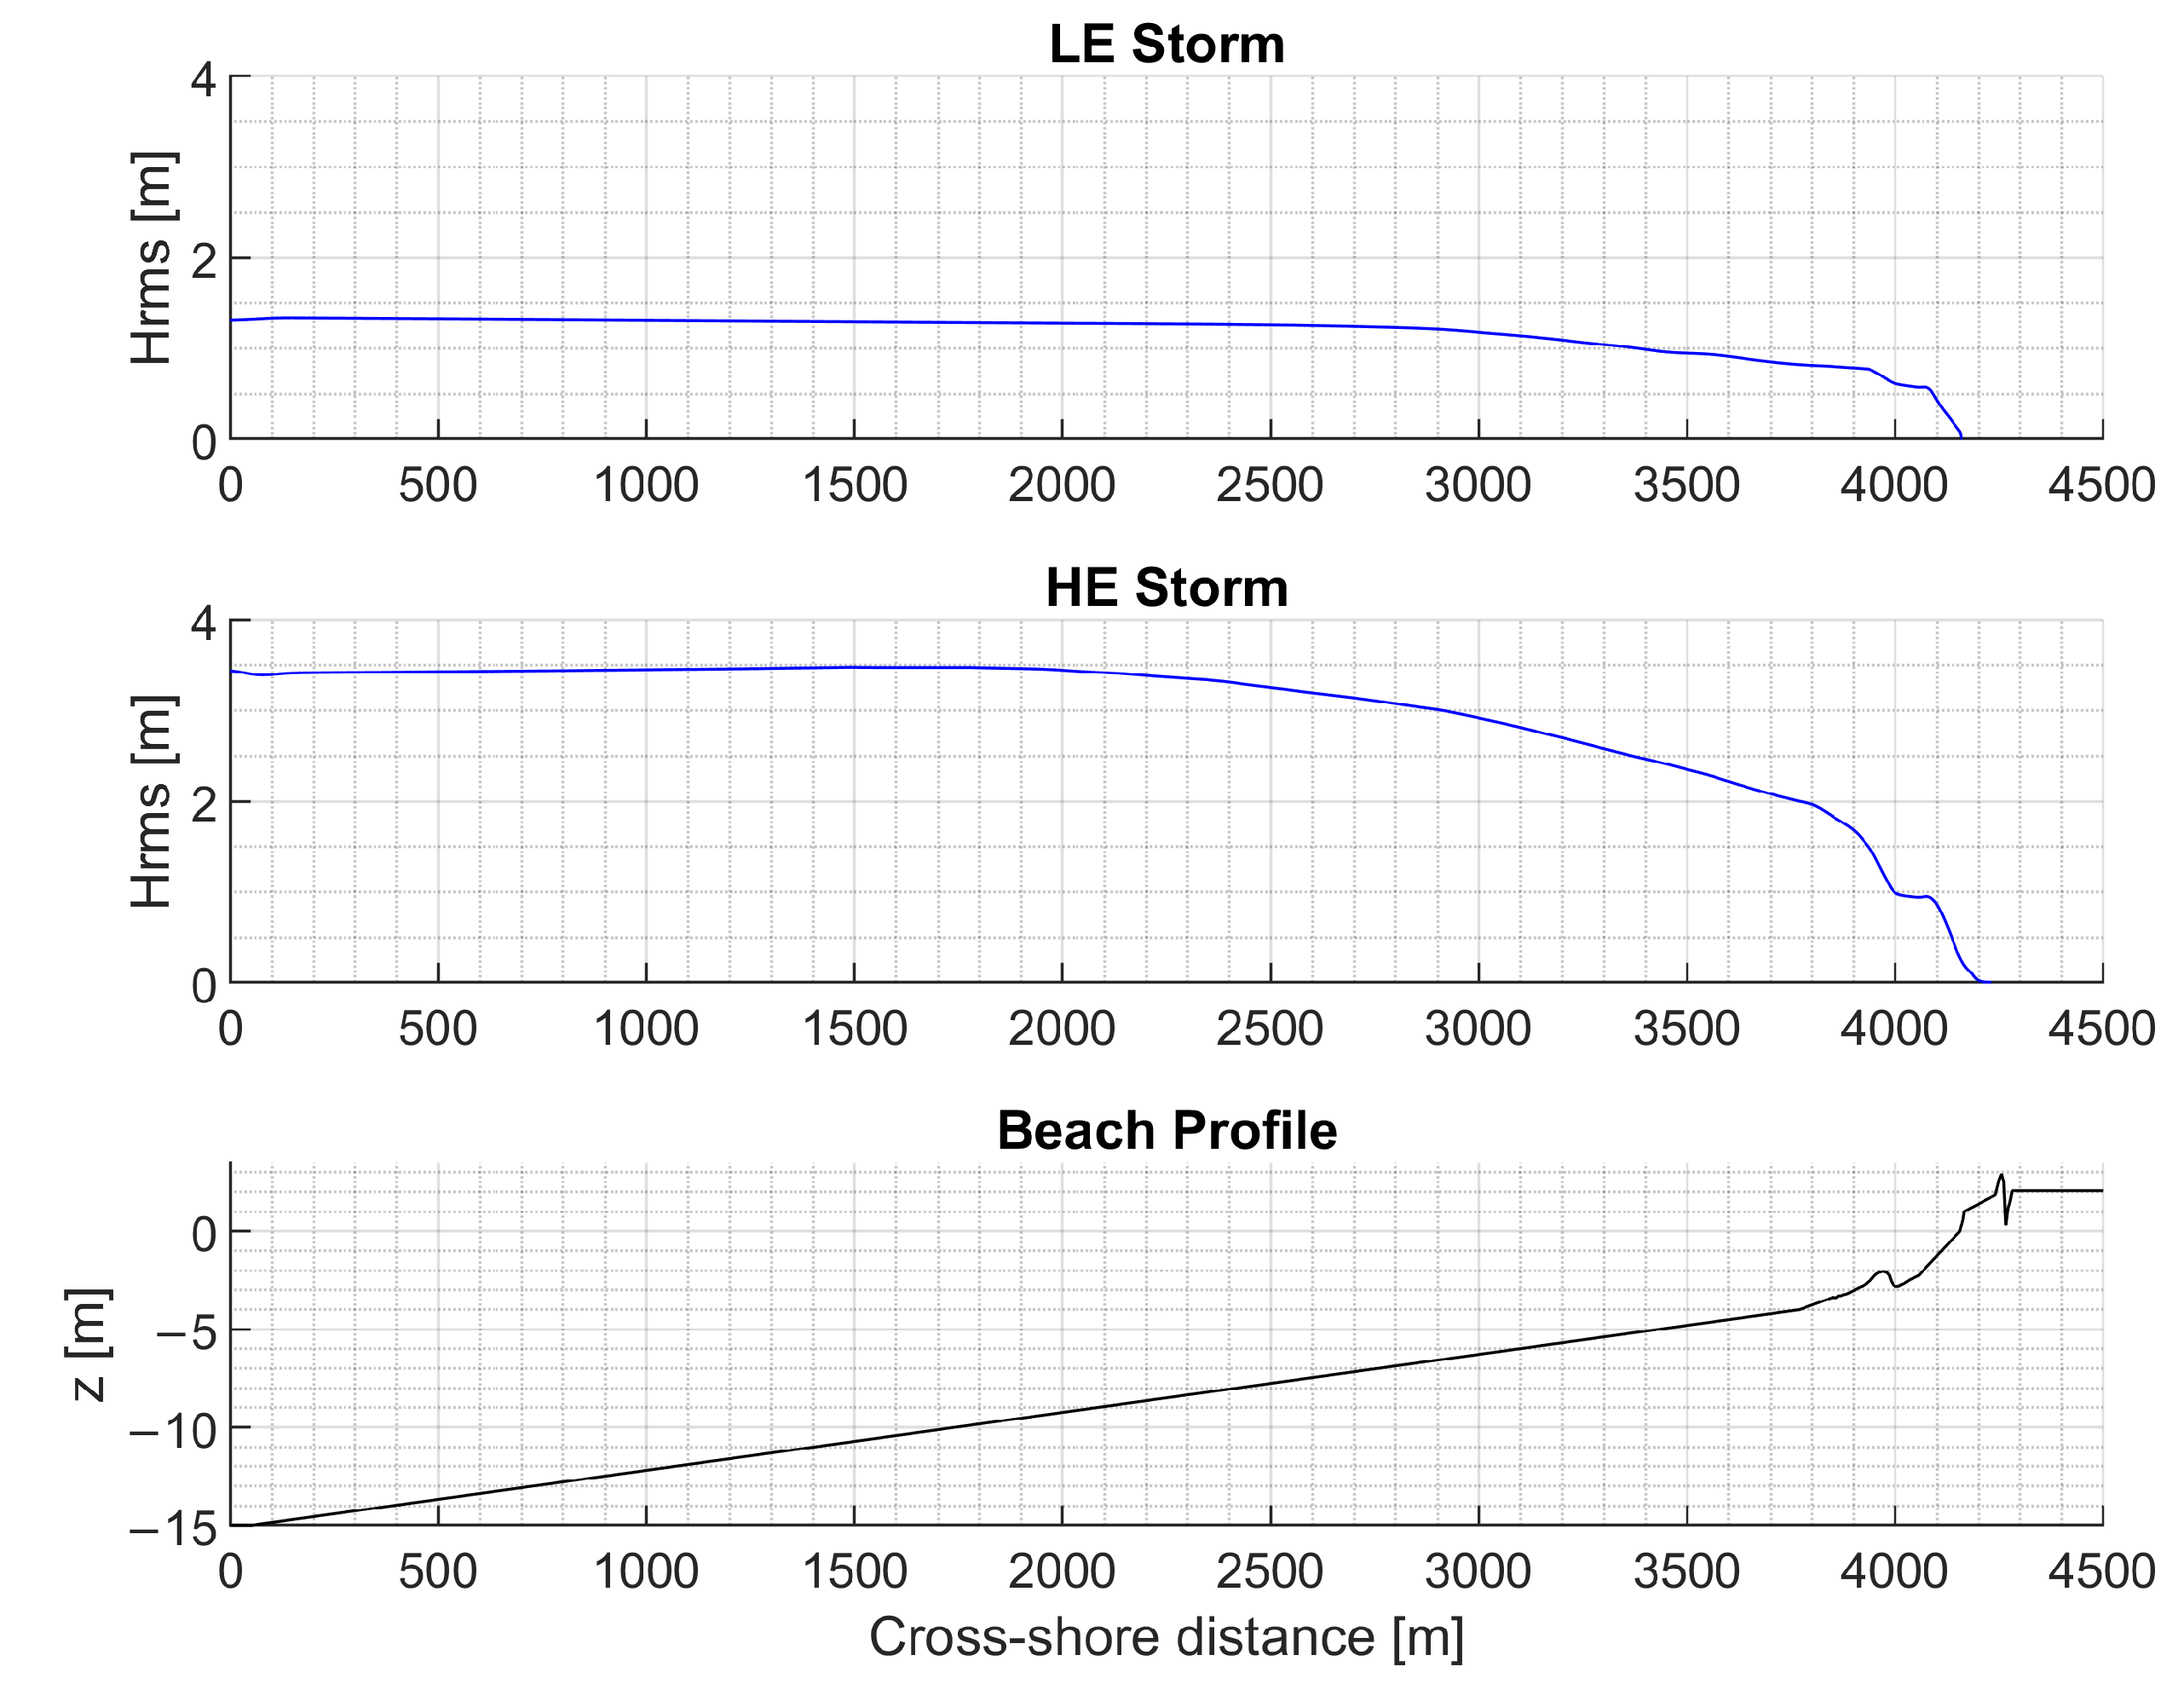
3.2. Model Setup
3.3. Numerical Simulations
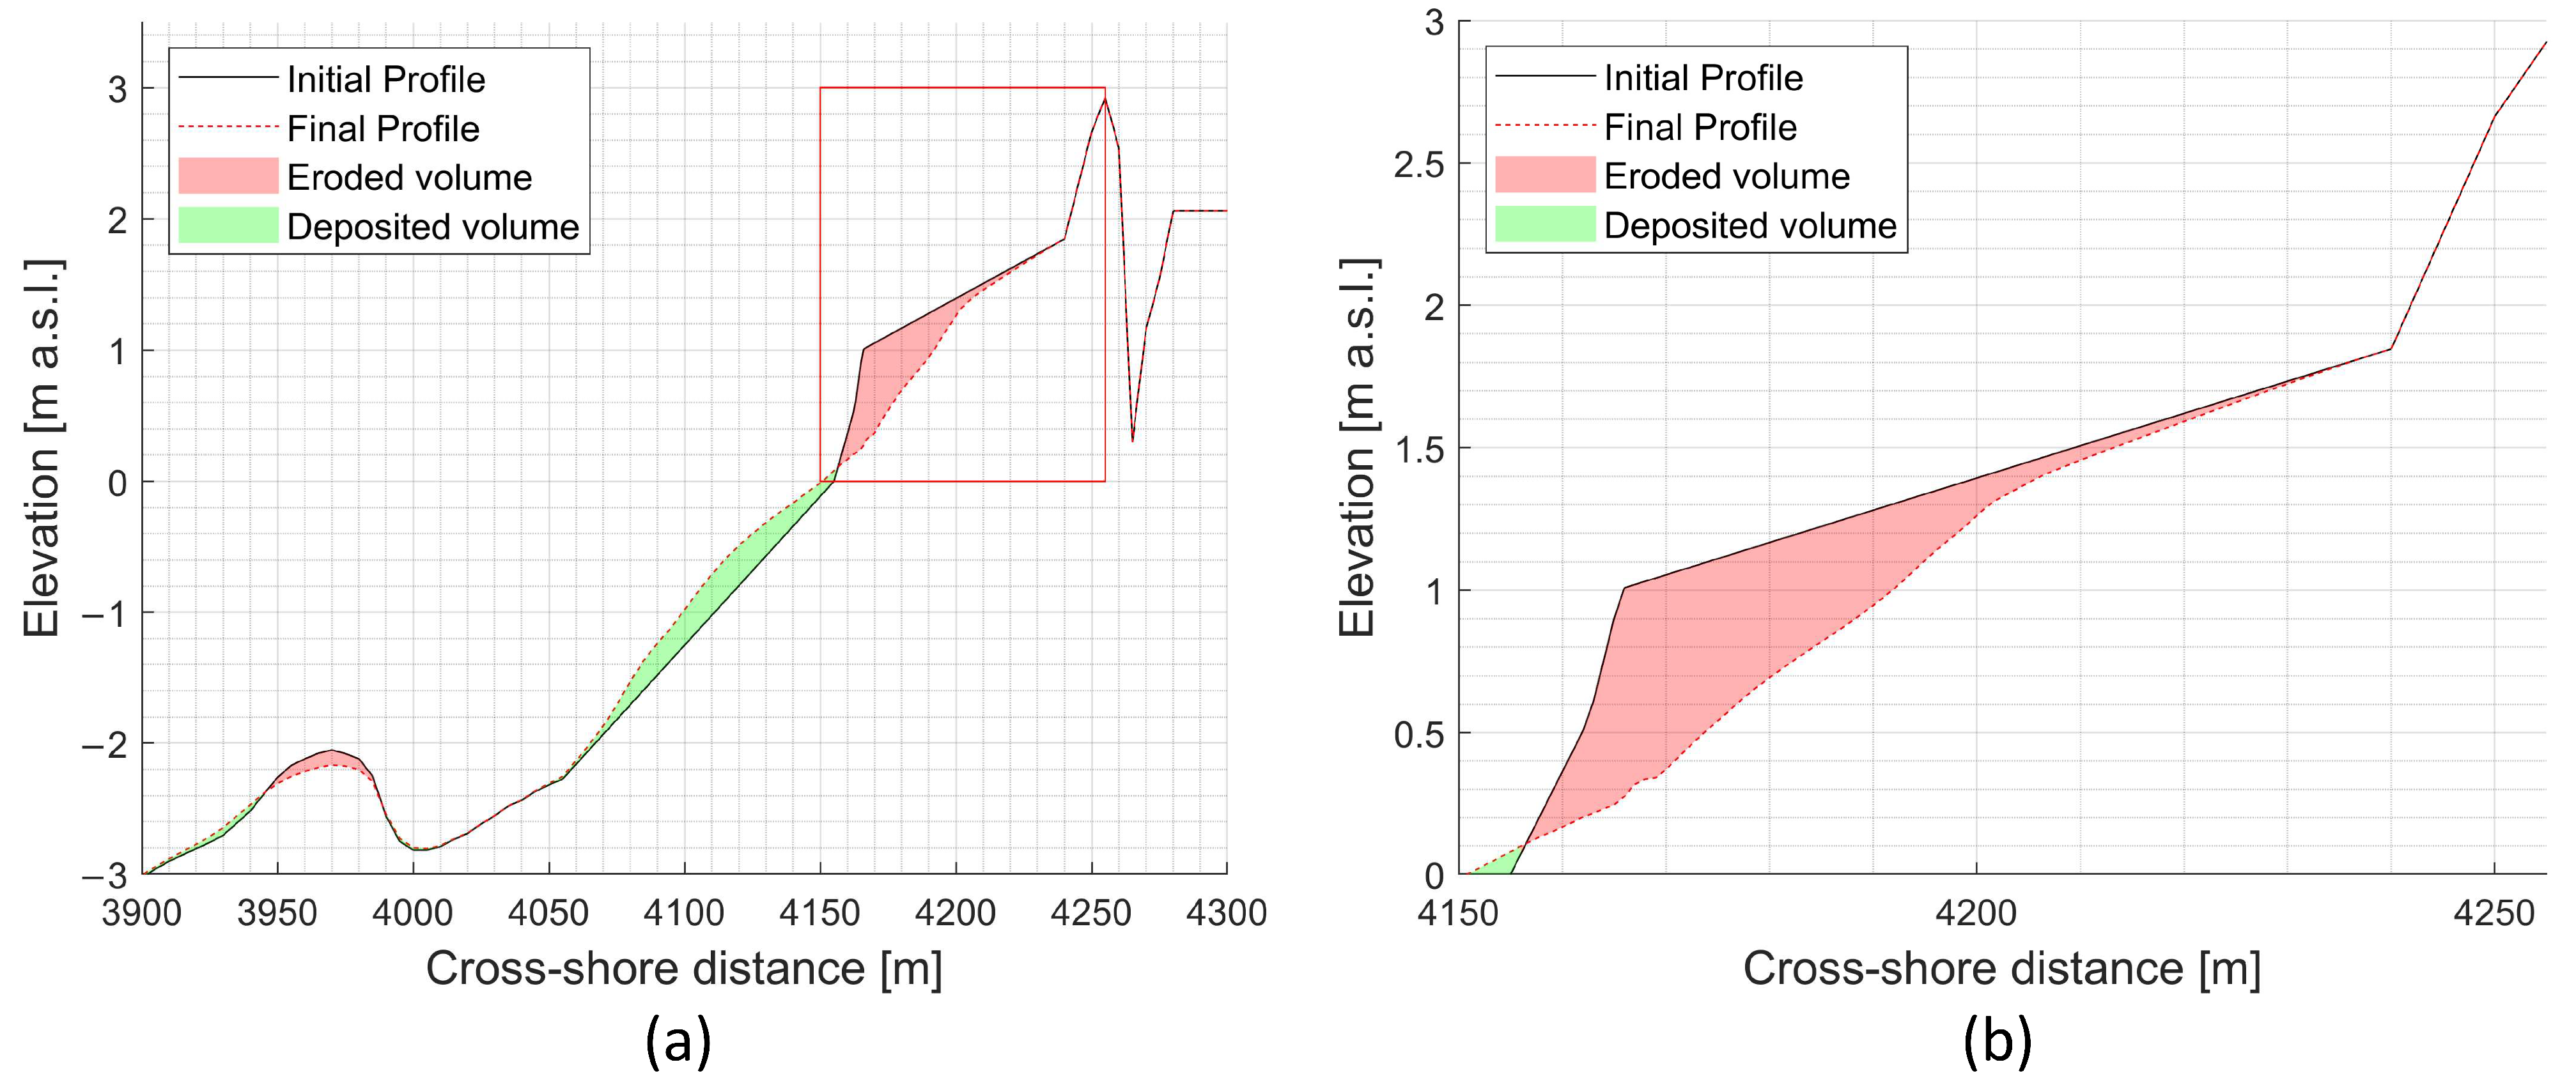
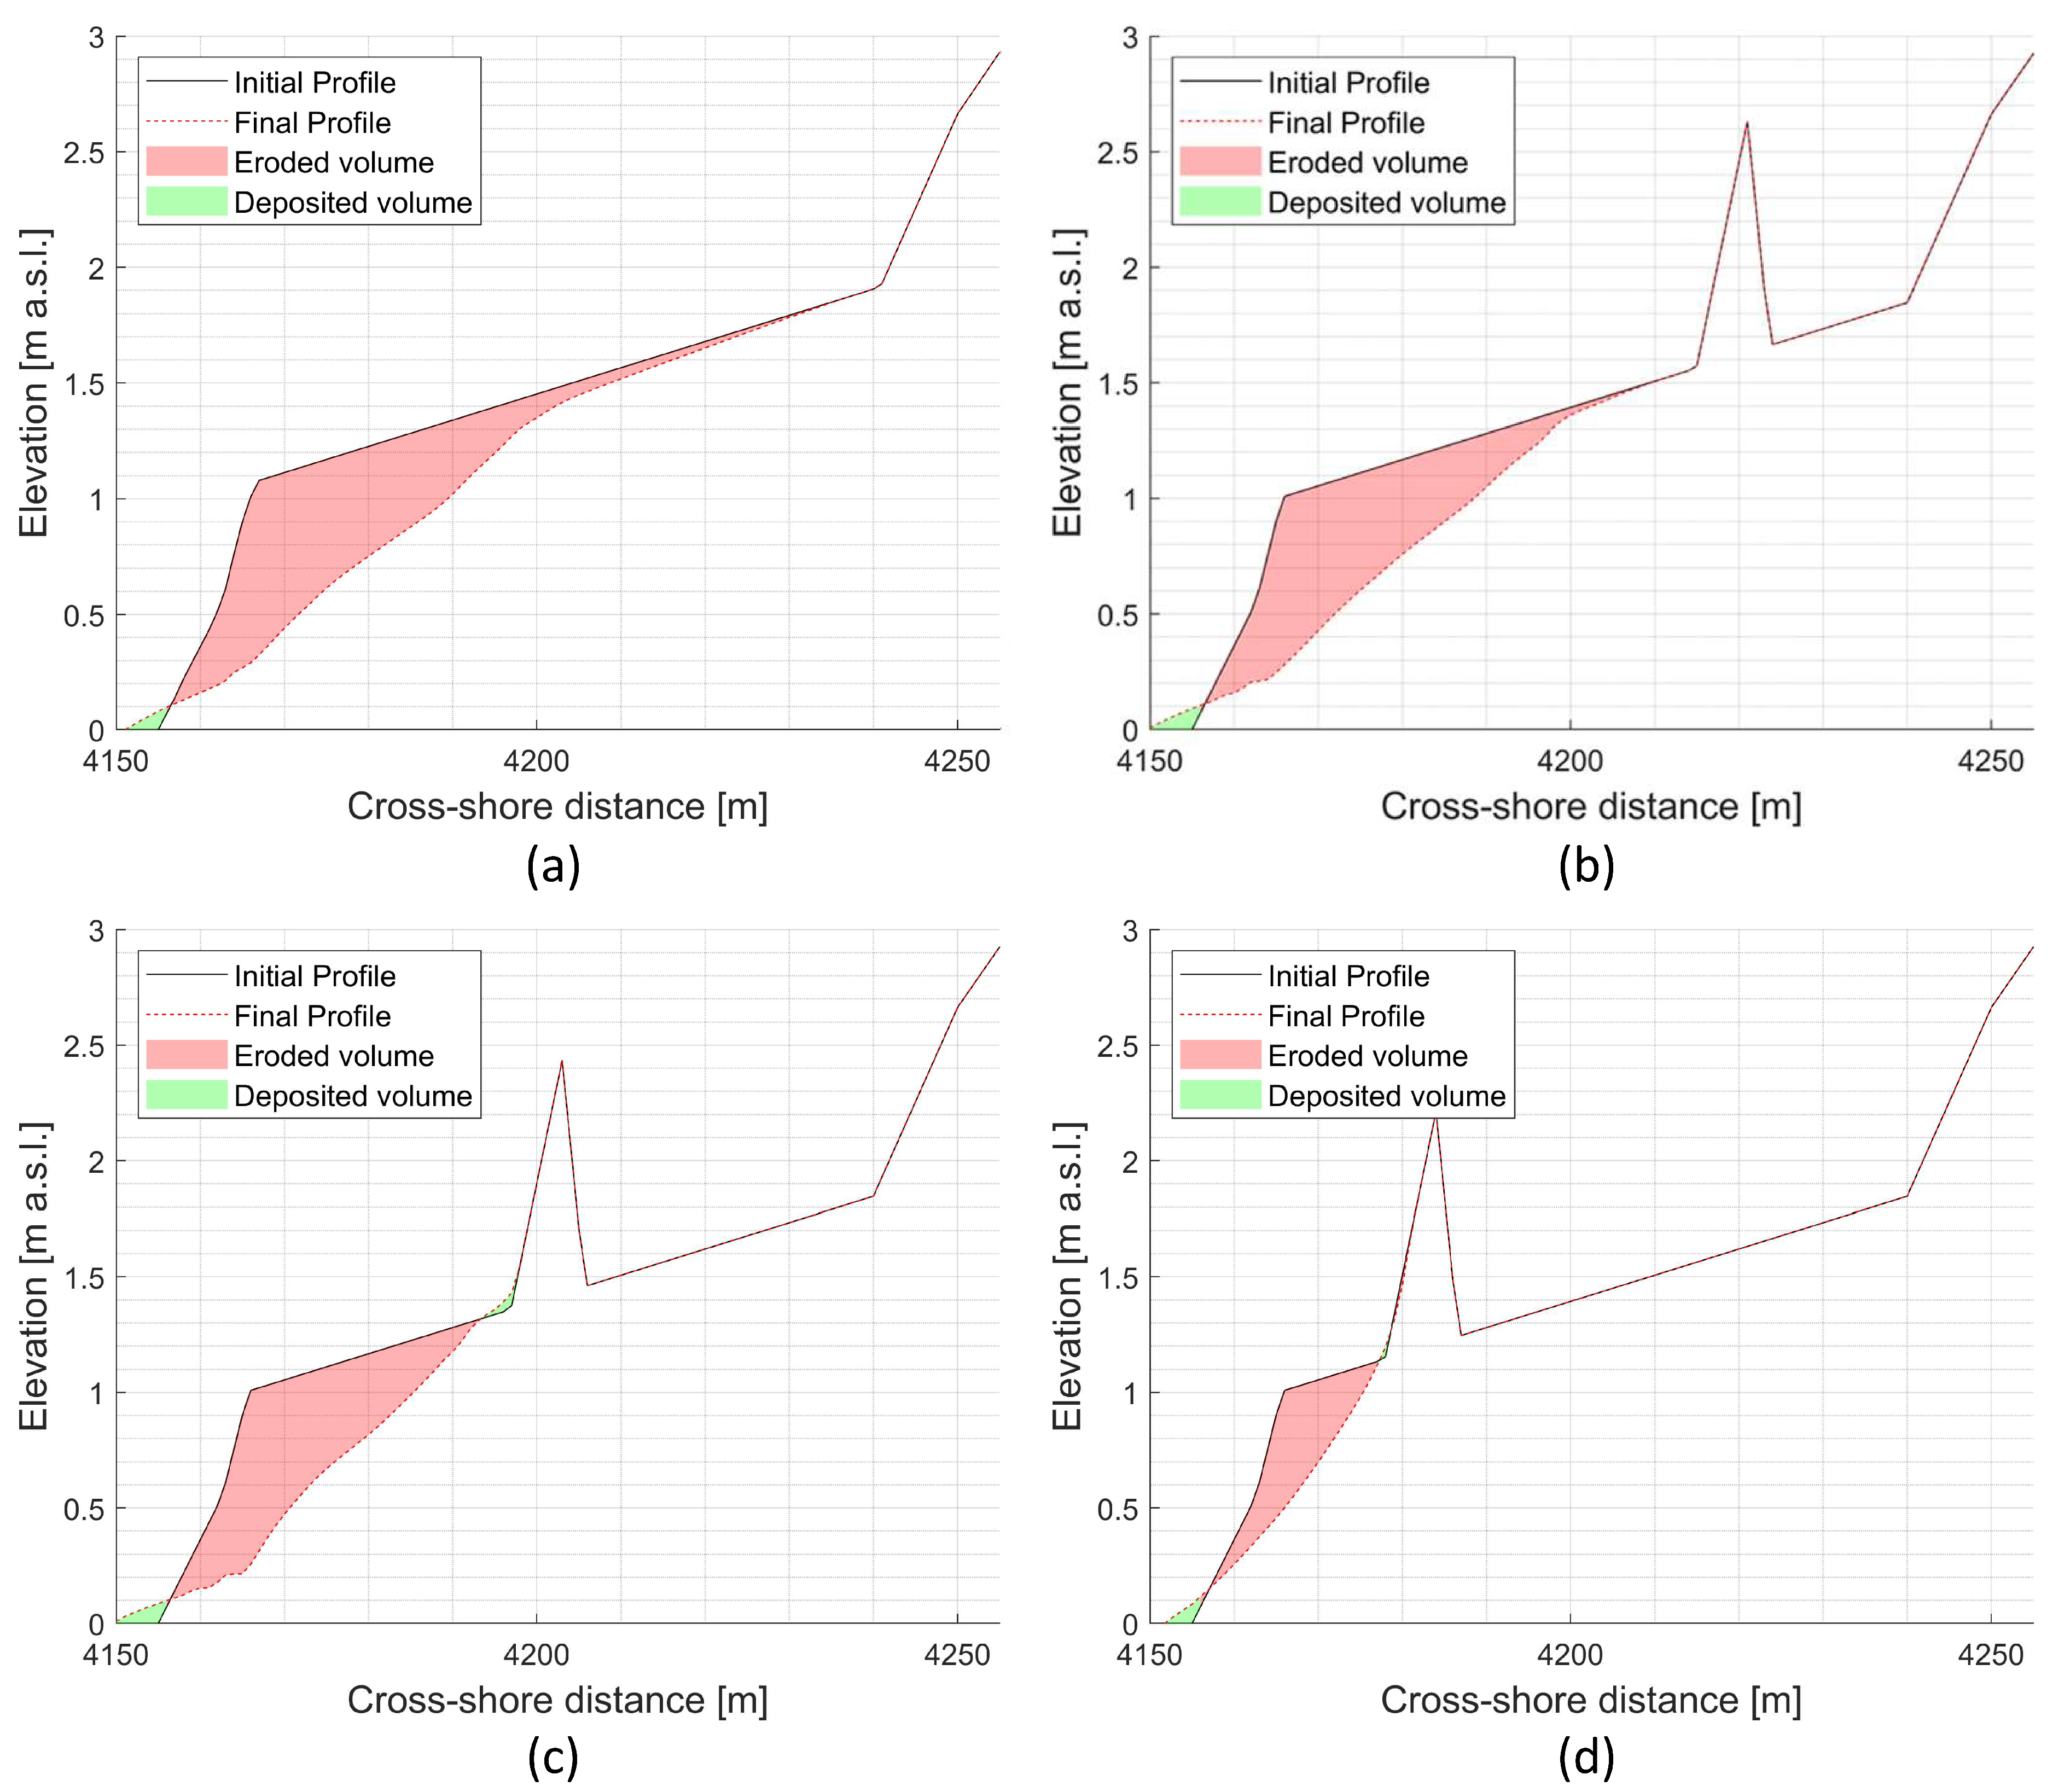
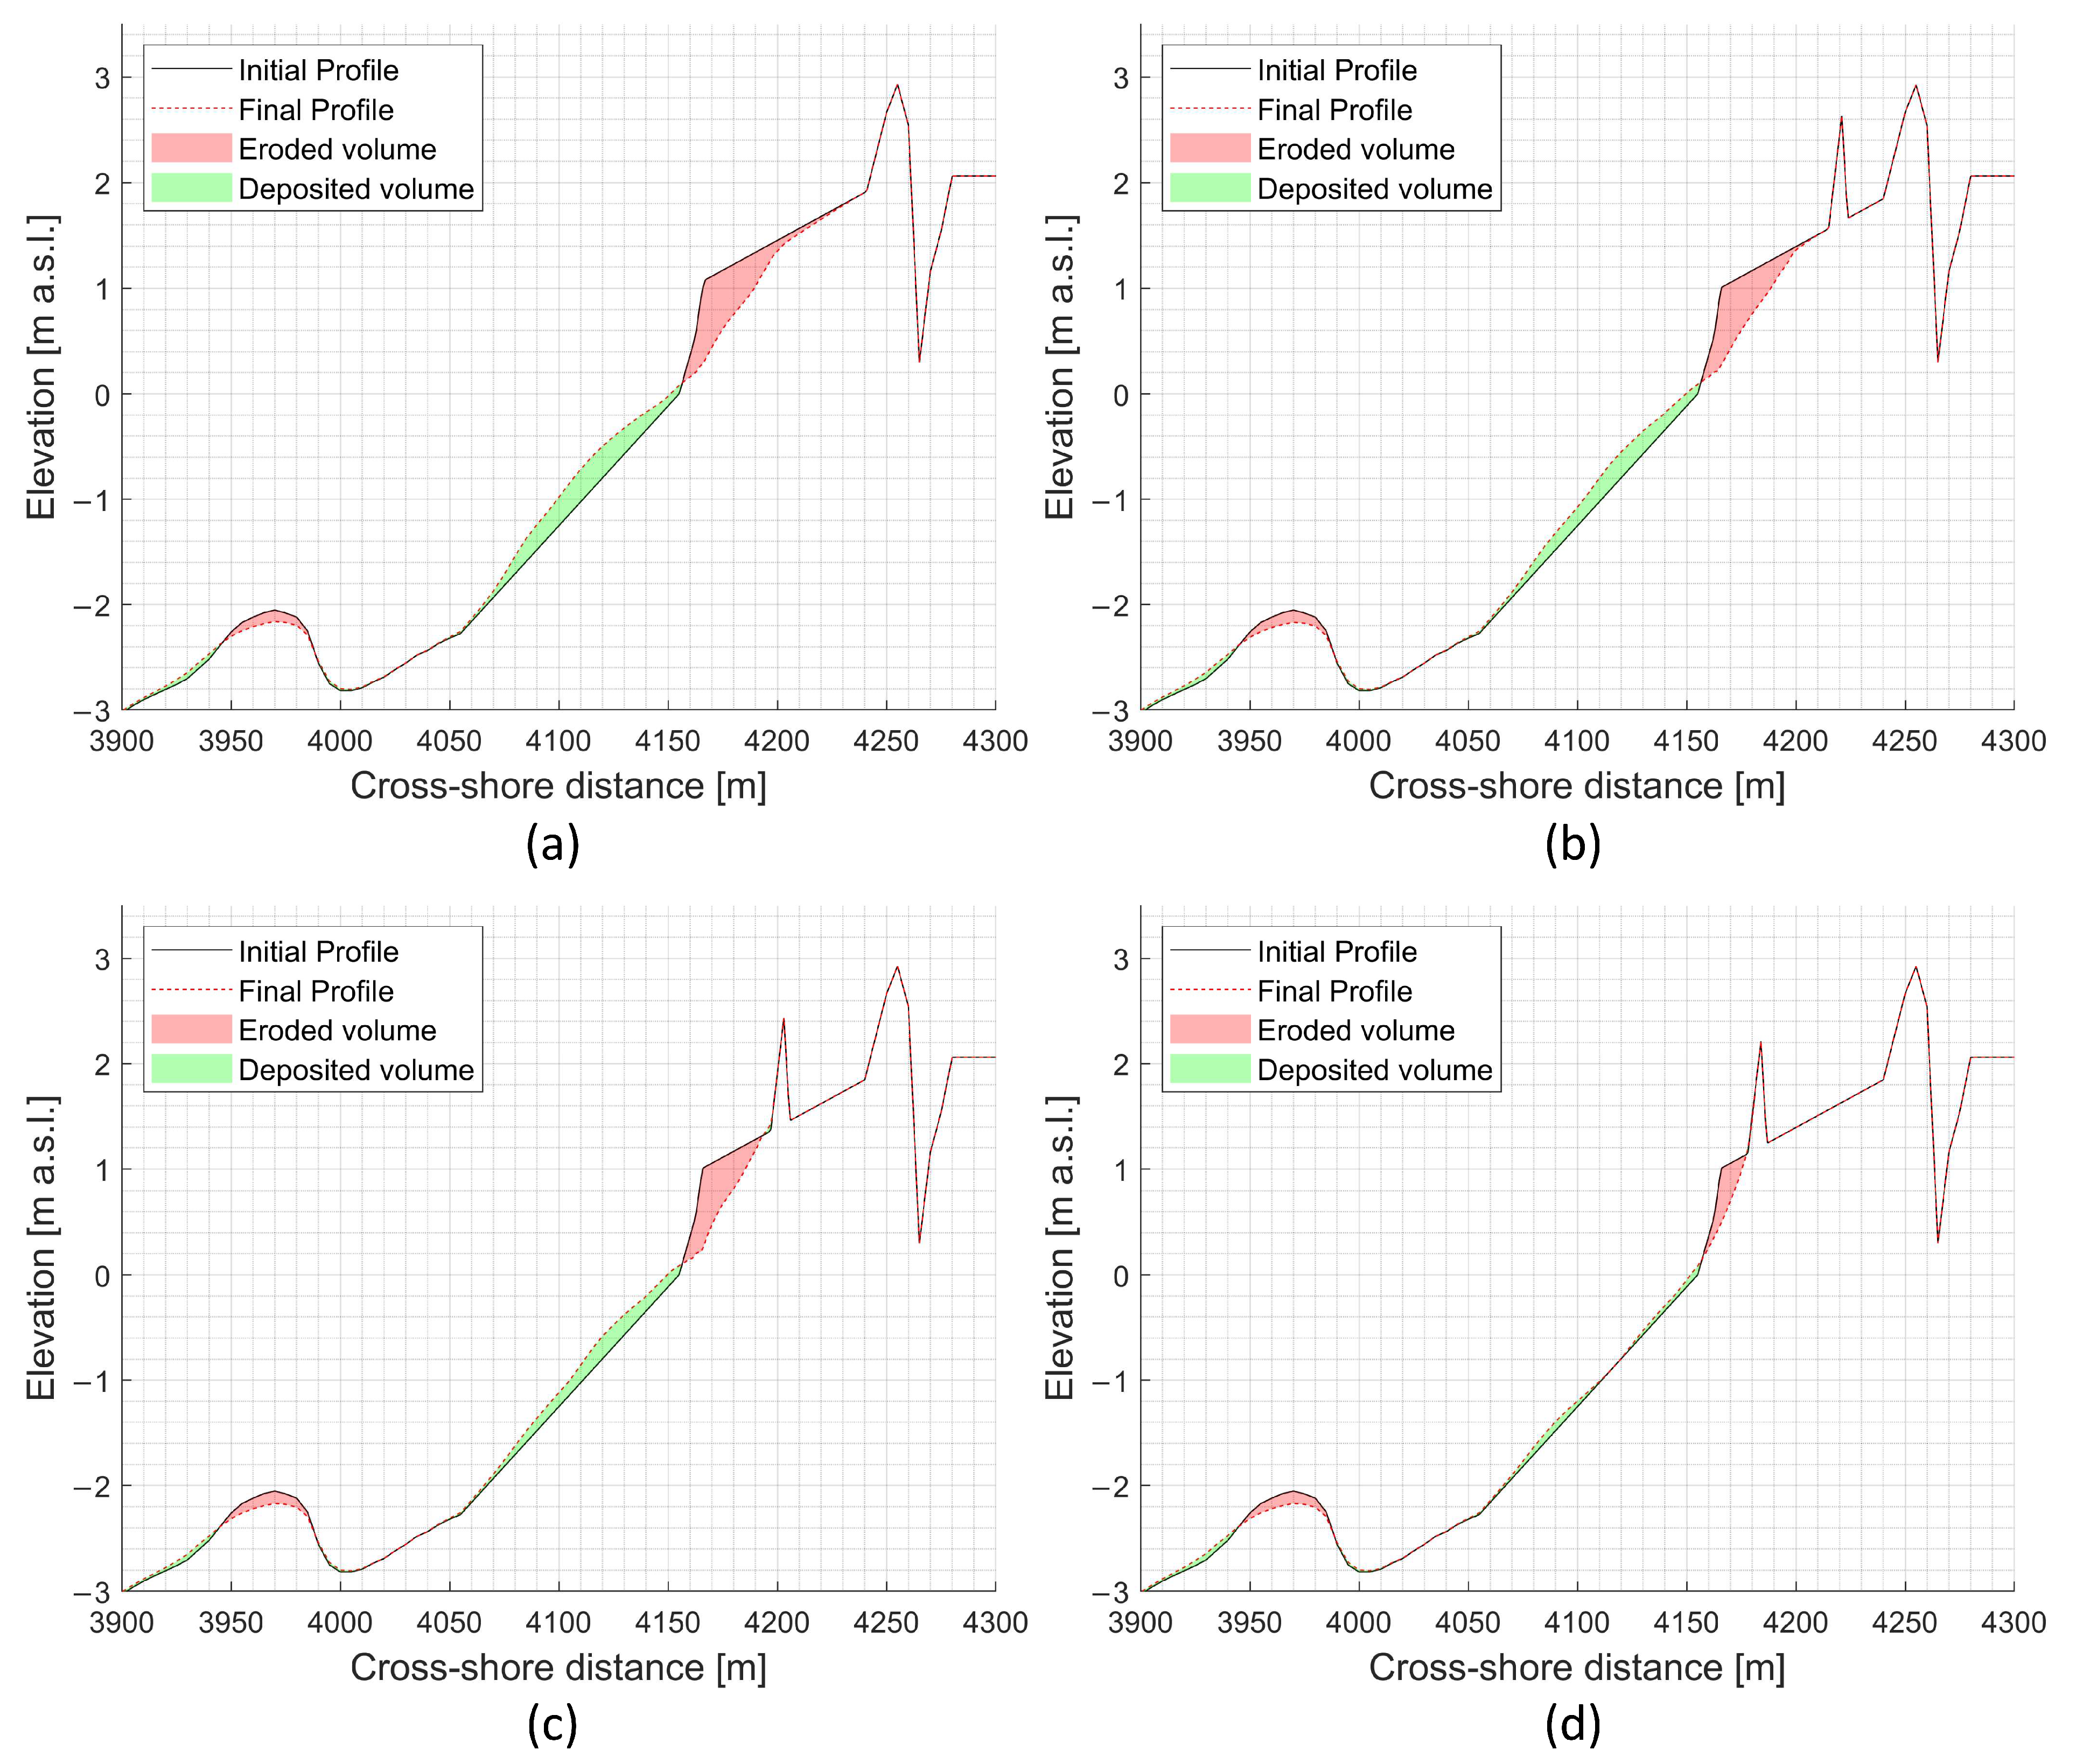
4. Results
5. Discussion
5.1. Discussion of Results
5.2. Future Management Strategies
6. Conclusions
Author Contributions
Funding
Institutional Review Board Statement
Informed Consent Statement
Data Availability Statement
Conflicts of Interest
Appendix A

References
- Hinkel, J.; Lincke, D.; Vafeidis, A.T.; Perrette, M.; Nicholls, R.J.; Tol, R.S.; Marzeion, B.; Fettweis, X.; Ionescu, C.; Levermann, A. Coastal flood damage and adaptation costs under 21st century sea-level rise. In Proceedings of the National Academy of Sciences, Potsdam Institute for Climate Impact Research, Potsdam, Germany, 4 March 2014; Volume 111, pp. 3292–3297. [Google Scholar]
- IPCC. Climate Change 2023: Synthesis Report. A Report of the Intergovernmental Panel on Climate Change. Contribution of Working Groups I, II and III to the Sixth Assessment Report of the Intergovernmental Panel on Climate Change; Core Writing Team, Lee, H., Romero, J., Eds.; IPCC: Geneva, Switzerland, 2023. [Google Scholar]
- Cooper, J.A.G.; Masselink, G.; Coco, G.; Rogers, K.; Anthony, E.; Green, A.N.; Kelley, J.T.; Pilkey, O.H.; Jackson, D.W.T. Sandy beaches can survive sea-level rise. Nat. Clim. Chang. 2020, 10, 993–995. [Google Scholar] [CrossRef]
- Lionello, P.; Sanna, A.; Elvini, E.; Mufato, R. A data assimilation procedure for operational prediction of storm surge in the northern Adriatic Sea. Cont. Shelf Res. 2006, 26, 539–553. [Google Scholar] [CrossRef]
- Olea, R.A.; Coleman, J. A synoptic examination of causes of land loss in southern Louisiana as they relate to the exploitation of subsurface geologic resources. J. Coast. Res. 2014, 30, 1025–1044. [Google Scholar] [CrossRef]
- Sestini, G. Implications of climatic changes for the Po delta and the Venice lagoon. In Climate Change and the Mediterranean; Jeftic, L., Milliman, J., Sestini, G., Eds.; Edward Arnold: London, UK, 1992; pp. 429–495. [Google Scholar]
- Bird, E.; Lewis, N. Beach Renourishment, 1st ed.; Springer: Berlin, Germany, 2015. [Google Scholar]
- Cohen-Shacham, E.; Walters, G.; Janzen, C.; Maginnis, S. (Eds.) What are Nature-based Solutions? In Nature-Based Solutions to Address Global Societal Challenges; IUCN: Gland, Switzerland, 2016; pp. 2–11. [Google Scholar]
- Schlacher, T.A.; Jones, A.R.; Dugan, J.E.; Weston, M.A.; Harris, L.; Schoeman, D.S.; Hubbard, D.M.; Scapini, F.; Nel, R.; Lastra, M.; et al. Open-coast sandy beaches and coastal dunes. In Coastal Conservation; Lockwood, J.L., Maslo, B., Eds.; Cambridge University Press: Cambridge, UK, 2014. [Google Scholar]
- Alonso, I.; Weston, K.; Gregg, R.; Morecroft, M. Carbon Storage by Habitat—Review of the Evidence of the Impacts of Management Decisions and Condition on Carbon Stores and Sources; Natural England: York, UK, 2012. [Google Scholar]
- Millennium Ecosystem Assessment. Ecosystems and Human Well-Being: Synthesis; Island Press: Washington, DC, USA, 2005. [Google Scholar]
- O’Connell, J.F. Coastal Dune Protection & Restoration Using ’Cape’; American Beachgrass & Fencing; Marine Extension Bulletin; Woods Hole Sea Grant & Cape Cod Cooperative Extension: Woods Hole, MA, USA, 2008. [Google Scholar]
- Vega de Seoane, C.L.; Gallego Fernández, J.B.; Vidal Pascual, C. Coastal Dunes Restoration Manual; Ministerio de Medio Ambiente Rural y Marino: Madrid, Spain, 2011. [Google Scholar]
- Houston, J.A.; Edmondson, S.E.; Rooney, P.J. Coastal Dune Management: Shared Experience of European Conservation Practice; Liverpool University Press: Liverpool, UK, 2001. [Google Scholar]
- Harley, M.D.; Ciavola, P. Managing local coastal inundation risk using real-time forecast and artificial placements. Coast. Eng. 2013, 77, 77–90. [Google Scholar] [CrossRef]
- Silva, R.; Martínez, M.L.; Odériz, I.; Mendoza, E.; Feagin, R.A. Response of vegetated dune-beach systems to storm conditions. Coast. Eng. 2016, 109, 53–62. [Google Scholar] [CrossRef]
- de Winter, R.C.; Ruessink, B.G. Sensitivity analysis of climate change impacts on dune erosion. Clim. Chang. 2017, 141, 685–701. [Google Scholar] [CrossRef]
- Fernández-Montblanc, T.; Duo, E.; Ciavola, P. Dune reconstruction and revegetation as a potential measure to decrease coastal erosion and flooding under extreme storm conditions. Ocean Coast. Manag. 2020, 188, 105075. [Google Scholar] [CrossRef]
- Unguendoli, S.; Biolchi, L.G.; Aguzzi, M.; Pillai, U.P.A.; Alessandri, J.; Valentini, A. A modeling application of integrated nature based solutions (NBS) for coastal erosion and flooding mitigation in the Emilia-Romagna coastline (Northeast Italy). Sci. Total Environ. 2023, 867, 161357. [Google Scholar] [CrossRef]
- Musumeci, R.E.; Marino, M.; Cavallaro, L.; Foti, E. Does Coastal Wetland Restoration Work as a Climate Change Adaptation Strategy? The Case of the South-East of Sicily Coast. Coast. Eng. Proc. 2022, 37, 66. [Google Scholar] [CrossRef]
- Fontán-Bouzas, A.; Andriolo, U.; Silva, P.A.; Baptista, P. Wave Impact Analysis on a Beach-Dune System to Support Coastal Management and Nourishment Works: The Showcase of Mira, Portugal. Front. Mar. Sci. 2022, 9, 861569. [Google Scholar] [CrossRef]
- Navionics.com. Available online: https://webapp.navionics.com/?lang=it#boating@9&key=qwuwFotyC (accessed on 13 September 2023).
- Guillén, J.; Palanques, A. Longshore bar and trough systems in a microtidal, storm wave dominated coast: The Ebro Delta (Northwestern Mediterranean). Mar. Geol. 1993, 115, 239–252. [Google Scholar] [CrossRef]
- Institut Cartogràfic i Geològic de Catalunya. Llibre Verd de l’Estat de la Zona Costanera de Catalunya; ICGC: Barcelona, Spain, 2010. [Google Scholar]
- Jiménez, J.A.; Sánchez-Arcilla, A.; Valdemoro, H.I.; Gracia, V.; Nieto, F. Processes reshaping the Ebro delta. Mar. Geol. 1997, 144, 59–79. [Google Scholar] [CrossRef]
- Maldonado, A. El Delta del Ebro. Estudio Sedimentologice y Estratigrafico; Universidad de Barcelona: Barcelona, Spain, 1972; p. 450. [Google Scholar]
- Maldonado, A. Sedimentation stratigraphy and development of the Ebro delta (Spain). In Delta Models for Exploration; Broussard, M.L., Ed.; Houston Geological Society: Houston, TX, USA, 1975; pp. 311–338. [Google Scholar]
- Maldonado, A. Dinamica sedimentaria y evolution litoral reciente de1 Delta de1 Ebro (Mediterraneo occidental). In El Sistema Integrado de1 Ebro: Cuenca. Delta y Medio Marino; Marifio, M., Ed.; Hermes: Madrid, Spain, 1986; pp. 33–60. [Google Scholar]
- Varela, J.M.; Gallardo, A.; Lopez de Velasco, A. Retencion de solidos por las presas de Mequinenza y Ribarroja. Efectos de 10s aportes en el Delta de1 Ebro. In El Sistema Integrado de1 Ebro; Marifio, M.G., Ed.; Hermes: Madrid, Spain, 1986; pp. 203–219. [Google Scholar]
- Palanques, A.; Plana, F.; Maldonado, A. Recent influence of man on the Ebro margin sedimentation system northwestern Mediterranean Sea. Mar. Geol. 1990, 95, 247–263. [Google Scholar] [CrossRef]
- Mallada, L. Reconocimiento Geografico y Geologico De La Provincia De Tarragona; Boletín De La Comisión Del Mapa Geológico De La Provincia De Tarragona: Madrid, Spain, 1889; p. 175. [Google Scholar]
- Tena, A.; Batalla, R.J.; Vericat, D. Reach-scale suspended sediment balance downstream from dams in a large Mediterranean river. Hydrol. Sci. J. 2012, 57, 831–849. [Google Scholar] [CrossRef]
- Boccotti, P. Idraulica Marittima; UTET Università: Segrate, Italy, 2004; ISBN 9788877508744. [Google Scholar]
- Bolaños, R.; Jordà, G.; Cateura, J.; López, J.; Puigdefàbregas, J.; Gómez, J.; Espino, M. The XIOM: 20 years of regional coastal observatory in the Spanish Catalan coast. J. Mar. Syst. 2009, 77, 237–260. [Google Scholar] [CrossRef]
- Martzikos, N.T.; Prinosb, P.E.; Memosa, C.D.; Tsoukalaa, V.K. Statistical analysis of Mediterranean coastal storms. Oceanologia 2021, 63, 133–148. [Google Scholar] [CrossRef]
- Amarouche, K.; Akpinar, A.; Semedo, A. Wave storm events in the Western Mediterranean Sea over four decades. Ocean Model. 2022, 170, 1–20. [Google Scholar] [CrossRef]
- Roelvink, D.; Reniers, A.; van Dongeren, A.; de Vries, J.V.T.; McCall, R.; Lescinski, J. Modelling storm impacts on beaches, dunes and barrier islands. Coast. Eng. 2009, 56, 1133–1152. [Google Scholar] [CrossRef]
- Roelvink, D.; Reniers, A.; van Dongeren, A.; de Vries, J.v.; Lescinski, J.; McCall, R. XBeach Model Description and Manual-v6; Deltares: Delft, The Netherlands, 2010. [Google Scholar]
- Daly, C.; Roelvink, J.A.; van Dongeren, A.R.; de Vries, J.V.; McCall, R. Short wave breaking effects on low frequency waves. In Proceedings of the 32th International Conference on Coastal Engineering, Shanghai, China, 6 February 2010; Volume 1, pp. 1–13. [Google Scholar]
- Calafat, A.; Vírseda, S.; Lovera, R.; Lucena, J.R.; Bladé, C.; Rivero, L.; Ninot, J.M. Assessment of the Restoration of the Remolar Dune System (Viladecans, Barcelona): The Resilience of a Coastal Dune System. J. Mar. Sci. Eng. 2021, 9, 113. [Google Scholar] [CrossRef]
- ROM. Recomendaciones de Obras Maritimas 0.3 Wave Annex El. Wave Climate of the Spanish Coast; Puertos del Estado: Madrid, Spain, 1991. [Google Scholar]
- Mendoza, E.T.; Jiménez, J.A. Storm-Induced Beach Erosion Potential on the Catalonian. J. Coast. Res. 2006, 48, 81–88. [Google Scholar]
- Sallenger, A.H.; Howd, P.; Stockdon, H.; Guy, K.; Morgan, K.L.M. On predicting storm induced coastal change. In Proceedings of the Coastal Sediments, Clearwater Beach, FL, USA, 18–23 May 2003. [Google Scholar]
- Cáceres, I.; Alsina, J.M. A detailed, event-by-event analysis of suspended sediment concentration in the swash zone. Cont. Shelf Res. 2012, 41, 61–76. [Google Scholar] [CrossRef]
- Deng, B.; Zhang, W.; Yao, Y.; Jiang, C. A laboratory study of the effect of varying beach slopes on bore-driven swash hydrodynamics. Front. Mar. Sci. 2022, 9, 956379. [Google Scholar] [CrossRef]
- Konlechner, T.M.; Hilton, M.J. Post-disturbance evolution of a prograded foredune barrierduring a sustained dynamic restoration project—the role ofwind speed, wind direction and vegetation. Earth Surf. Process Landf. 2022, 47, 3435–3452. [Google Scholar] [CrossRef]
- D’Alessandro, F.; Tomasicchio, G.R.; Francone, A.; Leone, E.; Frega, F.; Chiaia, G.; Saponieri, A.; Damiani, L. Coastal sand dune restoration with an eco-friendly technique. Aquat. Ecosyst. 2020, 23, 147–426. [Google Scholar] [CrossRef]


| ID | Simulated Scenarios | Storm Condition | Hs [m] | Tp [s] | Storm Duration [d] |
|---|---|---|---|---|---|
| 1 | Benchmark | LE | 2.00 | 6.03 | 1.5 |
| 2 | HE | 5.57 | 10.09 | ||
| 3 | Nourishment | LE | 2.00 | 6.03 | 1.5 |
| 4 | HE | 5.57 | 10.09 | ||
| 5 | Dune-Position 1 | LE | 2.00 | 6.03 | 1.5 |
| 6 | HE | 5.57 | 10.09 | ||
| 7 | Dune-Position 2 | LE | 2.00 | 6.03 | 1.5 |
| 8 | HE | 5.57 | 10.09 | ||
| 9 | Dune-Position 3 | LE | 2.00 | 6.03 | 1.5 |
| 10 | HE | 5.57 | 10.09 |
| Simulated Scenarios | Standard Deviation | |
|---|---|---|
| Max | Min | |
| Benchmark | 0.017 | 0.000 |
| Nourishment | 0.024 | 0.000 |
| Dune-Position 1 | 0.027 | 0.000 |
| Dune-Position 2 | 0.017 | 0.000 |
| Dune-Position 3 | 0.019 | 0.000 |
| Simulated Scenarios | Net Eroded Volume [m3/m] | Corrected Eroded Volume [m3/m] | Absolute Volume Variation [m3/m] | Percent Volume Variation |
|---|---|---|---|---|
| Benchmark | 19.01 | 19.01 | - | - |
| Nourishment | 18.48 | 22.84 | −3.83 | −20.1% |
| Dune-Position 1 | 15.22 | 19.58 | −0.57 | −3.0% |
| Dune-Position 2 | 12.38 | 16.74 | 2.27 | 12.0% |
| Dune-Position 3 | 4.71 | 9.07 | 9.94 | 52.3% |
| Simulated Scenarios | Max Erosion Distance [m] | Absolute Distance Variation [m] | Percentage Distance Variation |
|---|---|---|---|
| Benchmark | 83 | - | - |
| Nourishment | 83 | 0 | 0 |
| Dune-Position 1 | 57 | 26 | 31% |
| Dune-Position 2 | 38 | 45 | 54% |
| Dune-Position 3 | 27 | 56 | 67% |
Disclaimer/Publisher’s Note: The statements, opinions and data contained in all publications are solely those of the individual author(s) and contributor(s) and not of MDPI and/or the editor(s). MDPI and/or the editor(s) disclaim responsibility for any injury to people or property resulting from any ideas, methods, instructions or products referred to in the content. |
© 2023 by the authors. Licensee MDPI, Basel, Switzerland. This article is an open access article distributed under the terms and conditions of the Creative Commons Attribution (CC BY) license (https://creativecommons.org/licenses/by/4.0/).
Share and Cite
Costa, G.P.; Marino, M.; Cáceres, I.; Musumeci, R.E. Effectiveness of Dune Reconstruction and Beach Nourishment to Mitigate Coastal Erosion of the Ebro Delta (Spain). J. Mar. Sci. Eng. 2023, 11, 1908. https://doi.org/10.3390/jmse11101908
Costa GP, Marino M, Cáceres I, Musumeci RE. Effectiveness of Dune Reconstruction and Beach Nourishment to Mitigate Coastal Erosion of the Ebro Delta (Spain). Journal of Marine Science and Engineering. 2023; 11(10):1908. https://doi.org/10.3390/jmse11101908
Chicago/Turabian StyleCosta, Giuseppe Pio, Massimiliano Marino, Iván Cáceres, and Rosaria Ester Musumeci. 2023. "Effectiveness of Dune Reconstruction and Beach Nourishment to Mitigate Coastal Erosion of the Ebro Delta (Spain)" Journal of Marine Science and Engineering 11, no. 10: 1908. https://doi.org/10.3390/jmse11101908