Article

An Inequality Indicator for High-Resistance Connection Fault Diagnosis in Marine Current Turbine

1
Logistics Engineering College, Shanghai Maritime University, Shanghai 201306, China
2
ISEN Yncréa Ouest Brest, UMR CNRS 6027 IRDL, 29200 Brest, France
*
Authors to whom correspondence should be addressed.
J. Mar. Sci. Eng. 2023, 11(1), 97; https://doi.org/10.3390/jmse11010097
Submission received: 1 December 2022 / Revised: 12 December 2022 / Accepted: 15 December 2022 / Published: 4 January 2023
(This article belongs to the Section Marine Energy)

Abstract

:
Marine current energy is an abundant renewable energy resource. Marine current turbines (MCTs) can convert the kinetic energy of marine currents into electrical energy. However, the variations in the marine currents are violent and complex. These characteristics will be reflected in the variation in the operating condition of MCTs, thus interfering with normal diagnosis for the high-resistance connection (HRC). The HRC can be caused by damaged connections between device components that are easily made due to the harsh marine environment. To diagnose HRC in MCT, an inequality indicator is proposed to quantify the current imbalance caused by HRC. The inequality indicator is defined based on the arithmetic–geometric mean inequality and can identify slight current imbalances in the early stages of HRC. The inequality indicator is robust to the variable operating conditions of the permanent magnet synchronous machine (PMSM) in the MCT. Experimental results show that the inequality indicator can be used to effectively diagnose HRC in the MCT with 100% accuracy. This research will help maintain the health condition of the MCTs and provide some ideas for diagnosis in MCTs. Moreover, the inequality indicator may provide a different approach to the analysis for other faults that can lead to a current imbalance.

1. Introduction

Marines cover almost two-thirds of the earth and are rich in renewable energy [1]. Marine current turbines (MCTs) can convert the kinetic energy of marine currents into electrical energy [2]. Much attention is being paid to permanent magnet synchronous machines (PMSMs) connected through power converts due to their following advantages: high-power density, compact structure, and relatively low cost in MCTs [3]. However, swell effects are present in marine currents. In a short time, a marine current may sharply fluctuate within several seconds [4]. Such short-time fluctuations in marine currents are characterized by long-wavelength swells [4]. The MCTs are normally operated at the maximum power point to capture as much energy as possible in variable marine currents [5]. The maximum power point will fluctuate due to long-wavelength swells [6,7], which will affect the operating condition of the PMSM. Moreover, the short-time fluctuations in marine currents are continuous and uncertain [8], which means that the operating condition of the PMSM will continuously fluctuate. Violent and continuous fluctuations in the operating condition of the PMSM inevitably interfere with the normal fault diagnosis. Therefore, fault diagnosis methods are necessary to favor robustness under the variable operating conditions of PMSM.
Many faults can lead to an imbalance in PMSM, such as inter-turn fault [9,10,11], eccentricity fault [12,13,14], demagnetization fault [15,16], and open-phase fault [17,18]. The current imbalance is a feature of some of these faults. The presence of the current imbalance implies that some faults may be present in the PMSM. The high-resistance connection (HRC) is a common fault that leads to a current imbalance. The HRC may be caused by loose or damaged connections between any components between the industrial electrical machine and the inverter [19,20]. The damaged connections may be formed due to poor manufacturing technology, corrosion, aging, high current or voltage, vibration, thermal cycling [21], etc. However, there are factors in the marine environment that can damage the connections between components in a PMSM, such as humidity, salt, and variable marine currents [22], thus increasing the possibility of HRC. Additionally, HRC is a typical progressive fault [23]. There are some hazards due to HRC, such as localized overheating and enhanced vibration. These hazards may lead to positive feedback that spontaneously deepens the severity of HRC. Early HRC can lead to energy consumption and lower current quality in the PMSM. However, as the fault severity deepens, HRC may induce insulation damage, which may evolve into other types of faults, or even lead to electrical fires due to excessive ohmic heat. Therefore, HRC diagnosis should be handled in the early stages of HRC to avoid additional risks. The features of early HRC are less obvious. At the early stage of the HRC, the additional resistances in the fault phase are not large, and the current imbalance caused by HRC is slight [24]. The features of early HRC are easily submerged by the interference of long-wavelength swells. Diagnosing early HRC in MCT is more difficult in the presence of interference from long-wavelength swells.
Recently, the HRC diagnosis attracted the relevant attention of researchers. The HRC was initially studied in the field of induction motors. Many methods have been proposed for HRC fault detection in IM, based on upstream impedance measurement [25], negative sequence current and zero-sequence voltage [26], multireference frame controller [27], signal injection [23], inverse negative sequence regulator [28], etc. In the field of PMSMs, the diagnosis methods for HRC in [24,29,30,31] are to construct a fault diagnosis model by zero sequence component in the current or voltage in three-phase PMSM, and it will gradually realize detection, and the estimation of fault severity and identification of fault phases with the deepening of research. However, all these methods require additional sensors and special measurement loops to obtain the necessary signals, which is not suitable for MCT. In [32], a current-control scheme is proposed based on a higher-order sliding mode, which is the first attempt to implement fault-tolerant control for HRC in a three-phase PMSM. However, the detection algorithm becomes much more complicated for such a scheme in multi-phase HRC, and thus the diagnosis of multi-phase HRC is not implemented in this paper. In [33], the high-frequency and low-frequency components of the zero-sequence voltage are used to establish an appropriate fault indicator to identify the inter-turn fault and HRC. However, multi-phase HRC fault diagnosis cannot be achieved synchronously. In [34], a model-based method by voltage deviations is proposed to diagnose HRC in three-phase PMSM. This method uses only the built-in sensors of the PMSM for fault diagnosis, but it needs to be discussed separately whether the voltage deviation is significantly affected by the long-wavelength swells in the marine current.
In order to better diagnose HRC while avoiding the interference caused by the long-wavelength swells, a diagnosis method consisting of two stages is proposed in this paper: a robust indicator and additional filtering. The inequality indicator is proposed to quantify the current imbalance in the PMSM. The diagnostic mechanism of the inequality indicator is analyzed based on the PMSM model and the current model. Based on the inequality indicator, the HRC diagnosis requires only the built-in stator current sensor, which can help to reduce the complexity of the diagnosis method in the MCTs. Experimental results and theoretical analysis show that the inequality indicator is robust under early HRC conditions. Moreover, the inequality indicator can be easily constructed from the current amplitude. The mean square (MS) value can be used to obtain amplitude from the current, and in this process, an MS-based filtering method is proposed to further reduce the effect of the variable marine current. The MS-based filtering method is well compatible with the inequality indicator and can effectively improve the performance of the inequality indicator. By combining the inequality indicator and MS-based filtering method, the features of HRC can be effectively extracted under the interference caused by the long-wavelength swells.
The organization of this paper is as follows. Section 2 describes the PMSM model and the stator current model under HRC. Section 3 describes the features of long-wavelength swells. Section 4 describes the proposed HRC diagnosis method. Section 5 describes the experiments to verify the effectiveness of the diagnosis method. Finally, the conclusion is drawn in Section 6.

2. PMSM Model and Current Model under HRC Condition

2.1. PMSM Model under HRC Condition

The resistive imbalance due to HRC can be emulated by adding additional resistances connected to the stator phase windings [24]. Ignoring the core saturation, eddy loss, and hysteresis loss, the voltage equations of the three-phase PMSM can be expressed as follows [24]:
[ u 3 s ] = [ R 3 s ] [ i 3 s ] + [ L 3 s ] d d t [ i 3 s ] + [ e 3 s ]
where [ u 3 s ] = [ u a , u b , u c ] T is a matrix of stator voltage; [ i 3 s ] = [ i a , i b , i c ] T is a matrix of stator current; [ L 3 s ] is a matrix of stator winding inductance; [ R 3 s ] is a matrix of stator winding resistance; and [ e 3 s ] is a matrix of induced electromotive force (EMF) components. Additionally, [ L 3 s ] and [ e 3 s ] can be expressed as:
[ L 3 s ] = [ L M M M L M M L L ]
and
[ e 3 s ] = d d t [ Ψ f a Ψ f b Ψ f c ] = d d t [ Ψ f cos ( θ e ) Ψ f cos ( θ e + 4 π / 3 ) Ψ f cos ( θ e + 2 π / 3 ) ]
where L is the self-inductance of the stator windings; M is the mutual inductance between the stator windings; and Ψ f is the amplitude of the magnet flux. By adding additional resistances to the phase resistances of the PMSM when HRC occurs, [ R 3 s ] can be expressed as
[ R 3 s ] = [ R 0 + R a 0 0 0 R 0 + R b 0 0 0 R 0 + R c ]
where R0 is the original phase resistance; Ra, Rb, and Rc are additional resistances in a-, b-, and c-phases of the PMSM due to HRC.

2.2. Current Model under HRC Condition

The HRC may cause the positive, negative, and zero sequence components in the stator currents [24,35]. Moreover, HRC leads to zero sequence current in the angle-connected PMSM but not in the star-connected PMSM. When the HRC occurs in a star-connected PMSM, neglecting the harmonic component, the stator current can be expressed as [35]:
{ i a = I p cos ( θ e φ p ) + I n cos ( θ e φ n ) i b = I p cos ( θ e φ p + 4 π / 3 ) + I n cos ( θ e φ n + 2 π / 3 ) i c = I p cos ( θ e φ p + 2 π / 3 ) + I n cos ( θ e φ n + 4 π / 3 )
where ia, ib, and ic are stator currents in a-, b-, and c-phases of the PMSM, respectively; Ip and In are the amplitudes of the positive and negative sequence components, respectively; φp and φn are the initial phase angles of the positive and negative sequence components, respectively; θe is the rotor electrical position. From (2), the stator current amplitude can be expressed as:
{ I a = I p 2 + I n 2 + 2 I p I n cos ( Δ θ a ) I b = I p 2 + I n 2 + 2 I p I n cos ( Δ θ b ) I c = I p 2 + I n 2 + 2 I p I n cos ( Δ θ c )
where Ia, Ib, and Ic are stator current amplitudes in a-, b-, and c-phases of the PMSM, respectively; Δθa, Δθb, and Δθc are phase angle differences between the positive and negative sequence components in a-, b-, and c-phases of the PMSM and can be expressed as:
{ Δ θ a = φ p φ n Δ θ b = φ p φ n + 4 π / 3 Δ θ c = φ p φ n + 2 π / 3
From (3), amplitudes of three-phase stator current amplitudes are not equal, which means that the current imbalance occurs. The phase angle differences preserve three-phase symmetry.

3. Feature of Long-Wavelength Swells

This section describes the fluctuations in the stator current amplitudes due to long-wavelength swells.
The extracted power by the MCT can be expressed as [36]:
P m = 1 2 π ρ r 2 v 3 C p
where ρ is the density of seawater; r is the radius of the blade of the MCT; v is the marine current speed; and Cp is the power coefficient of the MCT. In the output circuit, the output power generated by the PMSM under HRC conditions can be simply expressed as [37,38]:
P m = 1 2 ( I a 2 ( R l + R 0 + R a ) + I b 2 ( R l + R 0 + R b ) + I c 2 ( R l + R 0 + R c ) )
where Rl is load. At the early stage of the HRC, the difference between stator current amplitudes is slight [24]. Ignoring the difference between the stator current amplitudes, the stator current amplitude can be approximately expressed as:
I a I b I c ( 2 P m 3 ( R 0 + R l ) + g = a , b , c R g ) 1 2 = ( π ρ r 2 C p 3 ( R 0 + R l ) + g = a , b , c R g ) 1 2 v 3 2
In actual environments, the fluctuations of the marine current may reach 10–30% of the marine current speed [39]. From (7), the stator current amplitudes in the MCT may fluctuate with the marine current and may be more violent than the marine current. The features of early HRC are easily submerged by the violent fluctuations caused by long-wavelength swells.

4. An Inequality Indicator for HRC Fault Diagnosis

To diagnose HRC while avoiding the interference caused by the long-wavelength swells, an inequality indicator is proposed in this section. Then, the diagnostic mechanism of the inequality indicator is analyzed. The robustness of the inequality indicator is analyzed in terms of the feature of long-wavelength swells. Finally, an MS-based filtering method is proposed to further avoid the interference from long-wavelength swells.

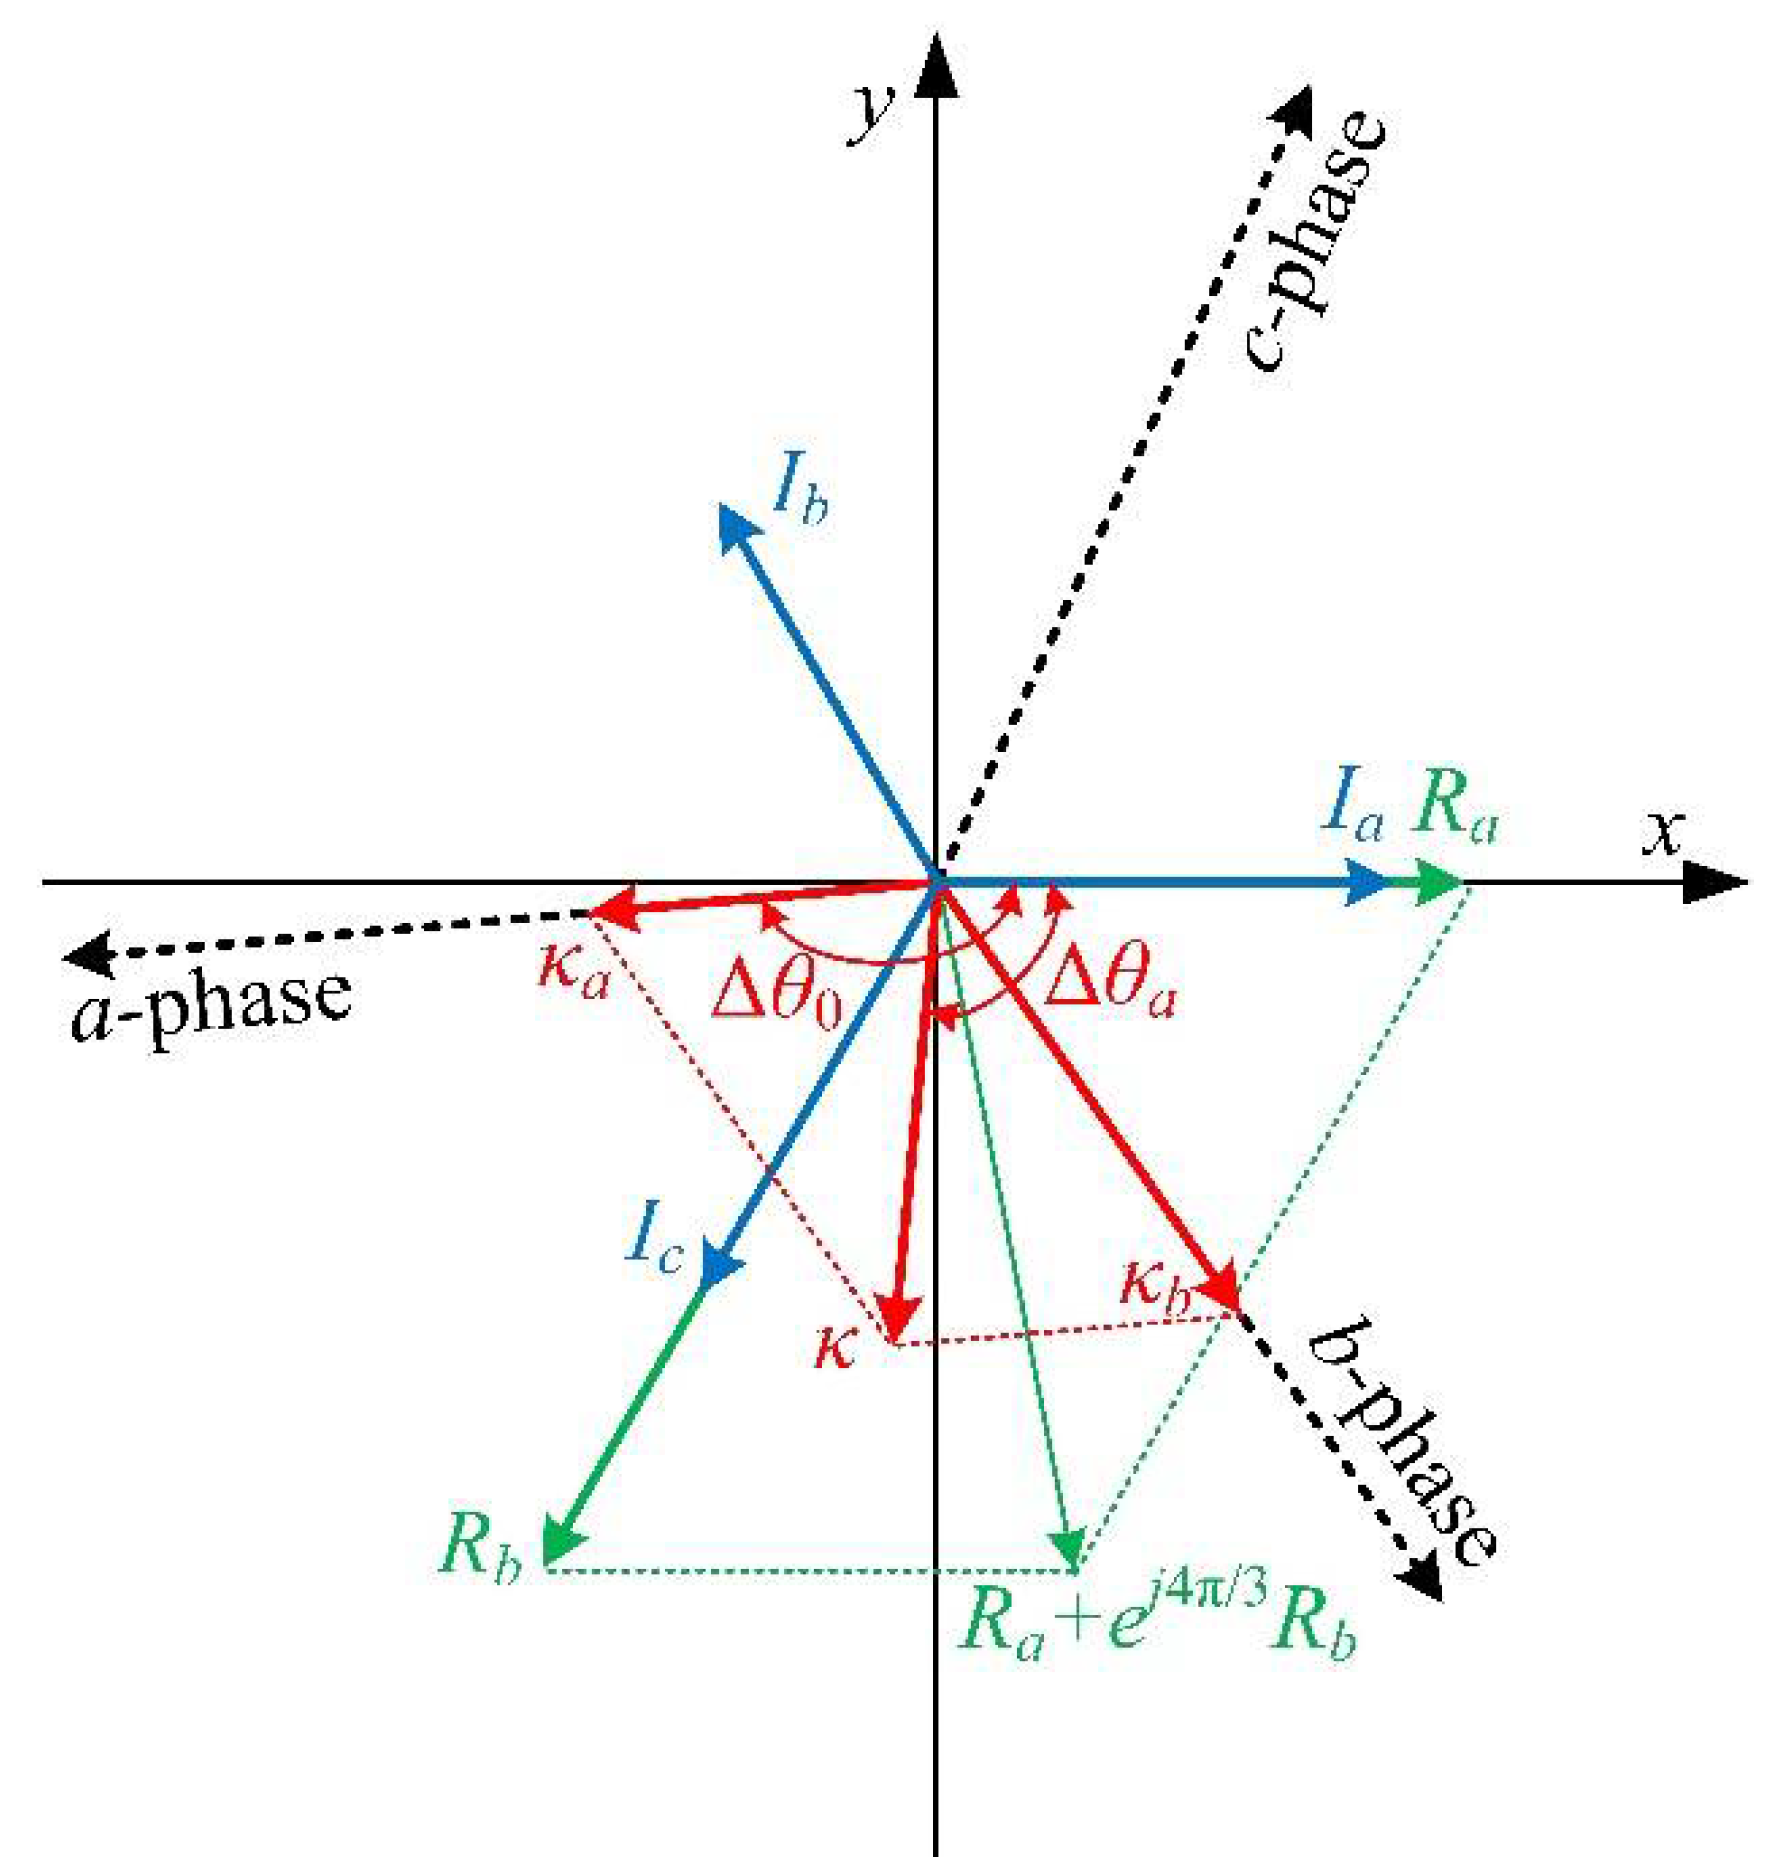
4.1. The Inequality Indicator

The inequality indicator is defined as follows:
κ 0 = 3 h 1 = 1 n ( x h 1 h 2 = 1 , h 1 h 2 n x h 2 ) ( h 1 = 1 n x h 1 ) 2
where x1, x2, …, xn are elements of the inequality indicator. There are some known arithmetic–geometric mean (AM-GM) inequalities for these elements, as follows [40]:
x h 1 2 + x h 2 2 2 x h 1 x h 2 ,   h 1 h 2
The larger the difference between two elements of the AM-GM inequality, the larger the difference between the values of the two sides of the AM-GM inequality. Then, several AM-GM inequalities can be combined to form a total inequality as follows:
( h 1 = 1 n x h 1 ) 2 = h 1 = 1 n x h 1 2 + 2 h 1 = 1 n ( x h 1 h 2 = 1 , h 1 h 2 n x h 2 ) 3 h 1 = 1 n ( x h 1 h 2 = 1 , h 1 h 2 n x h 2 )
The inequality indicator can be equivalent to several AM-GM inequalities, thus quantifying the imbalance between multiple elements based on the AM-GM inequality. An advantage of the inequality indicator is that it is not limited by the number of elements, and the inequality indicator can be easily extended to multi-phase electrical devices. It should be noted that the inequality indicator is dimensionless if each element of the indicator has the same dimension.
The inequality indicator may have physical meaning in some applications. From (3), stator current amplitudes are added as the form of vectors and scalars, respectively:
S v e c t o r = I a 2 + e j 2 π / 3 I b 2 + e j 4 π / 3 I c 2 = 3 I p I n e j Δ θ a
S s c a l a r = I a 2 + I b 2 + I c 2 = 3 ( I p 2 + I n 2 )
From (11) and (12), a parameter can be expressed as:
κ = I p I n I p 2 + I n 2 = | S v e c t o r | S s c a l a r = | I a 2 + e j 2 π / 3 I b 2 + e j 4 π / 3 I c 2 | I a 2 + I b 2 + I c 2 = I a 4 + I b 4 + I c 4 I a 2 I b 2 I b 2 I c 2 I c 2 I a 2 I a 2 + I b 2 + I c 2 = 1 3 ( I a 2 I b 2 + I b 2 I c 2 + I c 2 I a 2 ) ( I a 2 + I b 2 + I c 2 ) 2
The basis of κ is three AM-GM inequalities and can be expressed as:
{ I a 4 + I b 4 2 I a 2 I b 2 I b 4 + I c 4 2 I b 2 I c 2 I c 4 + I a 4 2 I c 2 I a 2
When the stator currents are balanced, κ takes to be the minimum, which is zero. When the stator currents are imbalanced, κ increases with the severity of the current imbalance. Therefore, κ is an inequality indicator consisting of the stator current amplitudes and can be used to estimate the severity of the current imbalance in the three-phase PMSM. Moreover, κ is dimensionless.

4.2. Diagnostic Mechanism of Inequality Indicator

Based on the PMSM model in (1), the instantaneous power for the PMSM can be expressed as:
P s = [ i 3 s ] T [ u 3 s ] = g = a , b , c ( R 0 + R g ) i g 2 + g = a , b , c i g ( L d d t i g + M h = a , b , c , h g d d t i h ) + g = a , b , c i g d d t Ψ f g
By substituting (2), (3), and (4) into (15), Ps can be expressed as:
P s = 3 2 ( I p 2 + I n 2 ) R 0 + 3 I p I n R 0 cos ( 2 θ e φ p φ n ) + 1 2 ( I p 2 + I n 2 ) ( R a + R b + R c ) + 1 2 I p 2 R s cos ( 2 θ e 2 φ p φ s ) + 1 2 I n 2 R s cos ( 2 θ e 2 φ n + φ s ) + I p I n R s cos ( φ p φ n + φ s ) + I p I n ( R a + R b + R c ) cos ( 2 θ e φ p φ n ) + 3 w e ( M L ) I p I n sin ( 2 θ e φ p φ n ) 3 2 w e Ψ f I p sin ( φ p ) 3 2 w e Ψ f I n sin ( 2 θ e φ p )
where w e is the electrical angular velocity of the PMSM; Rs and φs are expressed as:
R s e j φ s = R a + R b e j 4 π / 3 + R c e j 2 π / 3
The I p I n is the amplitude of S v e c t o r in (11). Similar to S v e c t o r and κ , R s correspond to the resistive imbalance [34]. The amplitude of P s can be expressed as:
P s _ m = 1 2 ( I p 2 + I n 2 ) ( 3 R 0 + R a + R b + R c ) + I p I n R s cos ( Δ θ 0 ) 3 2 w e Ψ f I p sin ( φ p )
and Δ θ 0 is expressed as:
Δ θ 0 = φ p φ n + φ s = Δ θ a + φ s
From (18), in addition to the normal ohmic heat release, P s _ m also has a component composed of resistance imbalance and current imbalance. Δ θ 0 is consists of the phase angle of the resistive imbalance and the current imbalance.
By combining (11) and (12), the vector form of κ can be expressed as:
κ v = κ e j Δ θ a = S v e c t o r S s c a l a r = I a 2 3 ( I p 2 + I n 2 ) + e j 2 π / 3 I b 2 3 ( I p 2 + I n 2 ) + e j 4 π / 3 I c 2 3 ( I p 2 + I n 2 )
By rotating to the direction of Δ θ 0 Δ θ a , the vector in (20) can be expressed as:
κ e j ( Δ θ 0 Δ θ a ) = I a 2 e j ( Δ θ 0 ) + I a 2 e j ( Δ θ 0 + 4 π / 3 ) + I c 2 e j ( Δ θ 0 + 2 π / 3 ) 3 ( I p 2 + I n 2 ) = δ a + δ b e j 4 π / 3 + δ c e j 2 π / 3
where δ a , δ b , and δ c have some relation as follows:
{ δ b δ a = 2 3 9 1 I p 2 + I n 2 ( I a 2 sin ( Δ θ 0 + 4 π / 3 ) + I b 2 sin ( Δ θ 0 + 2 π / 3 ) + I c 2 sin ( Δ θ 0 ) ) δ a δ c = 2 3 9 1 I p 2 + I n 2 ( I a 2 sin ( Δ θ 0 + 2 π / 3 ) + I b 2 sin ( Δ θ 0 ) + I c 2 sin ( Δ θ 0 + 4 π / 3 ) ) δ c δ b = 2 3 9 1 I p 2 + I n 2 ( I a 2 sin ( Δ θ 0 ) + I b 2 sin ( Δ θ 0 + 4 π / 3 ) + I c 2 sin ( Δ θ 0 + 2 π / 3 ) )
From (21) and (22), κ v can be decomposed into three reference directions: Δ θ 0 , Δ θ 0 + 2 π / 3 and Δ θ 0 + 4 π / 3 , which correspond to a-, b-, and c-phases of the PMSM, respectively. The decomposition result of κ v can be expressed as:
{ phases   a , b : κ a κ b = δ a δ c δ b δ c = 1 2 3 2 cot ( Δ θ 0 Δ θ a ) phases   b , c : κ b κ c = δ b δ a δ c δ a = 1 2 3 2 cot ( Δ θ 0 Δ θ a + 2 3 π ) phases   c , a : κ c κ a = δ c δ b δ a δ b = 1 2 3 2 cot ( Δ θ 0 Δ θ a + 4 3 π )
where κ a , κ b , and κ c are the components that κ v decomposes on the a-, b-, and c-phases, respectively. Figure 1 shows the basic mode of the decomposition of κ v . From (17), the relationship between additional resistances of fault phases within different HRC conditions can be obtained as:
{ phases   a ,   b : R a R b = 1 2 3 2 cot ( Δ 0 Δ a ) phases   b ,   c : R b R c = 1 2 3 2 cot ( Δ 0 Δ a + 2 π / 3 ) phases   c ,   a : R c R a = 1 2 3 2 cot ( Δ 0 Δ a + 4 π / 3 )
By comparing (23) and (24), it can be known that κ a , κ b , and κ c are proportional to the additional resistances R a , R b , and R c , respectively, which can be expressed as:
κ R s = κ a R a = κ b R b = κ c R c
Therefore, κ can be used as a fault indicator to estimate the severity of HRC in the PMSM.

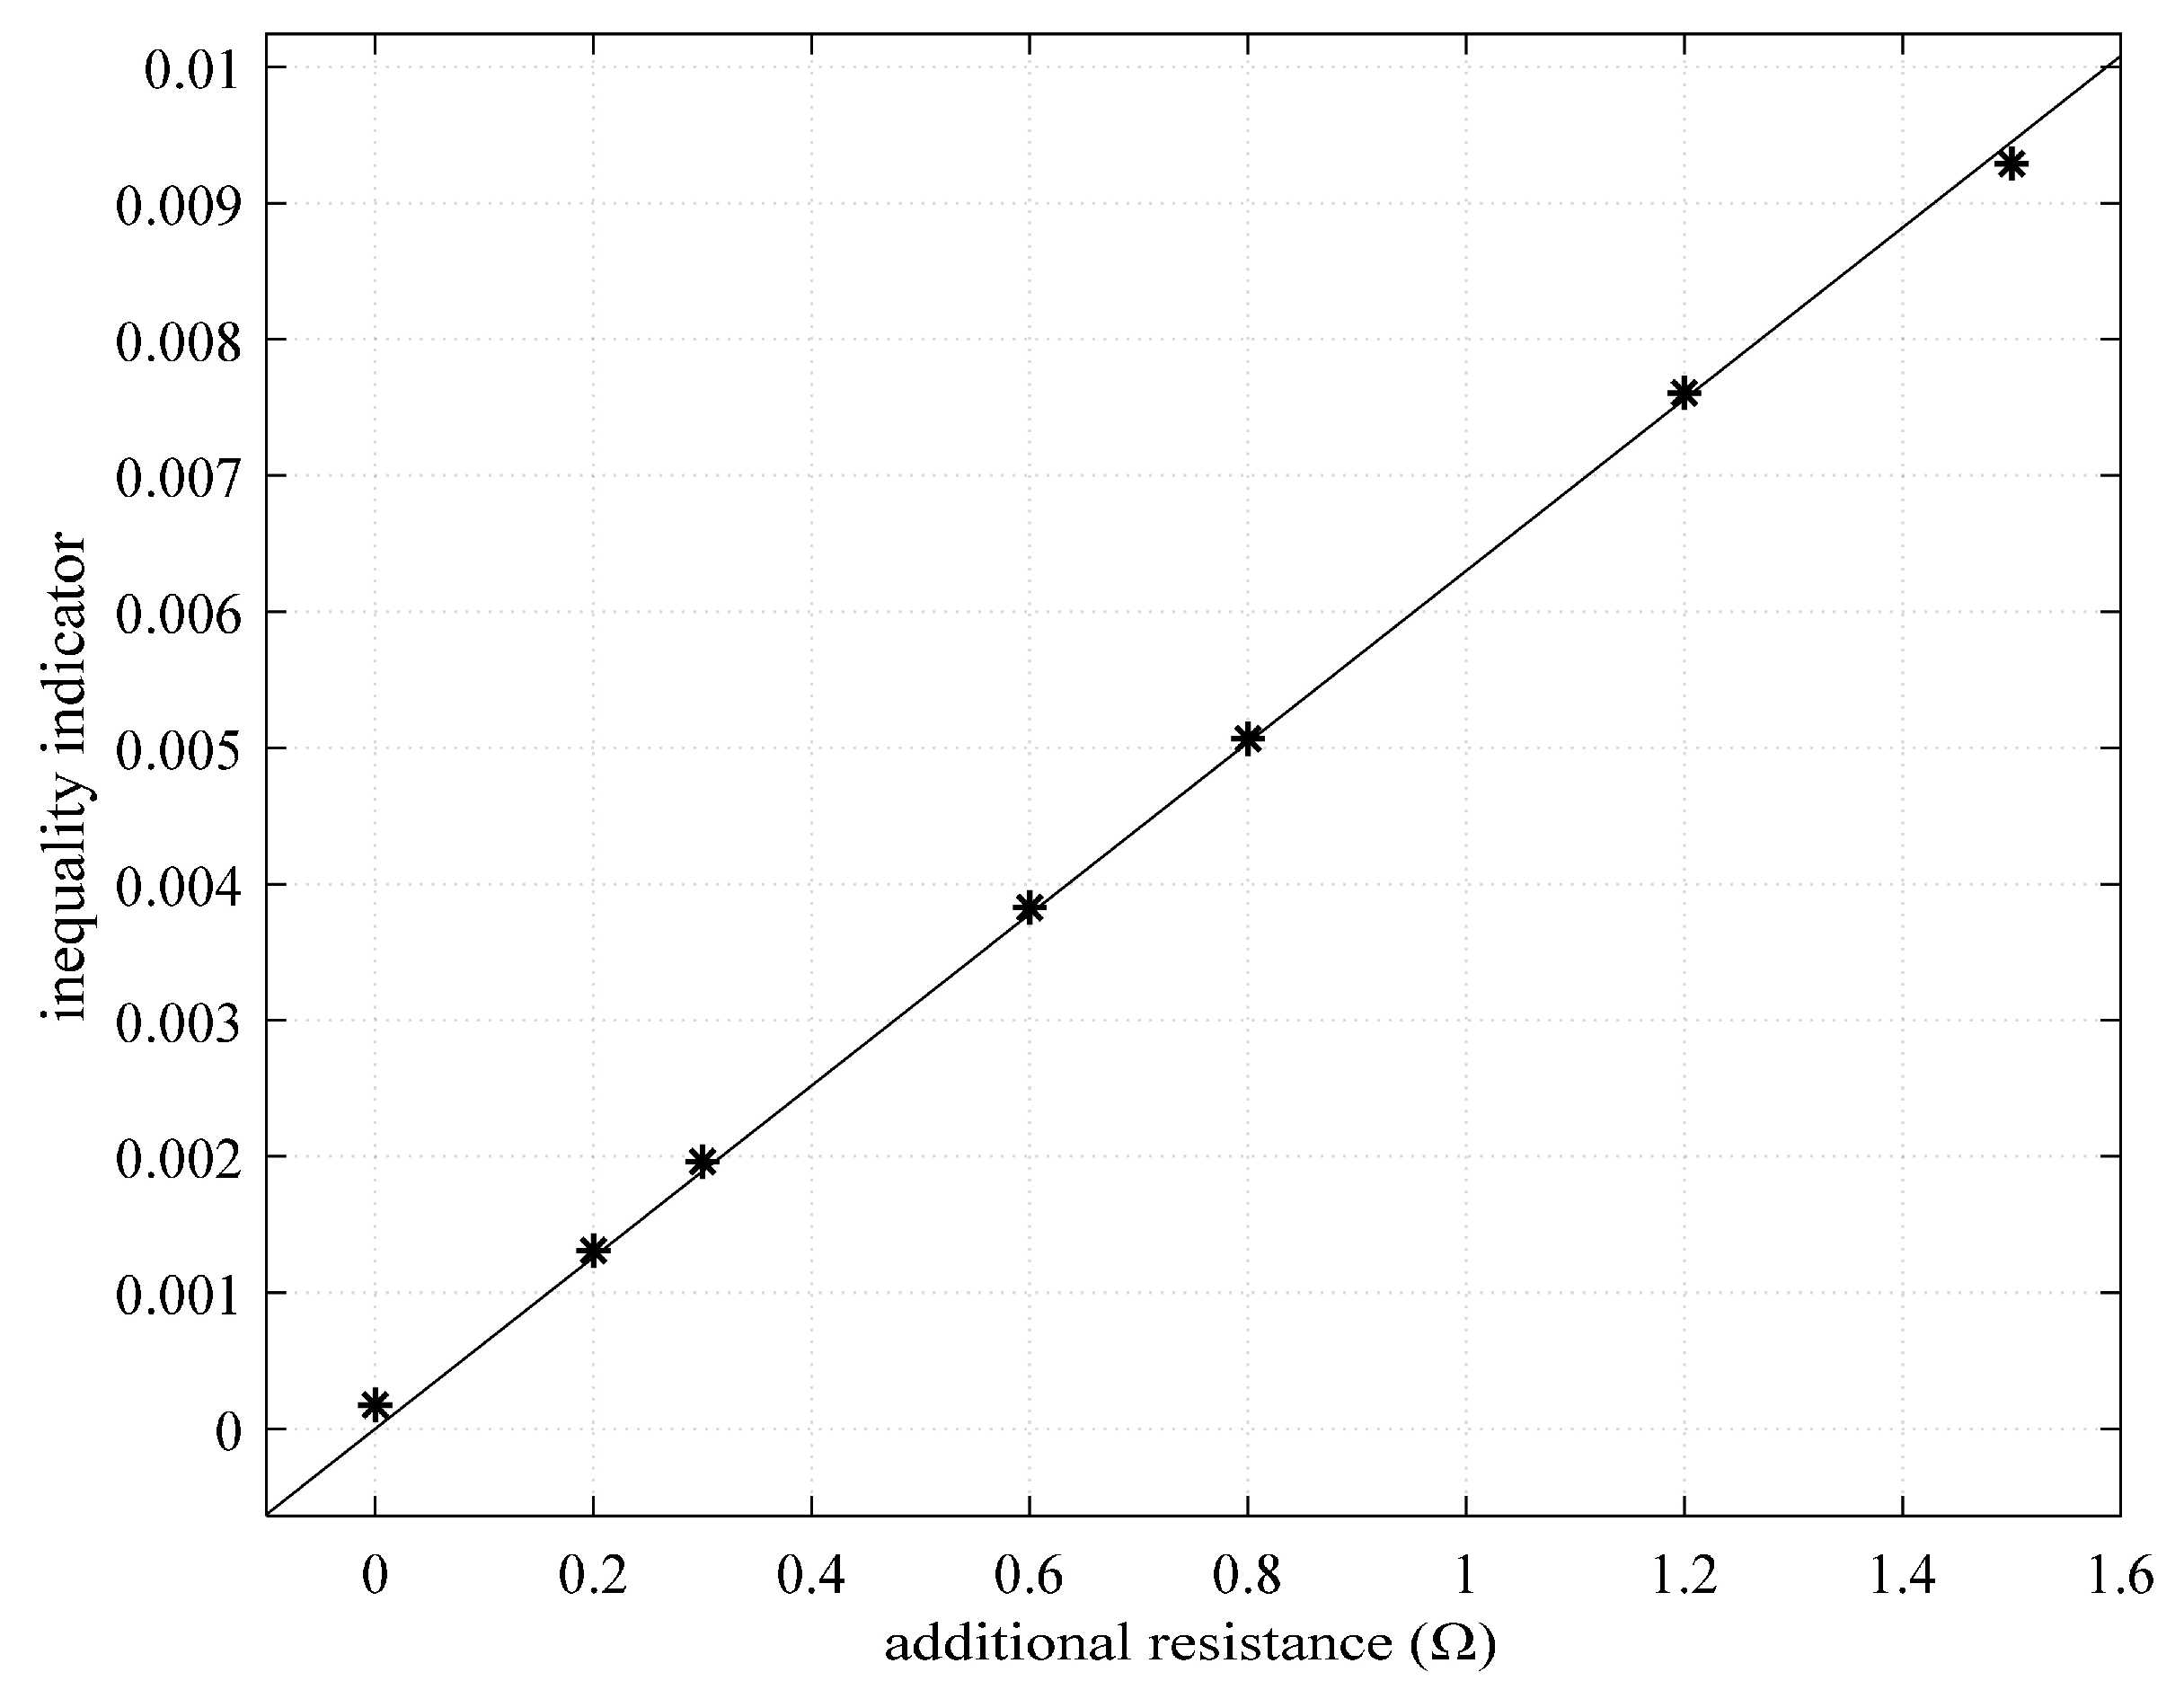
4.3. Robustness of Inequality Indicator

When early HRCs occur in a PMSM of the MCT, the variations due to long-wavelength swells are much larger than that due to HRCs in the stator current amplitude. Thus, the difference between stator current amplitudes is slight. The variation caused by long-wavelength swells is separated as:
{ I a 2 ( t ) = k ( t ) I a _ 0 2 I b 2 ( t ) = k ( t ) I b _ 0 2 + Δ I b 2 ( t ) I c 2 ( t ) = k ( t ) I c _ 0 2 + Δ I c 2 ( t )
where I a _ 0 , I b _ 0 , and I c _ 0 are the amplitudes of three-phase stator current under a specific operating condition of the PMSM; k is the proportion of the common variation; and Δ I b 2 and Δ I c 2 are the errors due to the current imbalance. When long-wavelength swells exist, there are some relations that Δ I b 2 < < I b 2 and Δ I c 2 < < I c 2 due to I a I b I c . By substituting (26) into (20), the κ v can be expressed as:
κ v ( t ) = I a 2 ( t ) + I b 2 ( t ) e j 2 π / 3 + I c 2 ( t ) e j 4 π / 3 I a 2 ( t ) + I b 2 ( t ) + I c 2 ( t ) = ( I a _ 0 2 + I b _ 0 2 e j 2 π / 3 + I c _ 0 2 e j 4 π / 3 ) k ( t ) ( I a _ 0 2 + I b _ 0 2 + I c _ 0 2 ) k ( t ) + Δ I b 2 ( t ) + Δ I c 2 ( t ) + Δ I b 2 ( t ) e j 2 π / 3 + Δ I c 2 ( t ) e j 4 π / 3 ( I a _ 0 2 + I b _ 0 2 + I c _ 0 2 ) k ( t ) + Δ I b 2 ( t ) + Δ I c 2 ( t )  
Due to Δ I b 2 < < I b 2 and Δ I c 2 < < I c 2 , κ in (27) can be approximated as:
κ ( t ) = | κ v | ( t ) | I a _ 0 2 + I b _ 0 2 e j 2 π / 3 + I c _ 0 2 e j 4 π / 3 | I a _ 0 2 + I b _ 0 2 + I c _ 0 2
From (28), κ is not sensitive to the value of k . Therefore, κ tends to be robust under the variable operating condition of the PMSM.

4.4. Filtering for Improving Diagnostic Accuracy

Although the κ is robust to the variable operating conditions of the PMSM, there are still inevitable fluctuations in the signal of κ due to the complex and variable working environment. To further avoid the effects from the long-wavelength swells, an MS-based filtering method is proposed as follows.
The stator current amplitude can be obtained by the MS value. The mean-square value I MS 2 under a specific time ([t1, t2]) can be obtained as [41]:
I MS 2 = 1 t 2 t 1 t 1 t 2 i g 2 ( t ) d t ,   g = a ,   b   and   c
It is assumed that the fundamental frequency of the stator current remains constant for a short time, the stator current amplitude can be obtained as:
I g = 2 I MS 2 ,   g = a ,   b   and   c
At long times, the signal of the stator current can be divided into several short-term finite element sequences. Then, the stator current amplitude can be calculated by (29) and (30) in these finite element sequences. However, spectrum leakage may be inevitable and lead to periodic oscillations in the signal of the stator current amplitude. The window function is known to be efficient in avoiding spectrum leakage. To avoid the oscillations due to spectrum leakage, the stator current amplitude can be obtained as:
I g ( T t ) = 2 I g _ MS 2 ( T t ) = m = T t w f / 2 w f 2 i g 2 ( m ) W f ( m ) m = T t w f / 2 w f W f ( m ) ,   g = a ,   b   and   c
where W f is the window function; w f is the length of the intercepted finite element sequence; and T is the sampling period.
In a finite element sequence, the weight coefficient of a sample on the MS value is W f / W f . Taking T < < w f , the weight coefficient of a sample in all finite element sequences containing this sample can be approximately expressed as:
W f ( m 0 ) + W f ( m 0 + T ) + + W f ( w f ) m = T t w f / 2 w f W f ( m ) 1 w f / T   1 T ( W f ( 1 ) + W f ( 2 ) + + W f ( w f ) ) m = T t w f / 2 w f W f ( m ) w f T = 1 w f   ,   m 0 [ 1 , T ] .
The weight coefficient of a sample is 1 / w f on average. Therefore, the filtering in (31) can make the signal waveform smoother since the effect of each sample is weakened, and w f is the main factor affecting the filtering effect.
The w f can smooth the signal, but excessive w f weakens the real-time performance of the diagnosis and takes up additional computational resources. The T can be used to save computational resources. The window function is able to avoid oscillations due to spectral leakage. These elements perform their respective functions and do not affect each other.
It is assumed that the length of a signal of the stator current amplitude is much larger than w f . The mean value of the square of this signal can be expressed as:
E ( I g 2 ) = T t = 1 L / T I g 2 ( T t ) L = T t = 1 L / T ( m = T t w f / 2 w f 2 i g 2 ( m ) W f ( m ) ) L m = T t w f / 2 w f W f ( m ) T t = 1 L 2 i g 2 ( t ) L m = T t w f / 2 w f W f ( m ) m = T t w f / 2 w f W f ( m ) T = t = 1 L 2 i g 2 ( t ) L
where L is the length of the signal of the stator current amplitude. It is obvious that the MS-based filtering method does not change the mean value of the square of the stator current amplitude and hence does not change the mean value of κ . The MS-based filtering method is well compatible with κ .

5. Experimental Results and Discussions

First, an experimental platform is introduced. Then, the robustness of the inequality indicator is shown under a fault case. The effect of the MS-based filtering method on the inequality indicator is analyzed under multiple fault cases. Experimental results show the effectiveness of the inequality indicator for the early HRC diagnosis. Finally, the performance of the inequality indicator is analyzed when the current imbalance is slight.

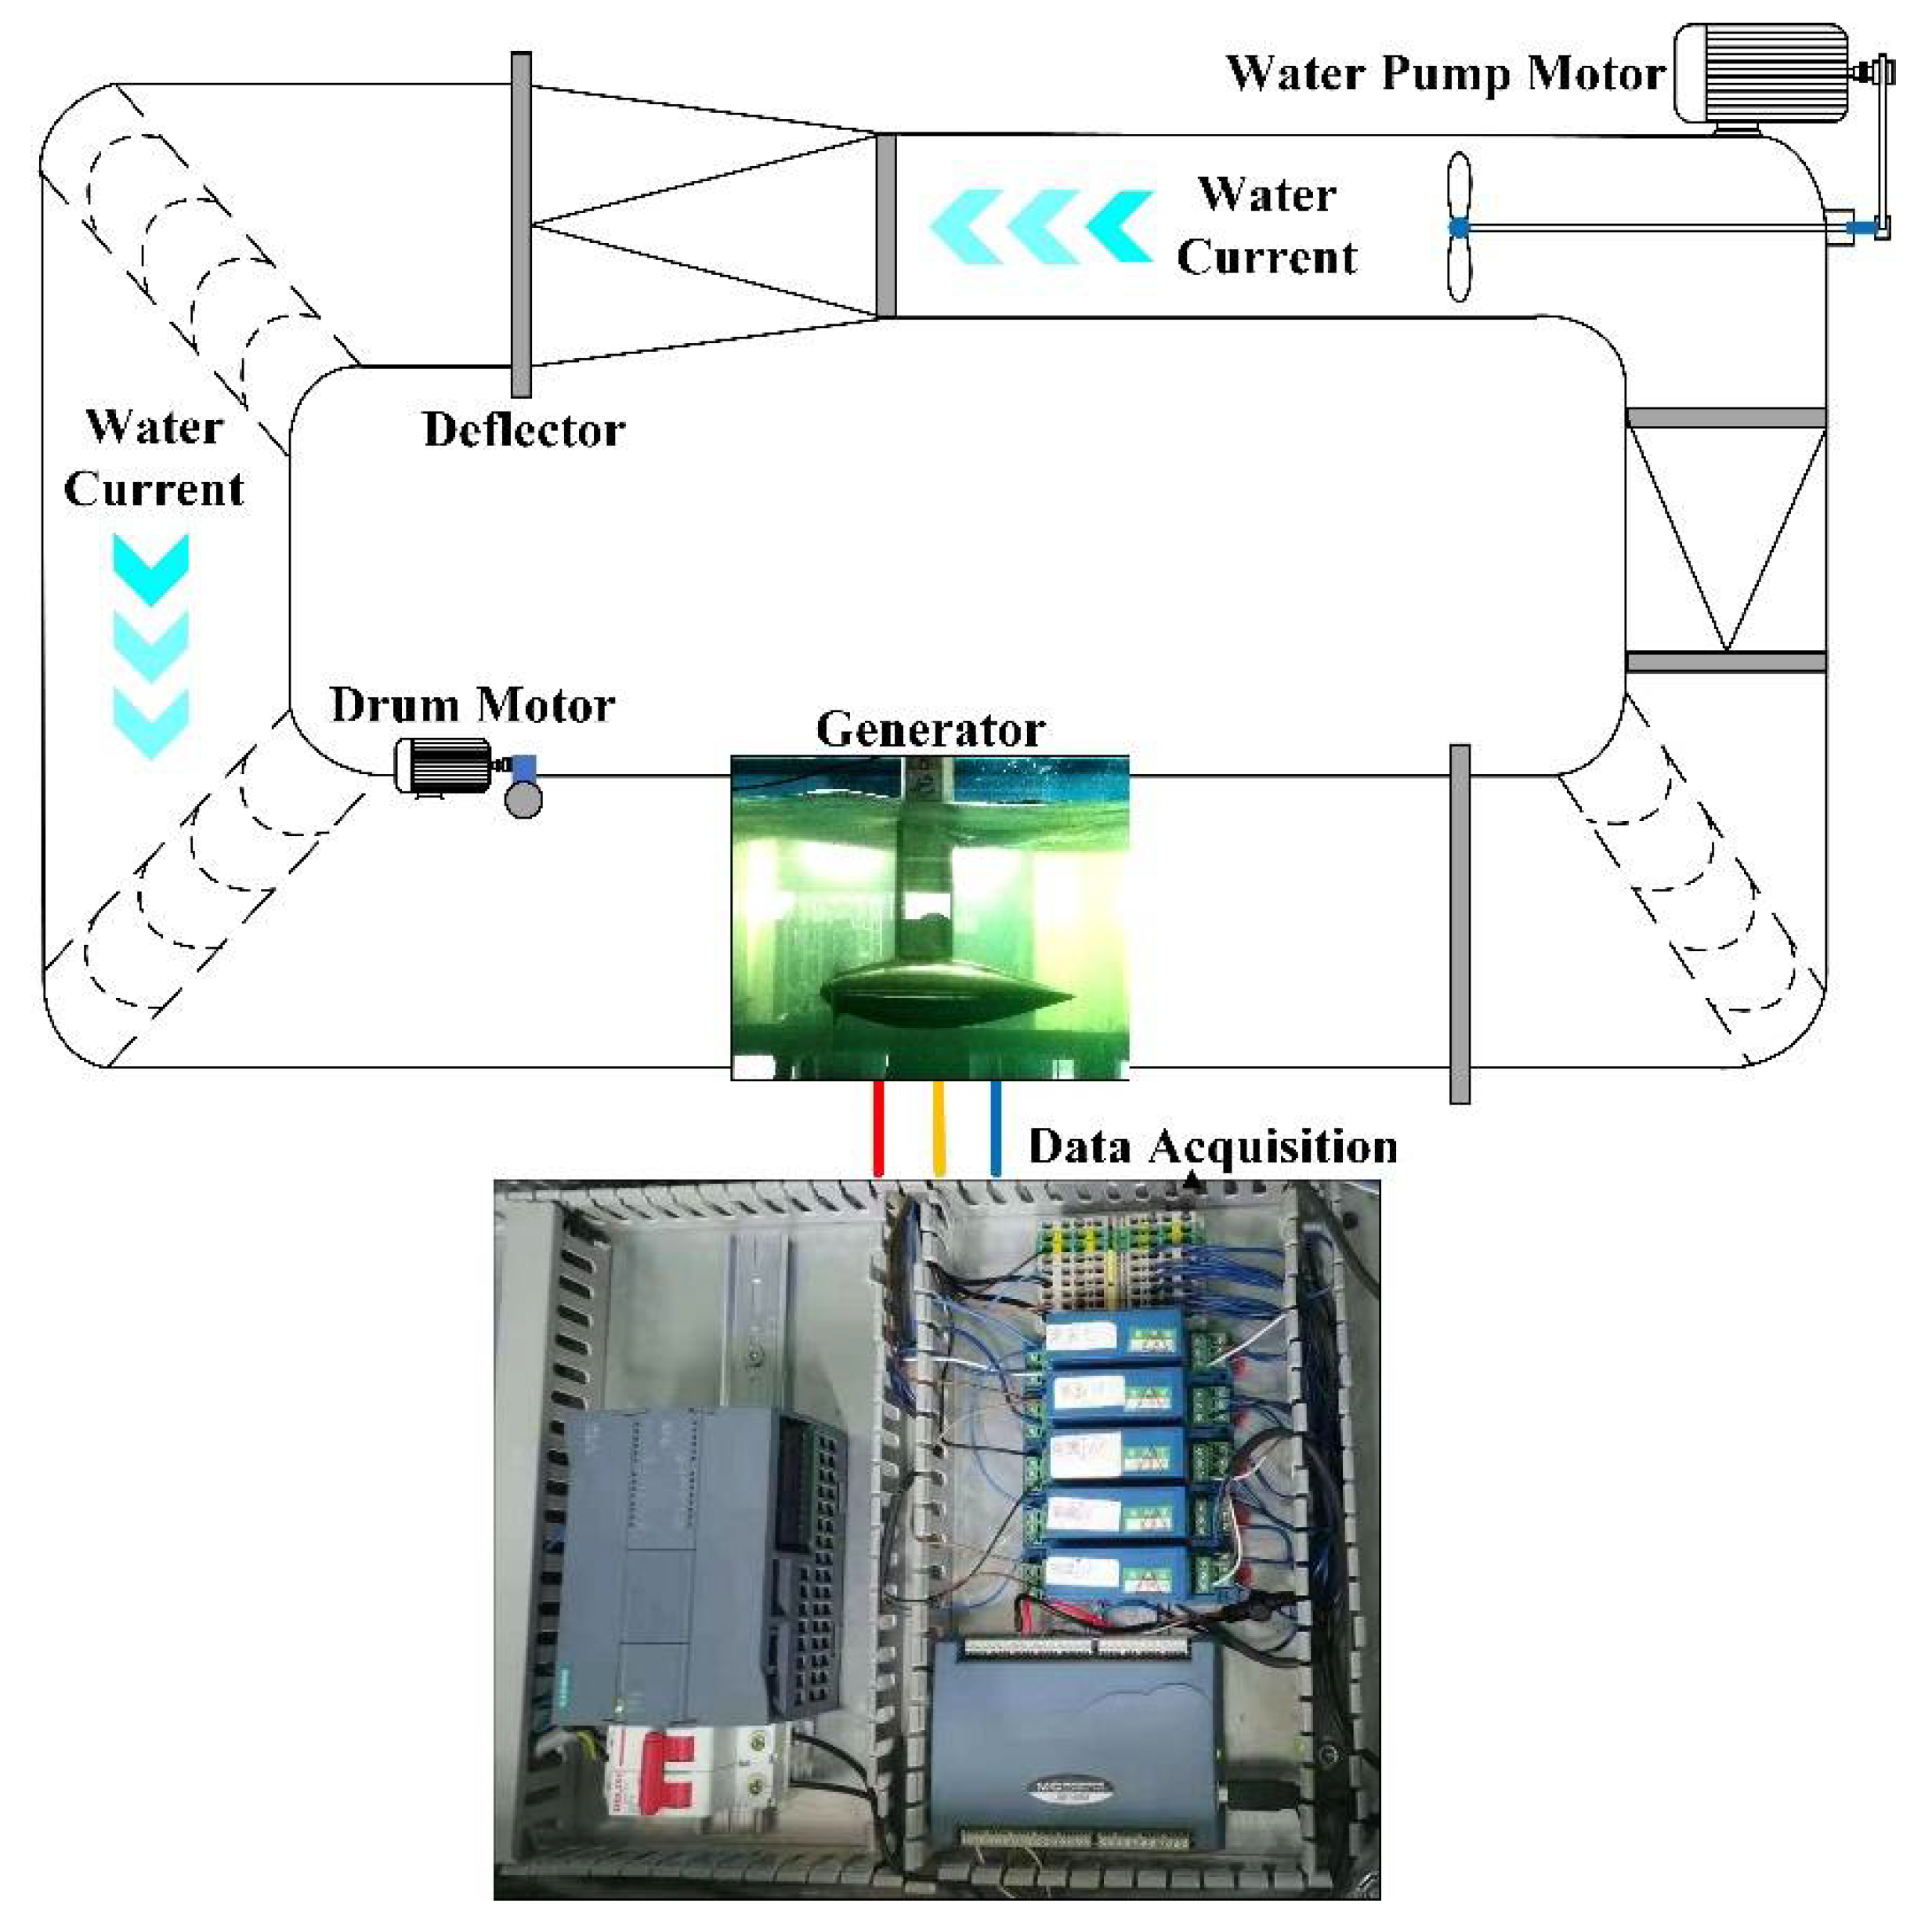
5.1. Experimental Setup and Practical Considerations

The experiment is carried out on a dedicated experimental platform for the simulation of marine current generation. The experimental platform consists of a marine current simulation system, a generator set, and a signal acquisition system, as illustrated in Figure 2. The generator set is placed in a 45 m3 volume circulating water tank, which is equipped with an axial flow pump with a motor speed control system. The generator set consists of a fixed-pitch turbine with Maca0018 blades and a 230 W three-phase star-connected PMSM. The specific parameters of the PMSM and the turbine are listed in Table 1. With the center of the turbine axle as a reference point, the generator set is placed in an operating area 1 m underwater and 0.6 m from the left and right observation windows for testing. As shown in Figure 2, the water flow is created by an axial flow pump and circulated in the water tank. The water flow continuously drives a generator set to generate current and an axial flow pump regulates the flow speed of the water to simulate marine currents. The current generated by the PMSM is consumed by the load circuit. Then, the three-phase current signal is collected by the MIK-DJI current sensor and transmitted to the upper computer through the acquisition card for real-time analysis.
The HRC is simulated with the additional resistances connected to the stator phase windings. In this paper, multiple fault cases are designed in the experimental platform. The fault conditions for these cases are shown in Table 2. The water flow velocity is designed to vary between 0.85 and 1.15 m/s by adjusting the axial flow pump frequency, which means that the generator set operates in the energy density variation range of about 0.45 KW/m3.

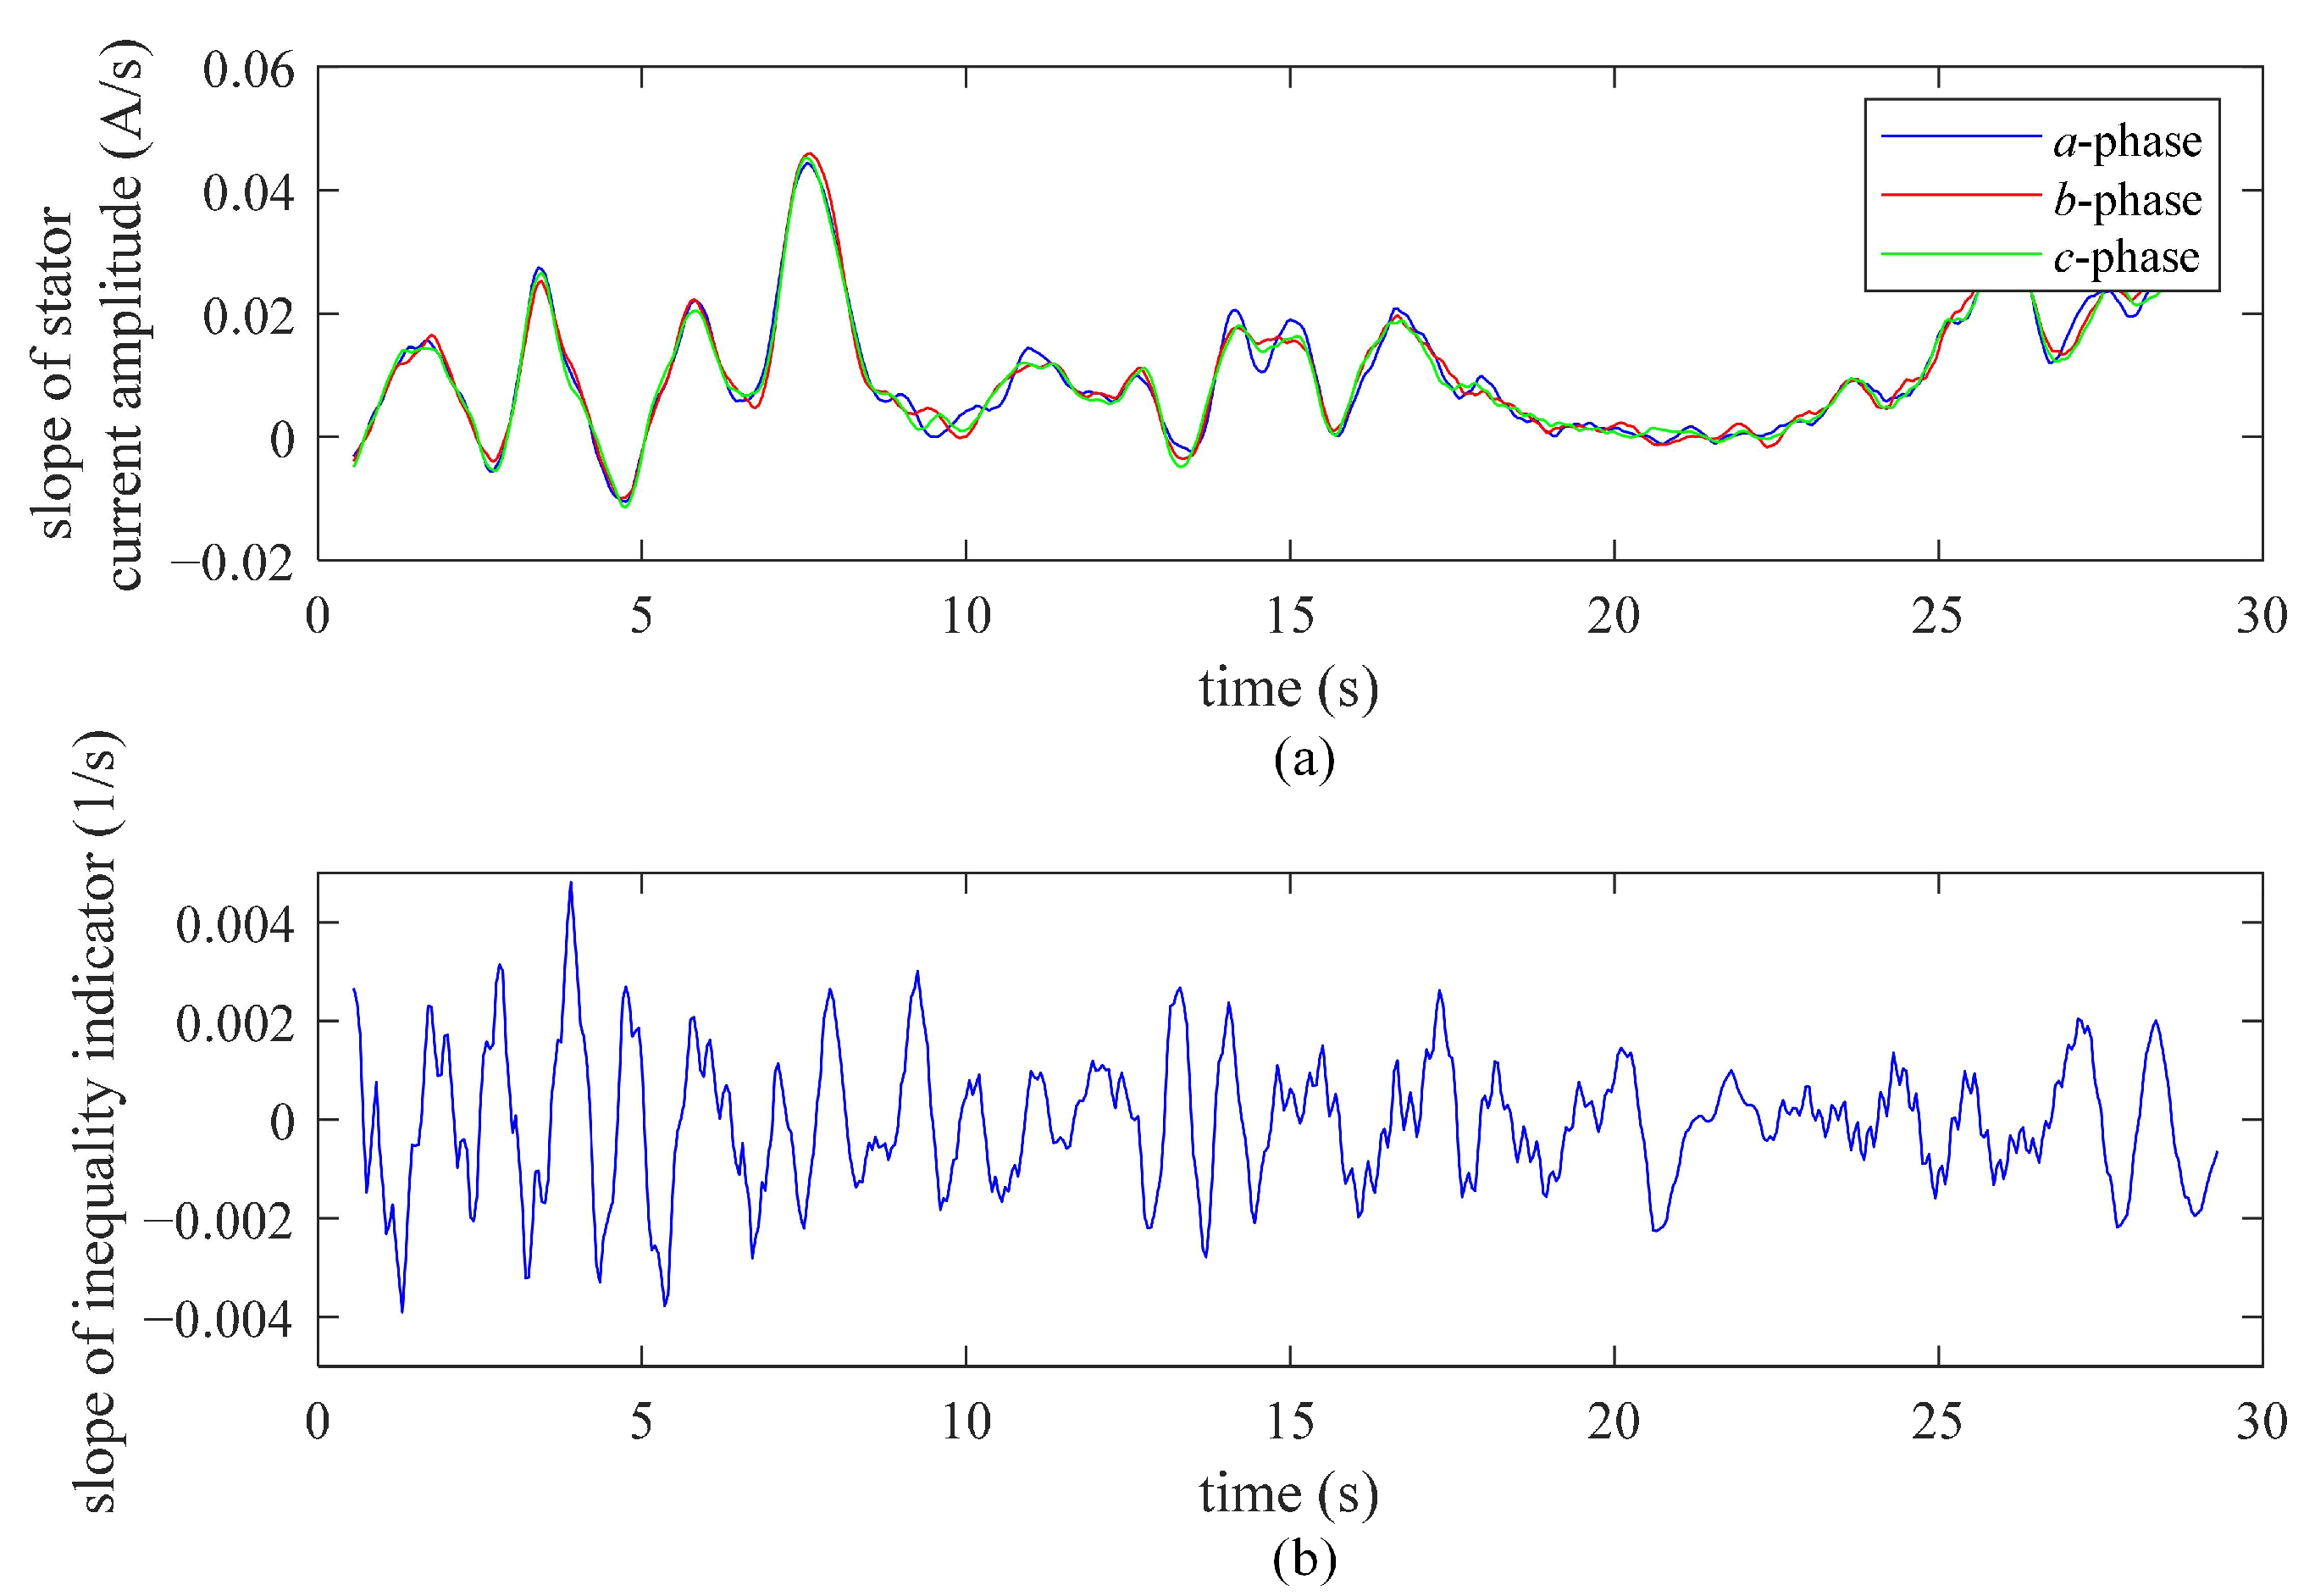
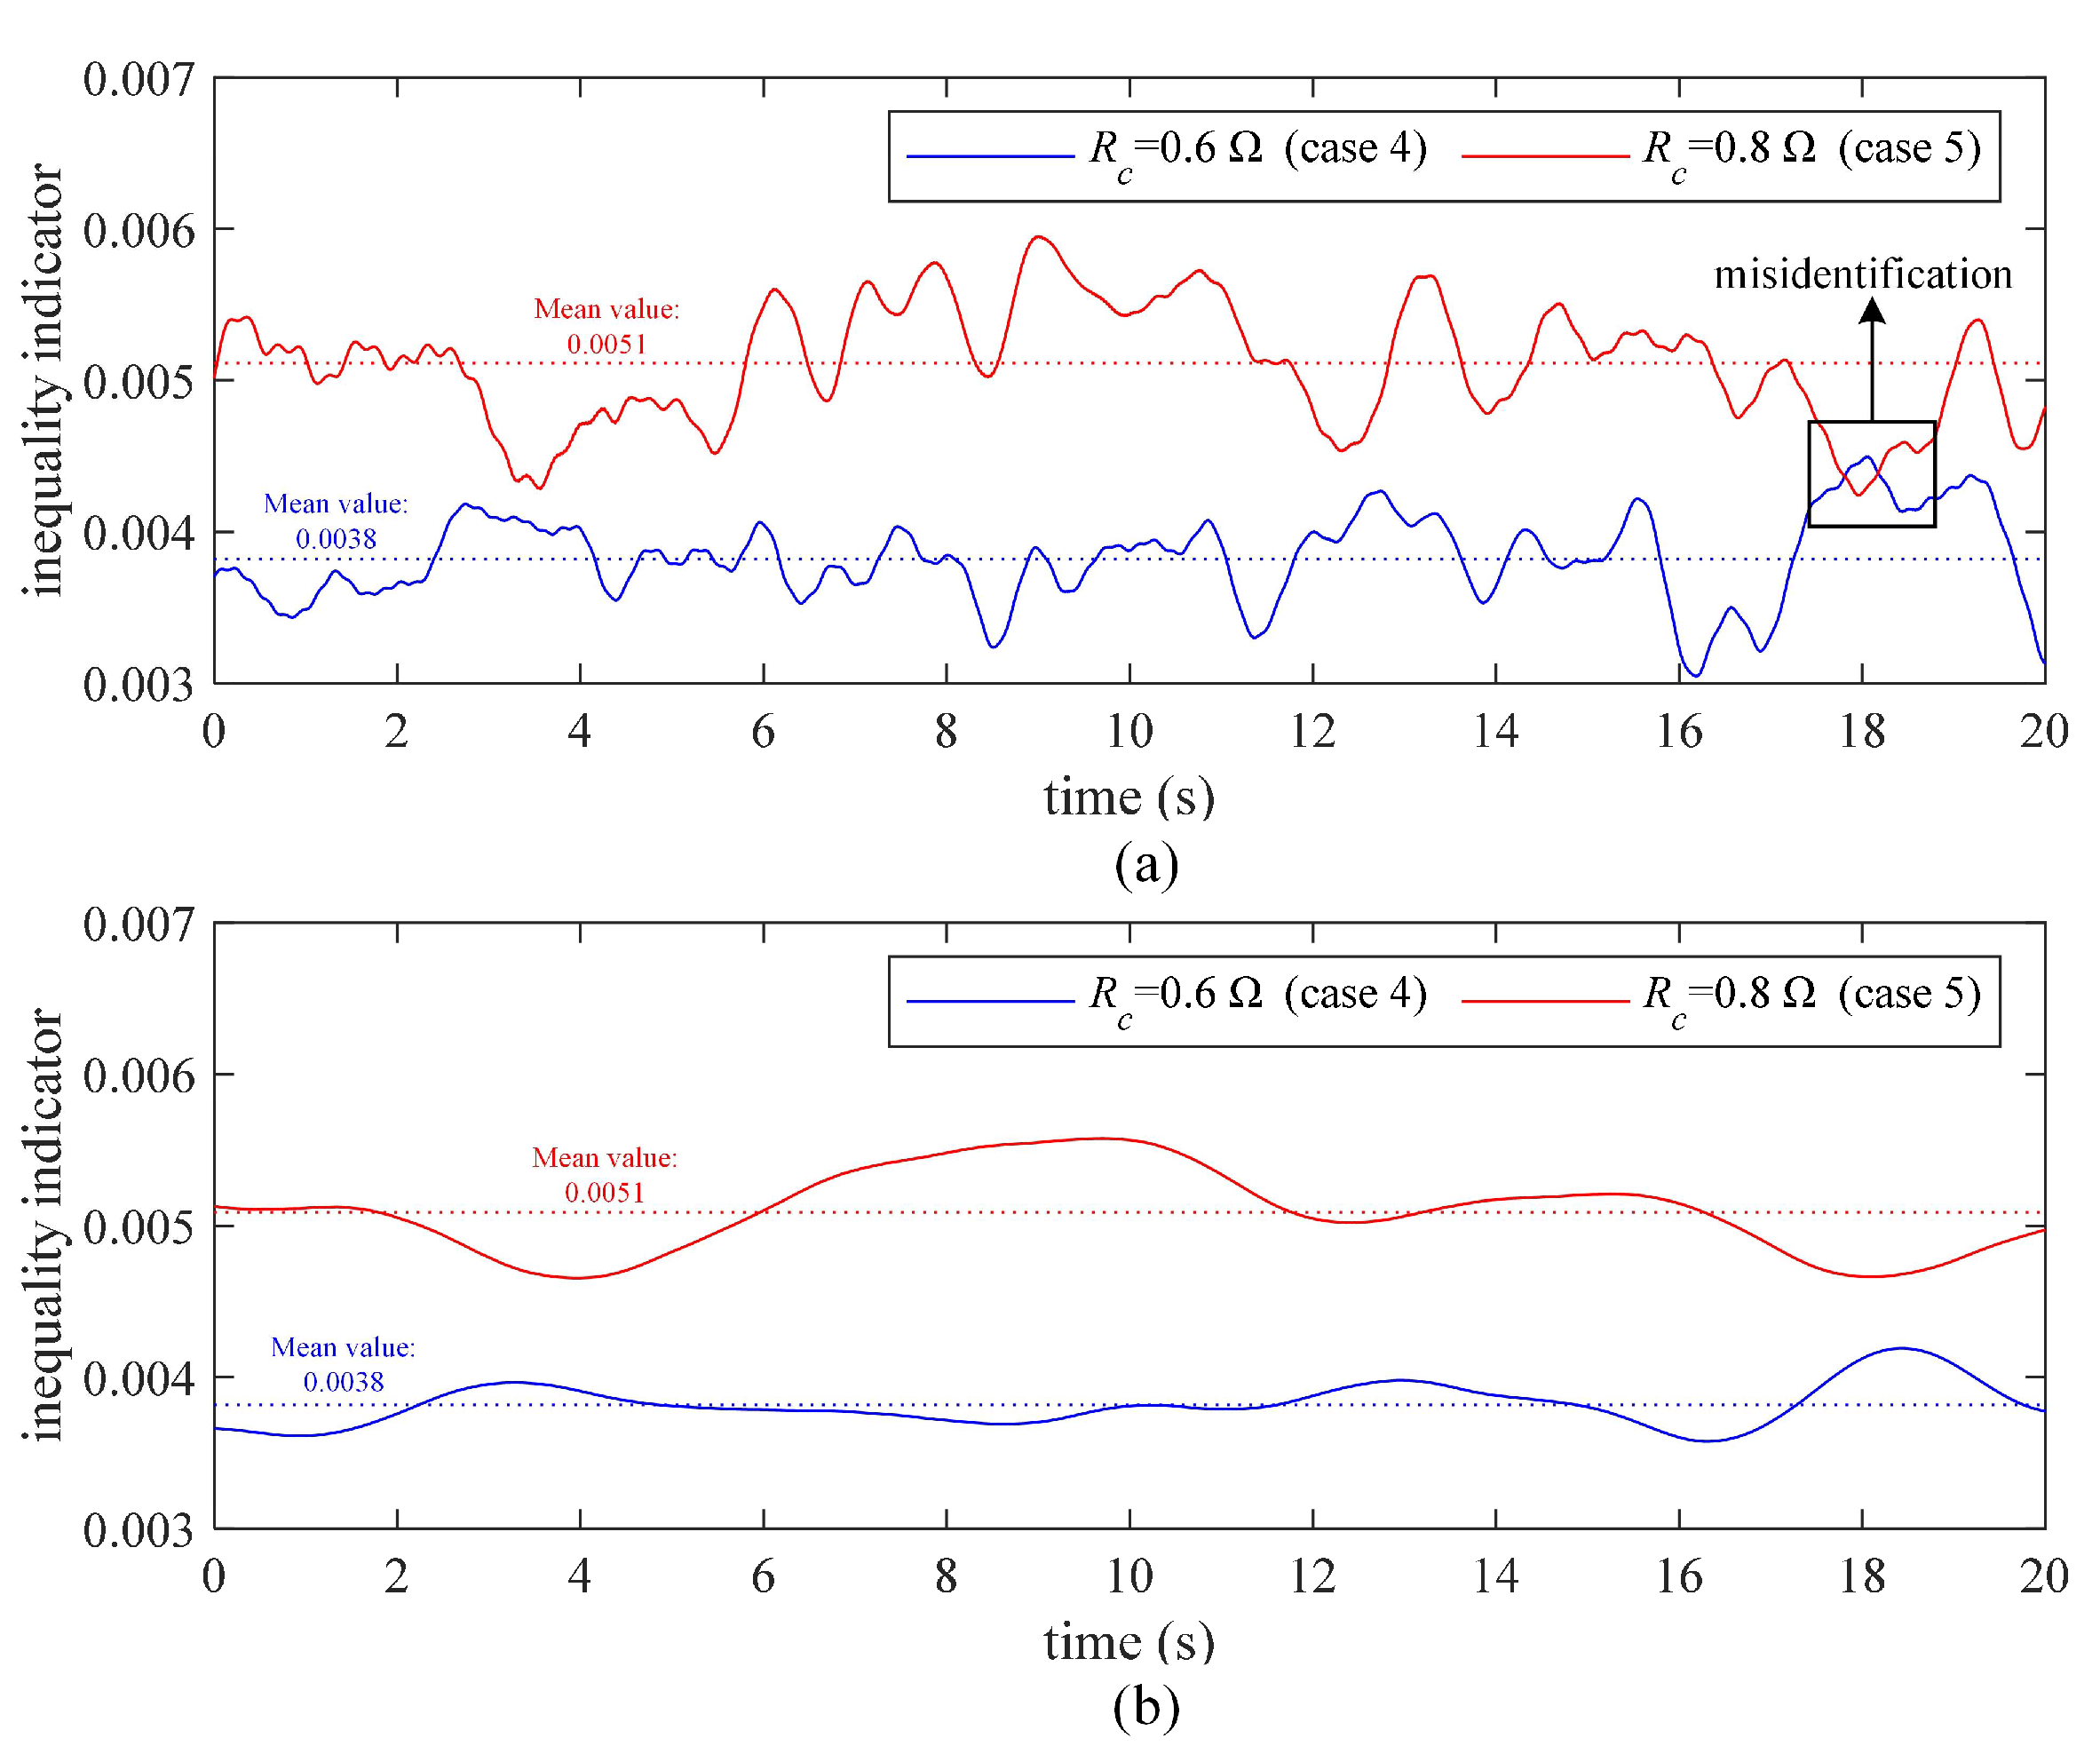
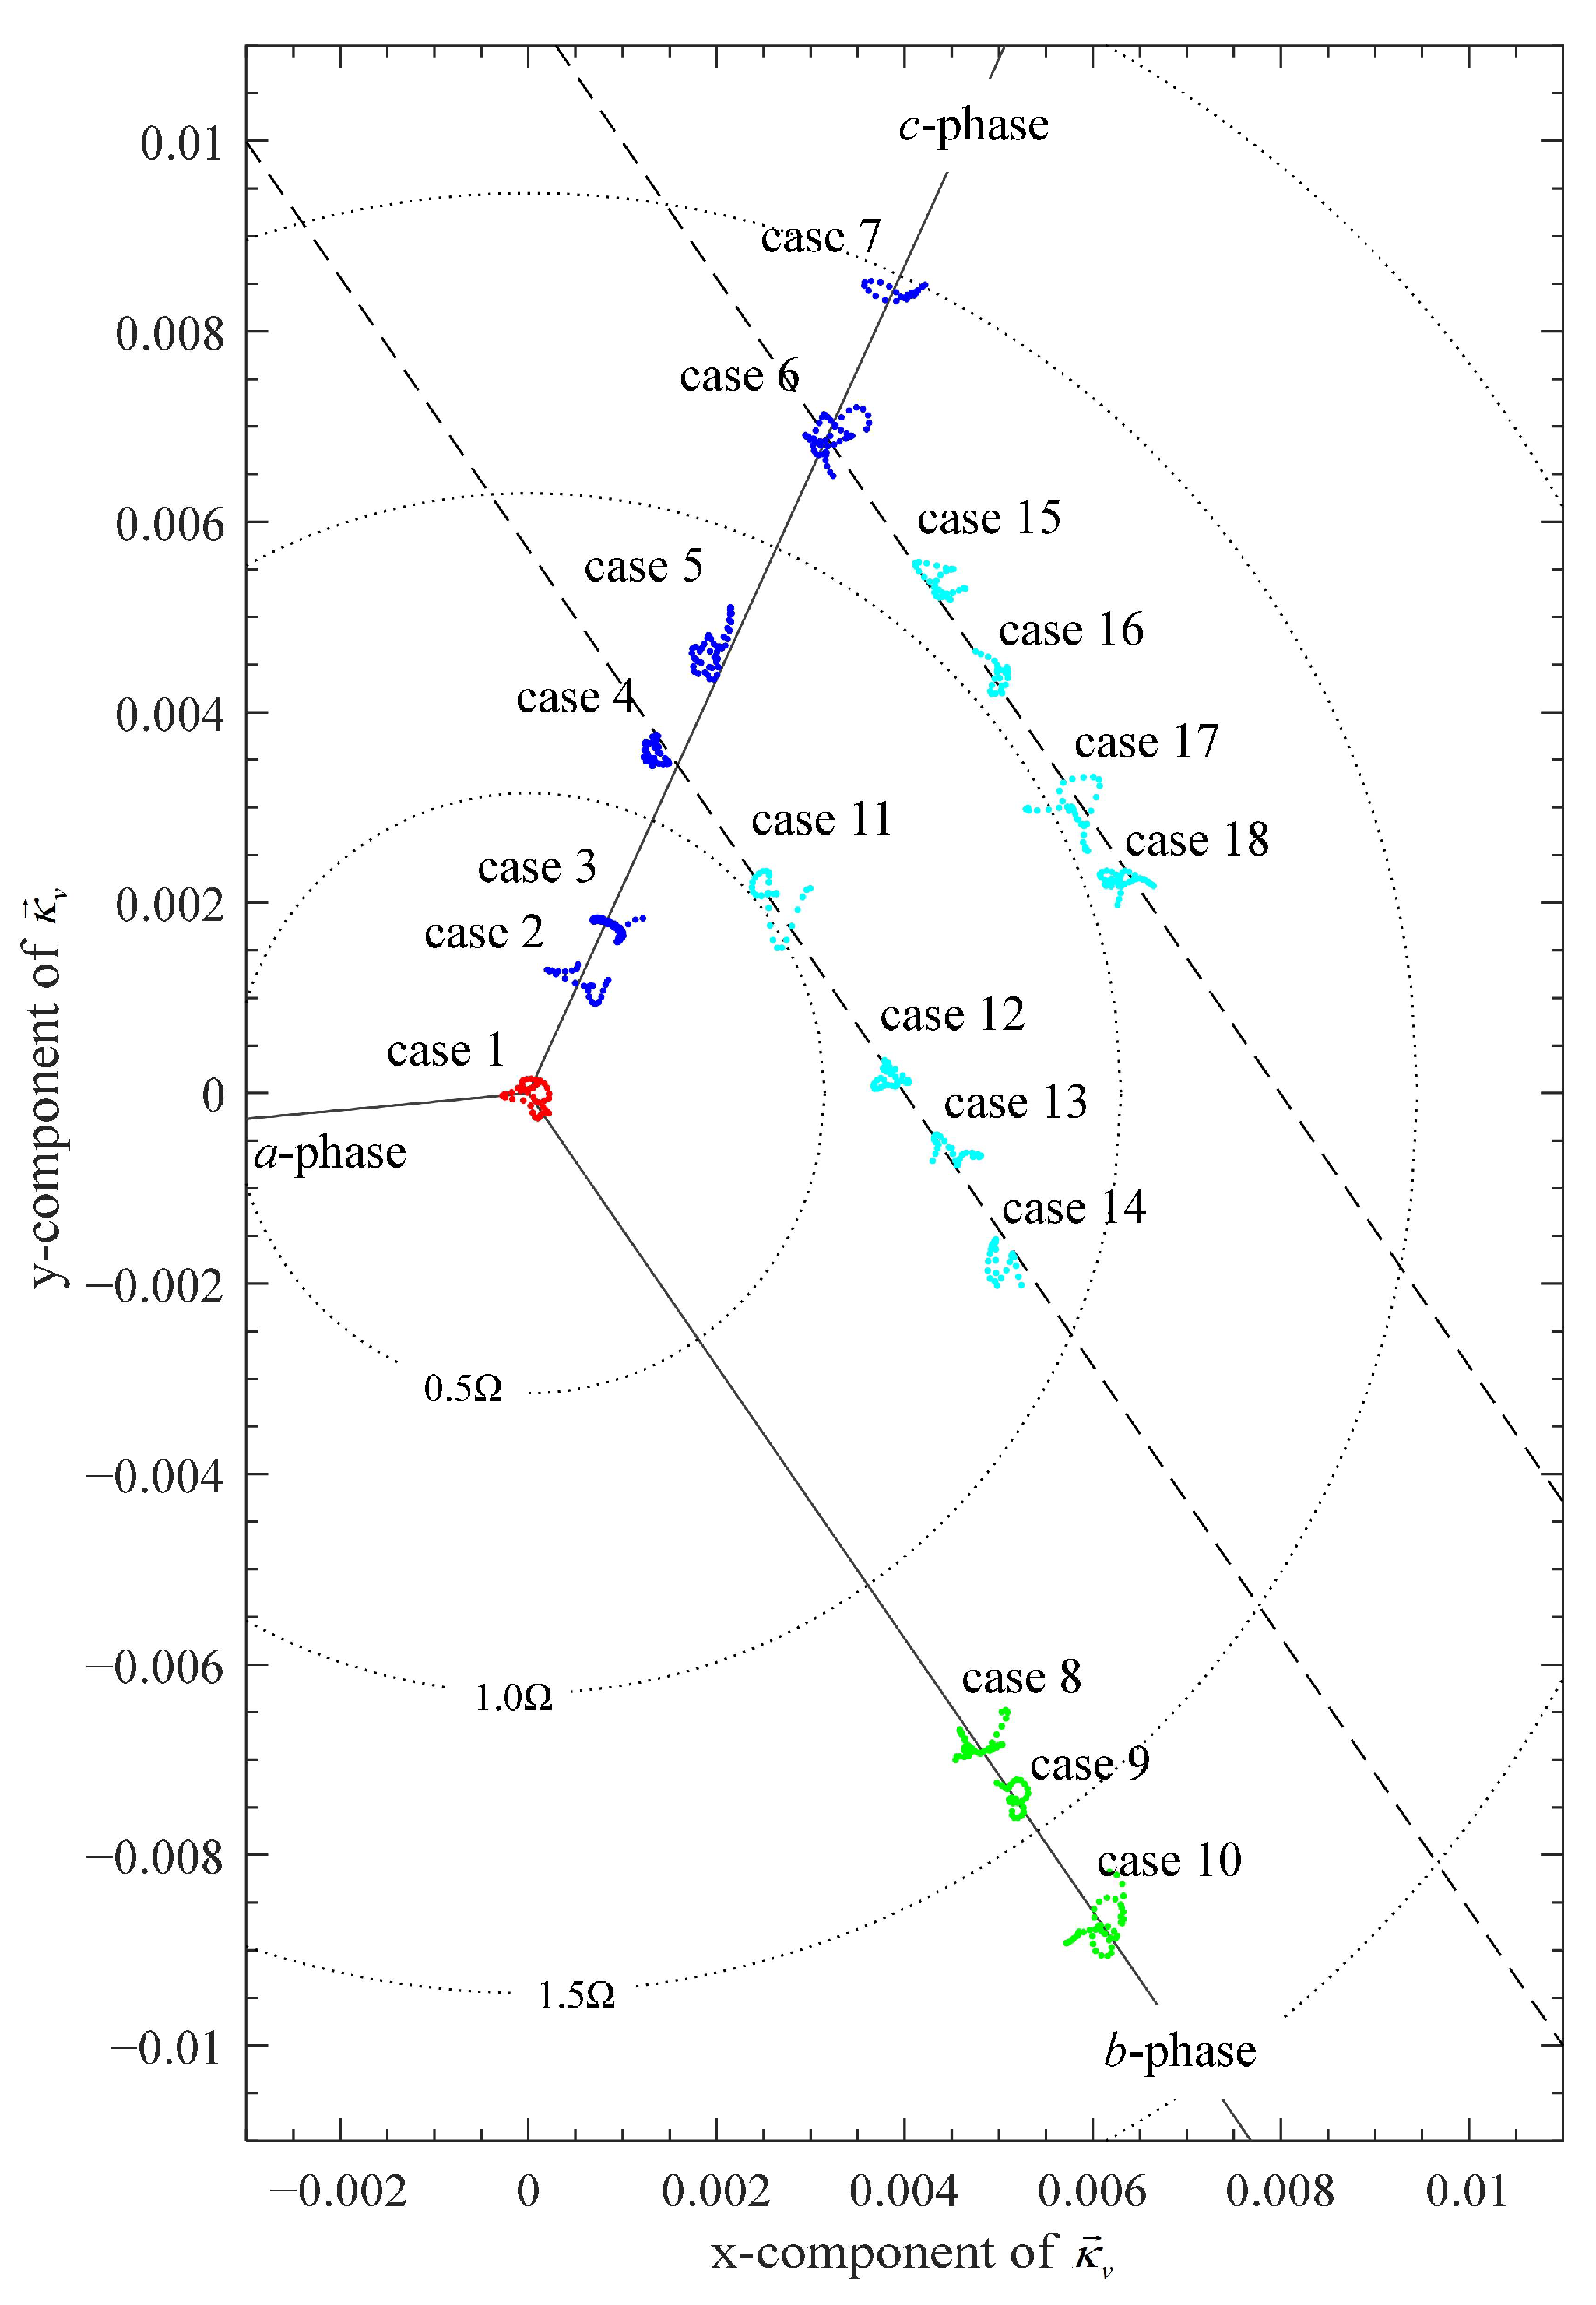
5.2. Test for Robustness of Inequality Indicator

Figure 3 shows the slope of the stator current amplitude and the κ under case 6 in Table 2. The water current speed under case 6 is set to increase monotonically to visually illustrate the robustness of the κ . In Figure 3a, the slopes of stator current amplitudes are larger than zero for almost the whole time. In Figure 3b, the slope of κ fluctuates around the zero, and its Skewness factor is 4.51 × 10⁻⁸. Therefore, κ is essentially robust at a constant value under the variable operating conditions of the PMSM in the experiment.

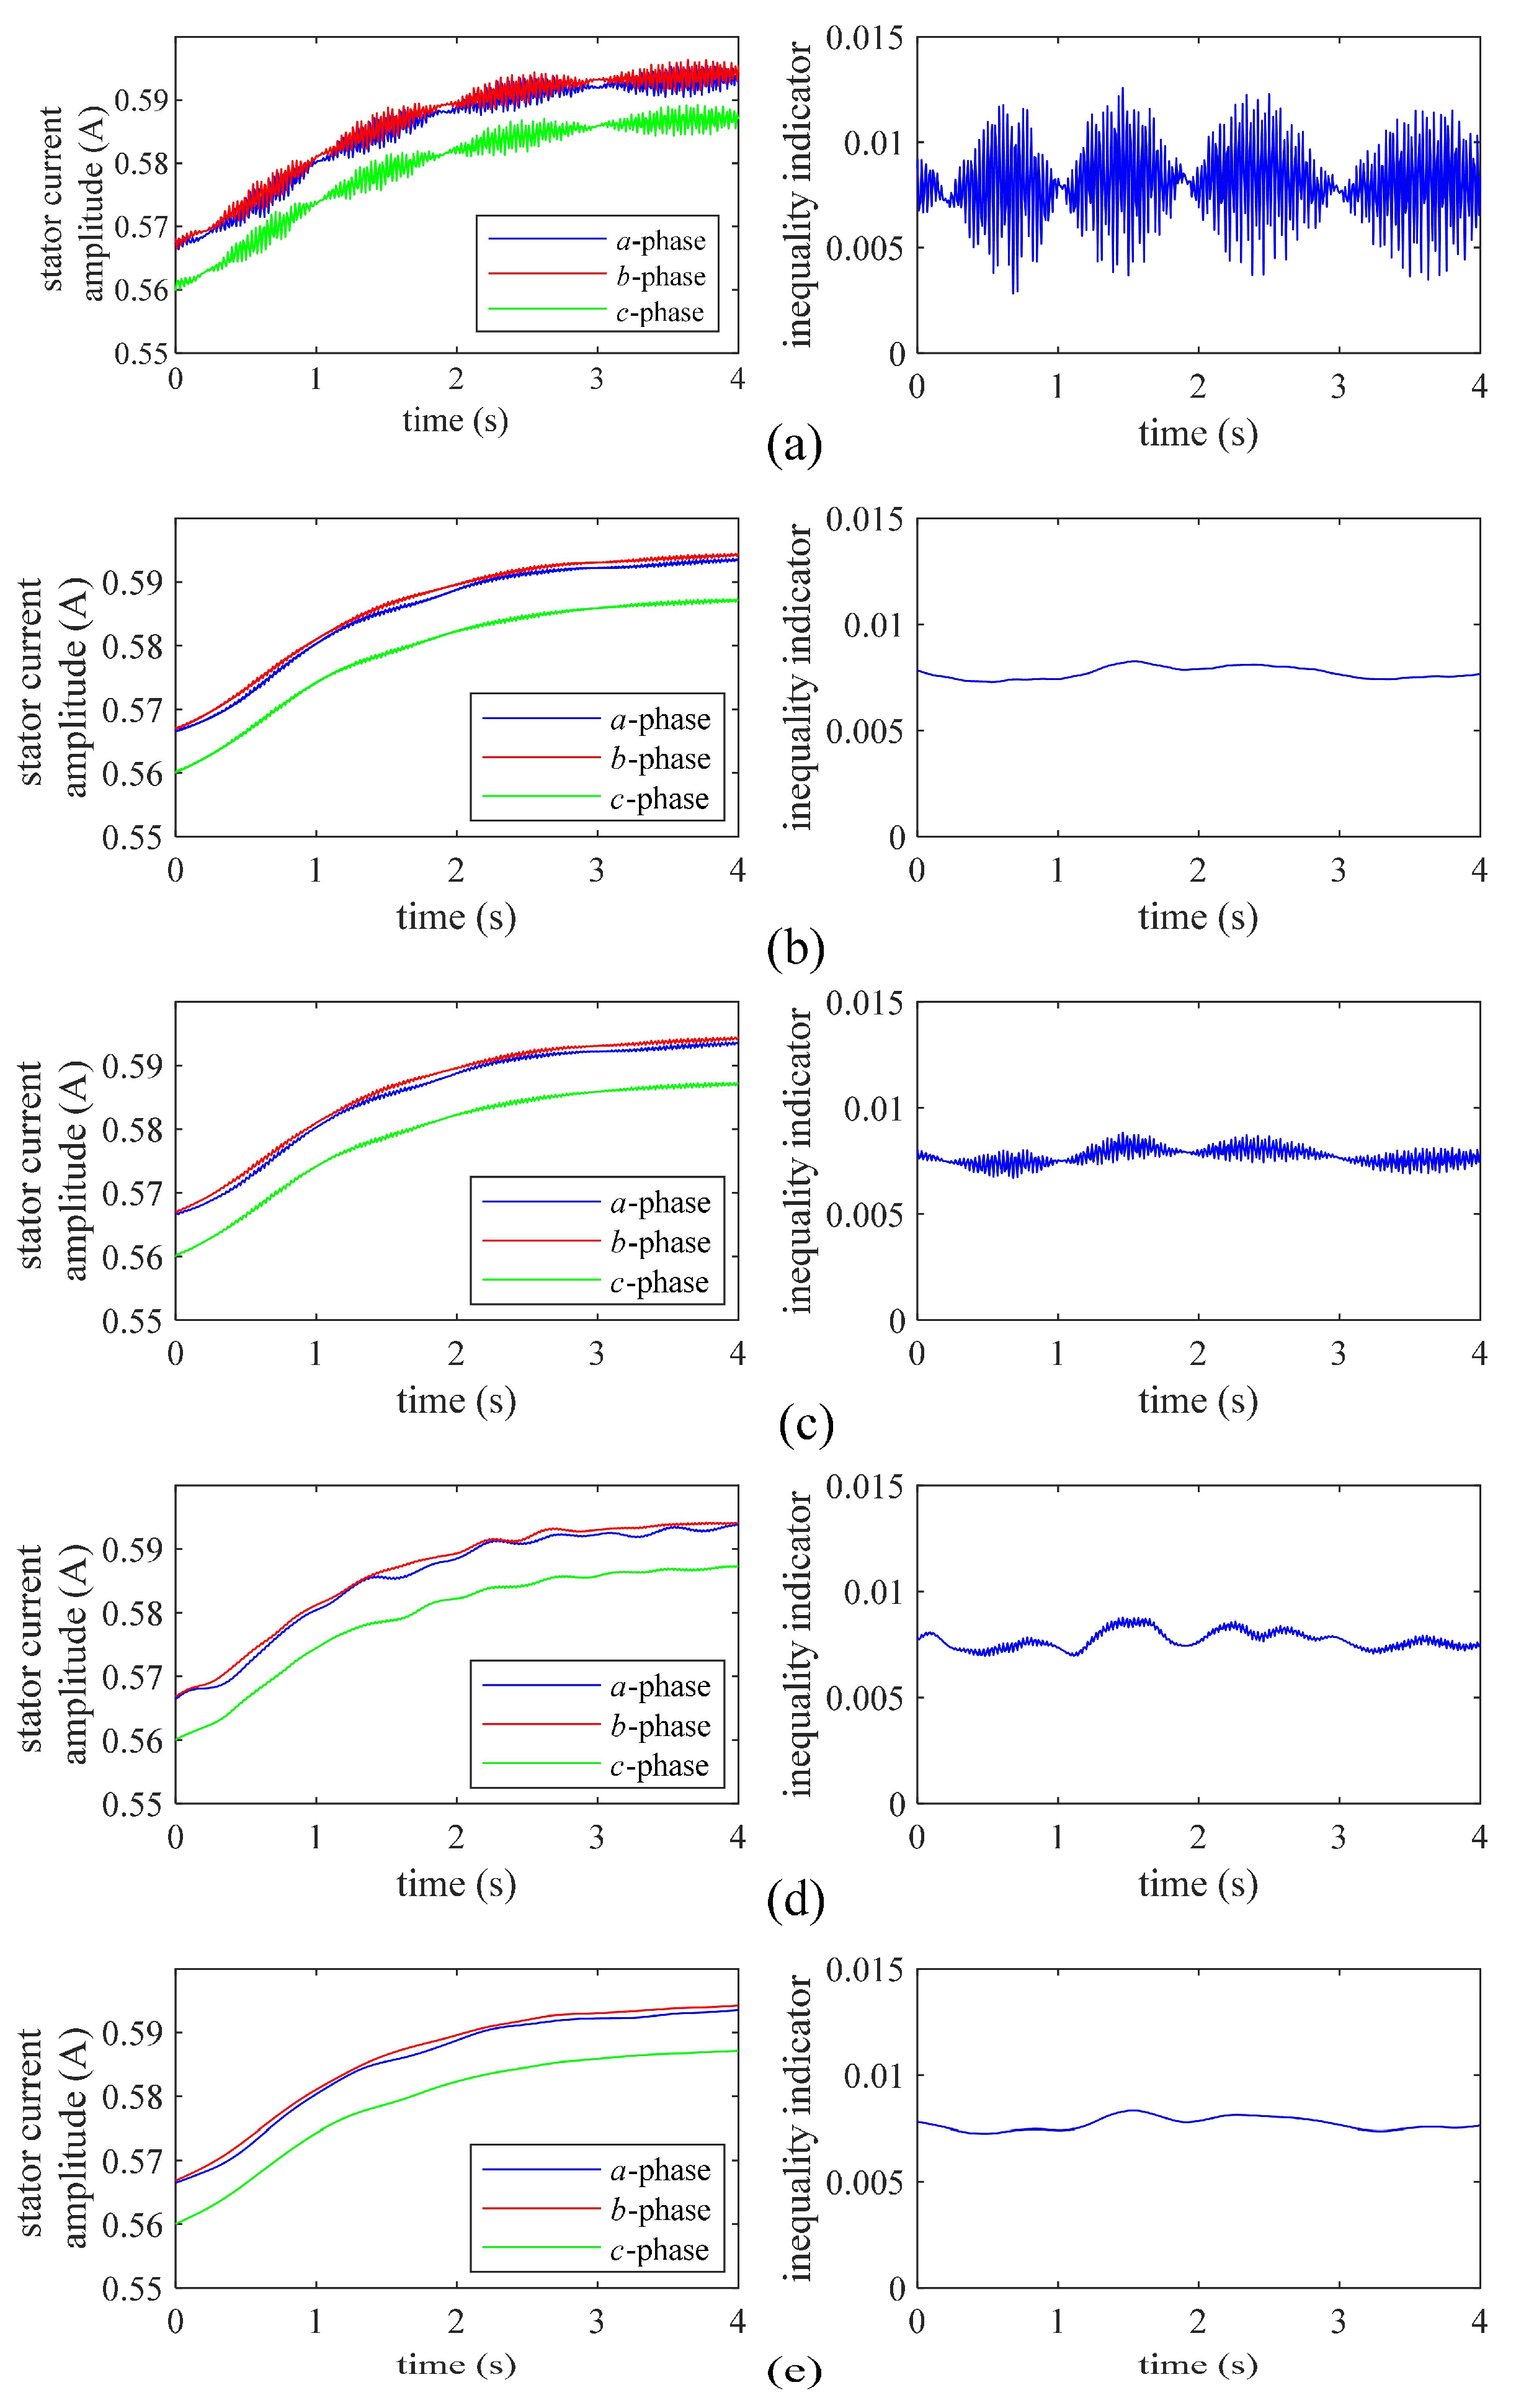
5.3. Test for Improving Diagnostic Accuracy

Although the κ is robust for the variable operating conditions of the PMSM in the experiment, there are still some fluctuations in the κ that can affect the diagnostic accuracy. In this section, the effect of the MS-based filtering method on κ is analyzed for better HRC diagnosis results.
Figure 4 shows the stator current amplitude and κ calculated with different window functions under case 6 in Table 2. The stator current amplitude in the fault phase is lower than in the non-fault phase. The oscillations appear in κ with a similar period as the stator current amplitude in Figure 4a, and the window functions effectively avoid these oscillations in Figure 4b–e. Some statistical indicators of κ in Figure 4 are shown in Table 3. As shown in Table 3, both the dispersion coefficient and the margin factor of κ with the Hanning window are smaller than the others, which means that the oscillation can be more easily avoided by the Hanning window.
Figure 5 shows the values of κ with different w f , which sets the Hanning window as the weight function in filtering. As shown in Figure 5, the waveform of κ with w f set to 4000 is smoother than that with w f set to 1000. In Figure 5a, two cases (case 4 and case 5 in Table 2) may be misidentified within 18–19 s due to excessive fluctuations. Obviously, the excessive fluctuations in κ is a factor affecting diagnostic accuracy. In Figure 5a, the fluctuations in κ is well reduced. Thus, setting a larger w f can effectively avoid misidentification and improve diagnostic accuracy. In addition, the mean value of κ does not change under different w f settings, which means that the MS-based filtering method only reduces the fluctuation of κ without affecting the function of κ .

5.4. Experimental Result of Diagnosis

Figure 6 shows the proportional relationship between the mean value of κ and R s under cases 1–7 in Table 2. In Figure 6, κ is approximately linear with R s when additional resistance is less than 1.7Ω. This experimental result shows that κ can be linearly converted to additional resistance when the fault severity is not large.
Figure 7 shows the classification results for cases 1–18 in Table 2, which set w f to 6000 and the Hanning window as the weight function in filtering for better diagnosis results. The samples of all cases are plotted in a plane based on κ v in (21). The distance between the sample and the origin corresponds to κ , and the angle between the sample and the x-axis corresponds to the a-phase angle difference, Δ θ a . In the plane, the fault conditions are clearly visible for each sample. The samples under different cases can be distinguished with 100% accuracy in Figure 7. Moreover, the dotted circles represent the relationship between κ and R s , as shown in Figure 6.
In Figure 7, the PMSM under case 1 can be considered under the balanced condition. If a PMSM is under the balanced condition, κ will be close to zero, and Δ θ a will fluctuate between 0 and 2 π. Therefore, the detection of HRC can be achieved by κ . It should be noted that the health condition of the PMSM does not strictly correspond to the balanced condition due to the possibility of inherent imbalance that can be tolerated in the PMSM. An appropriate threshold should be set to divide the health condition and the fault condition.
In Figure 7, samples of cases 2–10 are those in which HRC occurs in only one phase. These samples are distributed around certain specific lines so that their directions are Δ θ 0 + 2 π / 3 or Δ θ 0 + 4 π / 3 , which corresponded to the c- and b-phase. The samples of cases 11–18 are those in which HRC occurs in both the c- and b-phase. As shown in the distribution of the samples of cases under multi-phase HRC, if the fault severity in the b-phase changes, the sample points will move on a trajectory whose direction is Δ θ 0 + 2 π / 3 , which is plotted with dotted straight lines. These phenomena are consistent with the regularity of κ under different HRC conditions described in (21) and (23). According to the regularity shown in Figure 7, κ can be used to diagnose HRC that exists in multiple phases.

5.5. The Performance of Inequality Indicator with Silght Current Imbalance

As shown in Figure 7, κ in all samples is less than 0.01. By combining (11) and (12), I p and I n have the following relationship as:
I n I p = S s c a l a r + 2 | S v e c t o r | S s c a l a r 2 | S v e c t o r | S s c a l a r + 2 | S v e c t o r | + S s c a l a r 2 | S v e c t o r | = 1 2 S s c a l a r | S v e c t o r | 1 2 S s c a l a r 2 | S v e c t o r | 2 4 = 1 1 4 κ 2 2 κ
Then, it can be calculated that I n < 0.01 I p by (34). The difference between the stator current amplitudes due to HRC is much smaller than the stator current amplitude in the experiment. Table 4 shows the range of κ in Figure 7. As shown in Table 4, the maximum range is 8.3 × 10⁻⁴, which means that the sample points of different cases with a distance larger than 8.3 × 10⁻⁴ can be well distinguished in the experiment. The variation of 8.3 × 10⁻⁴ in κ corresponds to a slight variation in I p and I n . However, as shown in Figure 7, the slight current imbalance can be effectively identified by the κ .

6. Conclusions

In a marine environment, the effect of variable marine currents is a factor that should be taken into account in the diagnosis of MCTs. To diagnose HRC in the MCTs, a diagnosis method consisting of two stages is proposed in this paper: a robust indicator and additional filtering. In this paper, the inequality indicator is proposed for quantifying the current imbalance to diagnose HRC. The inequality indicator is robust to the variable operating conditions of the PMSM and can effectively identify slight current imbalances. Since it is dimensionless and not limited by the number of its elements, the inequality indicator may be used to analyze other faults that can lead to a current imbalance. Moreover, an MS-based filtering method is proposed to further avoid the effect of variable marine currents. The MS-based filtering method does not change the mean value of the inequality indicators, but it can reduce the fluctuations in the signal of the inequality indicator. By combining the MS-based filtering method, the inequality indicator can effectively diagnose early HRC in the MCT.
One of the difficulties in diagnosing faults in the MCTs is that the effects caused by marine currents must be taken into account when extracting fault features. Although the proposed diagnosis method can effectively identify the severity of HRC in MCTs under the short-time fluctuations in marine currents, there are still other features of marine currents that should be considered in future research. For example, the parameters in the diagnosis method can be adjusted more carefully if variations in marine currents are taken into account on the larger time scales.

Author Contributions

Conceptualization, D.J., T.W., Y.A. and Y.T.; methodology, D.J. and T.W.; software, D.J. and Y.T.; validation, D.J., T.W., Y.A. and Y.T.; formal analysis, D.J., T.W. and Y.A.; investigation, D.J., T.W. and Y.A.; resources, D.J., T.W. and Y.T.; data curation, D.J., T.W. and Y.T.; writing—original draft preparation, D.J., T.W., Y.A. and Y.T.; writing—review and editing, D.J., T.W., Y.A. and Y.T.; visualization, D.J. and T.W.; supervision, T.W. and Y.A.; project administration, T.W.; funding acquisition, T.W. All authors have read and agreed to the published version of the manuscript.

Funding

This research received no external funding.

Institutional Review Board Statement

Not applicable.

Informed Consent Statement

Not applicable.

Data Availability Statement

Not applicable.

Conflicts of Interest

The authors declare no conflict of interest.

References

  1. Lo Brutto, O.A.; Barakat, M.R.; Guillou, S.S.; Thiebot, J.; Gualous, H. Influence of the wake effect on electrical dynamics of commercial tidal farms: Application to the alderney race (France). IEEE Trans. Sustain. Energy 2018, 9, 321–332. [Google Scholar] [CrossRef]
  2. Pham, H.; Bourgeot, J.; Benbouzid, M.E.H. Comparative investigations of sensor fault-tolerant control strategies performance for marine current turbine applications. IEEE J. Ocean. Eng. 2018, 43, 1024–1036. [Google Scholar] [CrossRef]
  3. Belkhier, Y.; Achour, A. Fuzzy passivity-based linear feedback current controller approach for PMSG-based tidal turbine. Ocean Eng. 2020, 218, 108156. [Google Scholar] [CrossRef]
  4. Zhou, Z.; Benbouzid, M.; Frédéric Charpentier, J.; Scuiller, F.; Tang, T. A review of energy storage technologies for marine current energy systems. Renew. Sustain. Energy Rev. 2013, 18, 390–400. [Google Scholar] [CrossRef] [Green Version]
  5. Li, M.; Wang, T.; Zhou, F.; Shi, M. An adaptive single neural control for variable step-size P&O MPPT of marine current turbine system. China Ocean Eng. 2021, 35, 750–758. [Google Scholar] [CrossRef]
  6. Ben Elghali, S.E.; Benbouzid, M.; Ahmed-Ali, T.; Charpentier, J.F. High-order sliding mode control of a marine current turbine driven doubly-fed induction generator. IEEE J. Ocean. Eng. 2010, 35, 402–411. [Google Scholar] [CrossRef] [Green Version]
  7. Zhou, Z.B.; Scuiller, F.; Charpentier, J.F.; Benbouzid, M.E.; Tang, T.H. Power control of a nonpitchable PMSG-based marine current turbine at overrated current speed with flux-weakening strategy. IEEE J. Ocean. Eng. 2015, 40, 536–545. [Google Scholar] [CrossRef] [Green Version]
  8. Xie, T.; Wang, T.Z.; He, Q.Q.; Diallo, D.; Claramunt, C. A review of current issues of marine current turbine blade fault detection. Ocean Eng. 2020, 218, 108194. [Google Scholar] [CrossRef]
  9. Hsu, C.C.; Yang, S.C. Permanent-magnet machine flux and torque response under the influence of turn fault. IEEE Trans. Ind. Electron. 2020, 67, 169–179. [Google Scholar] [CrossRef]
  10. Hall, S.; Marquez-Fernandez, F.J.; Alakula, M. Dynamic magnetic model identification of permanent magnet synchronous machines. IEEE Trans. Energy Convers. 2017, 32, 1367–1375. [Google Scholar] [CrossRef]
  11. Obeid, N.H.; Battiston, A.; Boileau, T.; Nahid-Mobarakeh, B. Early intermittent interturn fault detection and localization for a permanent magnet synchronous motor of electrical vehicles using wavelet transform. IEEE Trans. Transp. Electrif. 2017, 3, 694–702. [Google Scholar] [CrossRef]
  12. Eker, M.; Akar, M. Eccentricity fault diagnosis in a permanent magnet synchronous motor under nonstationary speed conditions. Turk. J. Electr. Eng. Comput. Sci. 2017, 25, 1881–1893. [Google Scholar] [CrossRef] [Green Version]
  13. Karami, M.; Bin Mariun, N.; Ab-Kadir, M.; Misron, N.; Radzi, M. Motor current signature analysis-based non-invasive recognition of mixed eccentricity fault in line start permanent magnet synchronous motor. Electr. Power Compon. Syst. 2021, 49, 133–145. [Google Scholar] [CrossRef]
  14. Ma, C.G.; Gao, Y.J.; Degano, M.; Wang, Y.Y.; Fang, J.G.; Gerada, C.; Zhou, S.S.; Mu, Y.Y. Eccentric position diagnosis of static eccentricity fault of external rotor permanent magnet synchronous motor as an in-wheel motor. IET Electr. Power Appl. 2020, 14, 2263–2272. [Google Scholar] [CrossRef]
  15. Zhao, K.H.; Leng, A.J.; Zhou, R.R.; Dai, W.K.; Wu, S.C.; Li, T. Demagnetization fault reconstruction for six-phase permanent magnet synchronous motor by improved super-twisting algorithm-based sliding-mode observer. Measurement 2021, 172, 10895. [Google Scholar] [CrossRef]
  16. Krichen, M.; Elbouchikhi, E.; Benhadj, N.; Chaieb, M.; Benbouzid, M.; Neji, R. Motor current signature analysis-based permanent magnet synchronous motor demagnetization characterization and detection. Machines 2020, 8, 35. [Google Scholar] [CrossRef]
  17. Li, W.L.; Feng, G.D.; Li, Z.; Tjong, J.; Kar, N.C. Multireference frame based open-phase fault modeling and control for asymmetrical six-phase interior permanent magnet motors. IEEE Trans. Power Electron. 2021, 36, 11712–11725. [Google Scholar] [CrossRef]
  18. Song, Z.F.; Zhou, F.J.; Yu, Y.; Zhang, R.; Hu, S.Y. Open-phase fault-tolerant predictive control strategy for open-end-winding permanent magnet synchronous machines without postfault controller reconfiguration. IEEE Trans. Ind. Electron. 2021, 68, 3770–3781. [Google Scholar] [CrossRef]
  19. Mohammed, H.H.M.; Zhengyou, H.; Ling, F.; Yujia, D. A cumulative standard deviation sum based method for high resistance fault identification and classification in power transmission lines. Prot. Control Mod. Power Syst. 2018, 3, 30. [Google Scholar]
  20. Yun, J.; Cho, J.; Lee, S.B.; Yoo, J.Y. Online detection of high-resistance connections in the incoming electrical circuit for induction motors. IEEE Trans. Ind. Appl. 2009, 45, 694–702. [Google Scholar] [CrossRef]
  21. Hang, J.; Ren, X.X.; Tang, C.Y.; Tong, M.H.; Ding, S.C. Fault-tolerant control strategy for five-phase PMSM drive system with high-resistance connection. IEEE Trans. Transp. Electrif. 2021, 7, 1390–1400. [Google Scholar] [CrossRef]
  22. Gaurier, B.; Davies, P.; Deuff, A.; Germain, G. Flume tank characterization of marine current turbine blade behaviour under current and wave loading. Renew. Energy 2013, 59, 1–12. [Google Scholar] [CrossRef] [Green Version]
  23. de la Barrera, P.M.; Bossio, G.R.; Leidhold, R. Online voltage sensorless high-resistance connection diagnosis in induction motor drives. IEEE Trans. Ind. Electron. 2015, 62, 4374–4384. [Google Scholar] [CrossRef]
  24. Hang, J.; Zhang, J.Z.; Cheng, M.; Zhang, B.F.; Ding, S.C. High-resistance connection detection in permanent magnet synchronous machine using zero-sequence current component. IEEE Trans. Power Electron. 2016, 31, 4710–4719. [Google Scholar] [CrossRef]
  25. Yun, J.; Lee, K.; Lee, K.W.; Lee, S.B.; Yoo, J.Y. Detection and classification of stator turn faults and high-resistance electrical connections for induction machines. IEEE Trans. Ind. Appl. 2009, 45, 666–675. [Google Scholar] [CrossRef]
  26. Zarri, L.; Mengoni, M.; Gritli, Y.; Tani, A.; Filippetti, F.; Serra, G.; Casadei, D. Detection and localization of stator resistance dissymmetry based on multiple reference frame controllers in multiphase induction motor drives. IEEE Trans. Ind. Electron. 2013, 60, 3506–3518. [Google Scholar] [CrossRef]
  27. de la Barrera, P.M.; Bossio, G.R.; Solsona, J.A. High-resistance connection detection in induction motor drives using signal injection. IEEE Trans. Ind. Electron. 2014, 61, 3563–3573. [Google Scholar] [CrossRef]
  28. Mengoni, M.; Zarri, L.; Tani, A.; Gritli, Y.; Serra, G.; Filippetti, F.; Casadei, D. Online detection of high-resistance connections in multiphase induction machines. IEEE Trans. Power Electron. 2015, 30, 4505–4513. [Google Scholar] [CrossRef]
  29. Zhang, J.Z.; Hang, J.; Ding, S.C.; Cheng, M. Online diagnosis and localization of high-resistance connection in PMSM with improved fault indicator. IEEE Trans. Power Electron. 2017, 32, 3585–3594. [Google Scholar] [CrossRef]
  30. Hang, J.; Yan, D.D.; Xia, M.J.; Ding, S.C.; Wang, Q.J. Quantitative fault severity estimation for high-resistance connection in PMSM drive system. IEEE Access 2019, 7, 26855–26866. [Google Scholar] [CrossRef]
  31. Hang, J.; Wu, H.; Ding, S.C.; Hua, W.; Wang, Q.J. A DC-flux-injection method for fault diagnosis of high-resistance connection in direct-torque-controlled PMSM drive system. IEEE Trans. Power Electron. 2020, 35, 3029–3042. [Google Scholar] [CrossRef]
  32. Kommuri, S.K.; Park, Y.; Lee, S.B. High-resistance fault control in permanent magnet synchronous motors. IEEE-Asme Trans. Mechatron. 2020, 25, 271–281. [Google Scholar] [CrossRef]
  33. Hu, R.G.; Wang, J.B.; Mills, A.; Chong, E.; Sun, Z.G. Detection and classification of turn fault and high resistance connection fault in permanent magnet machines based on zero sequence voltage. IEEE Trans. Power Electron. 2020, 35, 1922–1933. [Google Scholar] [CrossRef]
  34. Hang, J.; Zhang, J.B.; Ding, S.C.; Huang, Y.R.; Wang, Q.J. A model-based strategy with robust parameter mismatch for online HRC diagnosis and location in PMSM drive system. IEEE Trans. Power Electron. 2020, 35, 10917–10929. [Google Scholar] [CrossRef]
  35. Abosh, A.H.; Zhu, Z.Q.; Ren, Y. Cascaded direct torque control of unbalanced PMSM with low torque and flux ripples. IEEE Trans. Power Electron. 2018, 33, 1740–1749. [Google Scholar] [CrossRef]
  36. Zhou, X.Y.; Wang, T.Z.; Diallo, D. An active disturbance rejection sensorless control strategy based on sliding mode observer for marine current turbine. ISA Trans. 2022, 124, 403–410. [Google Scholar] [CrossRef] [PubMed]
  37. Willems, J.L. Reflections on apparent power and power factor in nonsinusoidal and polyphase situations. IEEE Trans. Power Deliv. 2004, 19, 835–840. [Google Scholar] [CrossRef]
  38. Saleh, S.A.; Aljankawey, A.S.; Meng, R.; Meng, J.; Diduch, C.P.; Chang, L. Antiislanding protection based on signatures extracted from the instantaneous apparent power. IEEE Trans. Power Electron. 2014, 29, 5872–5891. [Google Scholar] [CrossRef]
  39. Milne, I.A.; Sharma, R.N.; Flay, R.; Bickerton, S. Characteristics of the turbulence in the flow at a tidal stream power site. Philos. Trans. R. Soc. A Math. Phys. Eng. Sci. 2013, 371, 20120196. [Google Scholar] [CrossRef]
  40. Sababheh, M.; Furuichi, S.; Heydarbeygi, Z.; Moradi, H.R. On the arithmetic-geometric mean inequality. J. Math Inequal. 2021, 15, 1255–1266. [Google Scholar] [CrossRef]
  41. Yuce, E.; Minaei, S.; Tokat, S. Root-mean-square measurement of distinct voltage signals. IEEE Trans. Instrum. Meas. 2007, 56, 2782–2787. [Google Scholar] [CrossRef]
Figure 1. Decomposition mode of κ v .
Jmse 11 00097 g001
Figure 2. The structure of the experimental platform.
Jmse 11 00097 g002
Figure 3. (a) The slopes of the stator current amplitudes, (b) the slopes of the inequality indicator.
Jmse 11 00097 g003
Figure 4. The signals of stator current amplitudes and inequality indicator with different window functions: (a) no weight, (b) Hanning window, (c) Hamming window, (d) Flap Top window, (e) Blackman window.
Jmse 11 00097 g004
Figure 5. The inequality indicator with different w f , (a) w f = 1000, (b) w f = 4000.
Jmse 11 00097 g005
Figure 6. The relation between inequality indicator and additional resistance.
Jmse 11 00097 g006
Figure 7. The plane plotting the fault condition of HRC under cases 1–18.
Jmse 11 00097 g007
Table 1. Specific parameters of MCT in the experiment.
Turbine ParametersValuePMSM ParametersValue
Twist angle3.4°~25.2°Pole-pair8
Blade chord0.6 mFlux linkage0.1775 Wb
Number of blades3Resistance3.3 Ω
Water density1024 kg/m3d axis inductance11.873 mH
damping1 × 10−6 m2/sq axis inductance11.873 mH
Table 2. HRC conditions of cases tested in the experiment.
Case123456789
Additional resistance (Ω)b-phase00000001.31.4
c-phase00.20.30.60.81.21.500
Case101112131415161718
Additional resistance (Ω)b-phase1.70.30.60.81.00.30.50.70.9
c-phase00.60.60.60.61.21.21.21.2
Table 3. Statistical indicators of inequality indicator with different window functions.
Window FunctionDispersion CoefficientMargin Factor
No weight0.28811.7897
Hanning window0.04911.1529
Hamming window0.06531.2005
Flap top window0.07561.2821
Blackman window0.05231.1729
Table 4. The range of inequality indicators under cases 1–18.
Case123456789
Range2.9 × 10−42.9 × 10−43.6 × 10−43.2 × 10−47.8 × 10−47.7 × 10−43.3 × 10−43.9 × 10−44.4 × 10−4
Case101112131415161718
Range7.0 × 10−46.4 × 10−43.8 × 10−45.1 × 10−44.4 × 10−43.3 × 10−43.1 × 10−48.3 × 10−45.0 × 10−4
Disclaimer/Publisher’s Note: The statements, opinions and data contained in all publications are solely those of the individual author(s) and contributor(s) and not of MDPI and/or the editor(s). MDPI and/or the editor(s) disclaim responsibility for any injury to people or property resulting from any ideas, methods, instructions or products referred to in the content.

