Article

Diversity and Biogeography of Coral Mucus-Associated Bacterial Communities: The Case of Acropora formosa

1
Institute of Biotechnology (IBT), Vietnam Academy of Science and Technology (VAST), Hanoi 10072, Vietnam
2
School of Biotechnology, Graduate University of Science and Technology (GUST), VAST, Hanoi 10072, Vietnam
3
IRD, UMR MARBEC IRD-CNRS-IFREMER-Université Montpellier, 34090 Montpellier, France
*
Author to whom correspondence should be addressed.
J. Mar. Sci. Eng. 2023, 11(1), 74; https://doi.org/10.3390/jmse11010074
Submission received: 18 October 2022 / Revised: 23 December 2022 / Accepted: 27 December 2022 / Published: 3 January 2023

Abstract

:
The role of microorganisms in coral health, disease, and nutrition has been demonstrated in various studies. Environmental factors including pH, temperature, and dissolved oxygen also play crucial roles in maintaining sustainable coral ecosystems. However, how geographical and environmental factors influence bacterial diversity and community composition is unclear. Here, bacterial communities associated with Acropora formosa coral were sampled from four different locations—Phu Quoc Islands (Vietnam), Nha Trang (Vietnam), Ujung Gelam (Indonesia), and Bourake (New Caledonia)—and compared using tagged 16S rRNA sequencing. We identified 24 bacterial phyla, 47 classes, 114 orders, and 495 genera from 18 samples. Overall, Proteobacteria (1039 distant amplicon sequence variants [ASVs]) and Firmicutes (589 ASVs) were predominant, while Verrucomicrobiota (75 ASVs) and Planctomycetota (46 ASVs) were minor taxa. Alpha diversity analyses revealed that the bacterial community associated with Acropora formosa from Ujung Gelam had the highest indexes (Observed and Chao1), while the figures for Bourake were the lowest. Non-metric multidimensional scaling analysis (NMDS) showed significant differences in bacterial communities among locations (ADONIS, p = 1 × 10⁻⁴). Temperature was strongly correlated with the distribution of bacterial communities in Bourake, whereas pH and dissolved oxygen were significantly correlated with the presence of coral-associated bacterial communities in Phu Quoc and Nha Trang. Across all samples, 28 potential biological markers and 95 core ASVs were found, revealing significant differences in coral-associated bacterial communities. Collectively, these findings provide a comprehensive understanding of bacterial communities living in coral reefs across different geographic sites, which could be useful springboards for further studies.

1. Introduction

Coral ecosystems are one of the most biologically diverse systems on Earth due to their remarkable adaptation to short-term natural phenomena [1]. Corals can persist in habitats with relatively extreme conditions, such as shallow pools, reef flats, and mangroves [2]. However, coral reefs are endangered by various environmental stressors such as ocean pH, increasing temperature, and solar radiation [3] as well as biotic stressors such as pathogenic bacteria and viruses, predators, and the loss of endosymbiotic microalgae [4,5].
Some coral-associated microbiota continually play both mutualistic and commensal roles by exhibiting pivotal functions in coral metabolism, including nitrogen fixation, carbon fixation, carbon degradation, and sulfur metabolism [6]. Other types of bacteria serve as coral-antibiotic agents by inhibiting the growth of potentially harmful microorganisms [7]. Besides the presence of commensal bacteria, accumulating evidence indicate strong correlations between bacterial pathogens and coral diseases. For example, Vibrio shiloi is a bacterial pathogen that causes the bleaching of several scleractinian corals [8,9], whereas Aspergillus sydowii and Serratia marcescens are causative agents for aspergillosis [10] and white pox disease [11], respectively.
The composition of coral-associated bacterial communities has been demonstrated to be dependent on several contrasting factors, including geographic location, season, environmental conditions, and coral health [12,13]. Our earlier studies showed significant shifts in coral mucus-associated microbial composition in healthy and bleached corals [14,15]. Recent studies have revealed that Endozoicomonadaceae are the dominant bacterial group associated with corals in Korea and Japan; Mycoplasmataceae dominate in Taiwan [1]; and Campylobacteraceae, Francisellaceae, and Pasteurellaceae are the most likely primary pathogens to colonize the Caribbean Acropora coral reefs [16].
There have been increasing studies on the relationship between environmental factors and coral bleaching that elucidate the critical roles of environmental stressors such as pH, temperature, solar irradiance, and free radicals of oxygen [3,17]. In this study, we assumed that there were relationships between environmental factors and the composition of the microbiome of coral located in different sites worldwide. Thus, an investigation of the composition of bacterial communities associated with Acropora formosa was conducted on four geographic locations, including Phu Quoc Island (Vietnam), Nha Trang (Vietnam), Ujung Gelam (Indonesia), and Bourake (New Caledonia Islands). The association between the coral core microbiomes and geographical and environmental factors is discussed in our study, which provides a comprehensive view of the species Acropora formosa and its related microorganisms to create a premise for further studies.

2. Materials and Methods

2.1. Sample Collection and DNA Extraction

Colony fragments of Acropora formosa (n = 2), a widespread ubiquist species present in the global ocean, were collected between 3 and 5 m depth by scuba diving in shallow coral reefs of Hon Xuong Island of Phu Quoc islands, Vietnam (9°55′20.6″ N 104°01′16.4″ E). Coral mucus was collected from two Acropora formosa colonies in two different locations of this island. Next, the samples were taken out of the water with 3 min of air exposure. The mucus secretion that was triggered by this desiccation stress consisted of long gel-like threads dripping from the coral surface. The first 30 s of mucus production was discarded to prevent contamination and dilution by seawater. Then, the mucus samples were collected using sterile syringes and transferred from syringes to sterile cryotubes, where they were immediately fixed with 30% glycerol solution in a ratio of 1:1 then stored at −20 °C until further use [14]. DNA extractions were processed using the Easy-DNA™ gDNA Purification Kit (Invitrogen, Thermo Fisher Scientific, Waltham, MA, USA) following the manufacturer’s instructions, and 500 µL bacterial DNA was extracted from different coral mucus samples. To assess whether bacterial DNA used for analysis was contaminated during the DNA extraction and polymerase chain reaction (PCR) stages, we used distilled water as the negative control in the PCR, as it contained all reaction components except for the template DNA.
In Phu Quoc, water pH, temperature, and dissolved oxygen were measured from a depth just above the corals (3 to 5 m) using handheld meters such as a Hach refractometer (USA). For other locations, we only used data that were published in NCBI, with the accession number listed in Table 1.

2.2. PCR Amplification and 16S rRNA Gene Sequencing

Amplification of the partial 16S rRNA gene with the purified template DNA was established by using the universal bacterial primer sets 343F (S-D-Bact-0343-a-S-15, 5′-ACGGRAGGCAGCAG-3′) and 802 R (5′-TACCAGGGTATCTAATCCT-3′) [14], 2X PCR Taq Master Mix (Thermo Fisher Scientific, Waltham, MA, USA). These primers were attached with specific 6-bp barcode sequences at the 5′ end and then used for DNA amplification to produce 16S rRNA amplicons. A ~460-bp fragment belonging to the V3–V4 region of the 16S rRNA gene was amplified. PCR amplifications were performed in an Eppendorf 6331 Nexus Gradient MasterCycler Thermal Cycler (Hampton, NH, USA) as follows: 30 cycles at 94 °C for 5 min, 94 °C for 30 s, 65 °C for 30 s, 72 °C for 1 min, and a final extension at 72 °C for 2 min. The pyrosequencing sequencing method of the 16S rRNA gene was performed on the 454 Titanium platform. For further analysis, the obtained files (FASTA and QUAL) were combined into the FASTQ format using the Galaxy server (http://usegalaxy.org (accessed on 27 August 2021)) [20].

2.3. Data Cleaning and Analyses

The dataset used in this study comprised a combination of four sub-datasets: 16S rRNA gene sequences of bacteria living in Acropora formosa collected in Hon Xuong, Phu Quoc, Vietnam; Van Phong Bay, Nha Trang, Vietnam (accession number: SRP116049); Ujung Gelam, Indonesia (accession number: SRP071125); and Bourake, New Caledonia (accession number: PRJNA510614) utilizing the format of FastQ files [14,18,19]. In this study, metagenomic data were collected from different regions of the 16S rRNA gene. Accordingly, raw sequences of bacterial communities from Phu Quoc and Nha Trang were amplified from the 16S rRNA gene V3–V4 region, while those from Ujung Gelam and Bourake belonged to the V5–V6 region. To reduce the influence of differences in data between DNA regions as well as locations, only taxa from phylum to genus were selected by using the tax_glom function in R.
The protocol for processing raw sequence data reads included filtering and trimming low-quality sequences, denoising, inferring sequence variants, constructing an ASV table, and assigning taxonomy, as described by Callahan in 2016 [21]. Data analysis was performed using the DADA2 pipeline (version 1.8)—R Studio (version 3.6.1) with some modifications to optimize access of the dataset. Chimera filtering was performed by the “removeBimeraDenovo” function of the “dada2” package, while taxonomy was assigned using the Silva taxonomic training data formatted for DADA2 (SILVA ribosomal RNA gene database project version 132) [22]. Microbiome relative abundance was assessed by the “phyloseq” package, and bacteria comprising high percentages in the communities were visualized by the “ggplot2” package at phylum and genus levels.
Alpha diversity metrics were calculated to compare the microbial diversity of the samples, which included the observed ASVs, the Chao1 richness estimator, and the Shannon–Weaver index. To minimize the impact of the difference in sample size, we conducted a rarefaction analysis based on resampling using the rarefy function (the vegan package) in R. Comparisons of the alpha diversity indices among samples were tested using the analysis of variance (ANOVA) test, and Tukey’s honestly significant difference test (Tukey’s HSD) was performed on the ANOVA results to compare alpha diversity among locations.
Beta diversity was assessed by calculating the compositional similarities of all 18 samples from four locations on the basis of environmental parameters such as pH, temperature, and dissolved oxygen. Before performing the beta diversity analysis, the centered log ratio (CLR) transformation was used for the normalization of data distribution. A non-metric multidimensional scaling (NMDS) plot (based on the computed Bray-Curtis dissimilarity between samples) was visualized using the envfit function and Vegan package in R. To evaluate the statistical significance of differences among the four locations, ADONIS and betadisper (type = “centroid”) functions were used to test the homogeneity of dispersion and similarity of composition among groups [23]. ANOVA was used to test for differences in beta dispersion among locations.
High-dimensional biomarkers were accessed using the linear discriminant analysis effect size, LEfSe [24], which emphasizes both biological relevance and statistical significance to identify bacterial taxa characterizing the differences between communities. Explaining the differences between biological classes and estimating the sizes of significant variations helped clarify relevant features.
The core ASVs in coral microbiomes were defined using different percentage cut-offs ranging from 30% to 100% [25]. In the current study, the presence of ASVs in at least 80% of samples was chosen as a conservative representation of the core microbiome. To detect core ASVs, we used the function “core_members” in R. Appropriate taxa were chosen and displayed by using the functions add_besthit and plot_core in R, respectively. The core microbiomes of Acropora formosa from four locations were identified using the “microbiome” package and illustrated with an Upset diagram and a heatmap chart.

3. Results

3.1. Overview of the Sequencing Dataset and Data Preprocessing

The composition of bacterial communities living in Acropora formosa coral was investigated based on 16S rRNA gene sequences. A total of 1,390,711 raw reads were obtained from 18 coral mucus samples collected from four locations. Among these, 64,474 (2%) raw reads were collected from Phu Quoc. An ASV table was generated from non-chimeric sequences, including information about ASVs with corresponding abundances (the number of reads with number of ASVs). The total number of sequencing reads and filtered reads for all samples are presented in Table 2.

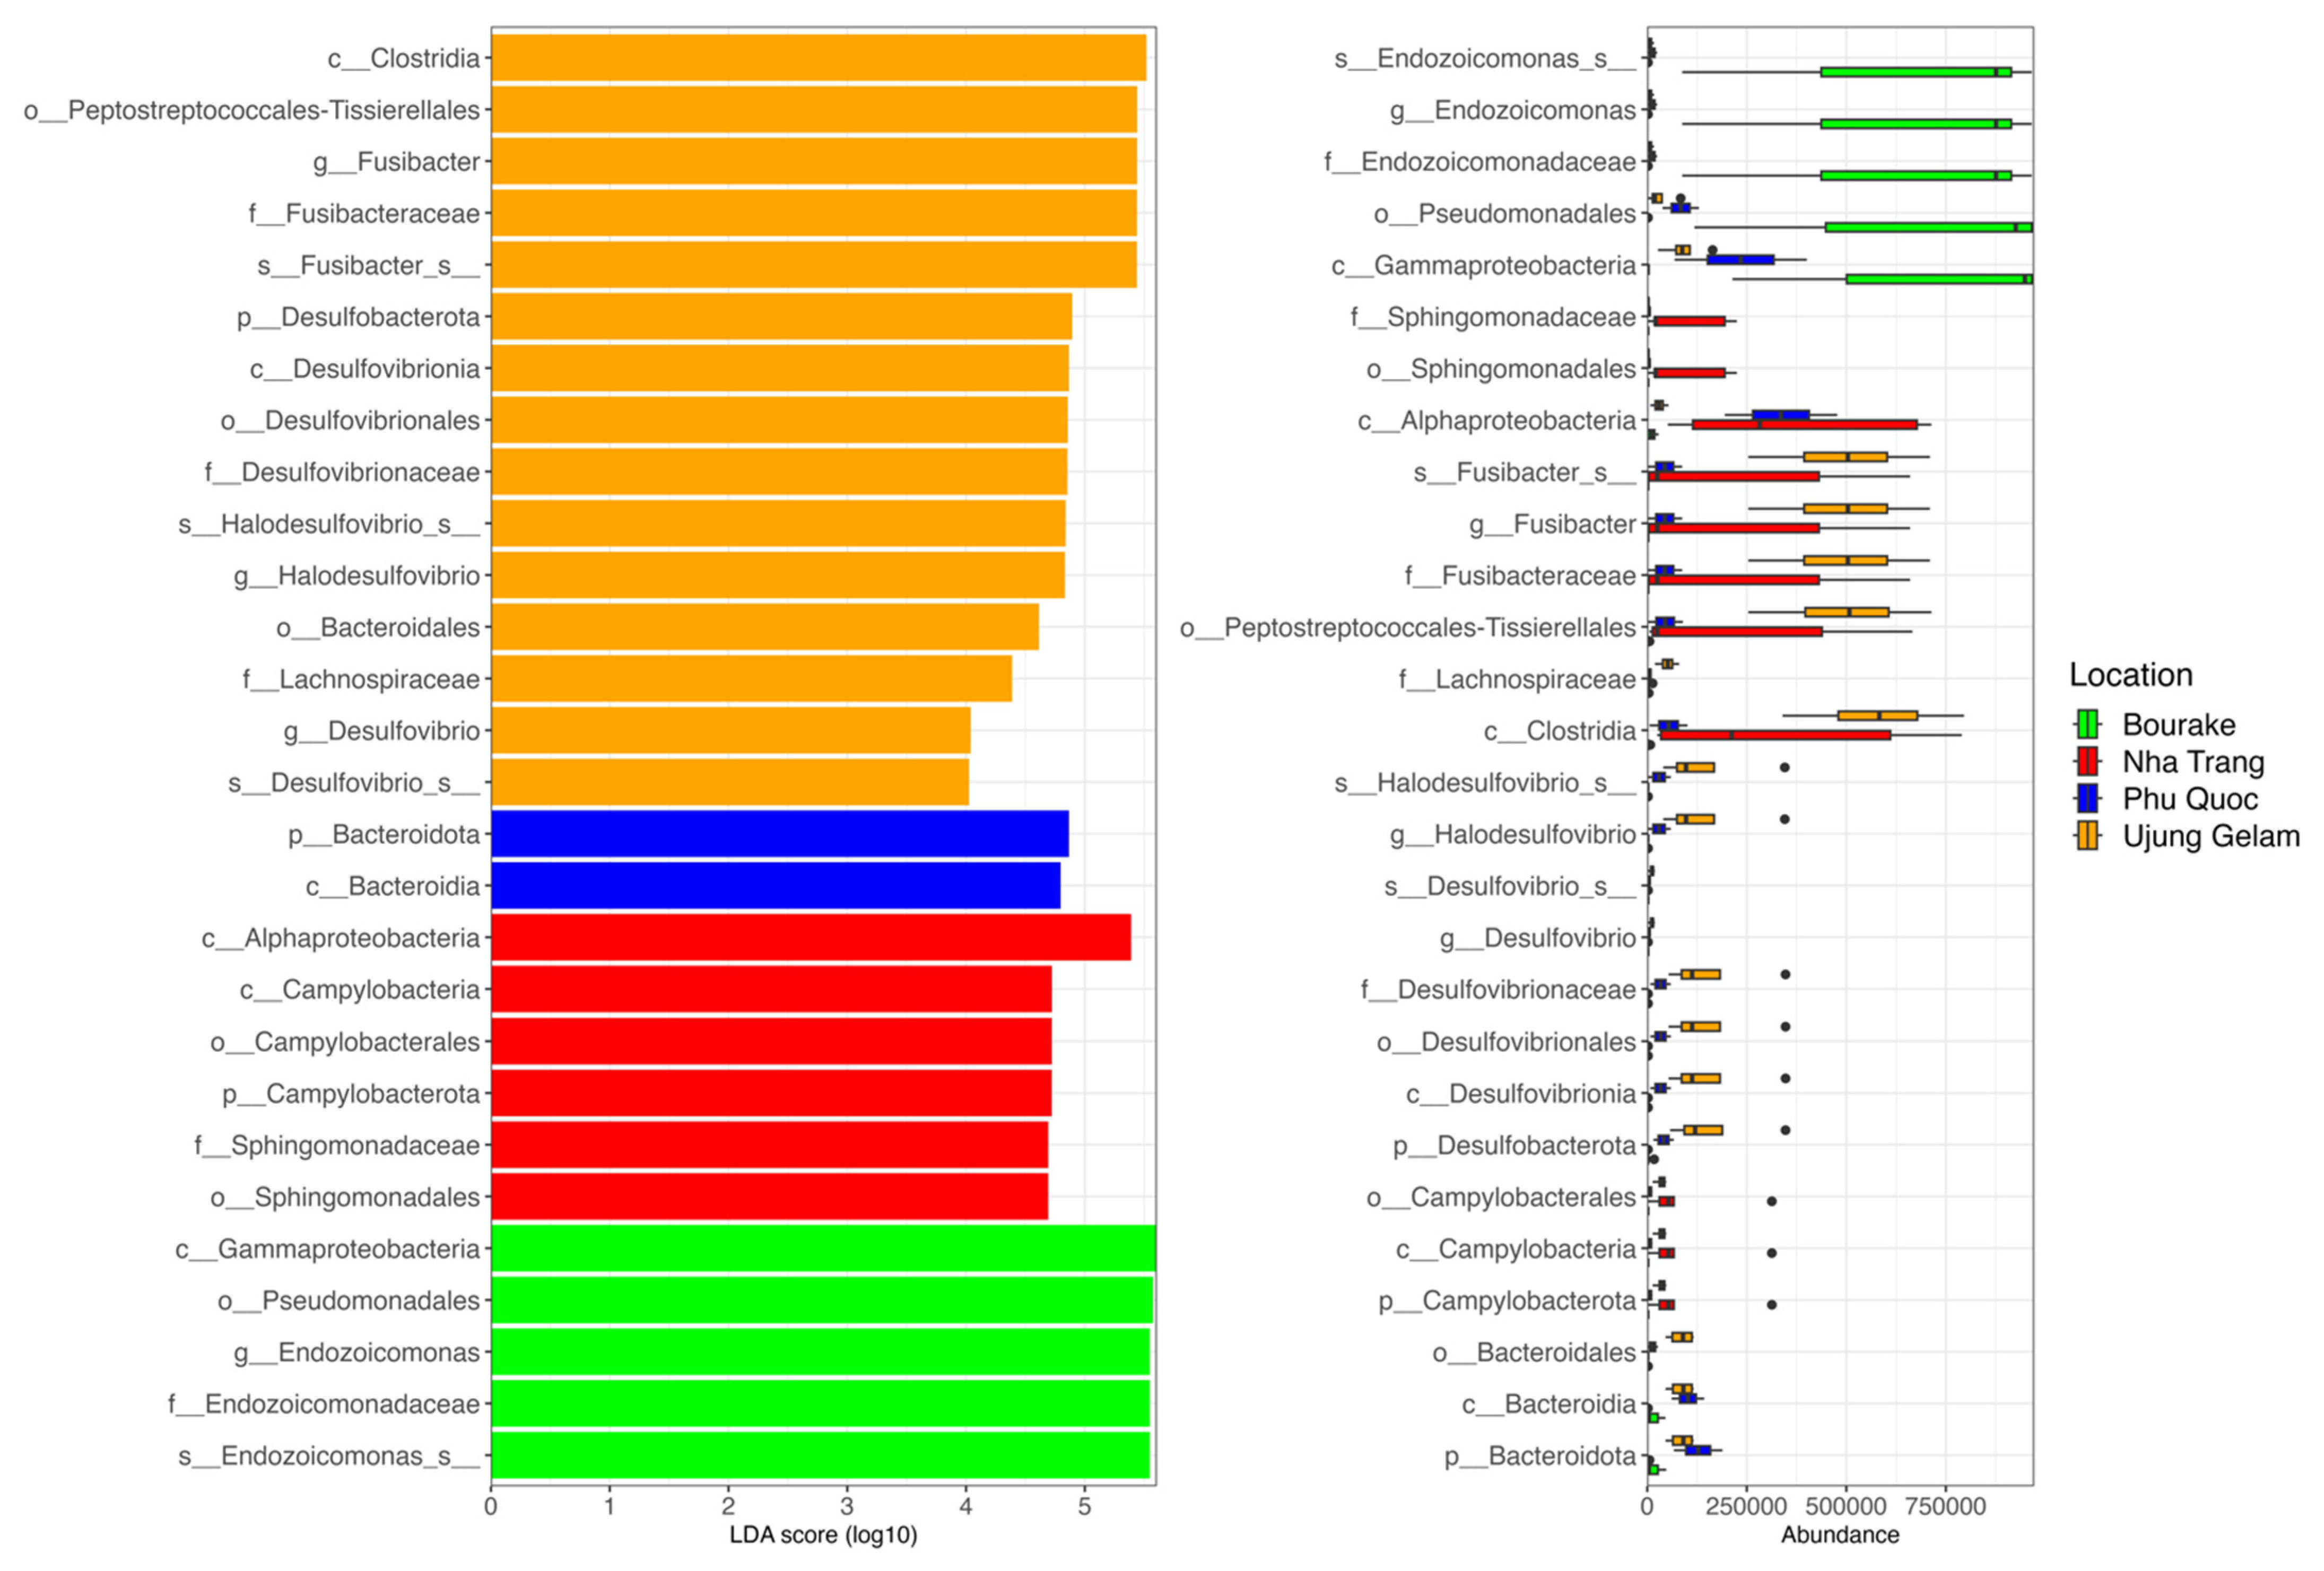
3.2. Taxonomic Assignment of Coral-Associated Bacterial Communities

In total, 24 bacterial phyla, 47 classes, 114 orders, and 495 genera were assigned to the coral mucus samples by DADA2 taxonomic classification. Overall, the surveyed bacterial communities residing in the corals were dominated by the phylum Proteobacteria (1309 distant ASVs), followed by Firmicutes (589 ASVs), Bacteroidota (564 ASVs), Desulfobacterota (151 ASVs), and Actinobacteria (151 ASVs). In addition, other phyla, including Bdellovibrionota (108 ASVs), Campylobacterota (84 ASVs), Verrucomicrobiota (75 ASVs), and Planctomycetota (46 ASVs), were shown in lower abundances (Figure 1a). At the genus level, Endozoicomonas, HIMB11, and Vibrio were majorly shown in Proteobacteria, whereas Fusibacter, Halodesulfovibrio, and Marinifilum were the predominating genera in the phyla Firmicutes, Desulfobacterota, and Bacteroidota, respectively (Figure 1b).
Comparative analysis based on locations indicated that the phylum Proteobacteria comprised the largest proportion of the bacterial communities from the most samples that were collected from Phu Quoc (56.6–59.6%) and Bourake (22.9–97.5%). Additionally, the relative abundance of the phylum Firmicutes displayed a significant increase in the coral bacteriome in Ujung Gelam (ranging from 32.8–79.1%). Similarly, the phylum Campylobacterota (Nha Trang, 32.7%) was found in greater abundance in bacterial communities at this location than at others. At a deeper taxonomic rank, significant variations of relative abundances in some bacterial genera were obtained depending on the coral sampling sites (Figure 1b). The numbers of assigned bacterial genera obtained from Ujung Gelam (276 genera) were higher than those of three other locations, thus demonstrating the higher diversity of bacterial communities at these locations. Endozoicomonas (96.5.%), Fusibacter (66.7%), Candidatus_Actinomarina (39.9%), and Clade_ Ia (23.33%) were the major bacterial genera across coral samples at Bourake, Ujung Gelam, Nha Trang, and Phu Quoc, respectively (Figure 1b).

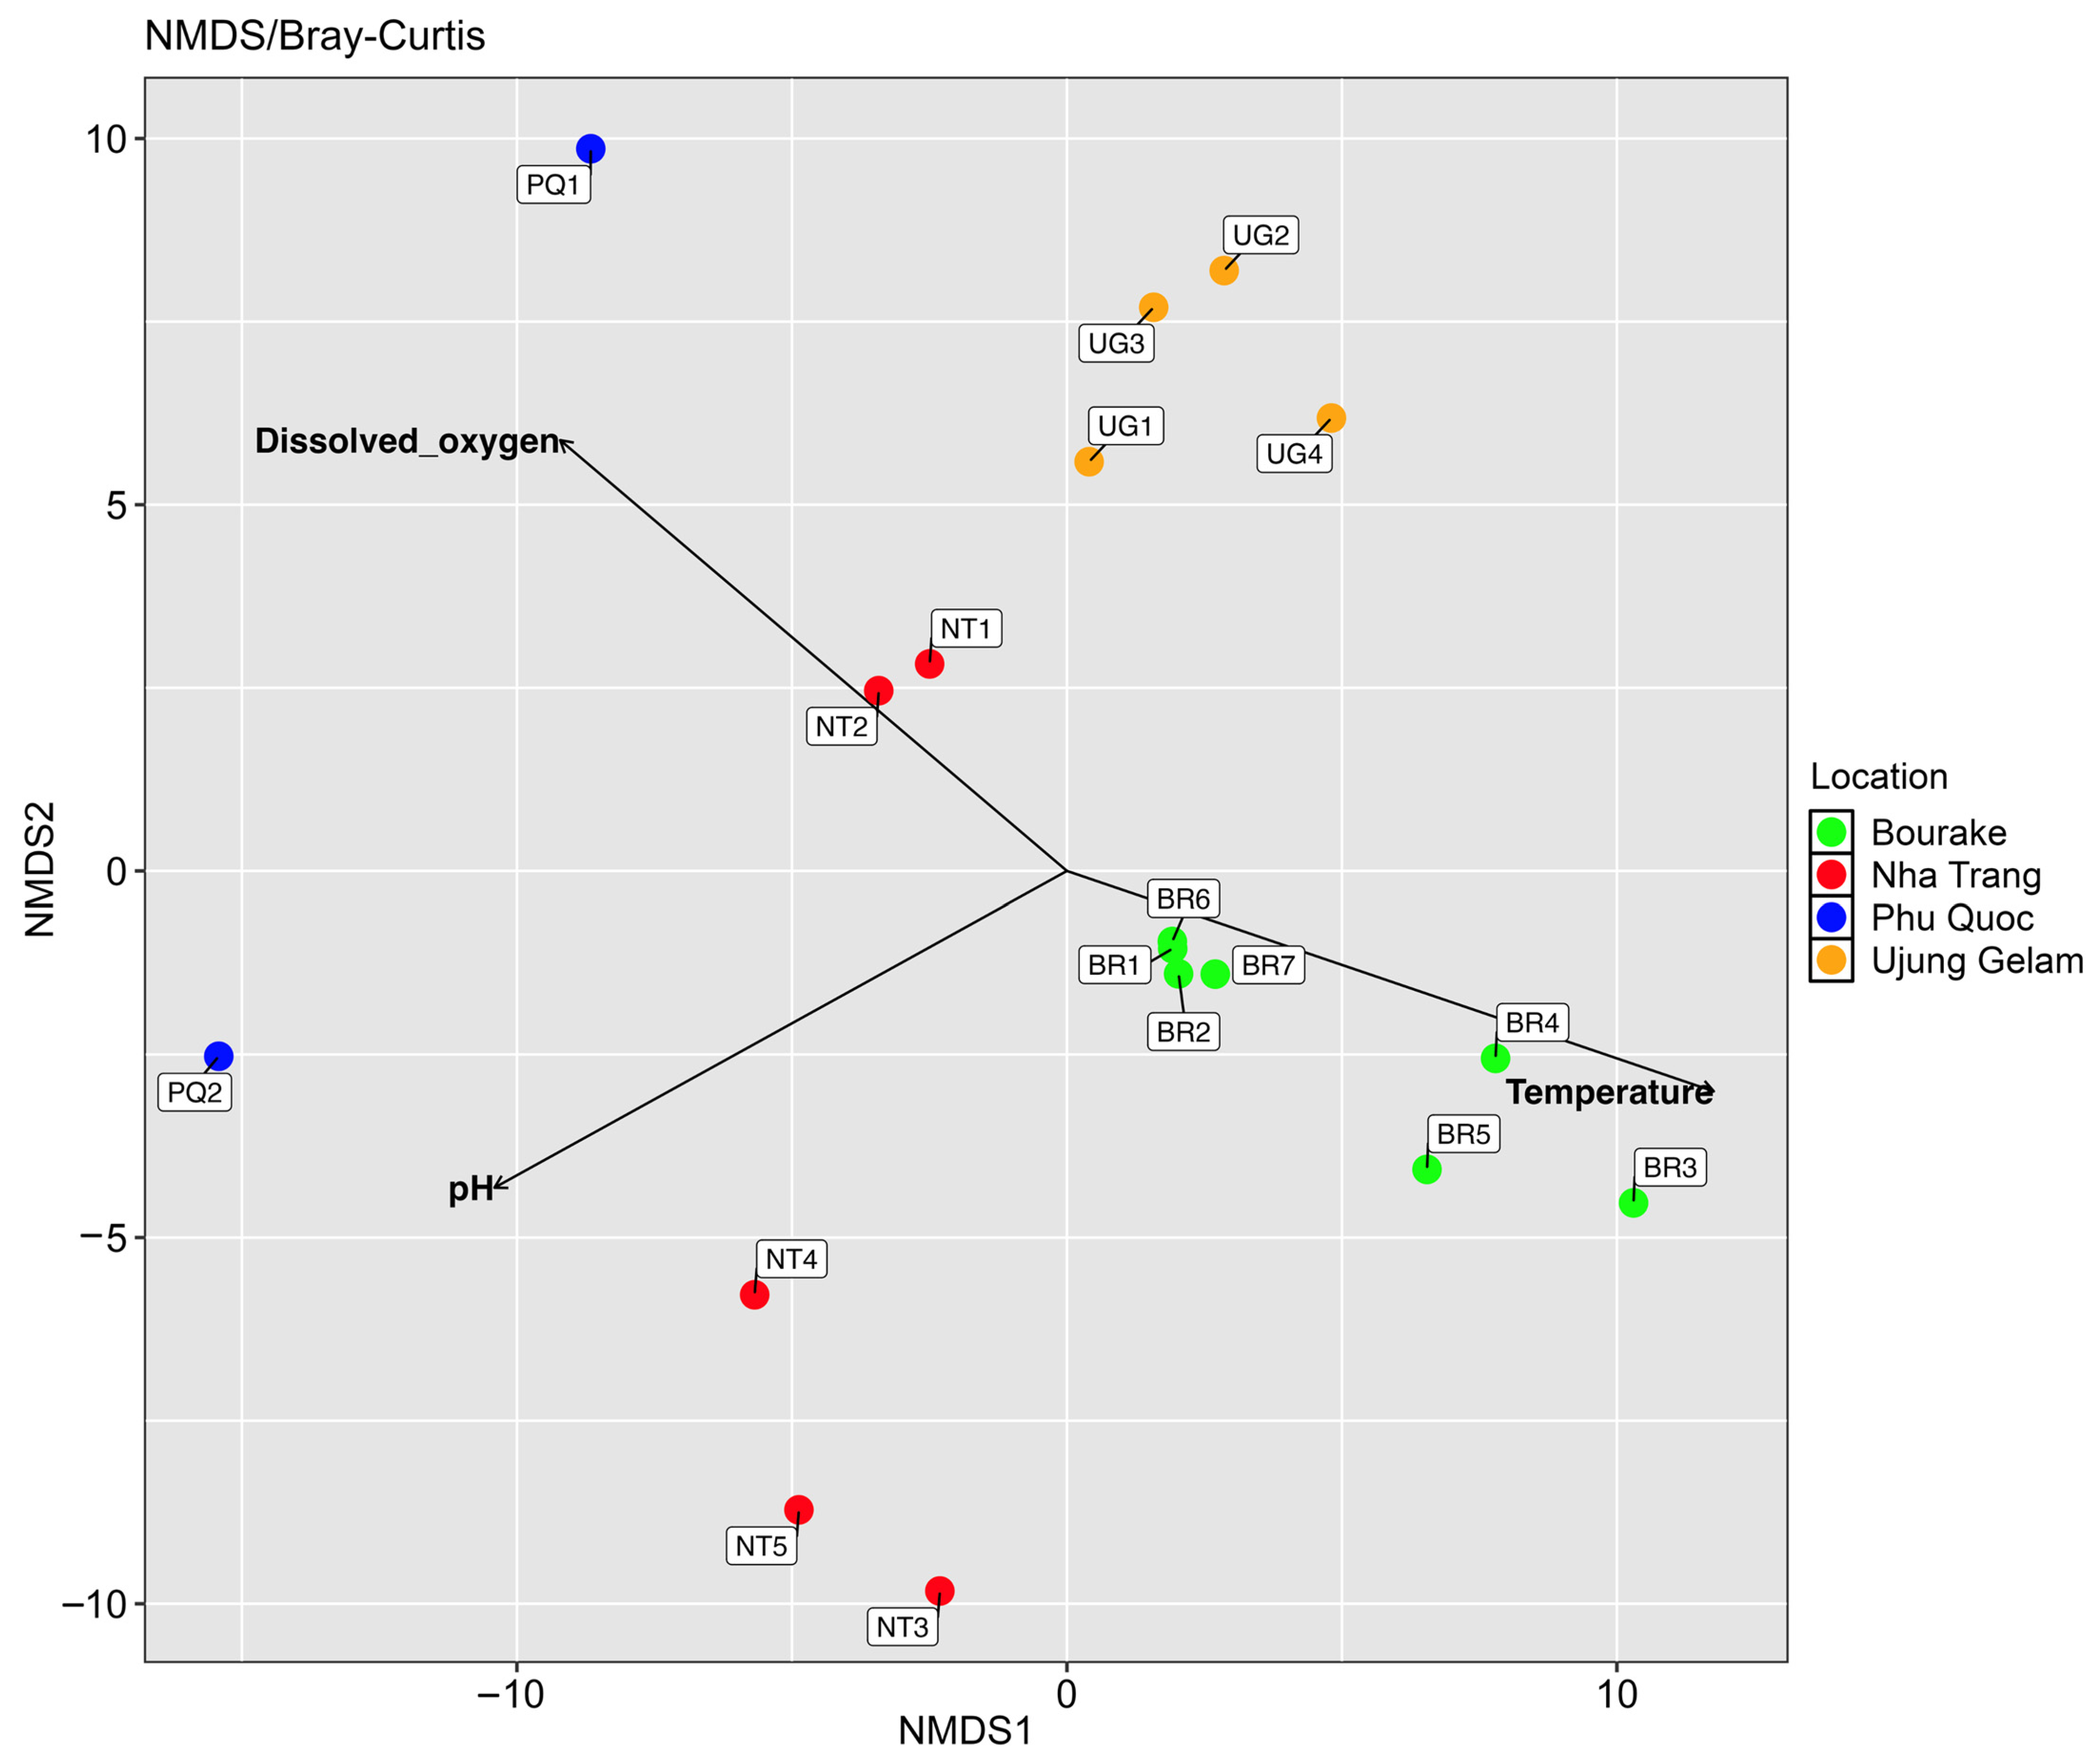
3.3. Diversity and Biogeography of Bacterial Communities

Microbial alpha diversity indicated substantial variability among coral samples at different locations (Figure 2). After performing rarefaction analysis to remove rare ASVs (singletons and doubletons) or low-abundance ASVs, we retained 18 samples containing 98.83 ASVs on average, with a range of 24–236 per sample (Table 2). For each location, the total number of ASVs was Phu Quoc Island, 405; Nha Trang Island, 376; Ujung Gelam, 775; and Bourake, 303. The bacterial composition in Phu Quoc exhibited the largest number of bacterial species/ASVs (236), whereas Bourake exhibited the smallest number of species (24). Likewise, the Chao1 index indicated a significantly higher diversity of bacteria living in the A. formosa located at Ujung Gelam (436.41) than that of Bourake (28.60) and other locations. The Shannon indices had the lowest and highest values in Bourake (2.05) and Phu Quoc (4.79) (Figure 2 and Table 2).
Alpha diversity was estimated by observed ASVs, Chao1, and the Shannon index. Calculations of alpha diversity showed that Ujung Gelam had higher species richness estimates (ANOVA, p < 0.01) than other locations, whereas that for Bourake was the lowest (Figure 2, Table S1). According to the Tukey’s HSD test (Table S1), there were significant differences in the richness estimates (observed ASVs and Chao1) between pairwise comparations such as Phu Quoc–Bourake (p = 4.95 × 10⁻³), Ujung Gelam–Bourake (p = 1.06 × 10⁻³), Phu Quoc–Nha Trang (p = 1.50 × 10⁻²), and Nha Trang–Ujung Gelam (p = 5.06 × 10⁻³). Additionally, the Shannon diversity index did not change significantly between Phu Quoc and Ujung Gelam (p = 5.18 × 10⁻¹, Table S1).
Rank-based methods such as NMDS, which is one of the best ways to visualize beta diversity, were used to illustrate the dissimilarities of the bacterial communities between sampled sites. Each symbol in the plot represents a bacterial community residing in the samples. When they were ordinated closer together, those communities were likely more similar, and vice versa. The non-metric multidimensional scaling analysis (NMDS) of microbial communities in four locations indicated that samples clustered based on their sites. In particular, Phu Quoc and Nha Trang samples were on the left side, while Bourake and Ujung Gelam samples were on the right side of the NMDS plot. Samples from Bourake or Ujung Gelam tended to be grouped closely together compared to other locations (Figure S1). In contrast, Phu Quoc or Nha Trang revealed a clear separation between samples and had more variance in bacterial community compositions (Figure S1).
Measures of the distance to the group centroid revealed that the locations Nha Trang (10.65) and Phu Quoc (10.12) had the highest heterogeneity (a greater distance from the centroid) compared to the others, while Ujung Gelam (6.48) had the lowest heterogeneity. This was supported by the NMDS plot (Figure S1), where the samples from Phu Quoc and Nha Trang showed more variance than Ujung Gelam and Bourake.
PERMANOVA indicated significant differences in bacterial composition among the sampling locations (ADONIS, R2 = 0.55, p = 1 × 10⁻⁴, Table S2). However, there were no significant differences in beta-dispersion by collection location (ANOVA, p = 0.09, Table S3).
Envfit analysis indicated that the temperature factor was significantly correlated (p < 0.05) with the ordination of microbial communities in Bourake, while pH and dissolved oxygen had significant influence on the distribution of bacterial communities in Phu Quoc and Nha Trang (Figure 3). However, in Ujung Gelam, the influence of environmental conditions such as pH, temperature, and dissolved oxygen on the bacterial composition was not observed.
LEfSe was specifically designed to discover biomarkers in genomic data; thus, we applied the tool to the 16S rRNA gene to detect the differences in bacterial abundances across the four coral sampling sites. Bacterial taxa represented organisms comprising the majority in the communities, and colors indicate the sampling sites where a difference was observed. A total of 28 bacterial groups were differentially abundant (Linear discriminant analysis (LDA) score > 4.0) between the coral groups collected from the four different locations (Figure 4). Among these, 15 biomarkers were discovered in Ujung Gelam, 6 in Nha Trang, and 5 in Bourake, and the location with the lowest number of biomarkers was Phu Quoc (2).
As can be seen, there were considerable statistical differences among coral bacteriomes in the four studied sites. The coral samples from Ujung Gelam had the highest diversity of bacterial taxa (from species to phylum), of which most belonged to the phyla Desulfobacterota and Firmicutes, with LDA scores ranging from 4.52 to 5.52. Despite having less diversity than Ujung Gelam, Bourake had higher LDA scores, varying between 5.55 and 5.60 (Table S4).

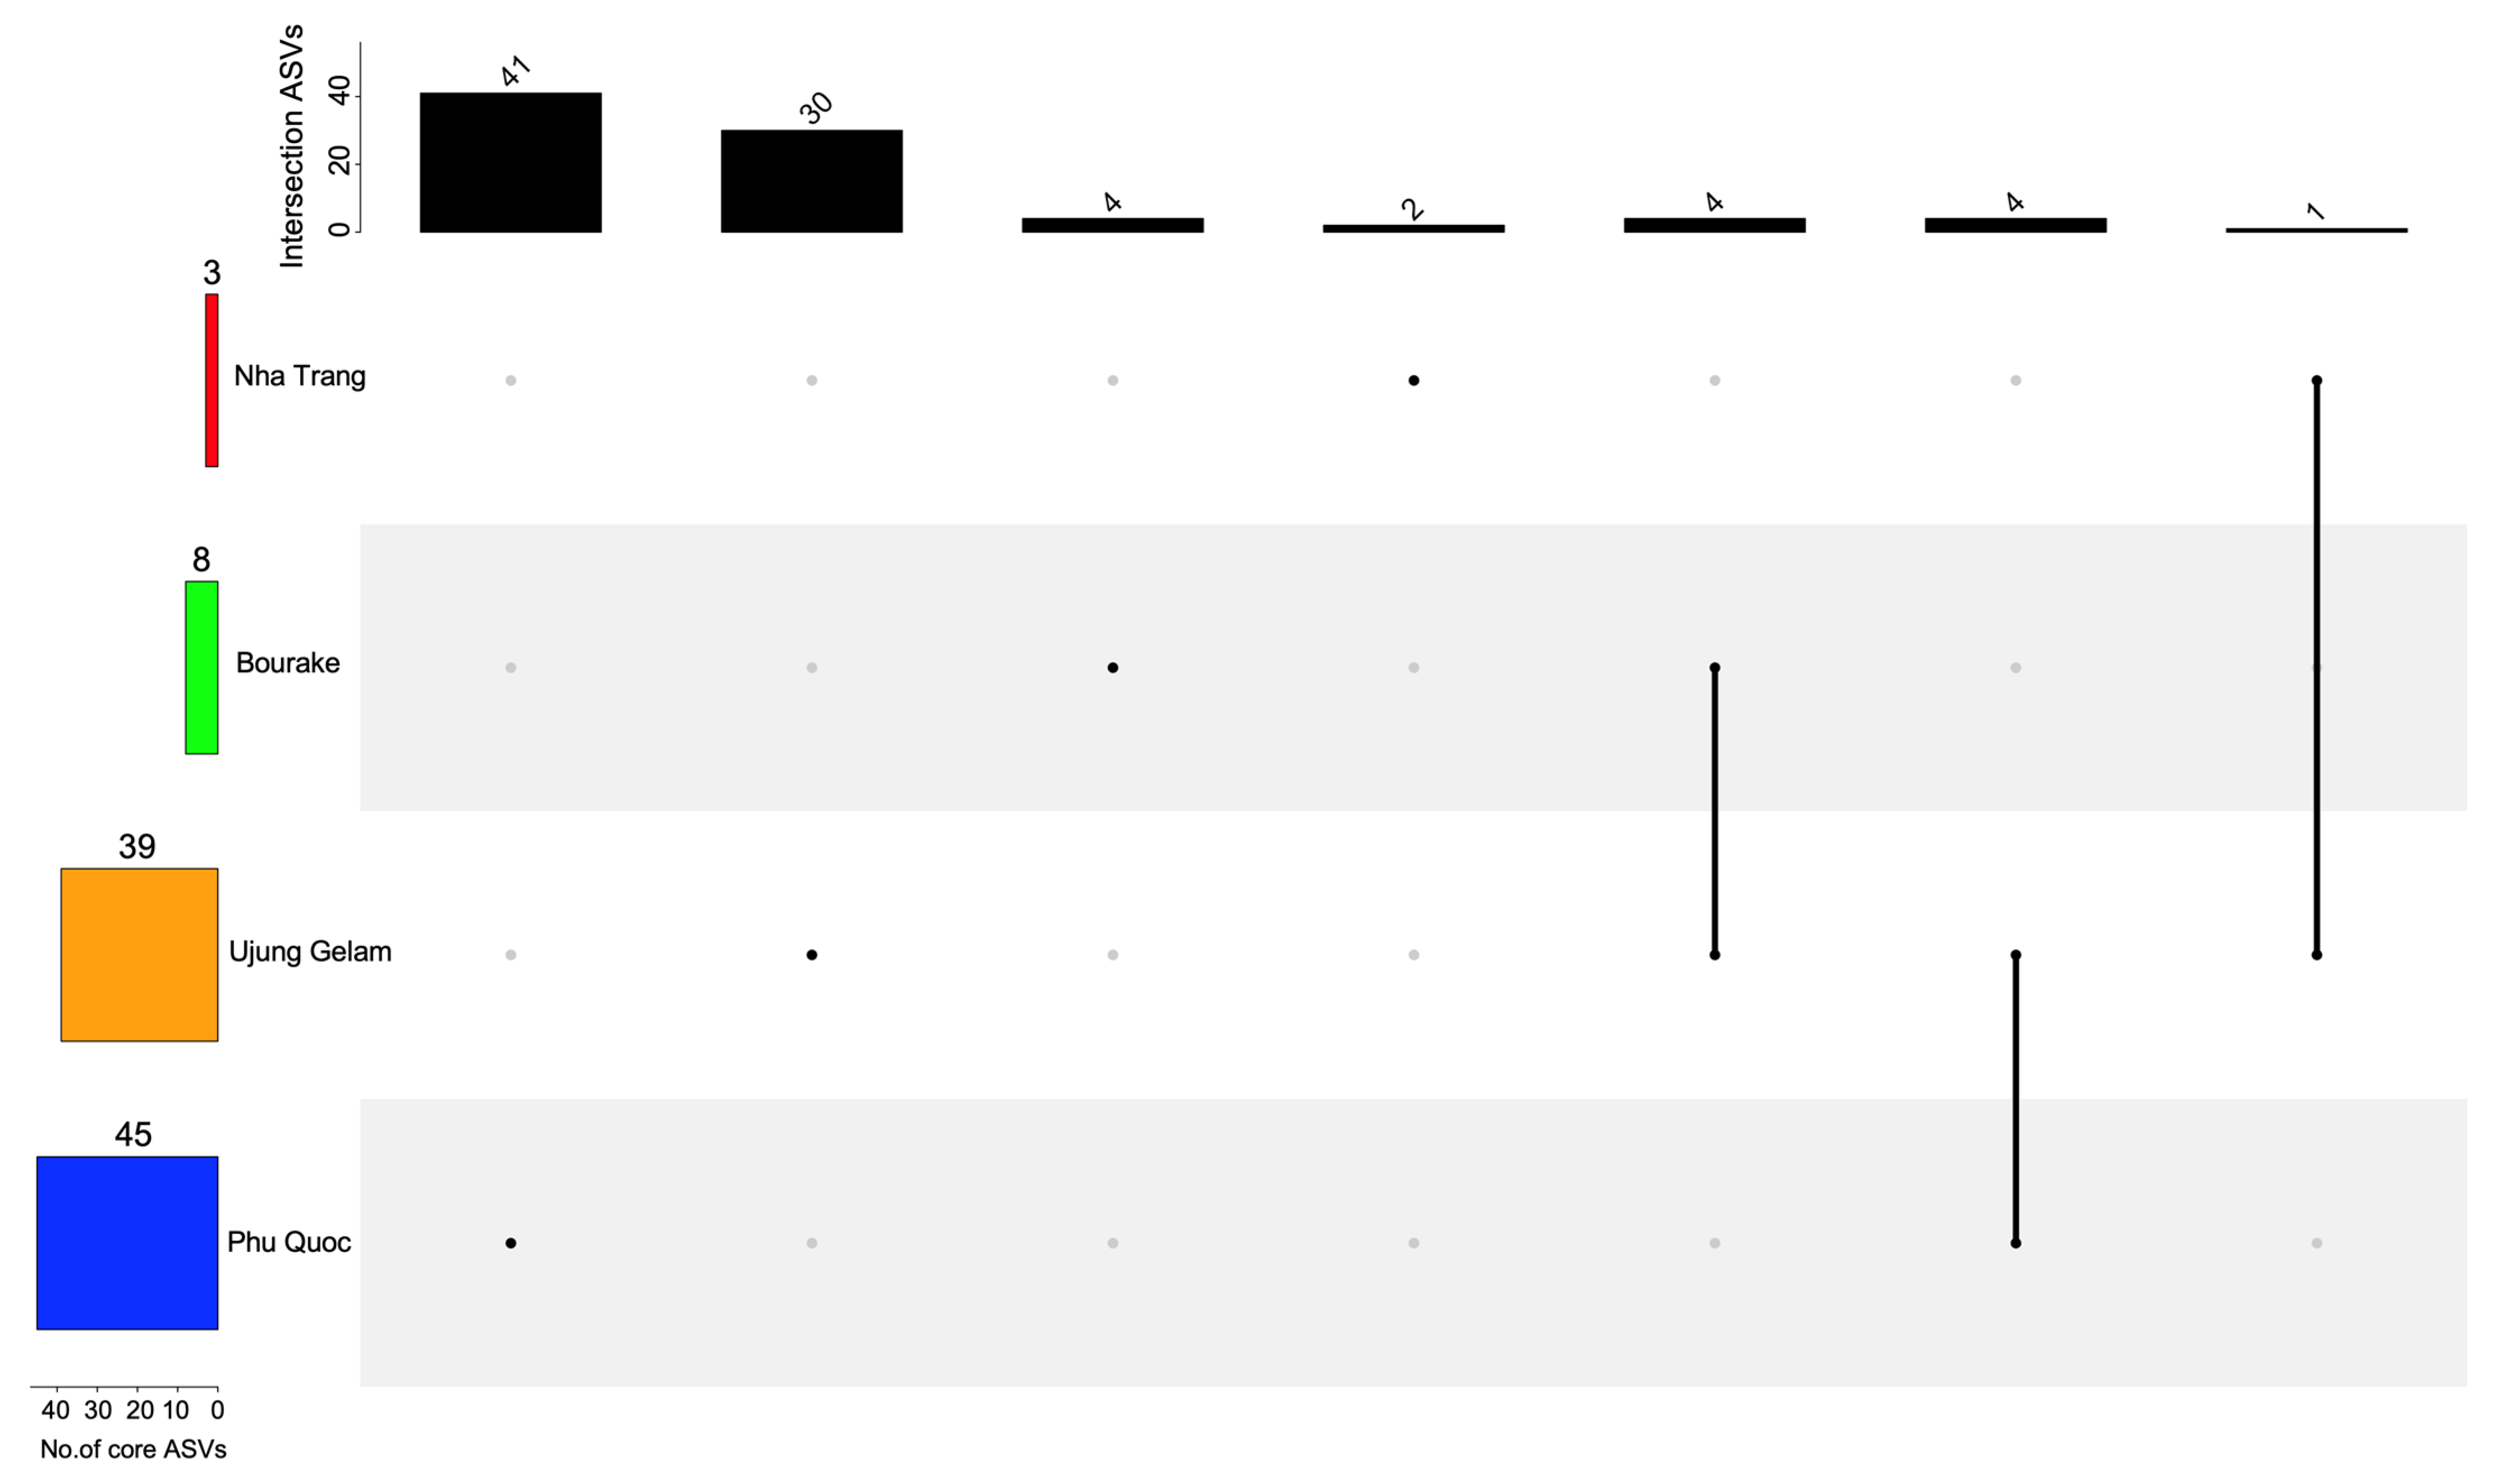
3.4. The Coral Core Microbiome

Using the Upset plot (Figure 5), we identified a total of 95 ASVs, which are considered to be the core microbiome across all four sites. Phu Quoc contributed the highest number of coral core microbiome ASVs (45), while the figure for Ujung Gelam was lower, at 39 ASVs, and that for Nha Trang was lowest, at only 3 ASVs. Ujung Gelam had the largest number of shared ASVs, with a total of 9 ASVs (4 for Ujung Gelam and Phu Quoc, 4 for Ujung Gelam and Bourake, and 1 for Ujung Gelam and Nha Trang). Notably, none of the ASVs were shared across all sites.
A comparative analyis of core microbiome taxa revealed that each group harbors some specific taxa. In particular, genera Clade_Ia, Clade_Ib, and Candidatus_Actinoma exist only in Phu Quoc (Figure S2), whereas Endozoimonas and Brevibacterium were considered as core genera in Bourake (Figure S3). Genus Fusibacter was found in both Nha Trang and Ujung Gelam (Figures S4 and S5, respectively).

4. Discussion

One of the goals of this study was to investigate the bacterial diversity and composition in four different locations (Phu Quoc, Nha Trang, Bourake, and Ujung Gelam). Differences in the bacterial community composition across geographical locations have previously been described in Acropora species [6]. Although Proteobacteria were present in most of the locations, there was a notable shift in their abundance among locations, with the highest abundance recorded at Bourake and the lowest at Ujung Gelam, where Firmicutes was the most dominant phylum. At lower taxa, our results showed that the composition of the coral bacteriome strongly differed by location, where 28 potential biological markers were found by LEfSe. This suggests that microbial community dissimilarity arises with geographical distance, as was reported in recent studies [6,26,27,28]. In other aspects, however, environmental conditions can be considered main drivers of changes in coral bacterial communities. By comparing the beta diversity among four locations, we found that seawater dissolved oxygen, temperature, and pH also play important roles in the distribution of samples, except for samples from Ujung Gelam. This was in agreement with previous studies, as it showed the impact of environmental conditions on the bacterial community of the coral reef [29,30].
The influence of environmental variables upon bacterial diversity and community can also be examined through analyses of coral core microbiomes. Fusibacter and Erythrobacter were the major bacterial genera in Nha Trang. According to Mhuantong et al., (2019), the rising abundance of Fusibacter was found in coral samples with white band disease [18]. However, Erythrobacter is thought to play a crucial role in enhancing coral holobiont tolerance to heat stress [2]. Thus, the temperature was not a determining factor for the distribution of microbial composition in Nha Trang. Some genera, such as Fusibacter, Halodesulfovibrio, Marinifilum, and vibrio, were considered as core microbiome in Ujung Gelam (Figure S5). However, most of them were detected in diseased coral samples [18,31,32]. Thus, we thought that microbial composition and diversity in Acropora formosa were influenced not by a single determinant but resulted from a complex combination of different factors.
Another finding was the presence of Endozoicomonas and Brevibacterium in coral core microbiomein Bourake, which has the environmental conditions of high temperature and low dissolved oxygen. Generally, Endozoicomonas are recognized to play an important role within the coral holobiont due to their widespread predominance in many coral species [16,33,34,35] and apparent metabolic versatility [35,36]. Furthermore, the decrease in the abundance of Endozoicomonas in stressed, diseased, or bleached corals has been reported, which suggests that intensive abundance of Endozoicomonas is a potential indicator of habitat suitability [16,34,37,38,39]. Brevibacterium is thought to be capable of producing palytoxin, a chemical compound that offers nutrition for corals [40]. In Bourake, all samples were healthy. Thus, in addition to geographical and environmental factors, the health state of coral samples was an important factor, having a close correlation with bacterial community diversity.

5. Conclusions

In this study, we compared the composition and abundance of bacterial communities associated with the scleractinian coral Acropora formosa in four geographic sites. According to diversity analysis, there were 28 potential biological markers across all samples, which revealed that coral-associated bacterial communities exhibited significant differences among the studied sites. The results of the core microbiome analysis showed that 95 core ASVs were detected in different environmental conditions. Additionally, our findings indicated that the bacterial community composition in Nha Trang, Phu Quoc, and Ujung Gelam could be affected by environmental conditions such as pH, temperature, and dissolved oxygen.
Overall, our study provides new elements to confirm the strong sensitivity of the coral microbiome to environmental conditions and, therefore, its susceptibility to climate changes.

Supplementary Materials

The following supporting information can be downloaded at: https://www.mdpi.com/article/10.3390/jmse11010074/s1.

Author Contributions

Conceptualization, project administration, funding acquisition, writing—review and editing, V.N.B.; data curation, software, formal analysis, visualization, and writing—original draft preparation, D.H.N.; investigation, project administration, funding acquisition, N.H.C.; validation, project administration, writing—review and editing, Y.B.; methodology, investigation, formal analysis, J.-C.A.; investigation and writing—review and editing, T.B.; supervision, project administration, and funding acquisition, H.H.C. All authors have read and agreed to the published version of the manuscript.

Funding

This research was supported by Vietnam National Foundation for Science and Technology Development (NAFOSTED) under grant number 106.04-2018.309 and funded by DALIDA project under grant number NĐT.37.FRA/18 managed by Ministry of Science and Technology of Vietnam.

Institutional Review Board Statement

Not applicable.

Informed Consent Statement

Not applicable.

Conflicts of Interest

The authors declare no conflict of interest.

References

  1. Woo, S.; Yang, S.-H.; Chen, H.-J.; Tseng, Y.-F.; Hwang, S.-J.; Palmas, S.D.; Denis, V.; Imahara, Y.; Iwase, F.; Yum, S.; et al. Geographical Variations in Bacterial Communities Associated with Soft Coral Scleronephthya Gracillimum. PLoS ONE 2017, 12, e0183663. [Google Scholar] [CrossRef] [PubMed] [Green Version]
  2. Osman, E.O.; Suggett, D.J.; Voolstra, C.R.; Pettay, D.T.; Clark, D.R.; Pogoreutz, C.; Sampayo, E.M.; Warner, M.E.; Smith, D.J. Coral Microbiome Composition along the Northern Red Sea Suggests High Plasticity of Bacterial and Specificity of Endosymbiotic Dinoflagellate Communities. Microbiome 2020, 8, 8. [Google Scholar] [CrossRef] [PubMed]
  3. Welle, P.D.; Small, M.J.; Doney, S.C.; Azevedo, I.L. Estimating the Effect of Multiple Environmental Stressors on Coral Bleaching and Mortality. PLoS ONE 2017, 12, e0175018. [Google Scholar] [CrossRef] [PubMed] [Green Version]
  4. Ezzat, L.; Lamy, T.; Maher, R.L.; Munsterman, K.S.; Landfield, K.M.; Schmeltzer, E.R.; Clements, C.S.; Vega Thurber, R.L.; Burkepile, D.E. Parrotfish Predation Drives Distinct Microbial Communities in Reef-Building Corals. Anim. Microbiome 2020, 2, 5. [Google Scholar] [CrossRef] [Green Version]
  5. Tong, H.; Cai, L.; Zhou, G.; Zhang, W.; Huang, H.; Qian, P.-Y. Correlations Between Prokaryotic Microbes and Stress-Resistant Algae in Different Corals Subjected to Environmental Stress in Hong Kong. Front. Microbiol. 2020, 11, 686. [Google Scholar] [CrossRef]
  6. Littman, R.A.; Willis, B.L.; Pfeffer, C.; Bourne, D.G. Diversities of Coral-Associated Bacteria Differ with Location, but Not Species, for Three Acroporid Corals on the Great Barrier Reef. FEMS Microbiol. Ecol. 2009, 68, 152–163. [Google Scholar] [CrossRef]
  7. Ritchie, K.B. Regulation of Microbial Populations by Coral Surface Mucus and Mucus-Associated Bacteria. Mar. Ecol. Prog. Ser. 2006, 322, 1–14. [Google Scholar] [CrossRef]
  8. Banin, E.; Israely, T.; Kushmaro, A.; Loya, Y.; Orr, E.; Rosenberg, E. Penetration of the Coral-Bleaching Bacterium Vibrio Shiloi into Oculina Patagonica. Appl. Environ. Microbiol. 2000, 66, 3031–3036. [Google Scholar] [CrossRef] [Green Version]
  9. Ben-Haim, Y.; Banim, E.; Kushmaro, A.; Loya, Y.; Rosenberg, E. Inhibition of Photosynthesis and Bleaching of Zooxanthellae by the Coral Pathogen Vibrio Shiloi. Environ. Microbiol. 1999, 1, 223–229. [Google Scholar] [CrossRef]
  10. Soler-Hurtado, M.M.; Sandoval-Sierra, J.V.; Machordom, A.; Diéguez-Uribeondo, J. Aspergillus Sydowii and Other Potential Fungal Pathogens in Gorgonian Octocorals of the Ecuadorian Pacific. PLoS ONE 2016, 11, e0165992. [Google Scholar] [CrossRef]
  11. Joyner, J.L.; Sutherland, K.P.; Kemp, D.W.; Berry, B.; Griffin, A.; Porter, J.W.; Amador, M.H.B.; Noren, H.K.G.; Lipp, E.K. Systematic Analysis of White Pox Disease in Acropora Palmata of the Florida Keys and Role of Serratia Marcescens. Appl. Environ. Microbiol. 2015, 81, 4451–4457. [Google Scholar] [CrossRef] [PubMed] [Green Version]
  12. Sweet, M.J.; Bulling, M.T. On the Importance of the Microbiome and Pathobiome in Coral Health and Disease. Front. Mar. Sci. 2017, 4, 9. [Google Scholar] [CrossRef] [Green Version]
  13. Zhang, Y.-Y.; Ling, J.; Yang, Q.-S.; Wang, Y.-S.; Sun, C.-C.; Sun, H.-Y.; Feng, J.-B.; Jiang, Y.-F.; Zhang, Y.-Z.; Wu, M.-L.; et al. The Diversity of Coral Associated Bacteria and the Environmental Factors Affect Their Community Variation. Ecotoxicology 2015, 24, 1467–1477. [Google Scholar] [CrossRef] [PubMed]
  14. Bettarel, Y.; Halary, S.; Auguet, J.-C.; Mai, T.C.; Van Bui, N.; Bouvier, T.; Got, P.; Bouvier, C.; Monteil-Bouchard, S.; Christelle, D. Corallivory and the Microbial Debacle in Two Branching Scleractinians. ISME J. 2018, 12, 1109–1126. [Google Scholar] [CrossRef] [PubMed] [Green Version]
  15. Nguyen-Kim, H.; Bouvier, T.; Bouvier, C.; Bui, V.N.; Le-Lan, H.; Bettarel, Y. Viral and Bacterial Epibionts in Thermally-Stressed Corals. J. Mar. Sci. Eng. 2015, 3, 1272–1286. [Google Scholar] [CrossRef]
  16. Gignoux-Wolfsohn, S.A.; Aronson, F.M.; Vollmer, S.V. Complex Interactions between Potentially Pathogenic, Opportunistic, and Resident Bacteria Emerge during Infection on a Reef-Building Coral. FEMS Microbiol. Ecol. 2017, 93, fix080. [Google Scholar] [CrossRef] [Green Version]
  17. Brown, B.E. Coral Bleaching: Causes and Consequences. Coral Reefs 1997, 16, S129–S138. [Google Scholar] [CrossRef]
  18. Mhuantong, W.; Nuryadi, H.; Trianto, A.; Sabdono, A.; Tangphatsornruang, S.; Eurwilaichitr, L.; Kanokratana, P.; Champreda, V. Comparative Analysis of Bacterial Communities Associated with Healthy and Diseased Corals in the Indonesian Sea. PeerJ 2019, 7, e8137. [Google Scholar] [CrossRef]
  19. Camp, E.F.; Suggett, D.J.; Pogoreutz, C.; Nitschke, M.R.; Houlbreque, F.; Hume, B.C.C.; Gardner, S.G.; Zampighi, M.; Rodolfo-Metalpa, R.; Voolstra, C.R. Corals Exhibit Distinct Patterns of Microbial Reorganisation to Thrive in an Extreme Inshore Environment. Coral Reefs 2020, 39, 701–716. [Google Scholar] [CrossRef]
  20. Blankenberg, D.; Gordon, A.; Von Kuster, G.; Coraor, N.; Taylor, J.; Nekrutenko, A. Manipulation of FASTQ Data with Galaxy. Bioinformatics 2010, 26, 1783–1785. [Google Scholar] [CrossRef] [Green Version]
  21. Callahan, B.J.; Sankaran, K.; Fukuyama, J.A.; McMurdie, P.J.; Holmes, S.P. Bioconductor Workflow for Microbiome Data Analysis: From Raw Reads to Community Analyses. F1000Res 2016, 5, 1492. [Google Scholar] [CrossRef] [PubMed]
  22. Quast, C.; Pruesse, E.; Yilmaz, P.; Gerken, J.; Schweer, T.; Yarza, P.; Peplies, J.; Glöckner, F.O. The SILVA Ribosomal RNA Gene Database Project: Improved Data Processing and Web-Based Tools. Nucleic Acids Res. 2013, 41, D590–D596. [Google Scholar] [CrossRef] [PubMed]
  23. Oksanen, J.; Blanchet, F.G.; Friendly, M.; Kindt, R.; Legendre, P.; McGlinn, D.; Minchin, P.R.; O’Hara, R.B.; Simpson, G.L.; Solymos, P.; et al. Vegan: Community Ecology Package R Package Version 2.5-7; R Foundation for Statistical Computing: Vienna, Austria, 2020. Available online: https://cran.r-project.org/package=vegan (accessed on 27 August 2021).
  24. Segata, N.; Izard, J.; Waldron, L.; Gevers, D.; Miropolsky, L.; Garrett, W.S.; Huttenhower, C. Metagenomic Biomarker Discovery and Explanation. Genome Biol. 2011, 12, R60. [Google Scholar] [CrossRef] [PubMed] [Green Version]
  25. Hernandez-Agreda, A.; Gates, R.D.; Ainsworth, T.D. Defining the Core Microbiome in Corals’ Microbial Soup. Trends Microbiol. 2017, 25, 125–140. [Google Scholar] [CrossRef]
  26. Hester, E.R.; Barott, K.L.; Nulton, J.; Vermeij, M.J.; Rohwer, F.L. Stable and Sporadic Symbiotic Communities of Coral and Algal Holobionts. ISME J. 2016, 10, 1157–1169. [Google Scholar] [CrossRef] [Green Version]
  27. Lee, O.O.; Yang, J.; Bougouffa, S.; Wang, Y.; Batang, Z.; Tian, R.; Al-Suwailem, A.; Qian, P.-Y. Spatial and Species Variations in Bacterial Communities Associated with Corals from the Red Sea as Revealed by Pyrosequencing. Appl. Environ. Microbiol. 2012, 78, 7173–7184. [Google Scholar] [CrossRef] [Green Version]
  28. Pantos, O.; Bongaerts, P.; Dennis, P.G.; Tyson, G.W.; Hoegh-Guldberg, O. Habitat-Specific Environmental Conditions Primarily Control the Microbiomes of the Coral Seriatopora Hystrix. ISME J. 2015, 9, 1916–1927. [Google Scholar] [CrossRef]
  29. Meron, D.; Atias, E.; Iasur Kruh, L.; Elifantz, H.; Minz, D.; Fine, M.; Banin, E. The Impact of Reduced PH on the Microbial Community of the Coral Acropora Eurystoma. ISME J. 2011, 5, 51–60. [Google Scholar] [CrossRef] [Green Version]
  30. Webster, N.S.; Negri, A.P.; Botté, E.S.; Laffy, P.W.; Flores, F.; Noonan, S.; Schmidt, C.; Uthicke, S. Host-Associated Coral Reef Microbes Respond to the Cumulative Pressures of Ocean Warming and Ocean Acidification. Sci. Rep. 2016, 6, 19324. [Google Scholar] [CrossRef] [Green Version]
  31. Huntley, N.; Brandt, M.E.; Becker, C.C.; Miller, C.A.; Meiling, S.S.; Correa, A.M.S.; Holstein, D.M.; Muller, E.M.; Mydlarz, L.D.; Smith, T.B.; et al. Experimental Transmission of Stony Coral Tissue Loss Disease Results in Differential Microbial Responses within Coral Mucus and Tissue. ISME Commun. 2022, 2, 1–11. [Google Scholar] [CrossRef]
  32. Becker, C.C.; Brandt, M.; Miller, C.A.; Apprill, A. Microbial Bioindicators of Stony Coral Tissue Loss Disease Identified in Corals and Overlying Waters Using a Rapid Field-Based Sequencing Approach. Environ. Microbiol. 2022, 24, 1166–1182. [Google Scholar] [CrossRef] [PubMed]
  33. Glasl, B.; Herndl, G.J.; Frade, P.R. The Microbiome of Coral Surface Mucus Has a Key Role in Mediating Holobiont Health and Survival upon Disturbance. ISME J. 2016, 10, 2280–2292. [Google Scholar] [CrossRef] [PubMed] [Green Version]
  34. Meyer, J.L.; Gunasekera, S.P.; Scott, R.M.; Paul, V.J.; Teplitski, M. Microbiome Shifts and the Inhibition of Quorum Sensing by Black Band Disease Cyanobacteria. ISME J. 2016, 10, 1204–1216. [Google Scholar] [CrossRef] [PubMed] [Green Version]
  35. Neave, M.J.; Rachmawati, R.; Xun, L.; Michell, C.T.; Bourne, D.G.; Apprill, A.; Voolstra, C.R. Differential Specificity between Closely Related Corals and Abundant Endozoicomonas Endosymbionts across Global Scales. ISME J. 2017, 11, 186–200. [Google Scholar] [CrossRef] [Green Version]
  36. Ding, J.-Y.; Shiu, J.-H.; Chen, W.-M.; Chiang, Y.-R.; Tang, S.-L. Genomic Insight into the Host–Endosymbiont Relationship of Endozoicomonas Montiporae CL-33T with Its Coral Host. Front. Microbiol. 2016, 7, 251. [Google Scholar] [CrossRef] [Green Version]
  37. Bourne, D.G.; Dennis, P.G.; Uthicke, S.; Soo, R.M.; Tyson, G.W.; Webster, N. Coral Reef Invertebrate Microbiomes Correlate with the Presence of Photosymbionts. ISME J. 2013, 7, 1452–1458. [Google Scholar] [CrossRef]
  38. Morrow, K.M.; Bourne, D.G.; Humphrey, C.; Botté, E.S.; Laffy, P.; Zaneveld, J.; Uthicke, S.; Fabricius, K.E.; Webster, N.S. Natural Volcanic CO2 Seeps Reveal Future Trajectories for Host–Microbial Associations in Corals and Sponges. ISME J. 2015, 9, 894–908. [Google Scholar] [CrossRef] [Green Version]
  39. Ziegler, M.; Roik, A.; Porter, A.; Zubier, K.; Mudarris, M.S.; Ormond, R.; Voolstra, C.R. Coral Microbial Community Dynamics in Response to Anthropogenic Impacts near a Major City in the Central Red Sea. Mar. Pollut. Bull. 2016, 105, 629–640. [Google Scholar] [CrossRef] [Green Version]
  40. Seemann, P.; Gernert, C.; Schmitt, S.; Mebs, D.; Hentschel, U. Detection of Hemolytic Bacteria from Palythoa Caribaeorum (Cnidaria, Zoantharia) Using a Novel Palytoxin-Screening Assay. Antonie Van Leeuwenhoek 2009, 96, 405–411. [Google Scholar] [CrossRef]
Figure 1. Taxonomic classification of bacterial diversity at (a) phylum and (b) genus levels. The bar charts show the composition and abundance of bacterial communities at the phylum (relative abundance > 1%) and genus levels (relative abundance > 2%).
Jmse 11 00074 g001
Figure 2. Alpha diversity of microbial communities associated with Acropora formosa. The line inside the box represents the median, while the whiskers display the lowest and highest values within the 1.5 interquartile range (IQR). Sample values are shown as dots.
Jmse 11 00074 g002
Figure 3. Non–metric multidimensional scaling (NMDS) of microbial communities. Sample ordination based on bacterial taxonomic composition across samples is illustrated by an NMDS plot based on Bray–Curtis dissimilarity. Vectors represent the correlation between environmental variables and axes.
Jmse 11 00074 g003
Figure 4. Linear discriminant analysis (LDA) effect size (LEfSe) results on coral microbiomes. Taxonomic distribution of bacterial groups according to LDA score (on the left side) and abundance (on the right side).
Jmse 11 00074 g004
Figure 5. Overview of the coral core microbiome composition in Acropora formosa coral. Upset diagram showing the number of shared and unique ASVs in four different locations.
Jmse 11 00074 g005
Table 1. Sampling sites and environmental factors associated with Acropora formosa coral.
Sampling SitesAccessions NumbersSpeciesSample IDpHTemperatureDissolved Oxygen
Phu Quoc
(9°55′20.6″ N 104°01′16.4″ E
This studyAcropora formosaPQ17.96 ± 0.0127.8 ± 0.096.96 ± 0.11
PQ2
Nha Trang
(Whale Island (12°39.1′ N, 109°23.9′ E)
SRP116049
[14]
Acropora formosaNT18.19 ± 0.0529.5 ± 0.45.92 ± 0.15
NT2
NT3
NT4
NT5
Ujung Gelam
(S 05°49′57.7″, E 110° 22′50.5″)
SRP071125
[18]
Acropora formosaUG17.3 ± 0.130.1 ± 0.46.4 ± 0.6
UG2
UG3
UG4
Bourake-Lagoon
(21°56.915 S; 165°59.577 E)
PRJNA510614
[19]
Acropora formosaBR17.3332.3
BR2
BR3
BR4
BR5
BR6
BR7
Table 2. Alpha diversity estimates of bacterial communities associated with Acropora formosa.
Sampling SitesSpeciesSample IDNo. of Raw SequencesNo. of Sequences after QCObserved
ASVs
Chao1Shannon
Phu QuocAcropora formosaPQ131,06421,432231322.224.79
PQ233,4096008174210.674.38
Nha TrangAcropora formosaNT149,93615,7298595.203.65
NT252,51028,1007796.463.33
NT375,70960,1173737.503.02
NT465,00752,2215454.503.47
NT545,6347970123143.323.67
Ujung GelamAcropora formosaUG1186,435133,877169250.003.89
UG2195,464128,950236426.834.56
UG3232,120175,525228436.414.44
UG4145,10475,380142266.253.81
BourakeAcropora formosaBR165,87552,8432828.602.29
BR255,16443,5443741.002.62
BR332,45228,524157262.643.19
BR410,782928881114.062.37
BR5463537646570.352.55
BR676,14562,8273135.022.32
BR733,26628,3812429.002.05
Disclaimer/Publisher’s Note: The statements, opinions and data contained in all publications are solely those of the individual author(s) and contributor(s) and not of MDPI and/or the editor(s). MDPI and/or the editor(s) disclaim responsibility for any injury to people or property resulting from any ideas, methods, instructions or products referred to in the content.

