
Verification of the Ekman Upwelling Criterion with In Situ Temperature Measurements in the Southeastern Baltic Sea


Abstract
:1. Introduction
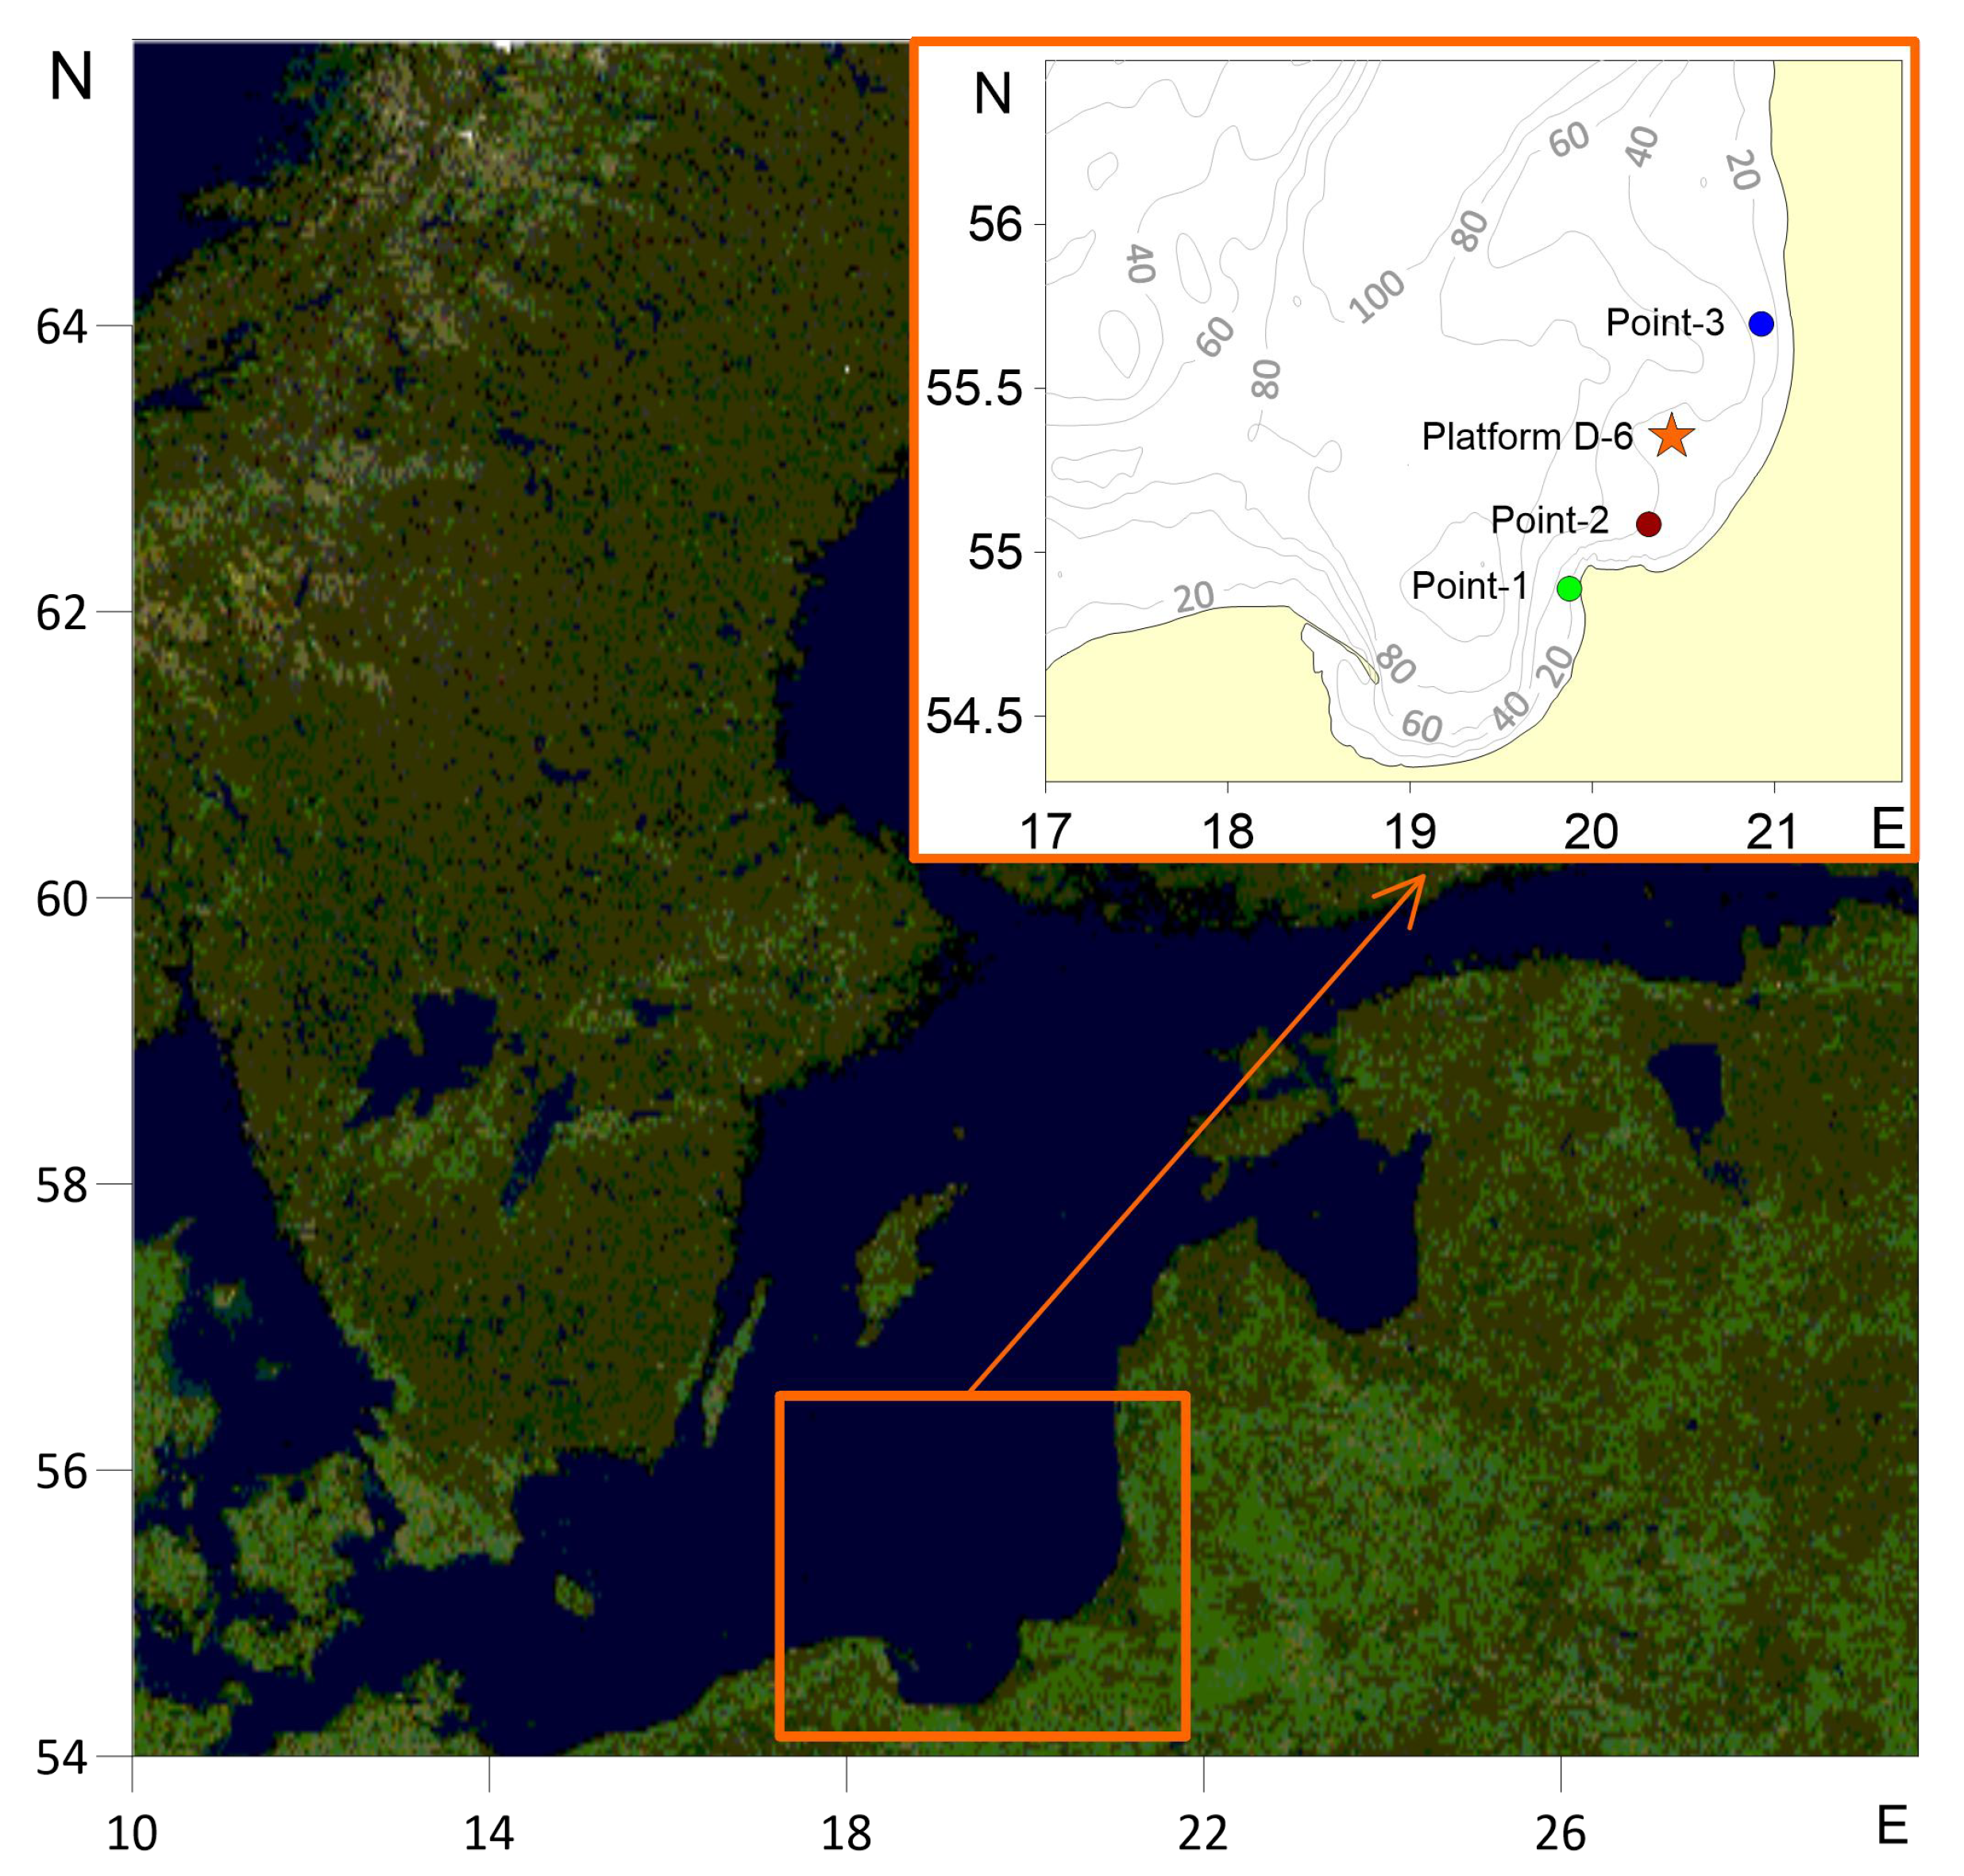
2. Data and Methods
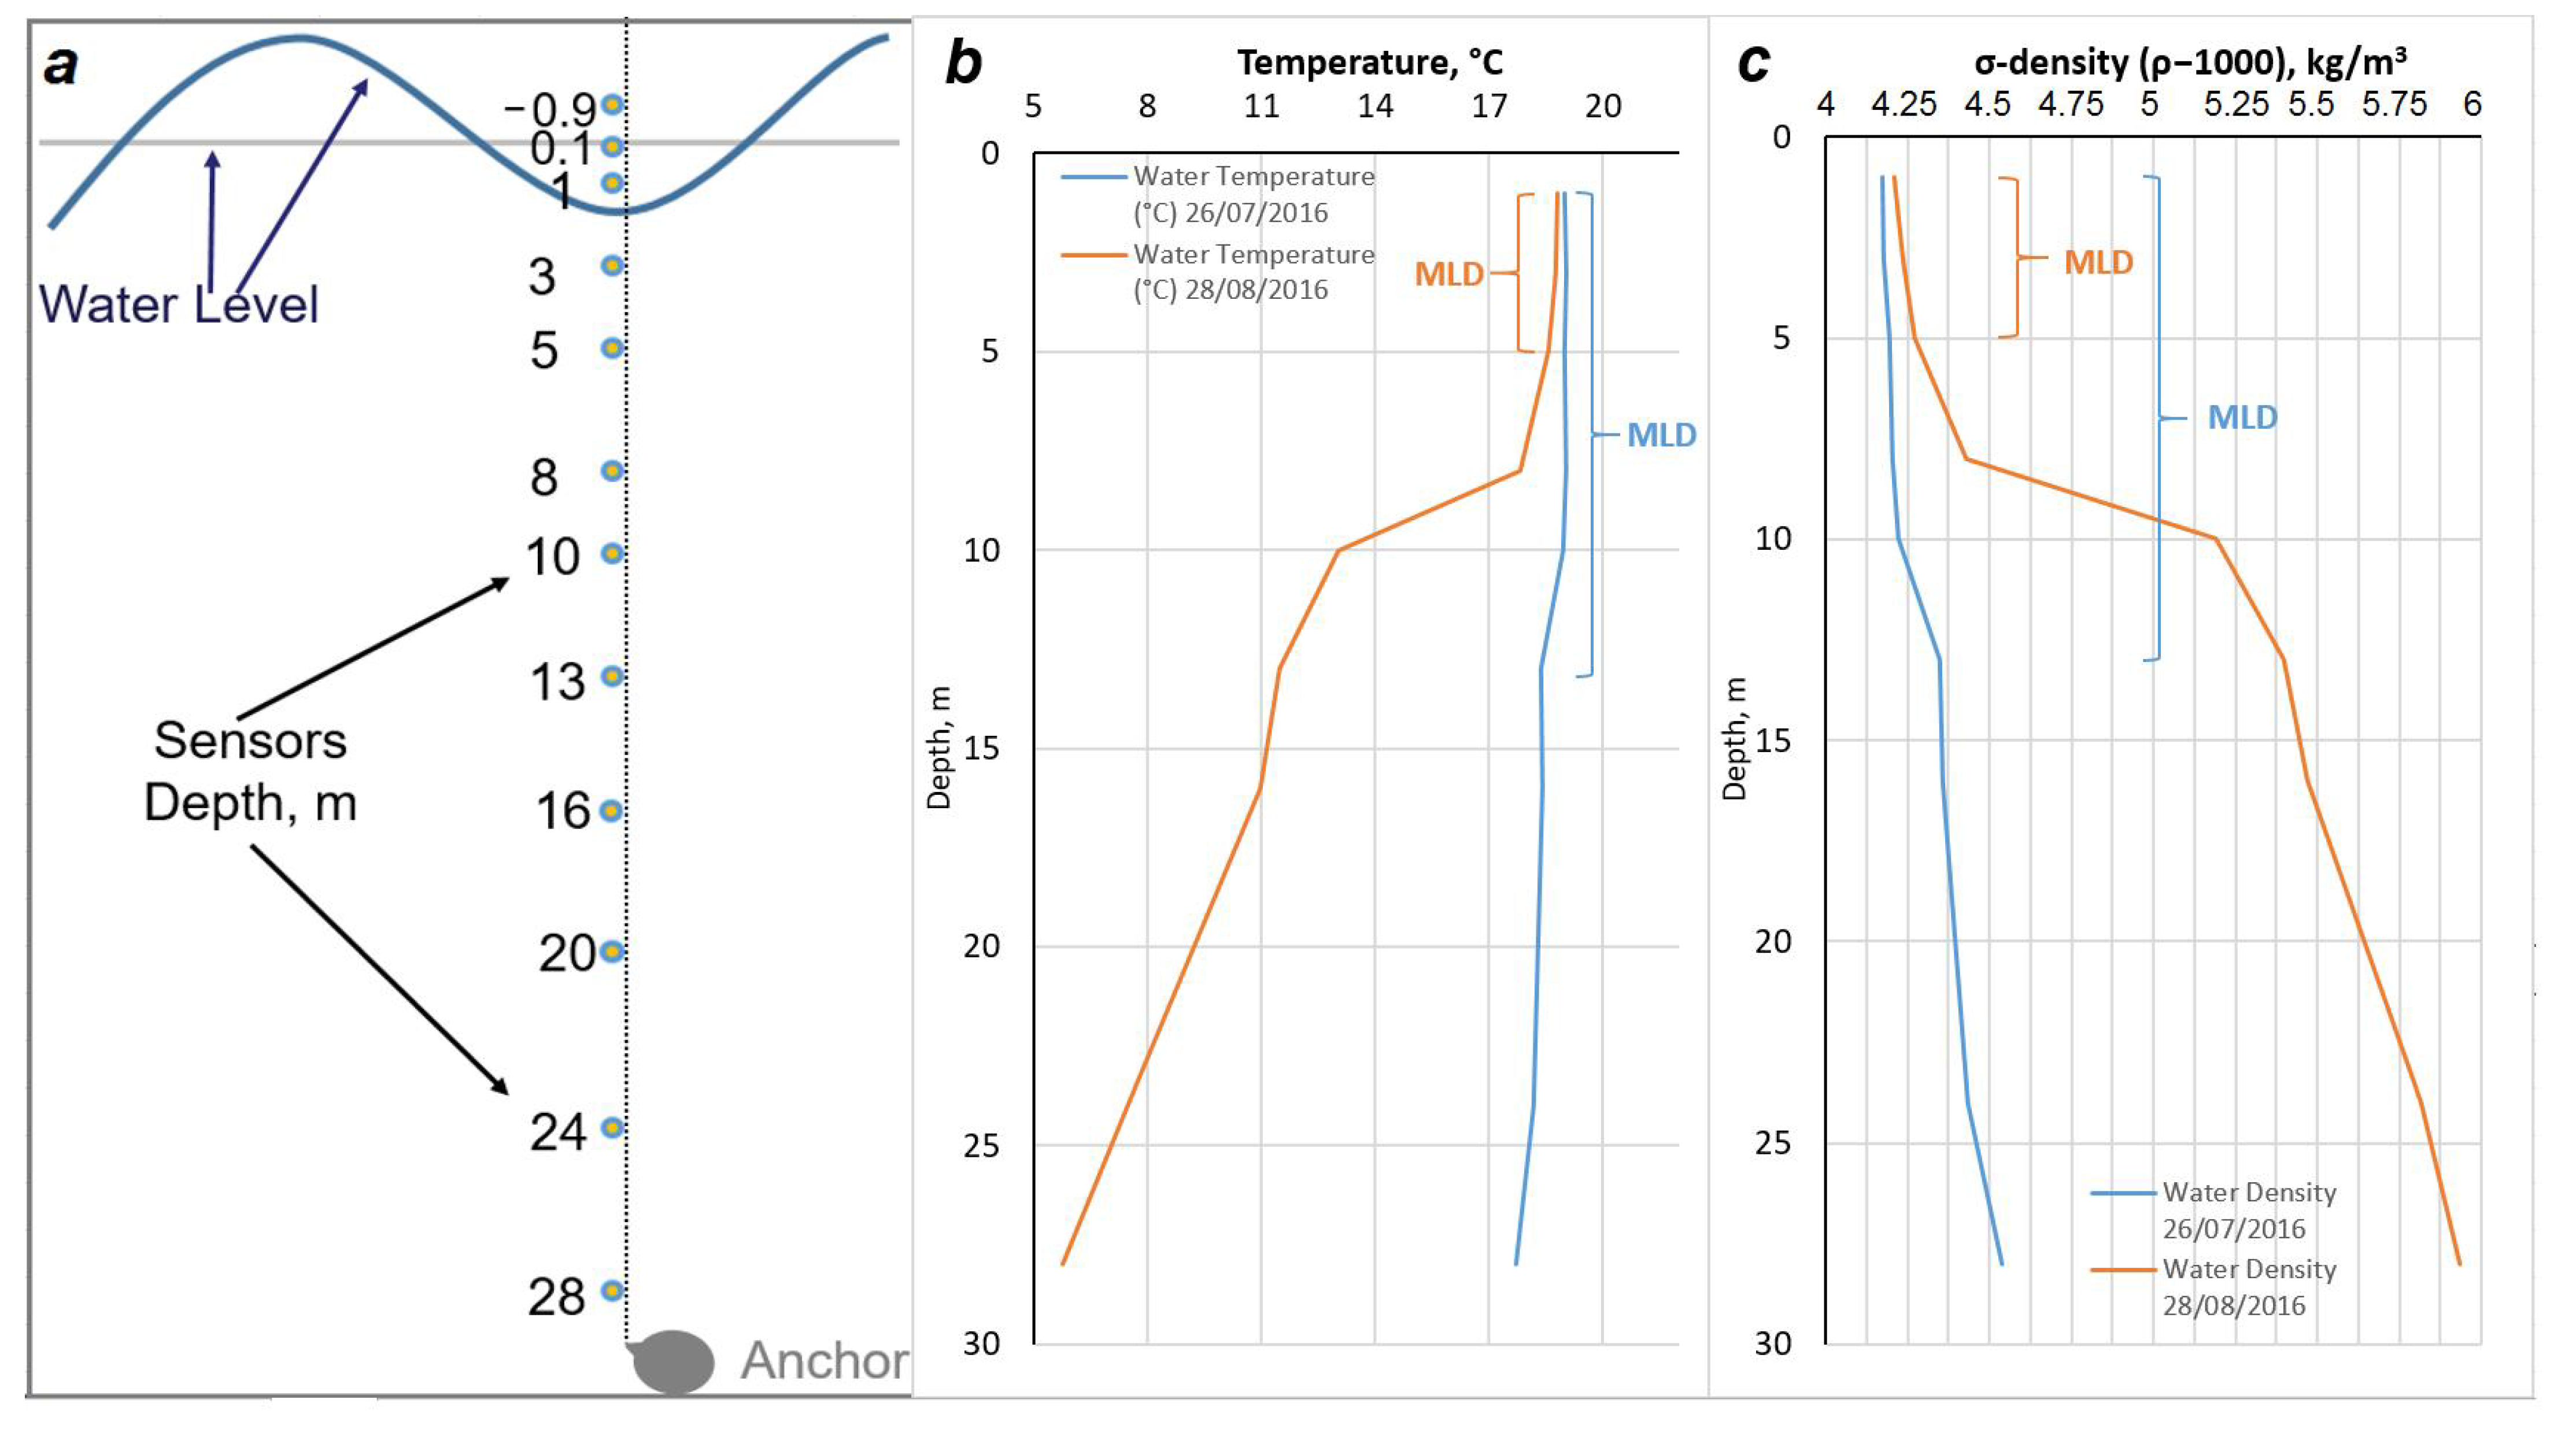
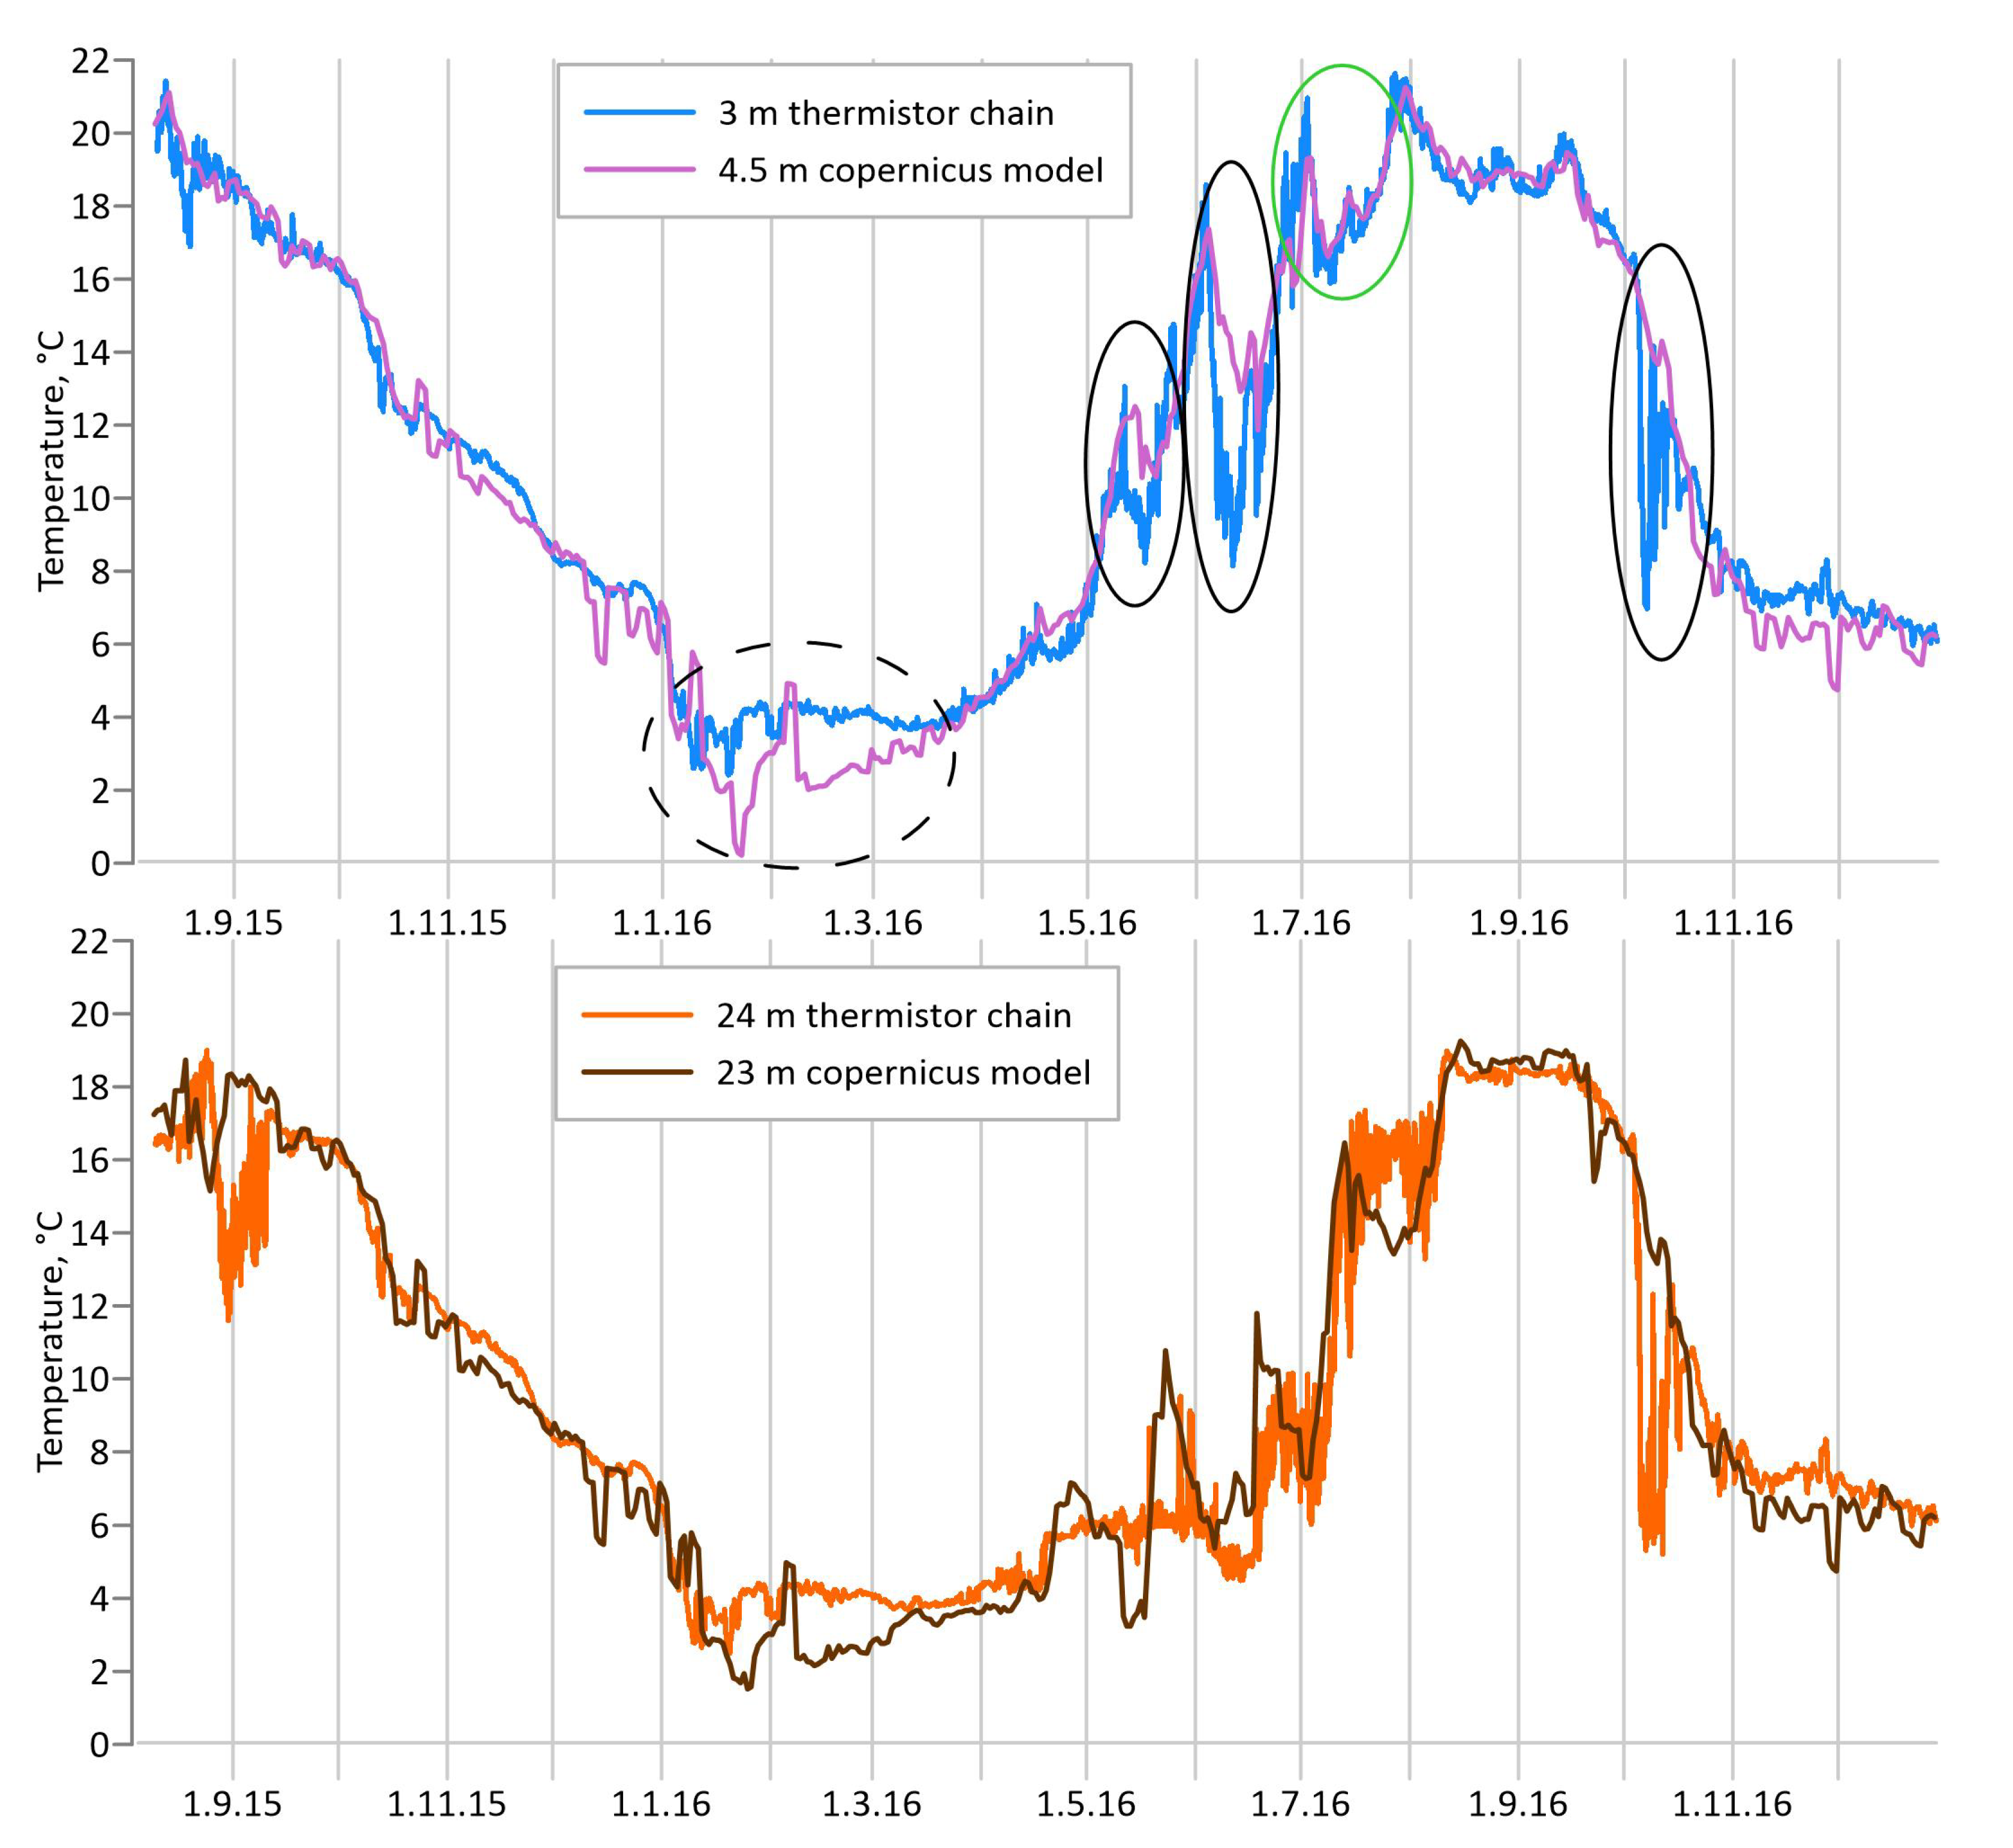
2.1. Thermistor Chain Data
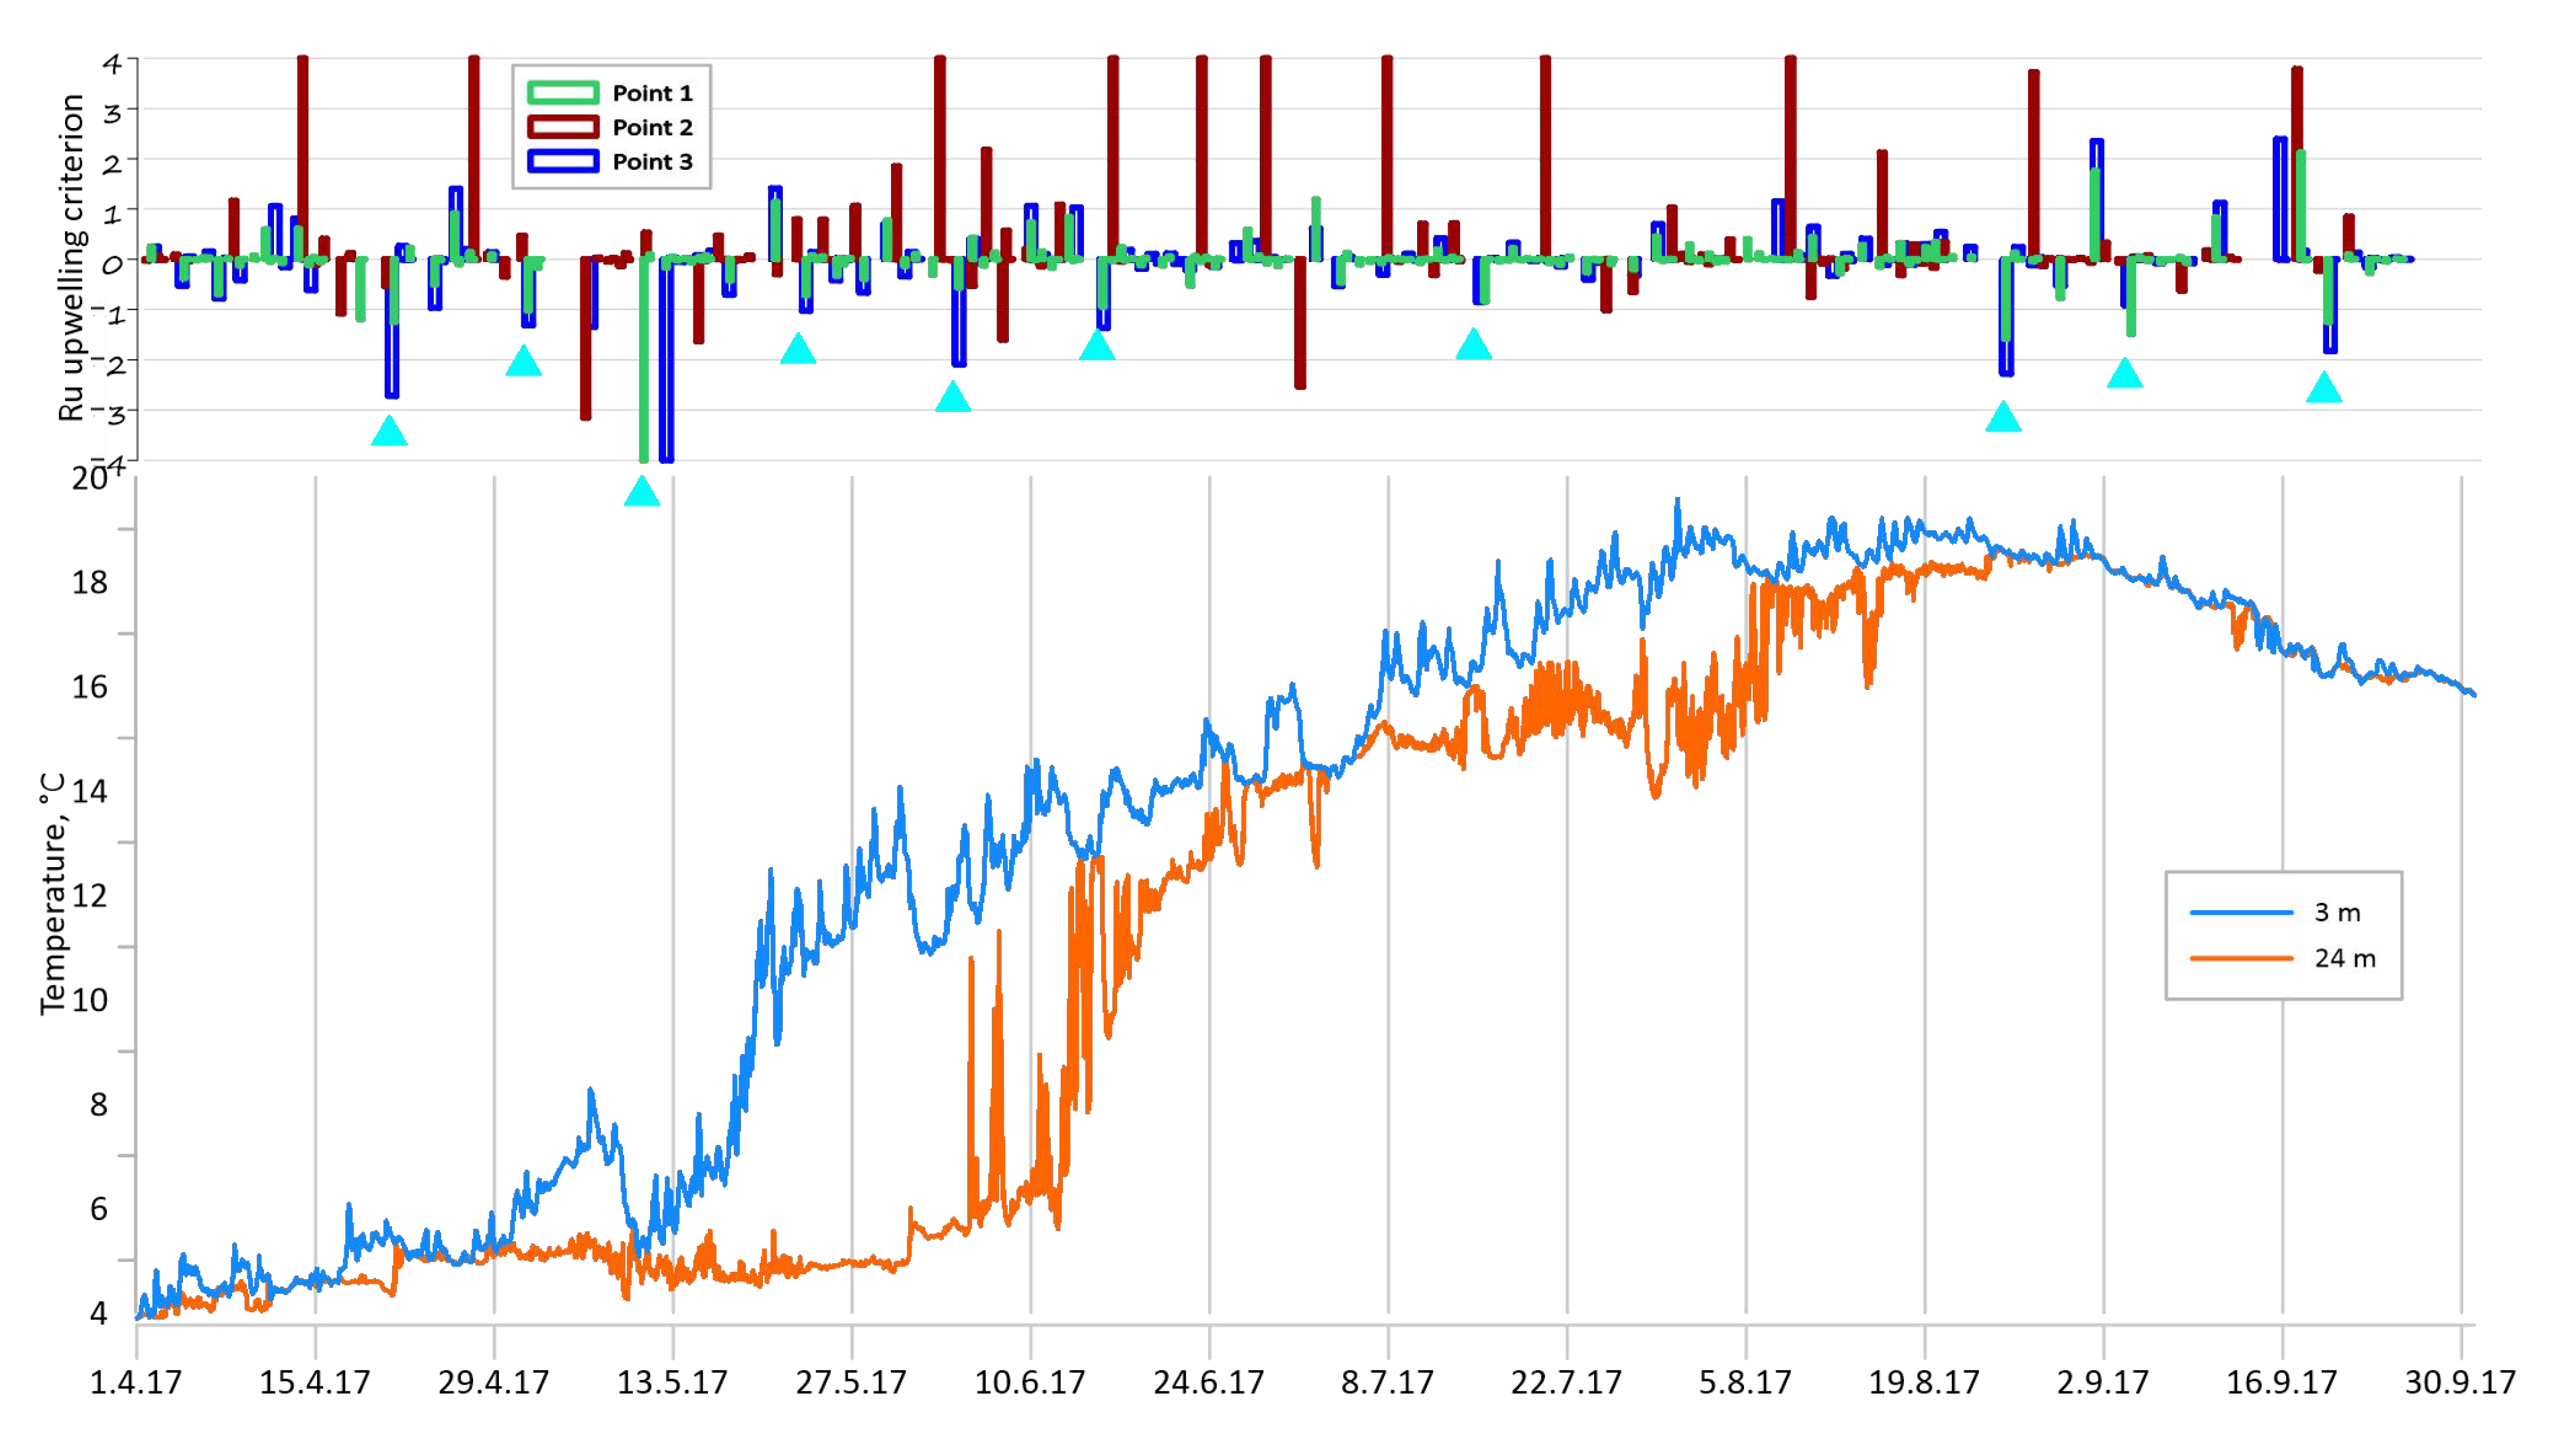
2.2. Upwelling Criterion Calculation
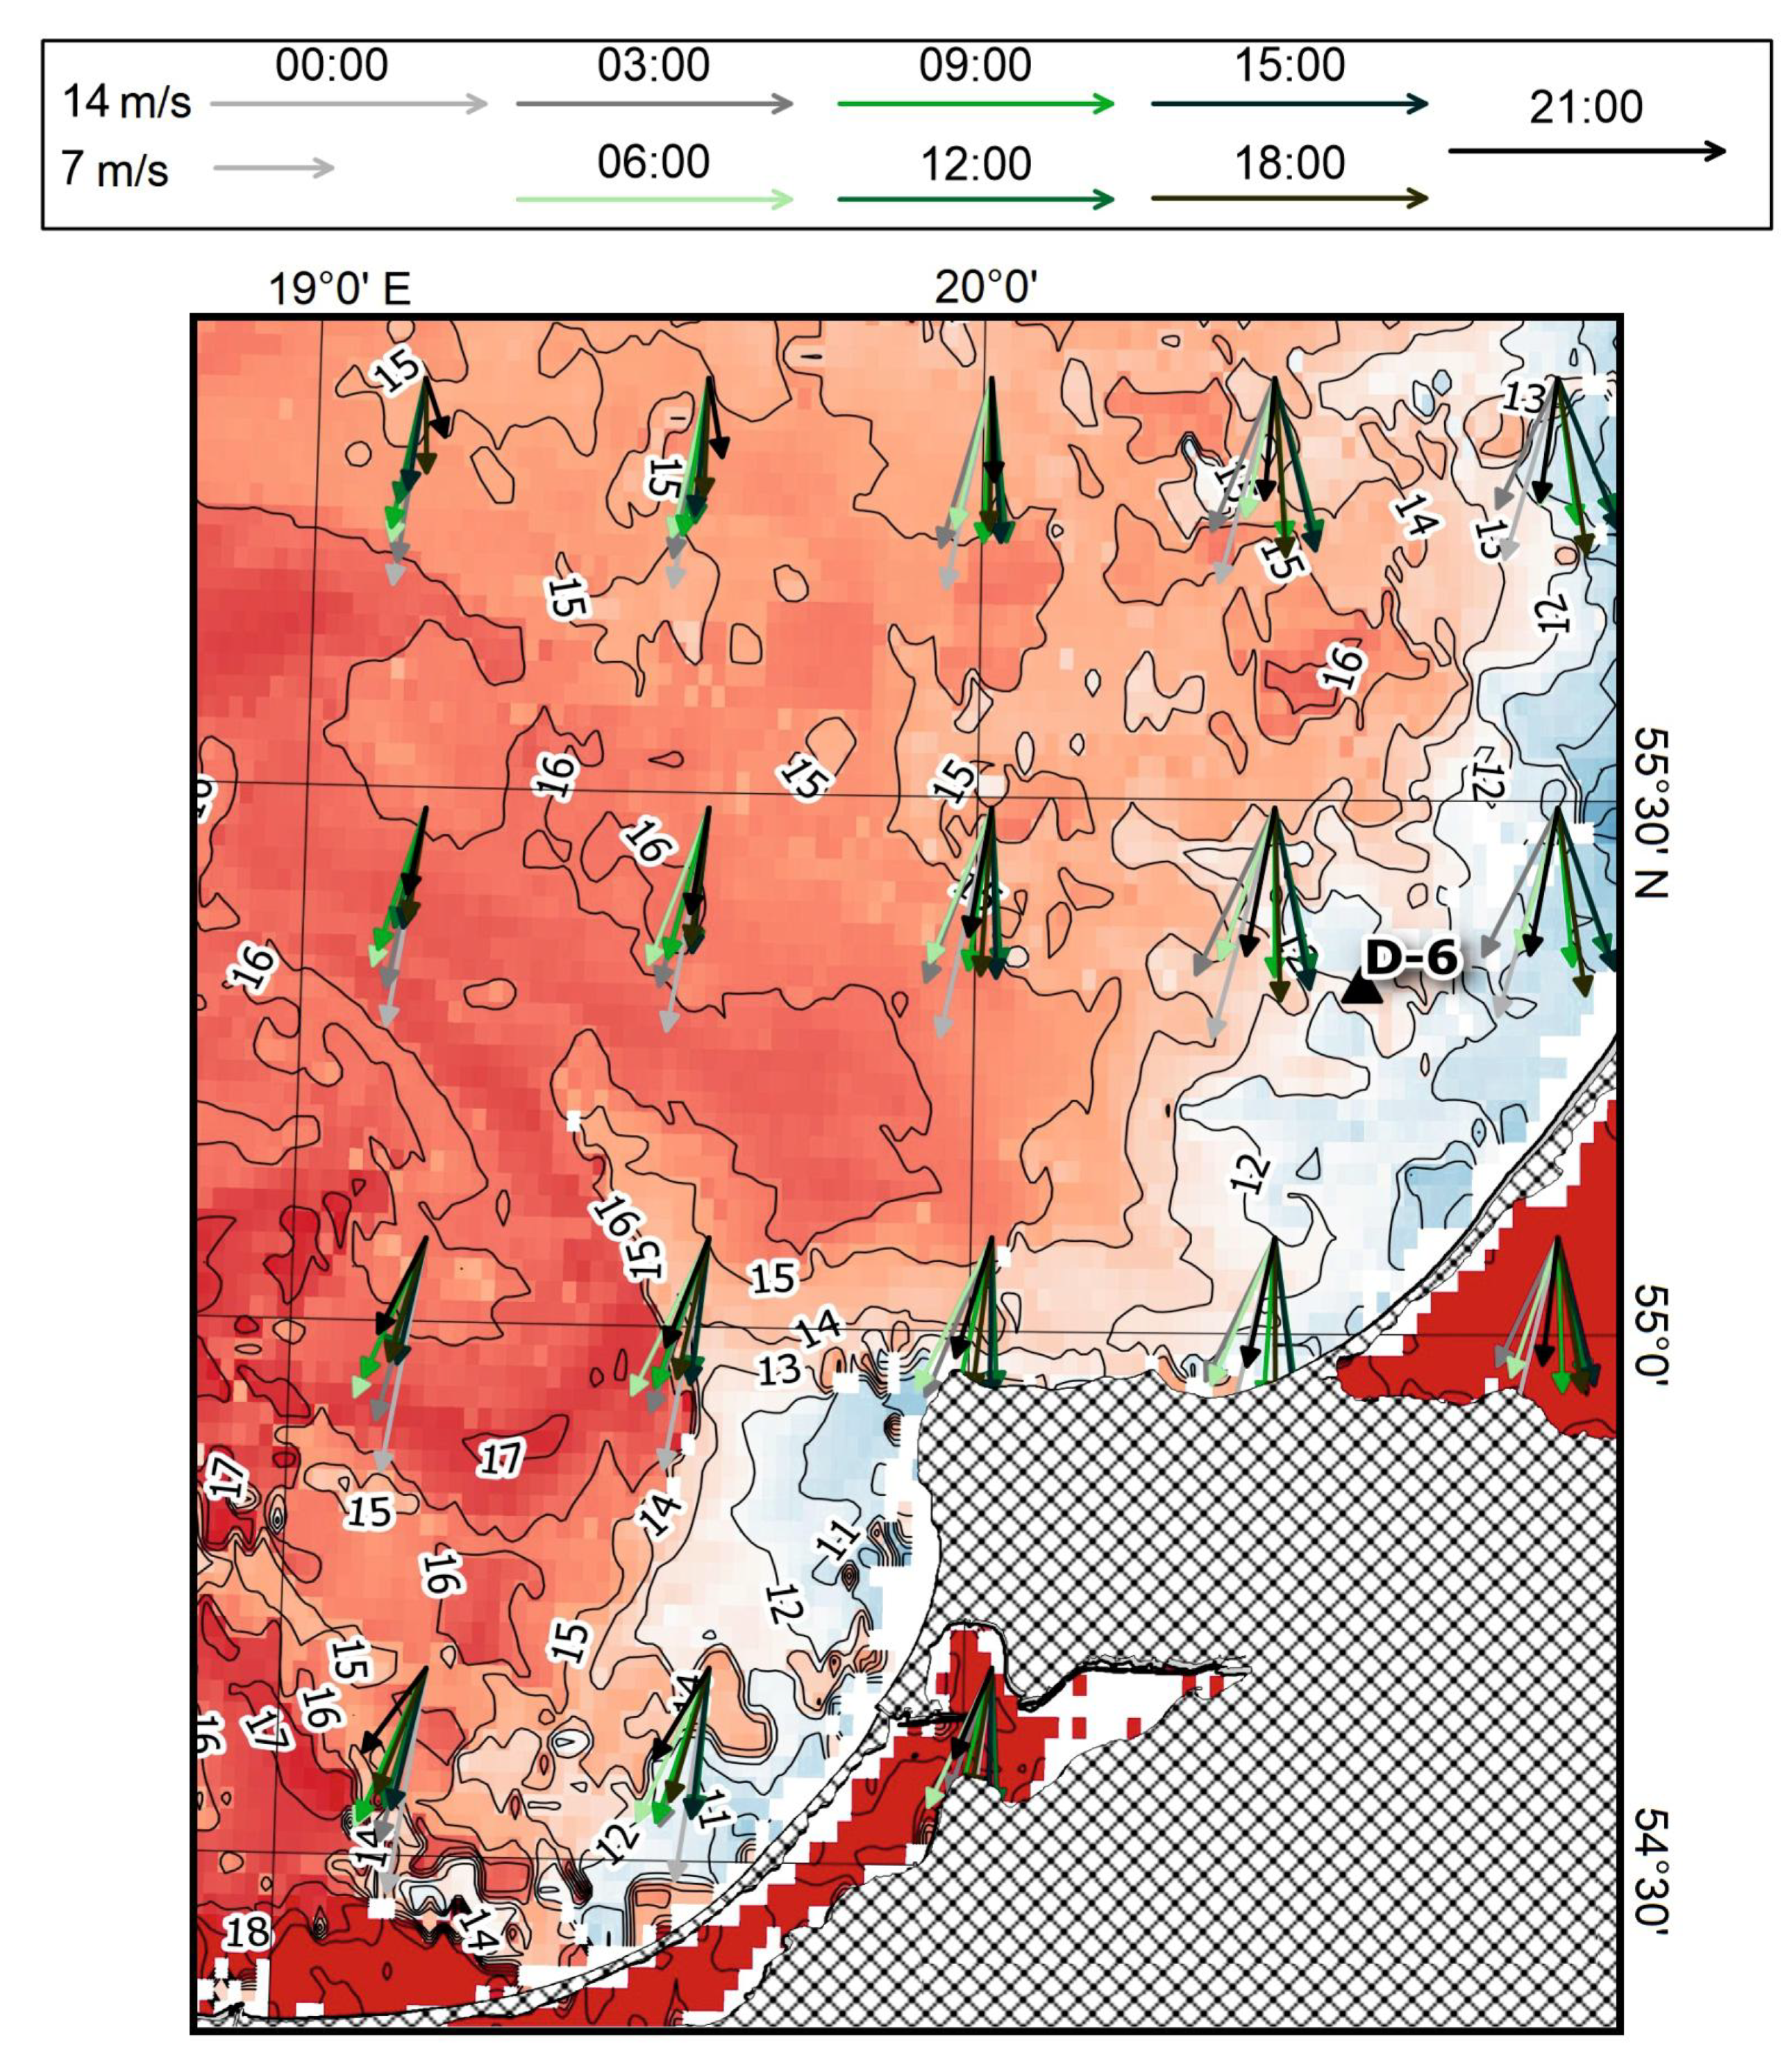
2.3. Satellite Data
2.4. Model Data
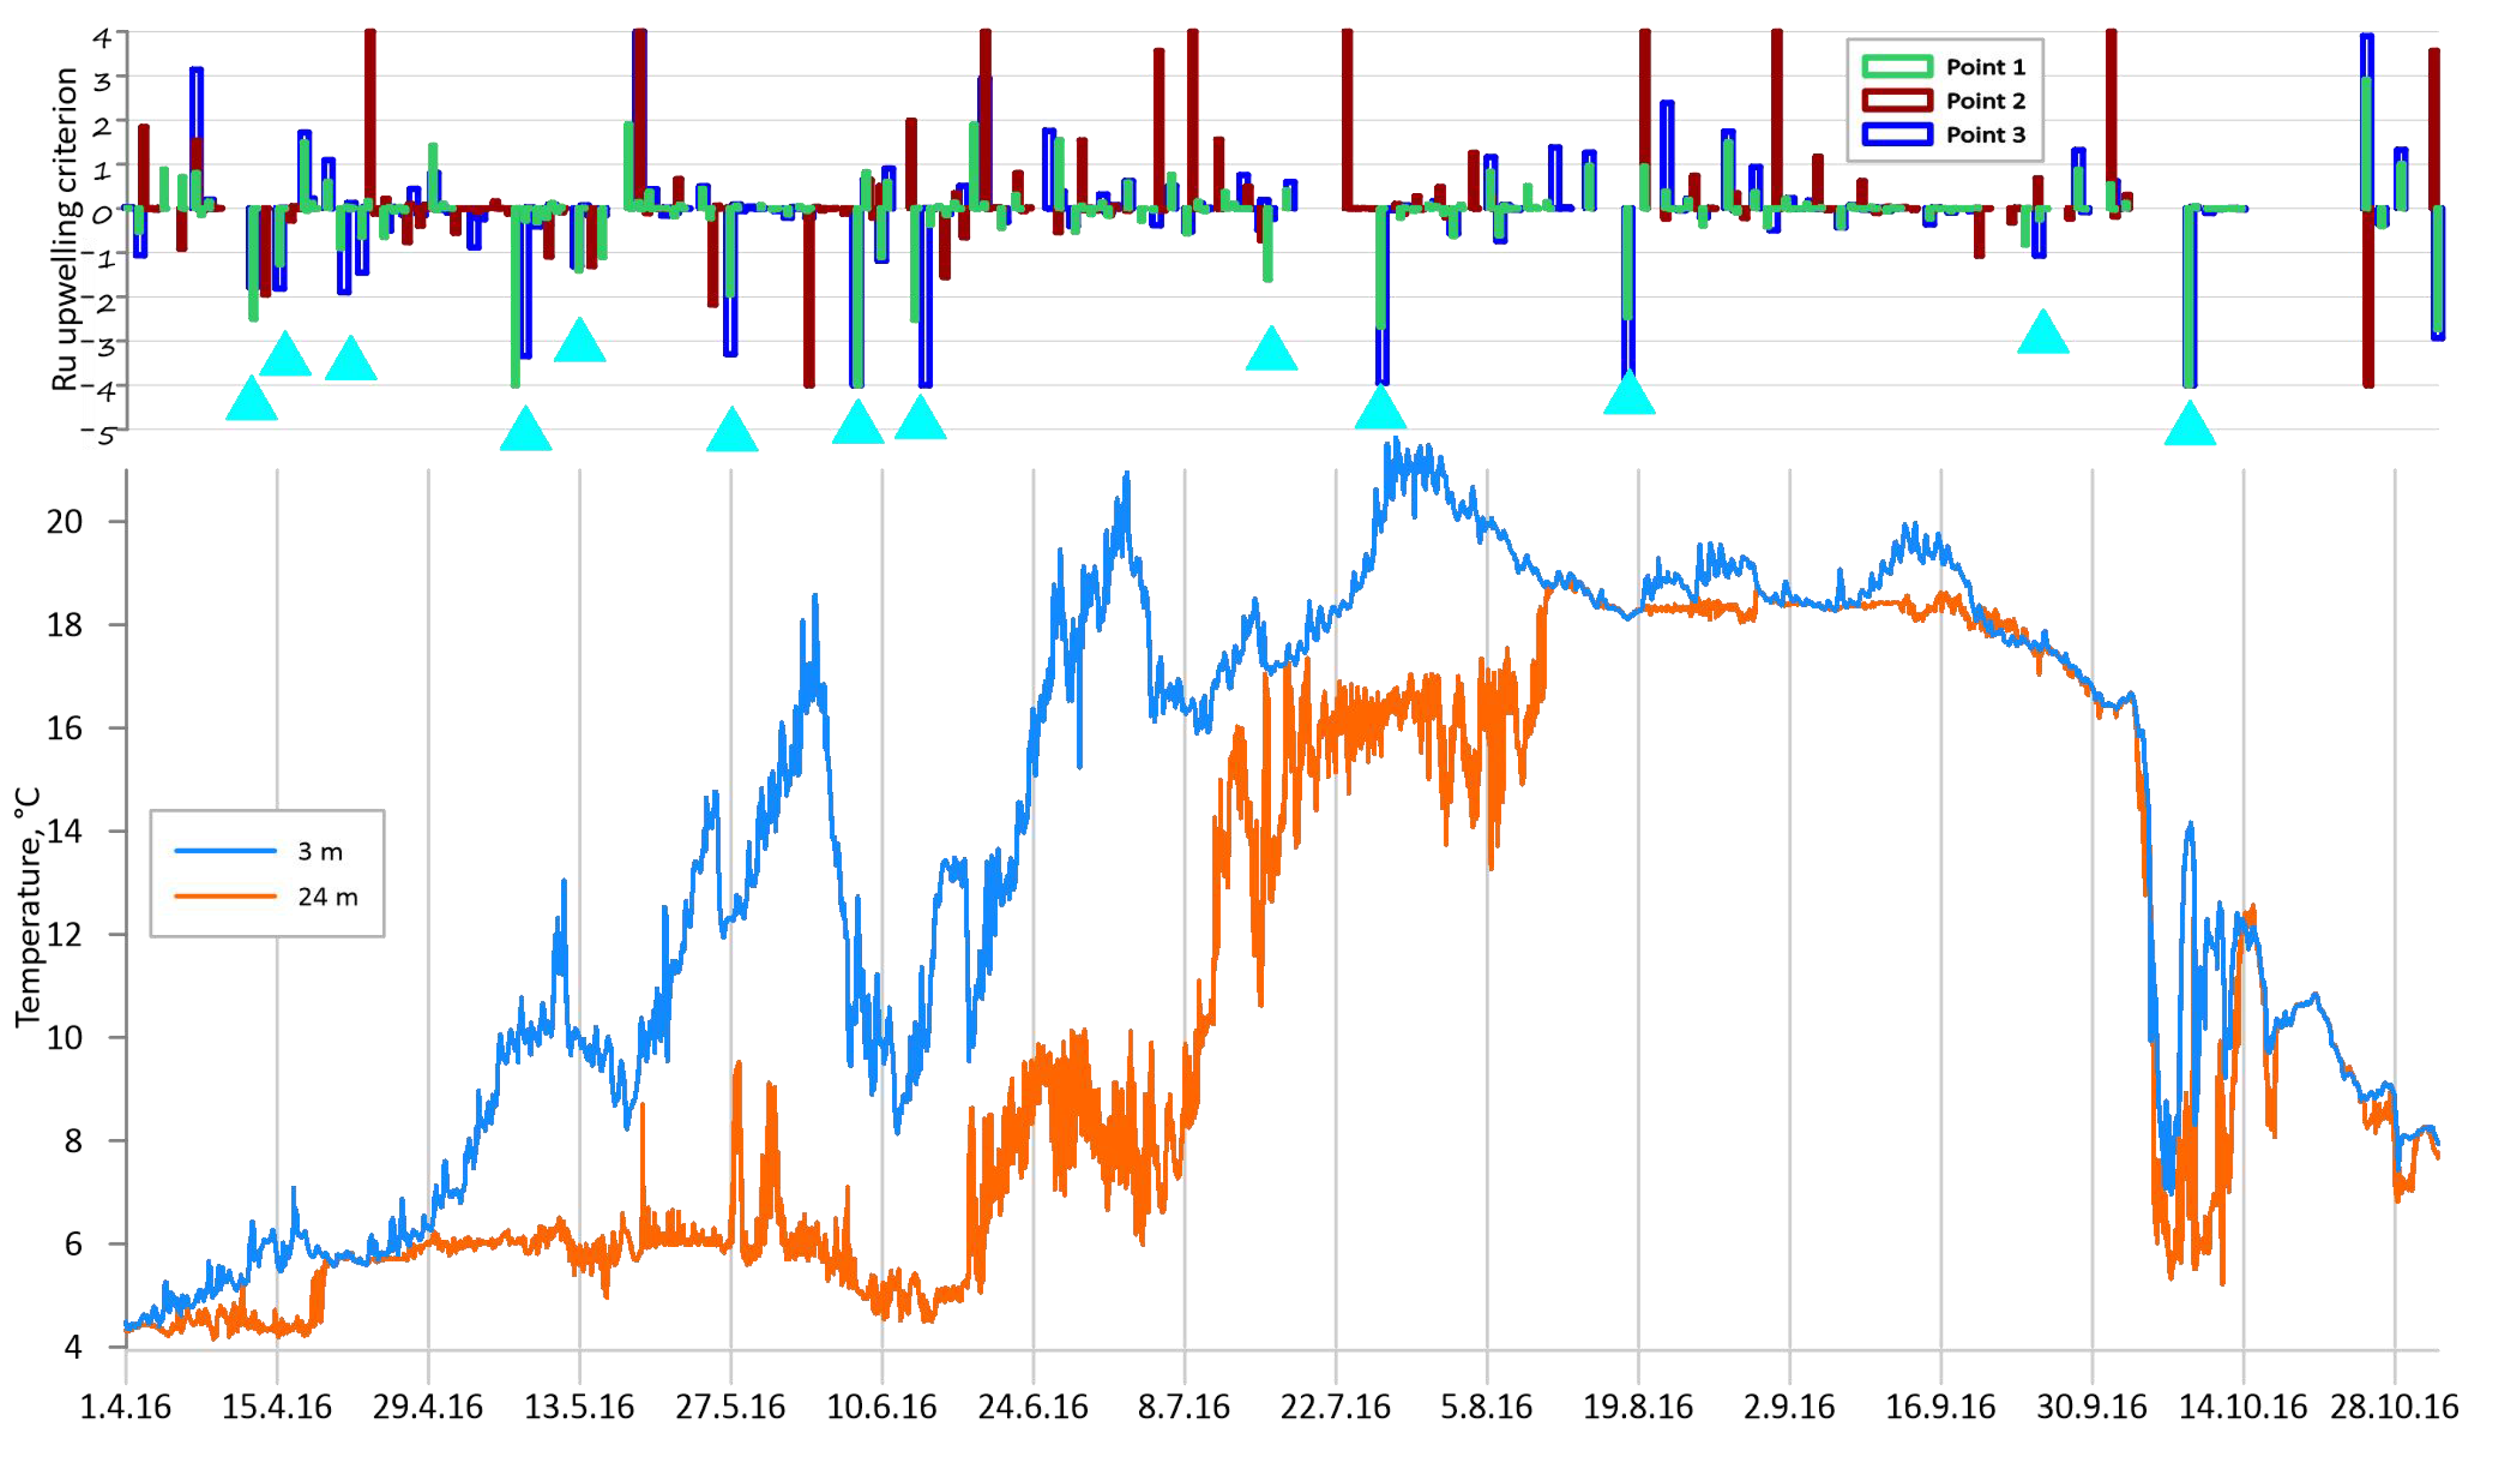
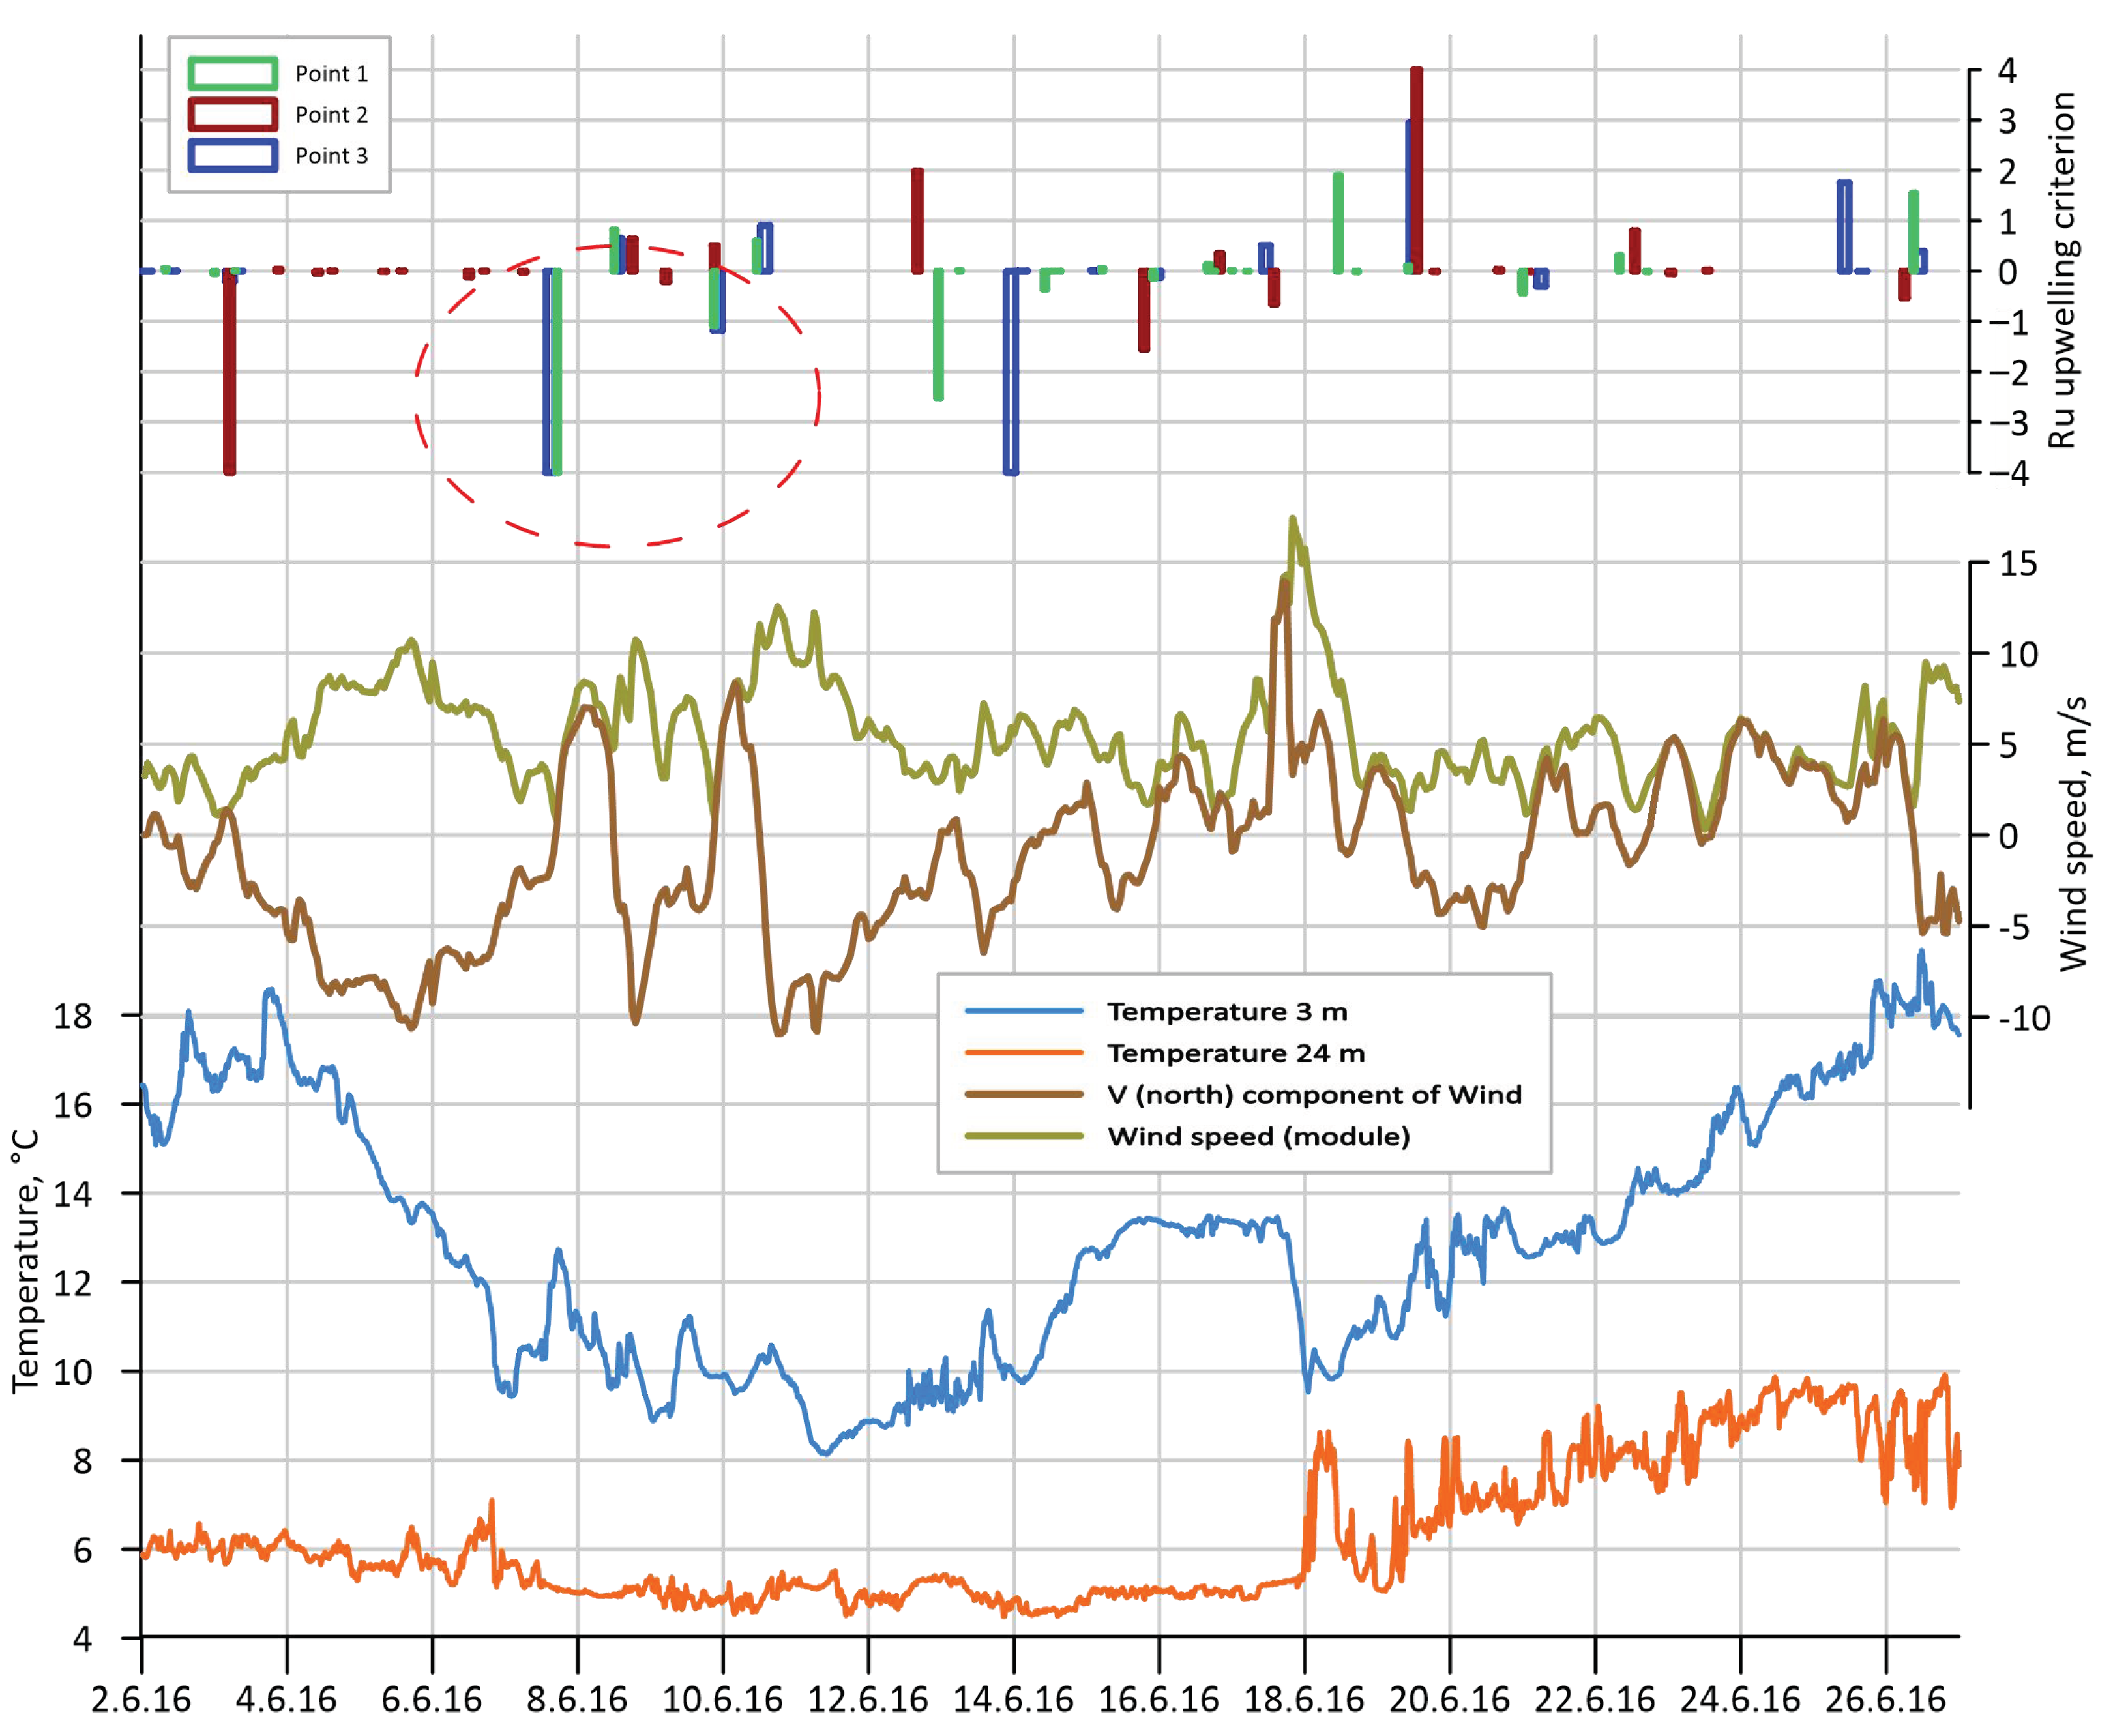
3. Results
4. Discussion
5. Conclusions
Author Contributions
Funding
Institutional Review Board Statement
Informed Consent Statement
Data Availability Statement
Acknowledgments
Conflicts of Interest
References
- Kahru, M.; Hakansson, B.; Rud, O. Distribution of the sea-surface temperature fronts in the Baltic Sea derived from satellite imagery. Cont. Shelf Res. 1995, 15, 663–679. [Google Scholar] [CrossRef]
- Esiukova, E.; Chubarenko, I.; Stont, Z. Upwelling or Differential Cooling? Analysis of Satellite SST Images of the Southeastern Baltic Sea. Water Resour. 2017, 44, 69–77. [Google Scholar] [CrossRef]
- Kowalewski, M.; Ostrowski, M. Coastal up-and downwelling in the southern Baltic. Oceanologia 2005, 47, 435–475. [Google Scholar]
- Bednorz, E.; Półrolniczak, M.; Czernecki, B.; Tomczyk, A.M. Atmospheric forcing of coastal upwelling in the southern Baltic Sea basin. Atmosphere 2019, 10, 327. [Google Scholar] [CrossRef] [Green Version]
- Bednorz, E.; Półrolniczak, M.; Tomczyk, A.M. Regional circulation patterns inducing coastal upwelling in the Baltic Sea. Theor. Appl. Climatol. 2021, 144, 905–916. [Google Scholar] [CrossRef]
- Krechik, V.; Myslenkov, S.; Kapustina, M. New possibilities in the study of coastal upwellings in the southeastern Baltic sea with using thermistor chain. Geogr. Environ. Sustain. 2019, 12, 44–61. [Google Scholar] [CrossRef] [Green Version]
- Jurkin, V.; Kelpšaitė, L. Upwelling by the Lithuanian coast: Numerical prediction using GIS methods. In Proceedings of the 2012 IEEE/OES Baltic International Symposium (BALTIC), Klaipeda, Lithuania, 2 February 2012; pp. 1–5. [Google Scholar]
- Lehmann, A.; Myrberg, K.; Höflich, K. A statistical approach to coastal upwelling in the Baltic Sea based on the analysis of satellite data for 1990–2009. Oceanologia 2012, 54, 369–393. [Google Scholar] [CrossRef] [Green Version]
- Kowalewski, M. The influence of the hel upwelling (Baltic Sea) on nutrient concentrations and primary production—the results of an ecohydrodynamic model. Oceanologia 2005, 47, 567–590. [Google Scholar]
- Vahtera, E.; Laanemets, J.; Pavelson, J.; Huttunen, M.; Kononen, K. Effect of upwelling on the pelagic environment and bloom-forming cyanobacteria in the western Gulf of Finland, Baltic Sea. J. Mar. Syst. 2005, 58, 67–82. [Google Scholar] [CrossRef]
- Kuvaldina, N.; Lips, I.; Lips, U.; Liblik, T. The influence of a coastal upwelling event on chlorophyll a and nutrient dynamics in the surface layer of the Gulf of Finland, Baltic Sea. Hydrobiologia 2010, 639, 221–230. [Google Scholar] [CrossRef]
- Siegel, H.; Gerth, M.; Neumann, T.; Doerffer, R. Case studies on phytoplankton blooms in coastal and open waters of the Baltic Sea using Coastal Zone Color Scanner data. Int. J. Remote Sens. 1999, 20, 1249–1264. [Google Scholar] [CrossRef]
- Bychkova, I.; Viktorov, S. Use of satellite data for identification and classification of upwelling in the Baltic Sea. Oceanology 1987, 27, 158–162. [Google Scholar]
- Gidhagen, L. Coastal upwelling in the Baltic Sea. Satellite and in situ measurements of sea-surface temperatures indicating coastal upwelling. Estuar. Coast. Shelf Sci. 1987, 24, 449–462. [Google Scholar] [CrossRef]
- Zhang, S.; Wu, L.; Arnqvist, J.; Hallgren, C.; Rutgersson, A. Mapping coastal upwelling in the Baltic Sea from 2002 to 2020 using remote sensing data. Int. J. Appl. Earth Obs. Geoinf. 2022, 114, 103061. [Google Scholar] [CrossRef]
- Lehmann, A.; Myrberg, K. Upwelling in the Baltic Sea—A review. J. Mar. Syst. 2008, 74, S3–S12. [Google Scholar] [CrossRef]
- Dabuleviciene, T.; Kozlov, I.; Vaiciute, D.; Dailidiene, I. Remote sensing of coastal upwelling in the south-eastern Baltic Sea: Statistical properties and implications for the coastal environment. Remote Sens. 2018, 10, 1752. [Google Scholar] [CrossRef] [Green Version]
- Kapustina, M.V.; Zimin, A.V. Upwelling spatiotemporal characteristics in the southeastern Baltic Sea in 2010–2019. Fundam. Appl. Hydrophys. 2021, 14, 52–63. (In Russian) [Google Scholar]
- Gurova, E.; Lehmann, A.; Ivanov, A. Upwelling dynamics in the Baltic Sea studied by a combined SAR/infrared satellite data and circulation model analysis. Oceanologia 2013, 55, 687–707. [Google Scholar] [CrossRef] [Green Version]
- Kozlov, I.E.; Kudryavtsev, V.N.; Johannessen, J.A.; Chapron, B.; Dailidiene, I.; Myasoedov, A.G. ASAR Imaging for coastal upwelling in the Baltic sea. Adv. Space Res. 2012, 50, 1125–1137. [Google Scholar] [CrossRef]
- Kręzel, A.; Szymanek, L.; Kozłowski, Ł.; Szymelfenig, M. Influence of coastal upwelling on chlorophyll a concentration in the surface water along the Polish coast of the Baltic Sea. Oceanologia 2005, 47, 433–452. [Google Scholar]
- Krek, A.V.; Krek, E.V.; Danchenkov, A.R.; Krechik, V.A.; Kapustina, M.V. The role of upwellings in the coastal ecosystem of the Southeastern Baltic Sea. Reg. Stud. Mar. Sci. 2021, 44, 101707. [Google Scholar] [CrossRef]
- Suursaar, U. Combined impact of summer heat waves and coastal upwelling in the Baltic Sea. Oceanologia 2020, 62, 511–524. [Google Scholar] [CrossRef]
- Ulyanova, M.O.; Sivkov, V.V.; Bashirova, L.D.; Kapustina, M.V.; Bubnova, E.S.; Danchenkov, A.R.; Ezhova, E.E.; Krechik, V.A.; Eremina, T.R. Oceanological Research of the Baltic Sea in the 51st Cruise of the PV Akademik Sergey Vavilov (June–July 2021). Oceanology. 2022, 62, 578–580. [Google Scholar] [CrossRef]
- Sivkov, V.V.; Ulyanova, M.O.; Kapistina, M.V.; Bubnova, E.S.; Dorokhov, D.V.; Krechik, V.A.; Dudkov, I.Y.; Dvoeglazova, N.V. Integrated Research of the Southern Part of the Baltic Sea in the 49th Cruise of the Academik Sergey Vavilov. Oceanology 2020, 60, 567–569. [Google Scholar] [CrossRef]
- Kowalewska-Kalkowska, H.; Kowalewski, M. Combining Satellite Imagery and Numerical Modelling to Study the Occurrence of Warm Upwellings in the Southern Baltic Sea in Winter. Remote Sens. 2019, 11, 2982. [Google Scholar] [CrossRef]
- Golenko, N.N.; Golenko, M.N.; Shchuka, S.A. Observation and modeling of upwelling in the southeastern Baltic. Oceanology 2009, 49, 15–21. [Google Scholar] [CrossRef]
- Nowicki, A.; Janecki, M.; Dzierzbicka-Głowacka, L. Operational system for automatic coastal upwelling detection in the Baltic Sea based on the 3D CEMBS model. J. Oper. Oceanogr. 2019, 12, 104–115. [Google Scholar] [CrossRef]
- Stepanova, N.; Mizyuk, A. Tracking the formation of the gradient part of the southeastern Baltic Sea cold intermediate layer. Russ. J. Earth Sci. 2020, 20, ES3005. [Google Scholar] [CrossRef]
- Myslenkov, S.A.; Krechik, V.A.; Bondar, A.V. Daily and seasonal water temperature changes in the coastal zone of the Baltic Sea measured by thermistor chain. Ecol. Syst. Devices. 2017, 5, 25–33, (In Russian with English summary). [Google Scholar]
- Myslenkov, S.A.; Krechik, V.A.; Soloviev, D.M. Water temperature analysis in the coastal zone of the Baltic Sea based on thermistor chain observations and satellite data. Proc. Hydrometcentre Russ. 2017, 364, 159–169, (In Russian with English summary). [Google Scholar]
- Ocherednik, V.; Baranov, V.; Zatsepin, A.; Kyklev, S. Thermochains of the Southern Branch, Shirshov Institute of Oceanology, Russian Academy of Sciences: Design, Methods, and Results of Metrological Investigations of Sensors. Oceanology 2018, 58, 661–671. [Google Scholar] [CrossRef]
- Silvestrova, K.P.; Zatsepin, A.G.; Myslenkov, S.A. Coastal upwelling in the Gelendzhik area of the Black Sea: Effect of wind and dynamics. Oceanology 2017, 57, 469–477. [Google Scholar] [CrossRef]
- Ocherednik, V.V.; Zatsepin, A.G.; Kuklev, S.B.; Baranov, V.I.; Mashura, V.V. Examples of approaches to studying the temperature variability of black sea shelf waters with a cluster of temperature sensor chains. Oceanology 2020, 60, 149–160. [Google Scholar] [CrossRef]
- Silvestrova, K.; Myslenkov, S.; Zatsepin, A. Variability of Wind-Driven Coastal Upwelling in the North-Eastern Black Sea in 1979–2016 According to NCEP/CFSR Data. Pure Appl. Geophys. 2018, 175, 4007–4015. [Google Scholar] [CrossRef]
- Bakun, A. Coastal Upwelling Indices, West Coast of North America, 1946–1971; U.S. Department of Commerce NOAA Technical Report NMFS-SSRF: Seattle, WA, USA, 1973; pp. 1–103. [Google Scholar]
- Gonzalez-Nuevo, G.; Gago, J.; Cabanas, J.M. Upwelling index: A powerful tool for marine research in the NW Iberian upwelling system. J. Oper. Oceanogr. 2014, 7, 47–57. [Google Scholar] [CrossRef]
- BALTICSEA_REANALYSIS_PHY_003_011//Quality. Information Document.—2019. —P. 4. 5. Available online: https://catalogue.marine.copernicus.eu/documents/QUID/CMEMS-BAL-QUID-003-011.pdf (accessed on 10 December 2022).
- Stont, Z.I.; Bukanova, T.V. General features of air temperature over coastal waters of the south-eastern Baltic Sea for 2004–2017. Russ. J. Earth. Sci. 2019, 19, ES3001. [Google Scholar] [CrossRef]
- Monterey, G.; Levitus, S. Seasonal Variability of Mixed Layer Depth for the World Ocean. In NOAA Atlas NESDIS; National Oceanic and Atmospheric Administration: Silver Spring, MD, USA, 1997; Volume 14, p. 100. [Google Scholar]
- Kapustina, M.V.; Krechik, V.A.; Gritsenko, V.A. Seasonal variations in the vertical structure of temperature and salinity fields in the shallow Baltic Sea off the Kaliningrad Region coast. Russ. J. Earth. Sci. 2017, 17, ES1004. [Google Scholar] [CrossRef]
- Sivkov, V.V.; Kadzhoyan, Y.S.; Pichuzhkina, O.Y.; Feldman, V.N. Oil and Environment of the Kaliningrad Region; Terra Baltika: Kaliningrad, Russia, 2012. (In Russian) [Google Scholar]
- Demidov, A.N.; Koltovskaya, E.V.; Kulikov, M.E. Long-term changes of thermohaline characteristics of the Baltic Sea. Vestn. Mosk. Univ. Seriya 5 Geogr. 2018, 4, 49–56. (In Russian) [Google Scholar]
- Saha, S.; Moorthi, S.; Wu, X.; Wang, J.; Nadiga, S.; Tripp, P.; Behringer, D.; Hou, Y.T.; Chuang, H.Y.; Iredell, M.; et al. The NCEP Climate Forecast System version 2. J. Clim. 2014, 27, 2185–2208. [Google Scholar] [CrossRef]
- Osinski, R.; Rak, D.; Walczowski, W.; Jan, P. Baroclinic Rossby radius of deformation in the southern Baltic Sea. Oceanologia 2010, 52, 417–429. [Google Scholar] [CrossRef] [Green Version]
- Kurkin, A.; Kurkina, O.; Rybin, A.; Talipova, T. Comparative analysis of the first baroclinic Rossby radius in the Baltic, Black, Okhotsk, and Mediterranean seas. Russ. J. Earth Sci. 2020, 20, ES4008. [Google Scholar] [CrossRef]
- CMEMS Baltic Sea the DMI Sea Surface Temperature Reprocessed L3S. Available online: https://doi.org/10.48670/moi-00312 (accessed on 10 December 2022). [CrossRef]
- Høyer, J.L.; Le Borgne, P.; Eastwood, S. A bias correction method for Arctic satellite sea surface temperature observations. Remote Sens. Environ. 2014, 146, 201–213. [Google Scholar] [CrossRef]
- CMEMS: Baltic Sea Physics Reanalysis, CMEMS [Data Set]. 2022. Available online: https://doi.org/10.48670/moi-00013 (accessed on 10 December 2022). [CrossRef]
- Stepanova, N.B.; Shchuka, S.A.; Chubarenko, I.P. Structure and evolution of the cold intermediate layer in the southeastern part of the Baltic Sea by the field measurement data of 2004–2008. Oceanology 2015, 55, 25–35. [Google Scholar] [CrossRef]
- Leppäranta, M.; Myrberg, K. Physical Oceanography of the Baltic Sea; Springer, Praxis Publishing: Chichester, UK, 2008; p. 370. [Google Scholar]
- Abrahams, A.; Schlegel, R.W.; Smit, A.J. Albertus Variation and Change of Upwelling Dynamics Detected in the World’s Eastern Boundary Upwelling Systems. Front. Mar. Sci. 2021, 8, 626411. [Google Scholar] [CrossRef]
- Bonino, G.; Di Lorenzo, E.; Masina, S.; Iovino, D. Interannual to decadal variability within and across the major Eastern Boundary Upwelling Systems. Sci. Rep. 2019, 9, 19949. [Google Scholar] [CrossRef]


| Date | Upwelling Criterion (Point 1/Point 3) | Sub-Surface Temperature Changes (Negative Values Indicate a Decrease), °C | Agreement with Temperature Data | Duration of the Event, Hours (Point 1/Point 3) |
|---|---|---|---|---|
| 11.08.2015 | −0.9/−0.9 | −0.4 | poor | 64/60 |
| 14.08.2015 | −0.1/−1.2 | −2.2 | good | 66/70 |
| 09.09.2015 | −1.8/−1.8 | −0.5 | poor | 72/70 |
| 12.04.2016 | −2.5/−1.8 | +0.2 | bad | 99/86 |
| 15.04.2016 | −1.3/−1.8 | −0.7 | poor | 52/57 |
| 20/21.04.2016 | −0.9/−1.9 | 0 | poor | 28/35 |
| 07.05.2016 | −4.3/−3.3 | +0.6 | bad | 141/92 |
| 12.05.2016 | −1.4/−1.3 | −3.1 | good | 40/34 |
| 26.05.2016 | −1.9/−3.3 | −2.6 | good | 42/60 |
| 07.06.2016 | −4.5/−6.1 | −8.7 | good | 106/103 |
| 12/13.06.2016 | −2.6/−5.4 | −2.4 | good | 60/80 |
| 15.07.2016 | −1.6/−0.5 | −1.4 | moderate | 36/19 |
| 26.07.2016 | −2.7/−4.0 | +2.4 | bad | 210/204 |
| 17.08.2016 | −2.5/−4.6 | 0.0 | bad | 84/85 |
| 25.09.2016 | −0.3/−1.1 | +0.1 | bad | 26/137 |
| 08.10.2016 | −4.1/−4.7 | −9.5 | good | 139/144 |
| 20.04.2017 | −1.2/−2.7 | 0.0 | bad | 52/198 |
| 01.05.2017 | −1/−1.3 | +0.6 | bad | 68/62 |
| 06.05.2017 | −/−1.3 | −1.4 | moderate | see next event/113 |
| 10/11.05.2017 | −6.6/−7.3 | −2.8 | good | 190/135 |
| 22.05.2017 | −0.7/−1 | −1.5 | moderate | 57/58 |
| 03.06.2017 | −0.6/−2.1 | −2.7 | good | 47/78 |
| 14.06.2017 | −0.9/−1.4 | +0.7 | bad | 45/51 |
| 14.07.2017 | −0.8/−0.9 | −0.2 | poor | 50/44 |
| Date | Temperature Changes (Negative Values Indicate a Decrease in Temperature) | Upwelling Criterion Point 1/Point 3 | Success of the Criterion Work |
|---|---|---|---|
| 14.08.2015 | −2.2 | −0.1/−1.2 | moderate |
| 18.08.2015 | −2.5 | −0.1/−0.04 | bad |
| 12.05.2016 | −3.1 | −1.4/−1.3 | good |
| 26.05.2016 | −2.6 | −1.9/−3.3 | good |
| 07.06.2016 | −8.7 | −4.5/−6.1 | good |
| 13.06.2016 | −2.4 | −2.6/−5.4 | good |
| 18.06.2016 | −3.4 | change in the wind/1.9 | bad |
| 05.07.2016 | −4.6 | −0.1/−0.4 | bad |
| 08.10.2016 | −9.5 | −4.1/−4.7 | good |
| 10.05.2017 | −2.8 | −6.6/−7.3 | good |
| 21.05.2017 | −3.2 | −0.7/−1 | good |
| 01.06.2017 | −3.0 | −0.6/−2.1 | good |
Disclaimer/Publisher’s Note: The statements, opinions and data contained in all publications are solely those of the individual author(s) and contributor(s) and not of MDPI and/or the editor(s). MDPI and/or the editor(s) disclaim responsibility for any injury to people or property resulting from any ideas, methods, instructions or products referred to in the content. |
© 2023 by the authors. Licensee MDPI, Basel, Switzerland. This article is an open access article distributed under the terms and conditions of the Creative Commons Attribution (CC BY) license (https://creativecommons.org/licenses/by/4.0/).
Share and Cite
Myslenkov, S.; Silvestrova, K.; Krechik, V.; Kapustina, M. Verification of the Ekman Upwelling Criterion with In Situ Temperature Measurements in the Southeastern Baltic Sea. J. Mar. Sci. Eng. 2023, 11, 179. https://doi.org/10.3390/jmse11010179
Myslenkov S, Silvestrova K, Krechik V, Kapustina M. Verification of the Ekman Upwelling Criterion with In Situ Temperature Measurements in the Southeastern Baltic Sea. Journal of Marine Science and Engineering. 2023; 11(1):179. https://doi.org/10.3390/jmse11010179
Chicago/Turabian StyleMyslenkov, Stanislav, Ksenia Silvestrova, Viktor Krechik, and Mariia Kapustina. 2023. "Verification of the Ekman Upwelling Criterion with In Situ Temperature Measurements in the Southeastern Baltic Sea" Journal of Marine Science and Engineering 11, no. 1: 179. https://doi.org/10.3390/jmse11010179