Article

Study on the Surface Interactions of Co(II) with Phospholipids from the Marine Environment

1
Division for Marine and Environmental Research, Ruđer Bošković Institute, Bijenička Street 54, 10000 Zagreb, Croatia
2
Division of Molecular Medicine, Ruđer Bošković Institute, Planinska 1, 10000 Zagreb, Croatia
*
Author to whom correspondence should be addressed.
J. Mar. Sci. Eng. 2022, 10(9), 1261; https://doi.org/10.3390/jmse10091261
Submission received: 19 July 2022 / Revised: 31 August 2022 / Accepted: 3 September 2022 / Published: 7 September 2022
(This article belongs to the Special Issue Biogeochemistry of Trace Elements in the Marine Environment)

Abstract

:
Natural phospholipid (PL)n extract from cultured green algae Dunaliela tertiolecta was used as the main component of cell membranes for studies on the interaction with trace metal Co(II). The phospholipids of the membranes were extracted from other biological components using TiO2-µSPE cartridges selective for the phosphate group according to a completely new protocol. The interaction of Co(II) with natural and standard phospholipids, phosphatidylcholine (PC), phosphatidylethanolamine (PE), and phosphatidylglycerol (PG) are registered only in the presence of the additional chelating ligand 1,10-Phenathroline (Phen). 1,10-Phenathroline, as a model of humic substances in the marine environment, formed a neutral complex with Co(II) by the substitution of water molecules of central metal ions. The interaction of hydrophobic mixed-ligand complexes with phospholipids was enabled by the substitution of the remaining water molecules in the coordination shell of Co(II), which was registered by voltammetric measurements. The Co(II)-Phen-PL complex is reduced from the adsorbed state at −1.65 V by the transfer of two electrons, followed by its irreversible dissociation and desorption, indicating an EC mechanism. The interaction between the mixed-ligand complexes Co(II)-Phen-lipids was confirmed by atomic force microscopy (AFM). AFM images of PL, PL with Phen mixture and PL, Phen with Co(II) showed different 3D structures on the mica surface, indicating changes caused by the interaction between cobalt(II), 1,10-Phenanthroline and phospholipids.

1. Introduction

Interaction with membrane lipids usually involves divalent metals, micronutrients such as Mg2+, Zn2+, Fe2+, Co2+, and Cu2+, which are present in trace amounts in seawater but are very important for certain enzymatic reactions. Cobalt is an essential element present in metabolic enzymes necessary for the development of organisms [1]. Vitamin B12, which requires cobalt to function, is involved in many enzymatic reactions [2]. Co(II) tends to bind to electrophilic nitrogen atoms or groups such as amines and imidazoles. As a result, the binding of cobalt (II) to lipids is generally weaker and makes it more difficult to pass through narrow channels in biological membranes [3].
Phytoplankton produce numerous complex biomolecules, including lipids, which are the most important biochemical class of organic matter (OM) in seawater, along with carbohydrates and proteins [4,5,6,7]. They are an important cellular component for cell membrane function in physiological processes, energy storage, and trophic interaction in aquatic food webs. Global climate changes have a profound effect on lipids in coastal and estuarine waters and on lipid composition, which in turn affects cell integrity and physiological performance [8]. Lipid content in phytoplankton is highly dependent on environmental conditions such as CO2 concentration, temperature, salinity, and nutrient availability [9], with CO2 being the most important.
Numerous studies have shown that phytoplankton can adapt to new environmental conditions by remodeling lipid production [8,10,11,12]. The most important group of lipids that build cell membranes are phospholipids, which define the membrane bilayers of almost all living organisms. The main function of the major membrane lipids is to form the permeability barrier of the cell [13]. Within this category, phosphatidylcholine (PC), phosphatidylethanolamine (PE), and phosphatidylglycerol (PG) are among the most important with respect to algal species in the marine environment [4,5,6]. Phosphatidylcholine (PC) and phosphatidylethanolamine (PE) are predominantly found in the extrachloroplastic membranes of the cell, while phosphatidylglycerol (PG) is the only phospholipid found in the thylakoid membranes and is involved in the photosynthetic transport of electrons.
Therefore, the aim of this study was to investigate the interaction of standard (model) and extracted natural phospholipids with the micronutrient Co(II). Voltammetric results on the interaction of Co(II) mixed-ligand complexes with standard and natural phospholipids were additionally investigated by atomic force microscopy (AFM) imaging.

2. Materials and Methods

2.1. Chemicals and Solutions

The following reagents were used for experiments: methanol (p.a. Kemika d.d., Zagreb, Croatia), n-hexan (Ph. Eur. Carlo Erba, Emmendinger, Germany), 2-propanol (hypergrade for LC-MS, Merck, Darmstadt, Germany), formic acid (98–100%, Kemikad.d. Zagreb, Croatia), ammonia solution (25%, Merck, Germany), 2,5-dihydroxybenzoic acid (puriss. p.a., Merck, Germany), and matrix substance for MALDI-TOF mass spectrometry (MS). Standard solutions of Co(NO3)2 and Cu(NO3)2 (FlukaChemie GmbH, Buchs, Switzerland) were used in all experiments.
The standard lipids used in our experiments were commercially available: lipid standard of L-a-phosphatidylcholine (PC; egg yolk, type XVIE, ≥99% (TLC), lyophilized powder, Sigma-Aldrich, St. Louis, MO, USA), and L-α-phosphatidylglycerol (PG; Sigma-Aldrich).
The original stock solutions of standard phospholipids (PC, PE and PG) dissolved in methanol, c = 10−2 mol dm−3, were kept at −20 °C.
Natural lipid extract was obtained from the green algae Dunaliela tertiolecta culture, as described in Gašparović et al., 2015 and Gašparović et al., 2017 [14,15].

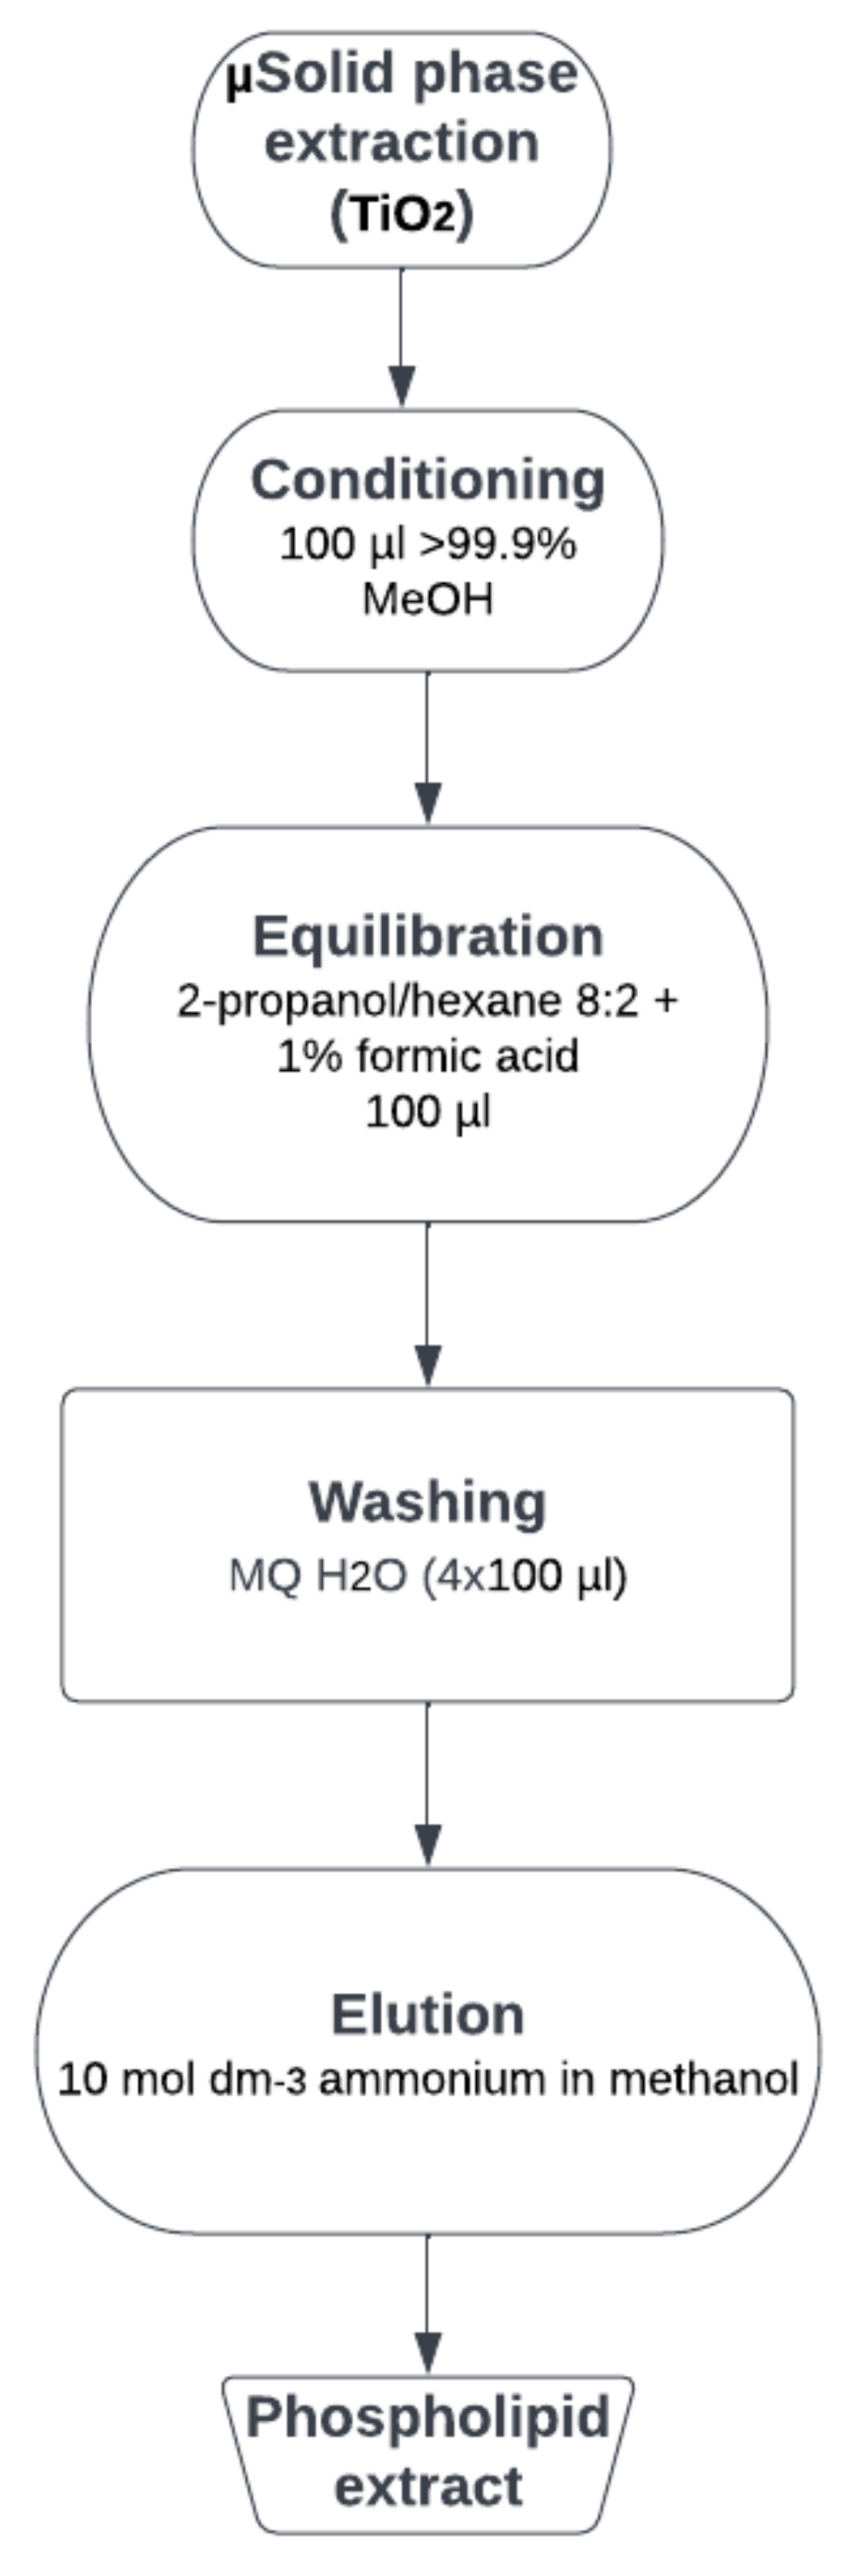
2.2. Micro-Solid Phase Extraction

The phospholipids were isolated from the lipid extract of Dunaliela tertiolecta by micro-solid phase extraction (µSPE) using Agilent AssayMAP Bravo Platform (St. Clara, CA, USA) with TiO2 micro cartridges (binding ≥90% recovery, 80 µg phenyl phosphate load, Resin Pore Size 100 Å, pH Stability 1–14, Agilent Technologies, St. Clara, CA, USA). TiO2-µSPE cartridges are efficient in the preparation of an analyst sample with a phosphoryl group, such as phosphopeptides and phospholipids, using a chelate bidentate bond between the phosphate group and the TiO2 surface [16]. Standard solutions for solid phase extraction were prepared by dissolving the lipid standards in an equilibration buffer (2-propanol/hexane 8:2 + 1% formic acid) c = 10−2 mg ml−1), since MALDI-TOF MS showed good resolution for the investigated concentration range. Natural samples in triplets were dissolved in a 500 µL equilibration buffer (the calculated concentration was about 10−3 mg mL−1). In our experiment, the cartridges were washed and conditioned with 100 µL > 99.9% MeOH (Sigma-Aldrich), which was used as the initial buffer, with a flow rate of 100 µL min−1. After adding the natural sample, the cartridge was equilibrated with 2-propanol/hexane 8:2 + 1% formic acid in a volume of 100 µL and a flow rate of 60 µL min−1. Cartridges were washed twice with the equilibration buffer and four times with MQ water using a flow rate of 30 µL min−1 to remove all impurities and chlorophyll from the sample. After washing, phospholipids were eluted (flow rate of 30 µL min−1) from the cartridge with 10 mol dm−3 ammonium in methanol. All fractions were frozen and stored at −20 °C for further analysis—Figure 1.
For new analysis, the eluate was lyophilized in the Concentrator 5301 apparatus (Eppendorf, Hamburg, Germany) for 2 h. Dried fractions were diluted in a matrix of 2,5-dihydroxybenzoic (DHB) solution for MALDI measurements (described in following section) and in methanol for other analysis (voltammetry, AFM).

2.3. Mass Spectrometry Analysis

By the MALDI-TOF MS analysis, it was checked whether the process of phospholipids isolation from natural extract was successful. A 4800 MALDI TOF/TOF Analyzer (Applied Biosystems Inc., Foster City, CA, USA) equipped with a 200 Hz, 355 nm Nd: YAG laser was used.
The preparation of MALDI samples is extremely fast and easy to accomplish. Organic solvents are exclusively used, which enhances the homogeneity of the mixture crystallization of the sample with the matrix compound extremely and, thus, the reproducibility of the MALDI-TOF MS measurements is excellent and well-resolved mass spectra were obtained [17]. Imaging was performed in positive ion reflector mode, the laser intensity was fixed at 4000, and the ion mirror was in reflector mode to determine the exact mass with greater precision. The mass range was set from 650 to 900 Da, and the number of shots per spectrum was 1600 and the delay time was 100 ns.
The instrument parameters were set using the 4000 Series Explorer software version (V 3.5.3, Applied Biosystems Inc., Foster City, CA, USA). For calibration of the MALDI-TOF MS, the standard calibration lipids (PG and PE) in the mass range of 300–3000 Da were used.
For the MALDI-TOF MS analysis of the samples, a DHB matrix was used; 5 mg cm−3 was prepared by dissolving the matrix in 50:50 acetonitrile (ACN, Sigma Aldrich: mili-Q®water (double-distilled deionized water) (MQ) [18].
The solution was vortexed thoroughly and left to stand at room temperature for several minutes. The dried purified phospholipid samples were diluted in 10 µL of matrix and 1 µL of mixture was spotted onto the MALDI plate to dry. Mass spectra were obtained by averaging 1600 laser shots covering the mass range between m/z 650 and 900. The MALDI spectrum was measured before and after SPE purification.

2.4. Electrochemical Measurements

Voltammetric studies were performed by a µ-AUTOLAB multimode potentiostat (ECO Chemie, Utrecht, The Netherlands) using a Metrohm 663 VA stand (Metrohm, Herisau, Switzerland). The instrument was computer-controlled using GPES 4.9 control software. A static mercury drop electrode (SMDE, size 2, i.e., 0.40 mm2) was the working electrode, and a glassy carbon stick counter electrode and Ag/AgCl (sat. NaCl) (+0.197 V vs. SHE) was used as reference one. Experiments were done in a quartz cell at 25 ± 1 °C in NaCl (Suprapur®, Merck, Germany) as an electrolyte solution with Ic = 0.55 mol dm−3 (Ic = ionic strength). Voltammetric methods included alternating current (ACV), out-of-phase mode (tensametry, phase angle 90°), square-wave (SWV), and cyclic voltammetry (CV). Solutions were deaerated by extra pure nitrogen for about 20 min and stirring (3000 rpm). During measurements, nitrogen circulated above the solution. pH was measured by a glass-Ag/AgCl electrode linked to ATI Orion PerpHecT Meter, model 320 (Cambridge, CA, USA). All relevant measurements were repeated at least three times.
For electrochemical experiments, the stock solution of standard phospholipids (PC, PE, PG) and natural phospholipids (PL)n, c = 1 × 10⁻² mol dm−3, were prepared by dissolution in methanol, as well as PC and PG (c = 1 × 10⁻⁵ mol dm−3). A stock solution of 1,10-Phenanthroline (c = 1 × 10⁻² mol dm−3) was prepared in Milli-Q water.

2.5. Atomic Force Microscopy Imaging

A multimode scanning probe microscope with a Nanoscope IIIa controller (Bruker, Billerica, MA, USA), with a vertical engagement (JV) 125 µm scanner, was used for AFM imaging. The tapping mode using silicon tips (TESP-V2, nominal resonance frequency 320 kHz, nominal spring constant 42 N/m, Bruker) was used in all experiments. To minimize the interaction forces between the tip and the surface during imaging in the tapping mode, the ratio of the set-point amplitude to the free amplitude (A/A0) was kept at 0.9 (light tapping). The linear scanning rate was optimized between 1.0 and 1.5 Hz with a scan resolution of 512 samples per line. The processing and analysis of images were carried out using NanoScopeTM software (Bruker, NanoScope Analysis ver. 2.0). Images are presented as raw data except for the first-order two-dimensional flattening. Measurements were performed in air at room temperature with 30–40% relative humidity to provide a small hydration layer on the sample to enable the conservation of the original molecular structures [19].
For AFM measurements, phospholipides were dissolved in methanol, standard in the concentration of 10−5 mol dm−3, while the natural extracted concentration was 10−7 mol dm−3. A volume of 5 µL of the phospholipid solution was pipetted directly onto freshly cleaved mica. The thin sheets were placed in closed Petri dishes for 45 min to allow the solvent to evaporate, after which AFM imaging was performed. To obtain AFM images of each lipid with 1,10-Phenanthroline (Phen), dissolved lipid was mixed in a 1:1 ratio with Phen (dissolved in methanol) in a concentration of 10−6 mol dm−3.
The same procedure was used in Co(II)-Phen-phospholipid sample preparations, in which the concentration of each component was 10−6 mol dm−3 (1:1:1 ratio of Co (II)-Phen-phospholipid).

3. Results and Discussion

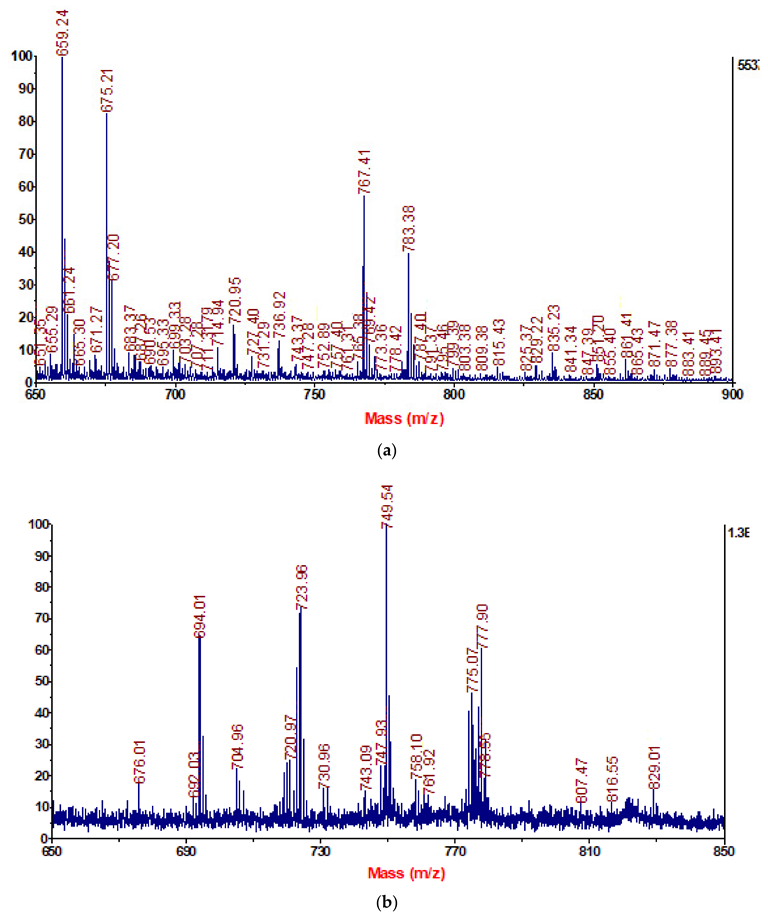
3.1. Natural Phospholipids in the Lipid Extract of Dunalliela Tertiolecta

Since algae are a well-known source of lipids [20], we extracted the natural phospholipids from the green alga Dunaliela tertiolecta. Lipid production is about 30–40% of the D. tertiolecta cell biomass [10,12]. To obtain natural phospholipids from extract, first we optimized the micro-solid phase extraction on TiO2-µSPE. These cartridges were used for lipid isolation from green alga Dunaliela tertiolecta for the first time. During the solid phase extraction of natural phospholipids from D. tertiolecta extraction described in the Section 2.2, we encountered a problem with the presence of chlorophyll in the eluate, probably because of its amphiphilic properties. Usually, chlorophyll can be removed from the sample with acetone but, in our case, too much of the natural phospholipid was lost. Consequently, by washing the sample with MQ water, the presence of chlorophyll was reduced to a minimum and a significant yield of the desired compounds was achieved. SPE based on the TiO2/SiO2 composite with an optimized eluent strategy was applied with confirmation of the successful extraction of phospholipids by the MALDI-TOF MS method. The lipid extract spectra were recorded before and after SPE purification (Figure 2). As shown, many signals that correspond to different compounds, as well as many interferences, were recorded in the spectrum of the raw lipid extract (Figure 2a). The complexity of the raw lipid extract can be attributed to the presence of hydrocarbons (HC), fatty acid methyl ester (ME), free fatty acids (FFA), alcohols (ALC), 1,3-diacylglycerols (1,3 DG), 1,2-diacylglycerols (1,2-DG), monoacylglycerols (MG), wax esters (WE), triacylglycerols (TG), and phospholipids (PL), including phosphatidylglycerols (PG), phosphatidylethanolamine (PE), and phosphatidylcholines (PC), as well as glycolipids (GL), which cover sulfoquinovosyldiacylglycerols (SQDG), monogalactosyldiacylglycerols (MGDG), digalactosyldiacylglycerols (DGDG), and sterols (ST) [7]. According to the literature, m/z peaks at 676 and 704 were attributed to PE, peaks at 692, 694, 720, 723, 730, 758, 761, and 775 to PC, and 743 and 749 to PG [18,19,21]. After µSPE purification, the spectrum became much cleaner and the non-phospholipid signals were well-reduced (Figure 2b). Results showed that the µSPE cartridge based on a TiO2/SiO2 core-shell composite is very effective in the selective extraction of phospholipids from the natural lipid mixture.

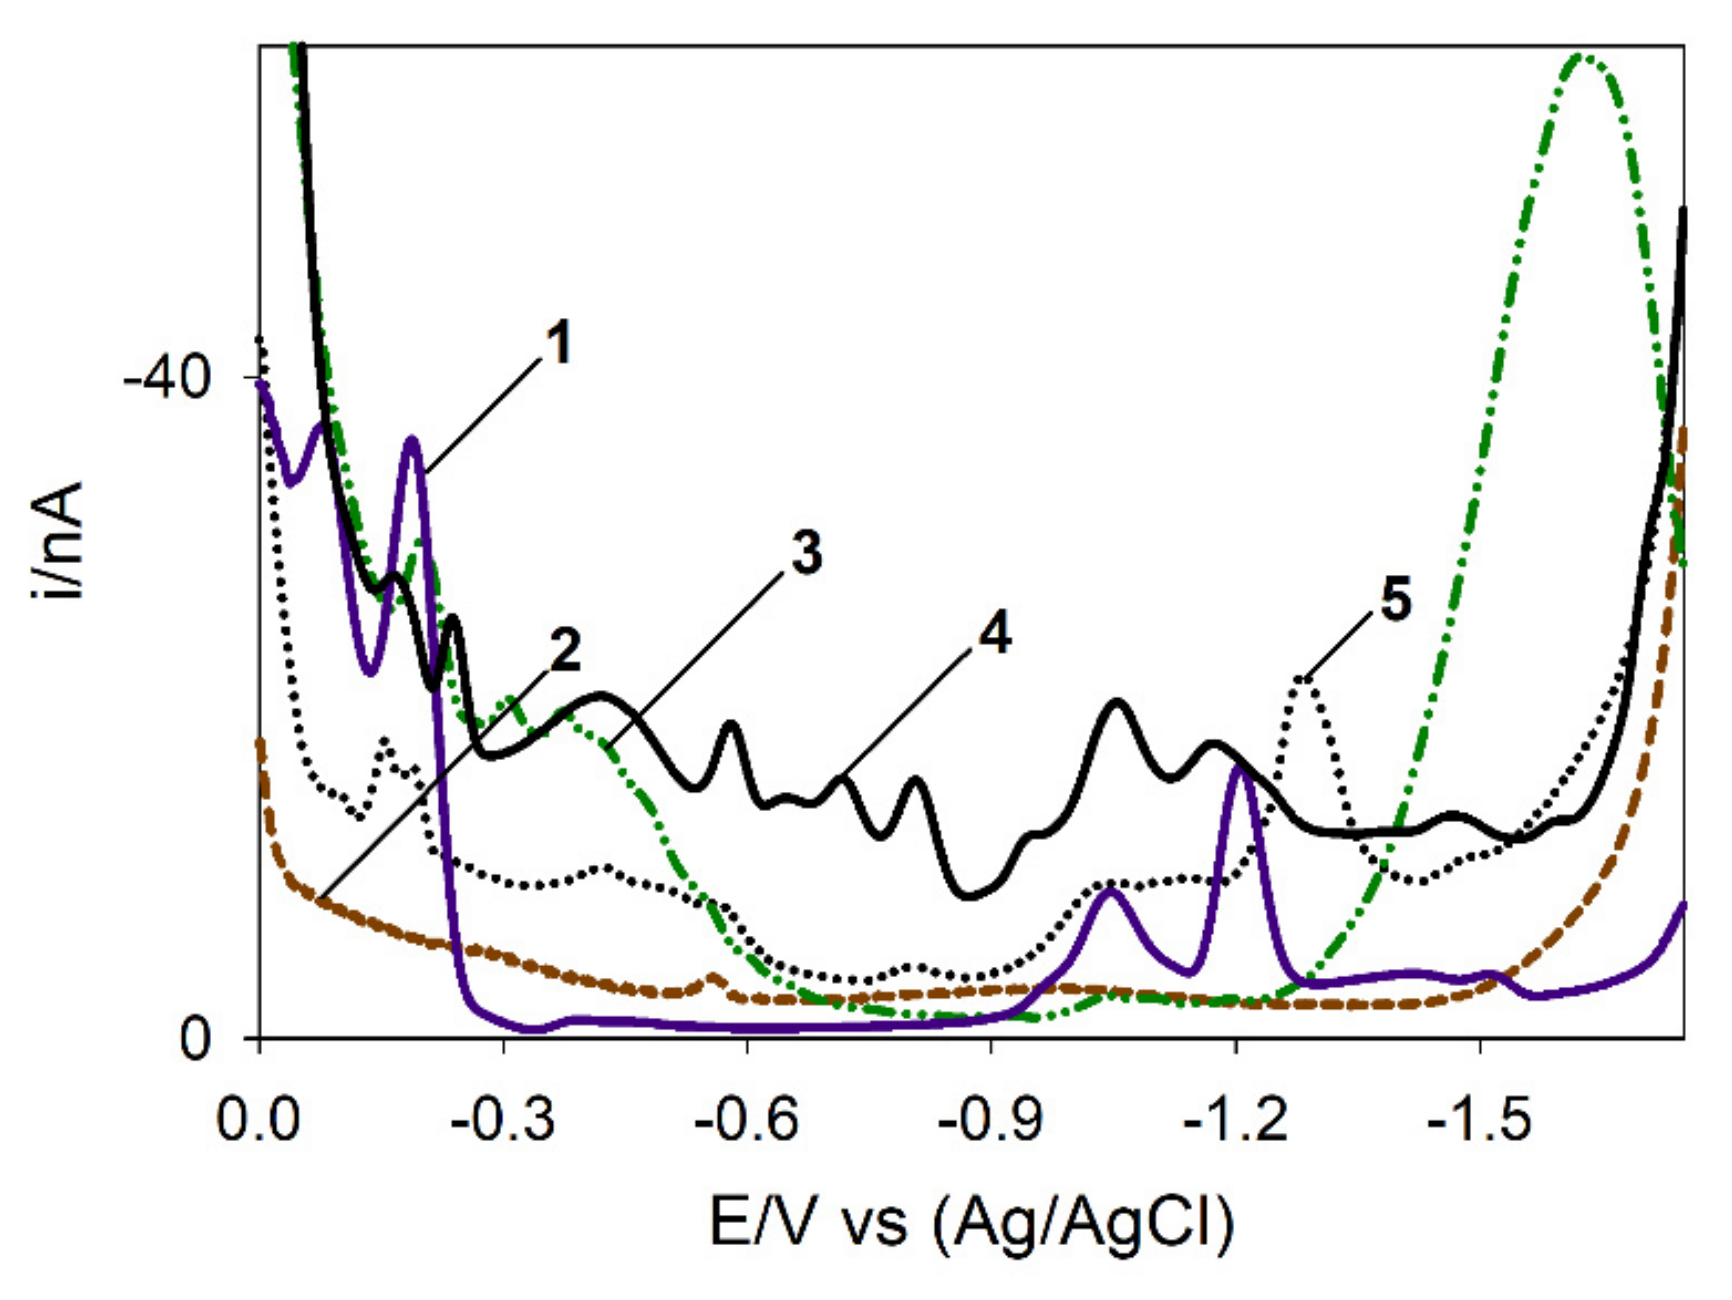
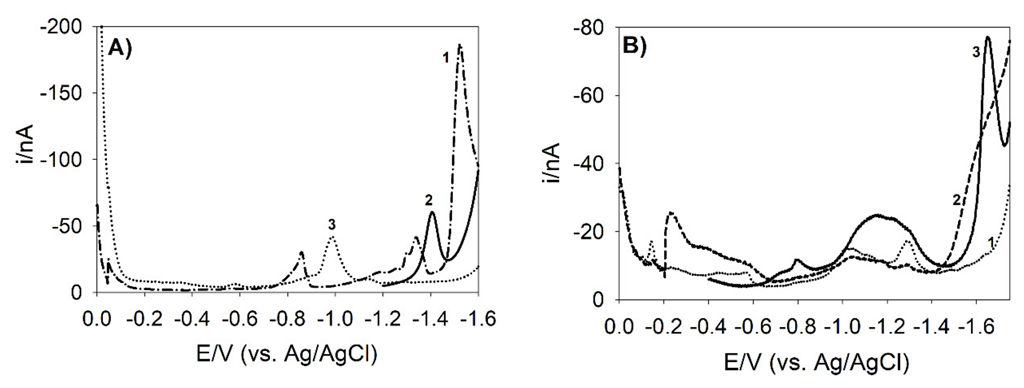
3.2. Voltammetric Measurements

The interaction of Co(II) with phospholipids was investigated by voltammetric measurements at the mercury drop electrode to mimic interactions at the hydrophobic cell membrane.
Investigations of phospholipid interaction with Co(II) were carried out by square wave (SW), alternating current (AC—tensametry), and cyclic voltammetry (CV). As the SW voltammetric technique discriminates between Faraday and capacitive currents and provides an insight into both half-electrode reactions, it is particularly suitable for studying the mechanisms of complex electrode processes [22].
Before experiments with extracted natural phospholipids, measurements of the interaction of Co(II) with standard phospholipids—phosphatidylcholine (PC), phosphatidylglycerol (PG), and phosphatidylethanolamine (PE)—were carried out. Voltammograms of the standards, a sample of the lipid mixture, and extracted purified phospholipids are presented at Figure 3.

Interaction of Co(II) with 1,10-Phenantroline and Standard Phospholipids

In the solution of standard phospholipids (either PC, PG and PE), regardless of its concentration, after the addition of Co(II) in the concentration range from 10−9 to 10−4 mol dm−3, no reduction peak was recorded, indicating that no complex is formed between the metal ions and the mentioned phospholipids. It has been shown that the transport of micronutrients through the lipid membranes of living cells is facilitated by the formation of intermediates. By binding the target ion to the hydrophilic ligand, parts of the water molecules are replaced from the central metal ion and a neutral molecule is formed. In this way, the passage of micronutrient through the lipid membrane is facilitated. In this work, 1,10-Phenanthroline (Phen) was used as a model of natural ligands from the group of humic substances. Phen is good chelating agent for divalent metals. Co(II) forms a complex with Phen that reduces at about Ep = −1.0 V [23].
In this work, the interaction of Co(II) with different natural phospholipids was investigated, building on our previous research [24]. Namely, investigations with standard phospholipid showed formation of an irreversible reduction peak of Co(II)-Phen-PC at −1.6 V [24]. As stated for the Co(II)-Phen-PC system in our previous research [24], the order of ligand addition (Phen, PG or PC) to the solution proved to be very important to achieve the desired binding of micronutrients to the lipid surface, that is, the formation of mixed-ligand complexes. Therefore, it was crucial to add both ligands into the electrolyte (Phen and phospholipid). Phen sticks to the phospholipid layer and affects the surface organization of phospholipid molecules. The addition of Co(II) to the solution of both ligands formed a neutral hydrophilic Co(II)-Phen “intermediate” complex in the solution, as a first step, and then, by the accumulation, it interacts with lipid phosphatidyl groups forming a mixed-ligand complex. The reduction signals of the Co(II)-Phen-PC are shown in Figure 4-inset. The reduction peak of mixed-ligand complex Co(II)-Phen-PG complex was registered at −1.4 V with concentrations of cPhen = 5 × 10⁻⁷ mol dm−3, cPG = 5 × 10⁻⁶ mol dm−3, and cCo = 2 × 10⁻⁶ mol dm−3 (Figure 4-inset.). By titration with Co(II) in the concentration range from 10−9 to 10−4 mol dm−3, the reduction peak of the complex increased proportionally with the Co(II) addition up to 1 × 10⁻⁵ mol dm−3, after which it remained constant because of the saturation of the mercury drop surface. With the variation of the accumulation time from 60–300 s, the reduction current changed significantly, while the reduction potential changed only slightly, as the PG layer was stabilized at the electrode surface.
The key investigations on Co(II) interaction with extracted natural phospholipide mixture samples by the TiO2-µSPE method, described for the first time, were performed. The concentration of natural phospholipids (PL) in the purified mixture were approximately cPG = 4.4 × 10⁻⁶ mol dm−3 and cPC = 2.11 × 10⁻⁶ mol dm−3 as determined by thin film chromatography [14]. By the addition of Co(II) ions, (cCo = 1 × 10⁻⁸ mol dm−3), in the solution of Phen and PL, a peak at about −1.65 V was registered (Figure 4). On the basis of voltammetric results with standard phospholipids, a similar voltammetric response with a natural phospholipid mixture was expected. In the first step of the mentioned process, 1,10-Phenanthroline formed a partially hydrated and hydrophilic uncharged chelate complex with Co(II) ions by substituting part of the water molecules from the Co(II) coordination sphere. PL as a hydrophobic ligand substituted for the remaining water molecules and a mixed-ligand Co(II)-Phen-PL complex was formed and strongly adsorbed at the hydrophobic mercury drop surface. The process was characterized as synergistic adsorption [25,26].
The reduction peak of mixed-ligand complex Co(II)-Phen-PL was registered at −1.65 V as the reduction peak of the Co(II)-Phen-PC (std.) (−1.60 V) [24]. A slight shift of the reduction potential toward more negative values is expected because of the complexity of the natural phospholipid mixture layer. We hypothesized that cobalt will show a stronger binding affinity for phospholipids containing a nitrogen ion (PC).
The dependence of the stripping peak current on the pre-concentration potential was examined in the range from 0 to −1.75 V. A maximum reduction current was obtained with a deposition potential of −0.4 V for Co(II)-Phen-PL. Well-defined reduction signals of the cobalt (II) mixed-ligand complex were registered by the PL molecule stabilization at the electrode surface, i.e., at the potentials more negative than −0.2 V. By the accumulation time variation from 30 to 300 s, the Co(II)-Phen-PL complex reduction current increased linearly with the slope 18.3 ± 0.07 AV−1, while reduction peak potential changed faintly.
Titration with a Co(II) ion was performed to check the behavior of the mixed-ligand complex reduction at the electrode surface. With the addition of Co(II) in the concentration range from 1 × 10⁻⁷ to 1 × 10⁻⁴ mol dm−3, the Co(II)-Phen-PL complex reduction current increased up to cCo = 1 × 10⁻⁵ mol dm−3, while with higher concentrations remained constant, as did its reduction potential because of the saturation of the electrode surface with complex molecules.
Therefore, the overall processes for reduction of the Co(II) mixed-ligand complex can be schematically summarized as:
PLads + Co(II)-Phen → PLCo(II)Phenads
PLCoPhenads + 2e→PLads + Co0 + Phen
The reduction process of the mixed-ligand complex (2) is totally irreversible, as oxidation does not take place because of its dissociation after Co(II) was reduced to Co0.
Furthermore, the reactant adsorption of the irreversible reduction process Co(II)-Phen-PL satisfied the relationship ΔEp/2 (mV) = (63.5 ± 0.5)/αn, where n = 2 (number of simultaneously transferred electrons) and where α is the average transfer coefficient.
From the experimental data, the calculated peak width at the half-height of Co(II)-Phen-PL was Ep/2 = 147.64 mV and relates to α = 0.43 ± 0.05 [27].
According to Equation (1),
ip = (5 ± 1) × 102qαn2Fαf ΔE Γ
from the slope ip/α using values αCo(II)-Phen-PL = 0.43, n = 2 and q = 0.004 cm2 (the surface of the mercury drop), F = 96,485 s A mol−1 (Faraday constant), and ΔE = 20 mV (square-wave scan increment), the amount of the adsorbed reactant (Γ) was calculated. For the Co(II)-Phen-PL complex, the maximum surface concentration adsorbed at the mercury drop electrode was Γ = (1.72 ± 0. 10) × 10−12 mol cm−2. If we compare the coverage of the electrode surface of the real sample with the PC standard published in the previous article [24], we can observe that the surface is covered by two orders of magnitude less. That is expected because of the complex composition of the phospholipid mixture sample.

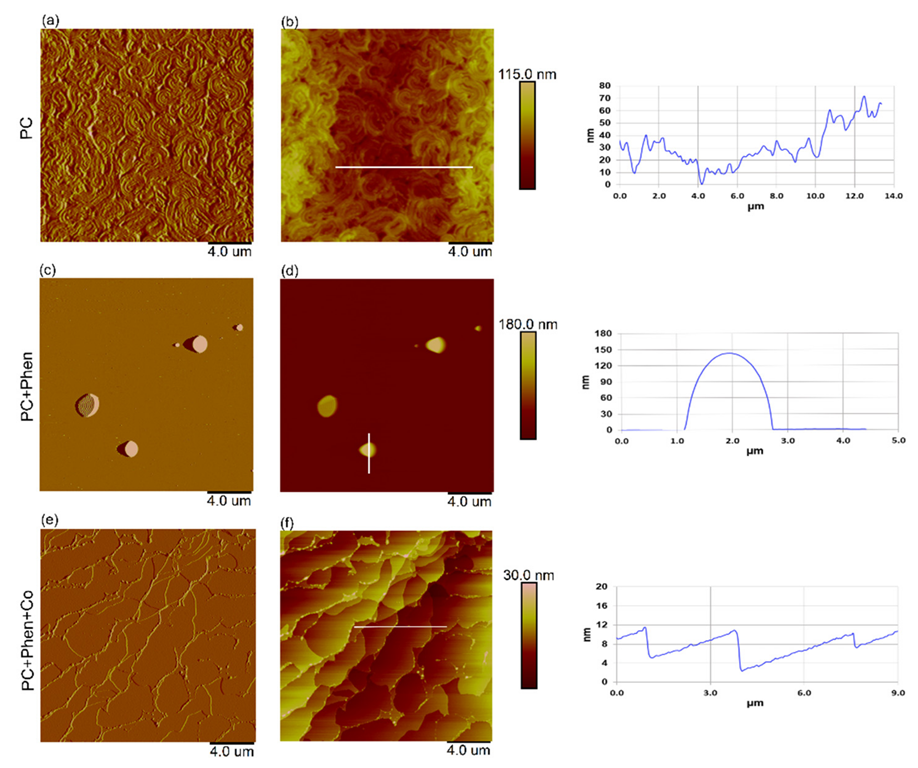
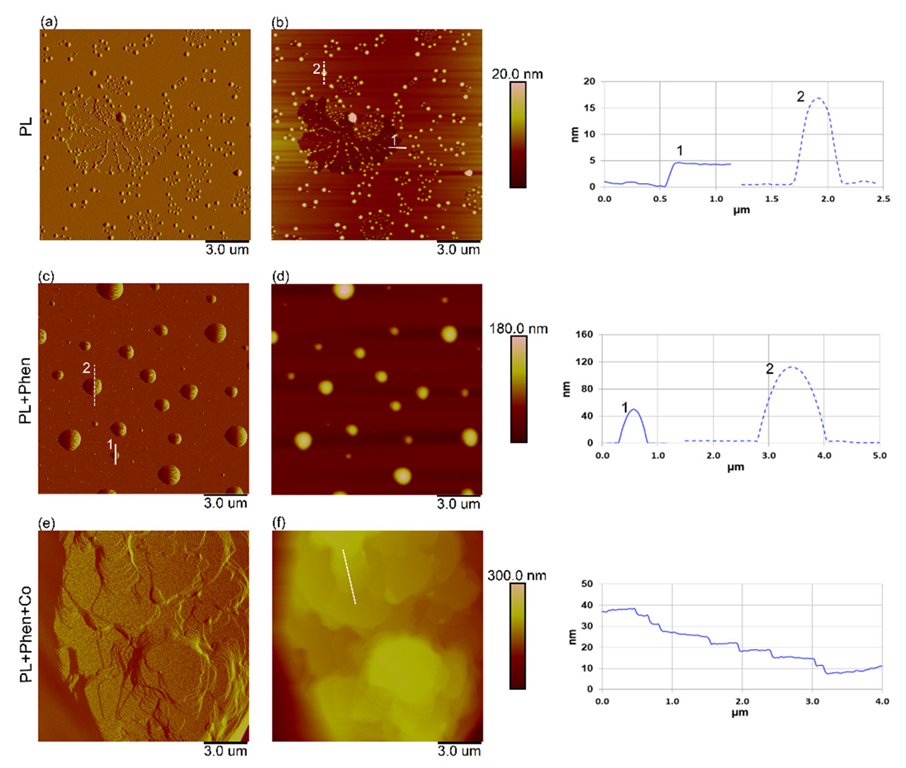
3.3. AFM Characterization of Co(II) Phospholipide Complexes

As previously described, complexes of phospholipids (standard), Phenantroline, and metals were detected by adsorptive stripping voltammetry at the hydrophobic mercury drop electrode. To confirm the obtained results, a multimode scanning probe microscope with a Nanoscope IIIa controller (Bruker, Billerica, MA, USA) with a vertical engagement (JV) 125 µm scanner was used for AFM imaging. In similar investigations [24], pressure-area (π-A) isotherms at the water–air interface by the Langmuir monolayer technique in a Langmuir–Blodgett trough was applied. However, due to the very small quantities of extracted natural lipid, the Langmuir monolayer technique was not applicable, considering that this technique requires significantly larger amounts of lipids applied to the surface layer of the aqueous solution.
A different structures of lipids (i.e., the formation of vesicles; mono-, bi- and multi-layers, etc.) are usually easily characterized by an atomic force microscope (AFM) because of its exceptional resolution and three-dimensional imaging capability [28,29,30]. Therefore, AFM imaging was applied to perceive changes in lipid structure that occur because of the addition of Phen and metal, indicating the formation of mixed-ligand complex(es). PC was taken as representative of the standard lipid, while with PG we did not get any significant differences with the addition of ligand and metal in the solution, assuming that this was due to weaker interactions with ligands that do not possess nitrogen in their structure.
The topographic image of PC on the mica surface recorded by AFM is shown in Figure 5a,b. Both amplitude data (Figure 5a) and corresponding height (Figure 5b) images revealed a thick layer of PC, since its concentration in methanol (before methanol evaporation) was very high, i.e., 1 mmol dm−3. PC was spread over almost the entire displayed area of mica, leaving only small holes on its surface. A vertical cross-section shows that the thickness of the PC layers on the mica surface reach about 70 nm in height. By the addition of Phen into the solution of PC (in a 1:1 ratio), AFM imaging revealed a different lipid structure on the mica surface (Figure 5c,d). Due to the electrostatic interaction of Phen and PC, the obtained mixture showed enhanced hydrophobicity and since the mica surface is negatively charged, the PC–Phen mixture formed a vesicle whose size varied from about 40 to 150 nm in height. By the addition of Co(II) into the PC–Phen solution (ratio 1:1:1), a change in the topographic image was registered (Figure 5e,f). In this case, the formation of terraces, as multi-planar ordered surfaces [31], was detected. A vertical cross-section revealed that the height of the terraces varied from the thickness of a single lipid bilayer to the width of several lipid multilayers. A basic comparison of recorded topographic images (in Figure 5a–c) indicates that the Co(II) chemically interacted with a PC–Phen mixture at the mica surface. The influence on hydrophobicity that causes a specific 3D structure of the mixed-ligand complex is evident.
Figure 6a,b show topographic images of a natural mixture of phospholipids on the mica surface. Both images show a large area covered by a relatively smooth lipid film in which lipid vesicles were imbedded. The thickness of the smooth film is about 4 nm, which corresponds to the height of the lipid bilayer [32,33], while the vesicle height varied from several nanometers to several tenths of a nanometer. Similar to the topographic images of PC–Phen, in the case of natural lipid and Phen, different-sized vesicles were formed (Figure 6c,d). The addition of Co(II) into the PL–Phen mixture, as in the case of PC, resulted in detection of different-sized terraces (Figure 6e,f), which confirms the interaction of Co(II)-Phen with PL, presumably forming a mixed-ligand complex.
AFM imaging on their basic level showed that interaction of Co(II) with phospholipids and Phenanthroline occurred, confirming results obtained by voltammetric measurements.

4. Conclusions

Phospholipids from the raw lipid extract of the green alga D. tertiolecta were separated by the TiO2-µSPE method. The results of this study showed that the TiO2-µSPE method is suitable and selective for the extraction of phospholipids from the lipid mixtures in real samples. The quality of separation was confirmed by MALDI-TOF analysis. The results showed the presence of the three major membrane phospholipids, PC, PG, and PE. The natural phospholipid mixture/extract and standard phospholipids (PG and PE) were used to study the interactions with the essential trace metal Co (II) by electrochemical measurements. The surface of the mercury electrode mimicked a model for a hydrophobic membrane of living cells. The interaction between Co(II) ions and phoshopholipids was not demonstrated by the voltammetric techniques used. However, complexes are formed when an intermediate is present in the solution—in our case, a chelating agent: 1,10-Phenanthroline.
When Phen is present in the solution, the formation of mixed-ligand complexes of Co(II) with PG was detected by voltammetric measurements at −1.4 V. When complexes with natural phospholipid samples were examined, a mixed-ligand complex with Co(II) at −1.65 V was detected. It can be assumed that the peak at −1.65 V corresponds to the complex with PC.
AFM images of samples of Co(II)-Phen-PC and Co(II)-Phen-PL systems confirmed that there is an interaction between the metal ions, Phen, and both phospholipids. With this study, we demonstrated that Co(II) can form mixed-ligand complexes with natural phospholipids with an intermediate to cross the cell membrane. In this way, organisms utilize essential trace metals that penetrate the cell membrane and are involved in numerous important biological processes.

Author Contributions

All authors were responsible for the concept and design of the study, provided critical feedback and helped shape the research. Conceptualization, M.M. and A.B.; methodology, M.M.; software, A.B.; validation, A.B., I.K.; formal analysis, A.B.; investigation, A.B., P.V.; resources, P.V.; data curation, M.M., writing—original draft preparation, A.B.; writing—review and editing, M.M.; visualization, A.B.; supervision, M.M.; project administration, M.M. All authors have read and agreed to the published version of the manuscript.

Funding

This research was funded by Croatian Science Foundation.

Data Availability Statement

Data sharing not applicable.

Acknowledgments

The financial support for this work was provided by BiREADI project IP-2018-01-3105 (Biochemical responses of oligotrophic Adriatic surface ecosystems to atmospheric deposition inputs), funded by the Croatian Science Foundation. Additionally, special recognition to Mario Cindrić and Tena Matijević from the Laboratory for Bioanalytics, Ruđer Bošković Institute, for help with the extraction and identification of phospholipids from a natural lipids mixture.

Conflicts of Interest

The authors declare no conflict of interest.

References

  1. Lo Nostro, P.; Ninham, B.W. Hofmeister phenomena: An update on ion specificity in biology. Chem. Rev. 2012, 112, 2286–2322. [Google Scholar] [CrossRef] [PubMed]
  2. Bonnet, S.; Tovar-Sánchez, A.; Panzeca, C.; Duarte, C.M.; Ortega-Retuerta, E.; Sañudo Wilhelmy, S.A. Geographical gradients of dissolved Vitamin B12 in the Mediterranean Sea. Front. Microbiol. 2013, 4, 126. [Google Scholar] [CrossRef]
  3. Huertas, M.J.; López-Maury, L.; Giner-Lamia, J.; Sánchez-Riego, A.M.; Florencio, F.J. Metals in cyanobacteria: Analysis of the copper, nickel, cobalt and arsenic homeostasis mechanisms. Life 2014, 4, 865–886. [Google Scholar] [CrossRef] [PubMed]
  4. Guschina, I.A.; Harwood, J.L. Algal lipids and effect of the environment on their biochemistry. Lipids Aquat. Ecosyst. 2009, 74, 31–68. [Google Scholar]
  5. Vance, D.E.; Vance, J.E. Biochemistry of Lipids, Lipoproteins, and Membranes; Elsevier: Amsterdam, The Netherlands, 2002; p. 607. [Google Scholar]
  6. Benson, A.A.; Maruo, B. 1958. Piant phospholipids. I. Identification of the phosphatidyl glycerols. Biochim. Biophys. Acta 1958, 27, 189–195. [Google Scholar] [CrossRef]
  7. Triesch, N.; Van Pinxteren, M.; Frka, S.; Stolle, C.; Spranger, T.; Hans Hoffmann, E.; Gong, X.; Wex, H.; Schulz-Bull, D.; Gasparovic, B.; et al. Concerted measurements of lipids in seawater and on submicrometer aerosol particles at the Cabo Verde islands: Biogenic sources, selective transfer and high enrichments. Atmos. Chem. Phys. 2021, 21, 4267–4283. [Google Scholar] [CrossRef]
  8. Vrana Špoljarić, I.; Novak, T.; Gašparović, B.; Kazazić, S.P.; Čanković, M.; Ljubešić, Z.; Hrustić, E.; Mlakar, M.; Du, J.; Zhang, R.; et al. Impact of environmental conditions on phospholipid fatty acid composition: Implications from two contrasting estuaries. Aquat. Ecol. 2021, 55, 1–20. [Google Scholar] [CrossRef]
  9. Jin, P.; Gonzàlez, G.; Agustí, S. Long-term exposure to increasing temperature can offset predicted losses in marine food quality (fatty acids) caused by ocean warming. Evol. Appl. 2020, 13, 2497–2506. [Google Scholar] [CrossRef]
  10. Hopkins, T.C.; Sullivan Graham, E.J.; Schuler, A.J. Biomass and lipid productivity of Dunaliella tertiolecta in a produced water-based medium over a range of salinities. J. Appl. Phycol. 2019, 31, 3349–3358. [Google Scholar] [CrossRef]
  11. Novak, T.; Godrijan, J.; Marić Pfannkuchen, D.; Djakovac, T.; Medić, N.; Ivančić, I.; Mlakar, M.; Gašparović, B. Global warming and oligotrophication lead to increased lipid production in marine phytoplankton. Sci. Total Environ. 2019, 668, 171–183. [Google Scholar] [CrossRef]
  12. Rizwan, M.; Mujtaba, G.; Rashid, N.; Lee, K. Enhancing lipid production of Dunaliella tertiolecta by manipulating the interactive effect of salinity and nitrogen, Chem. Biochem. Eng. 2017, 31, 199–207. [Google Scholar]
  13. Dowhan, W.; Bogdanov, M. Functional roles of lipids in membranes. In Biochemistry of Lipids, Lipoproteins and Membranes; Elsevier: Amsterdam, The Netherlands, 2002; Volume 36, pp. 1–35. [Google Scholar]
  14. Gašparović, B.; Kazazić, S.P.; Cvitešić, A.; Penezić, A.; Frka, S. Improved separation and analysis of glycolipids by Iatroscan thin-layer chromatography-flame ionization detection. J. Chromatogr. 2015, A1409, 259–267. [Google Scholar] [CrossRef] [PubMed] [Green Version]
  15. Gašparović, B.; Penezić, A.; Lampitt, R.S.; Sudasinghe, N.; Schaub, T. Depth-related cycling of suspended nitrogen-containing lipids in the northeast Atlantic. Org. Geochem. 2017, 113, 55–66. [Google Scholar] [CrossRef]
  16. Shen, Q.; Cheung, H.Y. TiO2/SiO2 core-shell composite-based sample preparation method for selective extraction of phospholipids from shrimp waste followed by hydrophilic interaction chromatography coupled with quadrupole time-of-flight/mass spectrometry analysis. J. Agric. Food Chem. 2014, 62, 8944–8951. [Google Scholar] [CrossRef]
  17. Schiller, J.; Arnhold, J.; Benard, S.; Muller, M.; Reichl, S.; Arnold, K. Lipid analysis by matrix-assisted laser desorption and ionization mass spectrometry: A methodological approach. Anal. Biochem. 1999, 267, 46–56. [Google Scholar] [CrossRef]
  18. Schiller, J.; Suss, R.; Arnhold, J.; Fuchs, B.; Lessog, J.; Muller, M.; Petković, M.; Splalteholz, H.; Zschorninh, O.; Arnold, K. Matrix-assisted laser desorption and ionization time-of-flight (MALDI-TOF) mass spectrometry in lipid and phospholipid research, Prog. Lipid Res. 2004, 43, 449–488. [Google Scholar] [CrossRef] [PubMed]
  19. Balnois, E.; Papastavrou, G.; Wilkinson, K.J. Force Microscopy and Force Measurements of Environmental Colloids; Wilkinson, John Wiley and Sons: Chichester, UK, 2007; pp. 405–468. [Google Scholar]
  20. Rosário Domingues, M.; Calado, R. Lipids of Marine Algae—Biomolecules with High Nutritional Value and Important Bioactive Properties. Biomolecules 2022, 12, 10–13. [Google Scholar]
  21. Dong, W.; Qing, S.; Joewel, T.B.; Yimin, L.; Ping, W.; Yeqing, H.; Zhifeng, Z.; Yixuan, W.; Hon-Yeung, C. Phospholipid analyses by MALDI-TOF/TOF mass spectrometry using 1,5-diaminonaphthalene as matrix. Int. J. Mass Spectrom. 2013, 343–344, 15–22. [Google Scholar] [CrossRef]
  22. Lovrić, M.; Komorsky-Lovrić, Š. Theory of Square-Wave Voltammetry of Two-Electron Reduction with the Adsorption of Intermediate. Int. J. Electrochem. 2012, 2012, 596268. [Google Scholar] [CrossRef]
  23. Mlakar, M.; Cuculić, V.; Frka, S.; Gašparović, B. Copper-phospholipid interaction at cell membrane model hydrophobic surfaces. Bioelectrochemistry 2018, 120, 10–17. [Google Scholar] [CrossRef]
  24. Bačinić, A.; Frka, S.; Mlakar, M. A study of Cobalt (II) complexes involved in marine biogeochemical processes: Co(II)-1,10-Phenanthroline and Co(II)-1,10-Phenanthroline-L-α-Phosphatidylcholine. Bioelectrochemistry 2022, 144, 108009. [Google Scholar] [CrossRef]
  25. Čuljak, I.; Mlakar, M.; Branica, M. Synergetic adsorption of the copper-Phenanthroline-tributylphosphate complex at a mercury drop electrode. Anal. Chim. Acta 1994, 297, 427–435. [Google Scholar] [CrossRef]
  26. Mlakar, M.; Lovrić, M.; Branica, M. Theory of metal ions accumulation by the synergistic adsorption at mercury electrodes. Collect. Czechoslov. Chem. Commun. 1990, 55, 903–923. [Google Scholar] [CrossRef]
  27. Mlakar, M. Square-Wave Voltammetry of Uranyl-Humate Complex. Anal. Chim. Acta 1993, 276, 367–372. [Google Scholar] [CrossRef]
  28. Vukosav, P.; Tomišić, V.; Mlakar, M. Iron(III)-complexes engaged in the biochemical processes in seawater. II. Voltammetry of Fe(III)-malate complexes in model aqueous solution. Electroanalysis 2010, 22, 2179–2186. [Google Scholar] [CrossRef]
  29. Pompeo, G. AFM characterization of solid-supported lipid multilayers prepared by spin-coating. Biochim. Biophys. Acta Biomembr. 2005, 1712, 29–36. [Google Scholar] [CrossRef] [PubMed]
  30. Goksu, E.I.; Vanegas, J.M.; Blanchette, C.D.; Lin, W.C.; Longo, M.L. AFM for structure and dynamics of biomembranes. Biochim. Biophys. Acta Biomembr. 2009, 1788, 254–266. [Google Scholar] [CrossRef]
  31. Al-Rekabi, Z.; Contera, S. Multifrequency AFM reveals lipid membrane mechanical properties and the effect of cholesterol in modulating viscoelasticity. Proc. Natl. Acad. Sci. USA 2018, 115, 2658–2663. [Google Scholar] [CrossRef]
  32. Lv, Z.; Banerjee, S.; Zagorski, K.; Lyubchenko, Y.L. Supported Lipid Bilayers for Atomic Force Microscopy Studies; Humana Press: New York, NY, USA, 2018; p. 1814. [Google Scholar]
  33. Unsay, J.D.; Cosentino, K.; García-Sáez, A.J. Atomic Force Microscopy Imaging and Force Spectroscopy of Supported Lipid Bilayers. J. Vis. Exp. 2015, 101, e52867. [Google Scholar] [CrossRef] [Green Version]
Figure 1. Flowchart of the solid-phase extraction of phospolipids from lipid extract by TiO2 µcartridges.
Jmse 10 01261 g001
Figure 2. A MALDI-TOF mass spectrum in the positive reflector ion mode (mass range of 600–900 Da) of (a) raw lipid extract from D. tertiolecta and (b) phospholipid sample after µSPE-TiO2 protocol.
Jmse 10 01261 g002
Figure 3. SW voltammograms of (1) PC c = 10−7 mol dm−3, (2) PG c = 10−7 mol dm−3, (3) PE c = 10−7 mol dm−3, (4) mixture of natural lipids, and (5) phospholipids after extraction; Eacc = 0 V, tacc =180 s, Estep = 2 mV, a = 20 mV, f = 60 s−1, v = 50 mV s−1; 0.55 mol dm−3 NaCl, pH = 8.2.
Jmse 10 01261 g003
Figure 4. SW voltammograms of standards (A) (1) Co(II)-Phen-PC with cPC = 1 × 10⁻⁵ mol dm−3, cPhen = 5 × 10⁻⁷ mol dm−3, cCo = 5 × 10⁻⁸ mol dm−3; Ep = −0.3 V, tacc = 180 s, Estep = 2 mV, a = 20 mV, f = 50 s−1; (2) Co(II)-Phen-PG with cCo = 1 × 10⁻⁵ mol dm−3, cPhen = 5 × 10⁻⁷ mol dm−3, cPG = 5 × 10⁻⁶ mol dm−3; Eacc = −1.2 V, tacc = 180 s, Estep = 2 mV, a = 20 mV, f = 60 s−1, v = 50 mV s−1; 0.55 mol dm−3 NaCl, pH = 8.2, (3) Co(II)-Phen with cCo = 1 × 10⁻⁵ mol dm−3, cPhen = 1 × 10⁻⁵ mol dm–3, Ep = −0 V, tacc= 180 s, Estep = 2 mV, a = 20 mV, f = 50 s−1 and natural lipids. (B) (1) Natural PL+Phen+Co(II): cCo = 1 × 10⁻⁸ mol dm−3, (2) Natural PL+Phen: cPhen = 1 × 10⁻⁸ mol dm−3, (3) Natural PL extract after SPE (cPG = 4.4 × 10⁻⁷ mol dm−3, cPC = 2.11 × 10⁻⁷ mol dm−3); (Eacc = −0.4 V); tacc = 180 s, Estep = 2 mV, a = 20 mV, f = 60 s−1, v = 50 mV s−1; 0.55 mol dm−3 NaCl, pH = 8.2.
Jmse 10 01261 g004
Figure 5. AFM images of PC on mica surface: amplitude data (a) and height (b) of PC alone; amplitude data (c) and height (d) of PC with Phen (1:1); and amplitude data (e) and height (f) of PC, Phen and Co(II) (1:1:1). Heights of cross-sections marked on height images are presented graphically.
Jmse 10 01261 g005
Figure 6. AFM images of natural phospholipid (PL) on the mica surface: amplitude data (a) and height (b) of PC alone; amplitude data (c) and height (d) of PC with Phen (1:1) and amplitude data (e) and height (f) of PC, Phen and Co(II) (1:1:1). Heights of cross-sections marked on height images are presented graphically.
Jmse 10 01261 g006
Publisher’s Note: MDPI stays neutral with regard to jurisdictional claims in published maps and institutional affiliations.

