Article

Assessment of Carbon Emission and Carbon Sink Capacity of China’s Marine Fishery under Carbon Neutrality Target

1
School of Business, Sichuan University, Chengdu 610065, China
2
College of Marxism, Sichuan University, Chengdu 610065, China
*
Author to whom correspondence should be addressed.
J. Mar. Sci. Eng. 2022, 10(9), 1179; https://doi.org/10.3390/jmse10091179
Submission received: 3 August 2022 / Revised: 17 August 2022 / Accepted: 22 August 2022 / Published: 24 August 2022
(This article belongs to the Special Issue Marine Policy)

Abstract

:
Excessive carbon emissions will cause irreversible damage to the human living environment. Therefore, carbon neutrality has become an inevitable choice for sustainable development. Marine fishery is an essential pathway for biological carbon sequestration. However, it is also a source of carbon emissions. From this perspective, an in-depth assessment of the performance of carbon emissions and sinks from marine fisheries is required to achieve the goal of carbon neutrality. This paper measured the carbon emissions, carbon sinks, and net carbon emissions of marine fisheries in nine coastal provinces of China from 2005 to 2020 for the first time. Based on the calculation results, the log-mean decomposition index method was used to analyze the driving factors of net carbon emissions. The results suggested that, from 2005 to 2020, both the carbon emissions and carbon sinks of China’s marine fisheries increased, and the net carbon emissions showed a downward trend. There were variations in the performance of carbon emissions, carbon sinks, and net carbon emissions in different provinces, and only Shandong could consistently achieve carbon neutrality. Fujian and Liaoning achieved carbon neutrality in 2020. In terms of the contribution of each factor, the industrial structure was the main positive driver, and carbon intensity was the main negative driver. Based on the empirical results, this paper suggested increasing the implementation of the carbon tax policy, establishing a farming compensation mechanism and promoting carbon emissions trading and international blue carbon trading. The results could give a reference for the energy conservation and emission reduction of marine fisheries while enhancing the ecological benefits of their carbon sinks and helping to achieve the carbon neutrality target.

1. Introduction

Human activities have profoundly changed the natural environment in which they live. The growth of urbanization and industrialization has led to carbon emissions reaching a point where nature can hardly carry them. Carbon emissions refer to the emissions of greenhouse gases, of which carbon dioxide is the main greenhouse gas. Excessive carbon emissions can result in consequences such as ocean acidification, global warming, and extreme weather. This series of consequences seriously threatens the living environment and health of human beings [1,2]. Therefore, reducing carbon emissions has become an inevitable trend for the future development of all countries worldwide. The Paris Agreement initiation showed countries’ determination to reduce greenhouse gas emissions [3]. In this context, China announced a “carbon neutrality” goal in 2020, aiming to achieve carbon neutrality by 2060. Carbon neutrality means balancing between emitting carbon and absorbing carbon from the atmosphere in carbon sinks [4,5]. Carbon neutrality is a huge driver of China’s economic growth and transformation. Future scientific research, technological development, and other decisions need to consider carbon neutrality. In addition to relying on advanced technology [6], industrial structure upgrading, and optimization, carbon sequestration through marine fisheries is also an important path to achieving the goal of carbon neutrality [7]. Marine fisheries’ carbon sinks can reduce atmospheric C O 2 concentrations directly or indirectly through production activities. In contrast to the high cost and difficulty of technological upgrading to form carbon sinks, marine fisheries’ carbon sinks have lower costs and greater potential [8]. The development of ocean carbon sinks is of great significance to implementing a low carbon economy [9].
Therefore, under the goal of carbon neutrality, there is an urgent requirement to clarify how much carbon can be absorbed by China’s marine fisheries, which will help to effectively use the ecosystem to absorb carbon and achieve long-term carbon storage in the ocean [10]. Although marine fisheries can form biological carbon sequestration, fisheries are also carbon emitters. Hence, net carbon emissions from marine fisheries need to be considered. If they can reach zero or negative values within a certain time frame, the goal of carbon neutrality will be achieved. Whether marine fisheries can achieve carbon neutrality is crucial for them to transform their traditional economic approach and achieve circular development of the marine economy [11]. Nevertheless, regarding China’s current distribution of marine fisheries, the development is not balanced across regions [12]. The current status of net carbon emissions in various provinces needs to be analyzed to find the differences between provinces. Meanwhile, studying the net carbon emissions of marine fisheries in depth is not enough to understand the current status of the individual region. Considering the drivers of net carbon emissions is also necessary. When exploring the drivers of net carbon emissions, the extent of contribution of different factors should be systematically considered. The analysis results can help improve the ecological value of marine fisheries and provide a better “decarbonization space” for the sustainable development of the marine economy [13].
Consequently, the research in this paper makes the following contributions. First, this paper assessed the Chinese provinces’ net carbon emissions based on the calculation of carbon emissions and carbon sinks of marine fisheries, led by the carbon neutrality target. Second, in the process of calculating net carbon emissions from marine fisheries, this paper used a modified carbon sink accounting system and considered carbon emissions generated from the operation of motorized farming fishing vessels. Third, using the log-mean decomposition index (LMDI) model, this paper analyzed the drivers of net carbon emissions and evaluated the contributions of carbon intensity, industrial structure, industrial efficiency, and industrial scale to the level of net carbon emissions in China. Theoretically, this paper has bridged the gap in existing marine fisheries research. Based on the calculation results of carbon emissions and carbon sinks of marine fisheries, this paper proposed targeted countermeasures for the development of marine fisheries in China. The research methods and results offered theoretical references for the development of marine fisheries. In practical applications, the findings supported energy saving and emission reduction in marine fisheries and helped to enhance the ecological function of carbon sinks in marine fisheries. By integrating with marine policies, this paper contributed to the early achievement of the carbon neutrality target for China’s marine fisheries. The rest of the paper is structured as follows. The second section provides a review study of the relevant literature. Section 3 introduces the methodology and data sources of this paper. Section 4 analyzes the empirical results. Section 5 provides some extended discussion of the results. Section 6 is the conclusion and policy recommendations of this paper.

2. Literature Review

Currently, many scholars have studied the carbon emissions and carbon sinks of marine fisheries. There are, however, few in-depth studies on net carbon emissions. Yue et al. [14] explored the carbon balance status of China’s marine fisheries and conducted a regional characterization. However, they did not further explore the drivers of the carbon balance state. Guan et al. [13] conducted a decoupling analysis of net carbon emissions and economic growth in marine aquaculture, yet an independent analysis of net carbon emissions from different regions was missing. Therefore, in addition to their studies, this section focuses on sorting out the literature on carbon emissions and carbon sinks. Correctly handling the neutral relationship between carbon emissions and carbon sinks is the key to facilitating the sustainable development of marine fisheries.
As an element closely related to our lives, carbon emissions have been a hot research topic. In recent years, scholars have focused on carbon emission reduction, carbon tax policy, carbon emission transfer, and carbon emission trading as the main topics on carbon emissions. Their calculation methods for carbon emissions included carbon footprint [15], system dynamics [16], input–output analysis [17], and life cycle assessment [18]. Wang et al. [19] measured the carbon emission intensity of Chinese agriculture and proposed a regional carbon reduction strategy. Sun et al. [20] analyzed the carbon emission transfer and reduction problem among companies in the supply chain based on the game theory. Xu and Long [21] studied the impact of carbon tax policies on the economy and carbon emissions and concluded that carbon taxes inhibit economic growth and carbon emissions. Sun et al. [22] explored the spatial characteristics of provincial carbon emission transfers and their economic spillover effects in China. Hua et al. [23] examined how companies can manage their carbon footprint in inventory management under the carbon trading mechanism. Guo et al. [24] dissected whether carbon emissions trading has promoted carbon finance and reduced carbon emissions. Based on the regional differences and spatial–temporal evolution trends of carbon emission intensity in China, Zhang and Fan [25] constructed the emission reduction effectiveness criteria of the carbon emission trading mechanism. Research on carbon emissions also involves multiple industries, such as electric power [26], construction [27], and transportation [18]. For marine fisheries, Kim et al. [28] estimated the changes in greenhouse gas emissions and emission costs from capture fisheries using a steady-state bioeconomic model. Ghosh et al. [15] studied the carbon emissions from marine fisheries fuel and electricity consumption by determining the carbon footprint. Wang and Wang [29] explored the relationship between carbon emissions and the economic output of marine fisheries.
Existing research on carbon sinks has focused on forests, cities, grasslands, and wetlands. Maia et al. [30] investigated long-term trends in carbon stocks and sinks based on data from monitored forest sites. Shi et al. [31] used the stock approach to measure the amount and value of forest carbon sinks in China. Xu et al. [32] studied the influence of urban characteristics on the spatial variation of urban carbon sinks. Smith [33] explored whether grasslands can act as permanent carbon sinks. Bu et al. [34] assessed carbon sinks in wetland ecosystems. At the same time, more and more scholars recognize the value of “blue carbon”, including the economic and ecological benefits generated by carbon sinks [13]. The most common method for calculating marine sinks was the “removable sink” model [8,35]. Chung et al. [36] suggested that the appropriate use of macroalgae could reduce greenhouse gas emissions. Bao [10] explored the key elements of assessing ocean carbon sinks. They concluded that the age scale of carbon pools and the timing of carbon sink processes were key elements in assessing ocean carbon sinks. Ren [8] estimated the capacity of removable carbon sinks in China’s mariculture industry and analyzed the influence of structural and scaling factors on it using the LMDI model. Liu et al. [37] proposed a method for calculating ocean carbon sinks that considered both the type of carbon sink and the time scale of its characteristic carbon storage cycle. Jones et al. [38] explored the interactions between the mariculture industry and its surrounding marine ecosystem. In addition to assessing and accounting for carbon sinks, scholars have also made predictions [39] and conducted impact factor analyses [7] of carbon sinks in marine fisheries.
By sorting out the existing literature, it can be found that most scholars have studied carbon emissions and carbon sinks in different industries separately. Studies involving net carbon emissions from marine fisheries have not delved into the driving factors behind them. Instead, motivated by the goal of carbon neutrality, research on marine fisheries should focus on net carbon emissions and their drivers. The gap in this research area also provides an opportunity for an in-depth study of this paper. Therefore, starting from the carbon neutrality target, this paper studied the performance of marine fishery carbon emissions and carbon sinks in China’s coastal provinces, and analyzed whether their net carbon emissions could achieve the ecological function of marine fishery carbon sinks. Based on the calculation results, this paper constructed a driving factor decomposition model of net carbon emissions and explored the reasons behind these results.

3. Materials and Methods

3.1. Calculated Methods for Carbon Emissions

The main source of carbon emissions from marine fisheries is the fuel consumption of marine motorized fishing vessels during the production process. Since the “carbon” in the definition of carbon neutrality is C O 2 , this paper adopted the conversion formula to calculate the emission and sink of C O 2 . The calculation process of carbon emissions refers to the calculation method of fossil fuel combustion emissions C O 2 proposed by the Oak Ridge National Laboratory in the United States. The calculation formula is as follows [11]:
C = m = 1 7 μ m · P m · h  
where   C is the coal consumption, m is the different operation modes of fishing boats,   μ is the oil consumption coefficient of fishing boats with different operation modes, P is the main engine power of fishing boats with different operation modes, and h is the fuel oil conversion coefficient of standard coal, which is 1.4571.
Q c = Q E · F C · C · δ
where Q c is the amount of carbon, Q E is the effective oxidation fraction and takes the value of 0.982, F C is the amount of carbon per ton of standard coal and takes the value of 0.73257, and δ is the ratio of C O 2 emitted from fuel oil to coal combustion under the same heat energy obtained and is 0.813.
Q c o 2 = Q C · ω
where Q c o 2 is the amount of C O 2 released and ω is the constant for carbon to C O 2 conversion (based on the relative atomic mass), which takes the value of 3.67.

3.2. Calculated Methods for Carbon Sinks

The main sources of carbon sinks in marine fisheries are shellfish and algae farming. The “removable carbon sink” model proposed by Tang et al. [40] includes only the carbon that is fixed in shellfish and algal organisms and eventually removed from the water column through fisheries harvest. This calculation ignores the carbon sinks formed by the release of particulate organic carbon (POC) and dissolved organic carbon (DOC) during the growth of shellfish and algae. Therefore, the carbon sink estimation model used in this paper refers to Yang et al.’s [7] research results.

3.2.1. Estimation of Carbon Sinks of Mariculture Shellfish

Through carbon source tracking, it was found that the main source of carbon in shellfish shells is dissolved inorganic carbon (DIC) in seawater. About 10% to 20% of the carbon comes from marine POC and DOC. Furthermore, more than 97% of the carbon in soft tissue comes from POC, DOC, or marine sediments in seawater [41]. The carbon in both seawater POC and DOC is organic carbon. These carbons are directly absorbed in shellfish organisms and cannot directly reduce C O 2 in the atmosphere or DIC in seawater and other inorganic carbons, so they are not included in the carbon sink estimation model. This part of carbon is directly absorbed in shellfish organisms and cannot directly reduce C O 2 in the atmosphere or DIC in seawater and other inorganic carbons, so it is not included in the carbon sink estimation model. Carbon from marine sediments is stored relatively long term and stably in seawater, and removing it from water by harvesting shellfish does not affect reducing C O 2 in the atmosphere and should not be included in carbon sink estimation models. Therefore, in this paper, part of the carbon in shells and carbon in soft tissues of shellfish are not considered as carbon sinks.
According to the shellfish carbon budget equation, shellfish total dietary carbon (TDC) can be decomposed into fecal carbon (FC), excretion carbon (EC), respiration carbon (RC), and growth carbon (GC). Among them, the proportion of RC in TDC is relatively stable, generally about 50%. FC and EC together accounted for 25% of shellfish TDC, while GC accounted for about 25%. The ratio of FC + EC to GC is about 1, from which the POC released during shellfish growth can be deduced.
In summary, the total carbon sink of marine shellfish aquaculture can be calculated based on the following model:
C i s = P i s h · R i s · w i s · ( 1 ε i )
C i s t = P i s h · R i s t · w i s t
C i P O C = ( C i s 1 ε i + C i s t ) · F C + E C G C · γ P O C
T C s h = i ( C i s + C i P O C )
T C C O 2 s h = T C s h · ω
where the carbon sink of shellfish cultivation T C s h   consists of two parts: the shell carbon sink C i s and the carbon sink C i P O C formed by the release of POC during the growth of the shellfish. ω is a constant for converting carbon into C O 2 . Carbon C i s t in soft tissue is not considered as a carbon sink. i represents the species of shellfish. P i s h represents the shellfish yield (wet weight), R i s represents the dry weight ratio of the shell, and w i s represents the carbon content of the shell. 1 ε i represents the conversion factor of shell carbon source, and ε i represents the proportion of carbon in the shell from organic carbon or marine sediment to the total shell carbon. R i s t represents the dry weight ratio of soft tissue, and w i s t represents the carbon content of soft tissue. C i P O C is based on shellfish growth carbon data, measured using the scaling relationship of F C + E C G C = 1 in the carbon balance equation. γ P O C represents the conversion ratio from POC to carbon sinks.

3.2.2. Estimation of Carbon Sinks of Mariculture Algae

The main carbon sequestration mechanism of macroalgae is photosynthesis, but the carbon that is ultimately removed from the water is not all of the macroalgae’s photosynthetic productivity. Due to effects such as kinetic erosion and sedimentation during harvest, macroalgae release a large amount of POC into the water column, releasing about 19% of their photosynthetic productivity. In addition, during the macroalgae growth, DOC is released into the water column, and the amount released is about 5% of their photosynthetic productivity. Part of the POC and DOC released by macroalgae to the water body will be used by marine organisms and returned to the atmosphere by microbial decomposition and respiration. The other part is converted to marine sediment or recalcitrant dissolved organic carbon (RDOC) by mechanisms such as vertical transport and sedimentation, thus storing carbon in the ocean for a long time to form a carbon sink.
Therefore, the carbon sink of marine algae culture includes the carbon sink of algae and the carbon sink formed by algae through the release of POC and DOC. The total carbon sink of mariculture algae can be measured using the following equation:
C j a = P j a l · w j a
C j P O C = C j a · α 1 α β · γ P O C
C j D O C = C j a · β 1 α β · γ D O C
T C a l = j ( C j a + C j P O C + C j D O C )
T C C O 2 a l = T C a l · ω
where the total carbon sink of seawater algae cultivation T C a l consists of the algal bodies’ carbon sink C j a , the carbon sink C j P O C and C j D O C formed by the algae through the release of POC and DOC. ω is the constant for the conversion of carbon to C O 2 and j represents the species of algae. P j a l is algal production (dry weight) and w j a is algal carbon content. α and β represent the share of POC and DOC released during algal growth in photosynthetic productivity, respectively. γ P O C and γ D O C reflect the rate at which POC and DOC released by organisms are eventually converted into carbon sinks, respectively.

3.3. Calculation of Net Carbon Emissions

Based on the carbon emission characteristics of marine fishery production activities, the formula for calculating the net carbon emissions of marine fisheries can be obtained.
C n e t = Q C O 2 ( T C C O 2 s h + T C C O 2 a l )
That is, the net carbon emissions from marine fisheries are the difference between carbon emissions from fuel consumption by motorized fishing vessels and the carbon sinks formed by shellfish and algae farming.

3.4. Decomposition Analysis of Influencing Factors of Net Carbon Emission

The main methods for decomposing the factors influencing carbon emissions include the environmental Kuznets curve (EKC), IPAT model, STIRPAT model, and LMDI method. The EKC approach shows an inverted U-shaped relationship between environmental quality and income, limited by the relationship and indicators. IPAT is a linear analytical model, but the environment and the level of social development are often not simply linearly related. The STIRPAT model overcomes the limitations of the homogeneous linear relationship of the IPAT model. However, it cannot wholly decompose the residuals. Compared to other methods, the LMDI method can complete decomposition without residuals and is less restrictive on the data. Hence, this paper uses the LMDI method to identify the drivers of net carbon emissions [29]. Previously, the net carbon emissions from marine fisheries were decomposed into the following form, drawing on the principle of two-sided constancy of Kaya’s constant equation [42].
C n e t = C n e t G · G Y · Y E · E
where C n e t is the net carbon emission of marine fisheries, G is the economic output value of marine fisheries, Y is the fishing production, and E is the number of employees. By Equation (15), the net carbon emissions of marine fisheries can be decomposed into four factors: carbon intensity ( C i n t ), industrial structure ( C s t r ), industrial efficiency ( C e f f ), and industrial scale ( C s c a ).
C n e t = C i n t · C s t r · C e f f · C s c a
In this paper, the change in net carbon emissions from the base year to the target year Δ C n e t is decomposed using the LMDI additive decomposition in the form of Equation (17).
Δ C n e t = C n e t t + 1 C n e t t = Δ C i n t + Δ C s t r + Δ C e f f + Δ C s c a
In Equation (17), t represents the year. The net carbon emissions are decomposed into four factors, and the impact of each factor on the net carbon emissions can be measured specifically. The detailed calculations on these four factors are as follows:
Δ C i n t = L ( C n e t t + 1 , C n e t t ) · ln ( C i n t t + 1 C i n t t )
Δ C s t r = L ( C n e t t + 1 , C n e t t ) · ln ( C s t r t + 1 C s t r t )
Δ C e f f = L ( C n e t t + 1 , C n e t t ) · ln ( C e f f t + 1 C e f f t )
Δ C s c a = L ( C n e t t + 1 , C n e t t ) · ln ( C s c a t + 1 C s c a t )
L ( C n e t t + 1 , C n e t t ) = { C n e t t + 1 C n e t t l n C n e t t + 1 l n C n e t t   C n e t t + 1 C n e t t C n e t t + 1   o r   C n e t t   C n e t t + 1 = C n e t t   0   C n e t t + 1 = C n e t t = 0

3.5. Data Sources

In this paper, nine coastal provinces in China were selected for the study. Hong Kong, Macau, and Taiwan were excluded due to data availability difficulties. Shanghai and Tianjin were also excluded from this paper due to the small size of their marine fishery industries and the large gap with other provinces. The data required for the calculation, such as shellfish and algae production, were obtained from the China Fishery Statistical Yearbook and the China Marine Economic Statistical Yearbook. The parameters of shellfish and algae referred to the research results of [7,8,40,43]. The parameters used are listed in Table 1.
To calculate the carbon sink of marine fisheries, process parameters, such as the shell carbon source conversion coefficient 1 ε , POC carbon sink conversion coefficient γ P O C , and DOC carbon sink conversion coefficient γ D O C , are also needed. Referring to Quan et al. [41], the source of carbon in shells as organic carbon or marine sediment accounted for about 20% of the total carbon in shells, and the conversion coefficient 1 ε for shell carbon sources was 0.8. Drawing on [7], the values of γ P O C and γ D O C were 1, and the values of α and β were 0.19 and 0.05, respectively. To calculate carbon emissions from marine fisheries, fuel consumption factors for fishing vessels with different modes of operation are also needed. The specific oil consumption coefficient was based on the Reference Standard for the Measurement of Oil Consumption for Domestic Motor Fishing Vessel Oil Price Subsidy issued by the Ministry of Agriculture of China. The oil coefficient for trawl was 0.480(t/kw), for seine was 0.492(t/kw), for gill net was 0.451(t/kw), for stow net and fishing gear was 0.328(t/kw), for others was 0.312 (t/kw), and for farm fishing vessel was 0.225(t/kw).

4. Results

4.1. Spatial–Temporal Evolution Characteristics at the National Level

Analyzing the data related to carbon emissions and carbon sinks at the national level can provide a theoretical basis for the government to formulate policies. The carbon emissions, carbon sinks, and net carbon emissions of marine fisheries in China from 2005 to 2020 were calculated and the results are shown in Table 2. From 2005 to 2020, China’s carbon emissions from the marine fishery industry increased by 12.75% from 16.647 million tons to 18.770 million tons. Carbon sinks increased from 7.860 million tons to 11.667 million tons, an increase of 48.44%. Net carbon emissions decreased from 8.786 million tons to 7.104 million tons, a reduction of 19.14%. It can be found that the carbon sinks grew more than the carbon emissions, so the net carbon emission was reduced. This result indicates that the pressure on the environment from China’s marine fisheries is decreasing but there is still a certain distance from the goal of carbon neutrality. The increase in carbon sinks far outweighed carbon emissions, suggesting that China has made many efforts to reduce carbon emissions from marine fisheries.
Figure 1 shows the trends of carbon emissions, carbon sinks, and net carbon emissions from marine fisheries in China. As can be seen from Figure 1, the overall trend of carbon emissions from marine fisheries rose and fell, reaching a peak in 2015. In 2016, China proposed the 13th Five-Year Plan for National Fisheries Development. Since the implementation of the plan, under the principle of “ecological priority and green development”, China’s marine motorized fishing vessels have been reduced, and the green development of marine fisheries has been promoted. The reduction in carbon emissions illustrates the effectiveness of this planning. The overall trend of carbon sinks from marine fisheries was on the rise but there was a decline in 2007. During the 11th Five-Year Plan and 12th Five-Year Plan periods, the carbon sink capacity of China’s marine fishery increased significantly. In this period, the Chinese government attached great importance to the work of the “three issues of agriculture, the countryside and farmers” and adopted a policy of “high investment” in marine fisheries. The government had proposed policies, such as subsidies for fisheries diesel fuel and fishery resource protection. All these policies have contributed to the improvement of the carbon sink capacity of marine fisheries. By the 13th Five-Year Plan period, the increase in carbon sinks had slowed down. A possible reason was that the expansion of the scale of shellfish and algae farming resulted in too high a farming density, which reached the upper limit of the environmental carrying capacity of marine resources. The policy direction began to change at this time, with the government focusing on optimizing and upgrading the marine industry and implementing a policy of negative growth in offshore fishing production. Net carbon emissions were on an overall downward trend, with one significant increase in 2007. This rise was due to the decline in carbon sinks in 2007. From 2018 onwards, the downward trend in net carbon emissions began to stabilize.

4.2. Spatial–Temporal Evolution Characteristics from the National Perspective

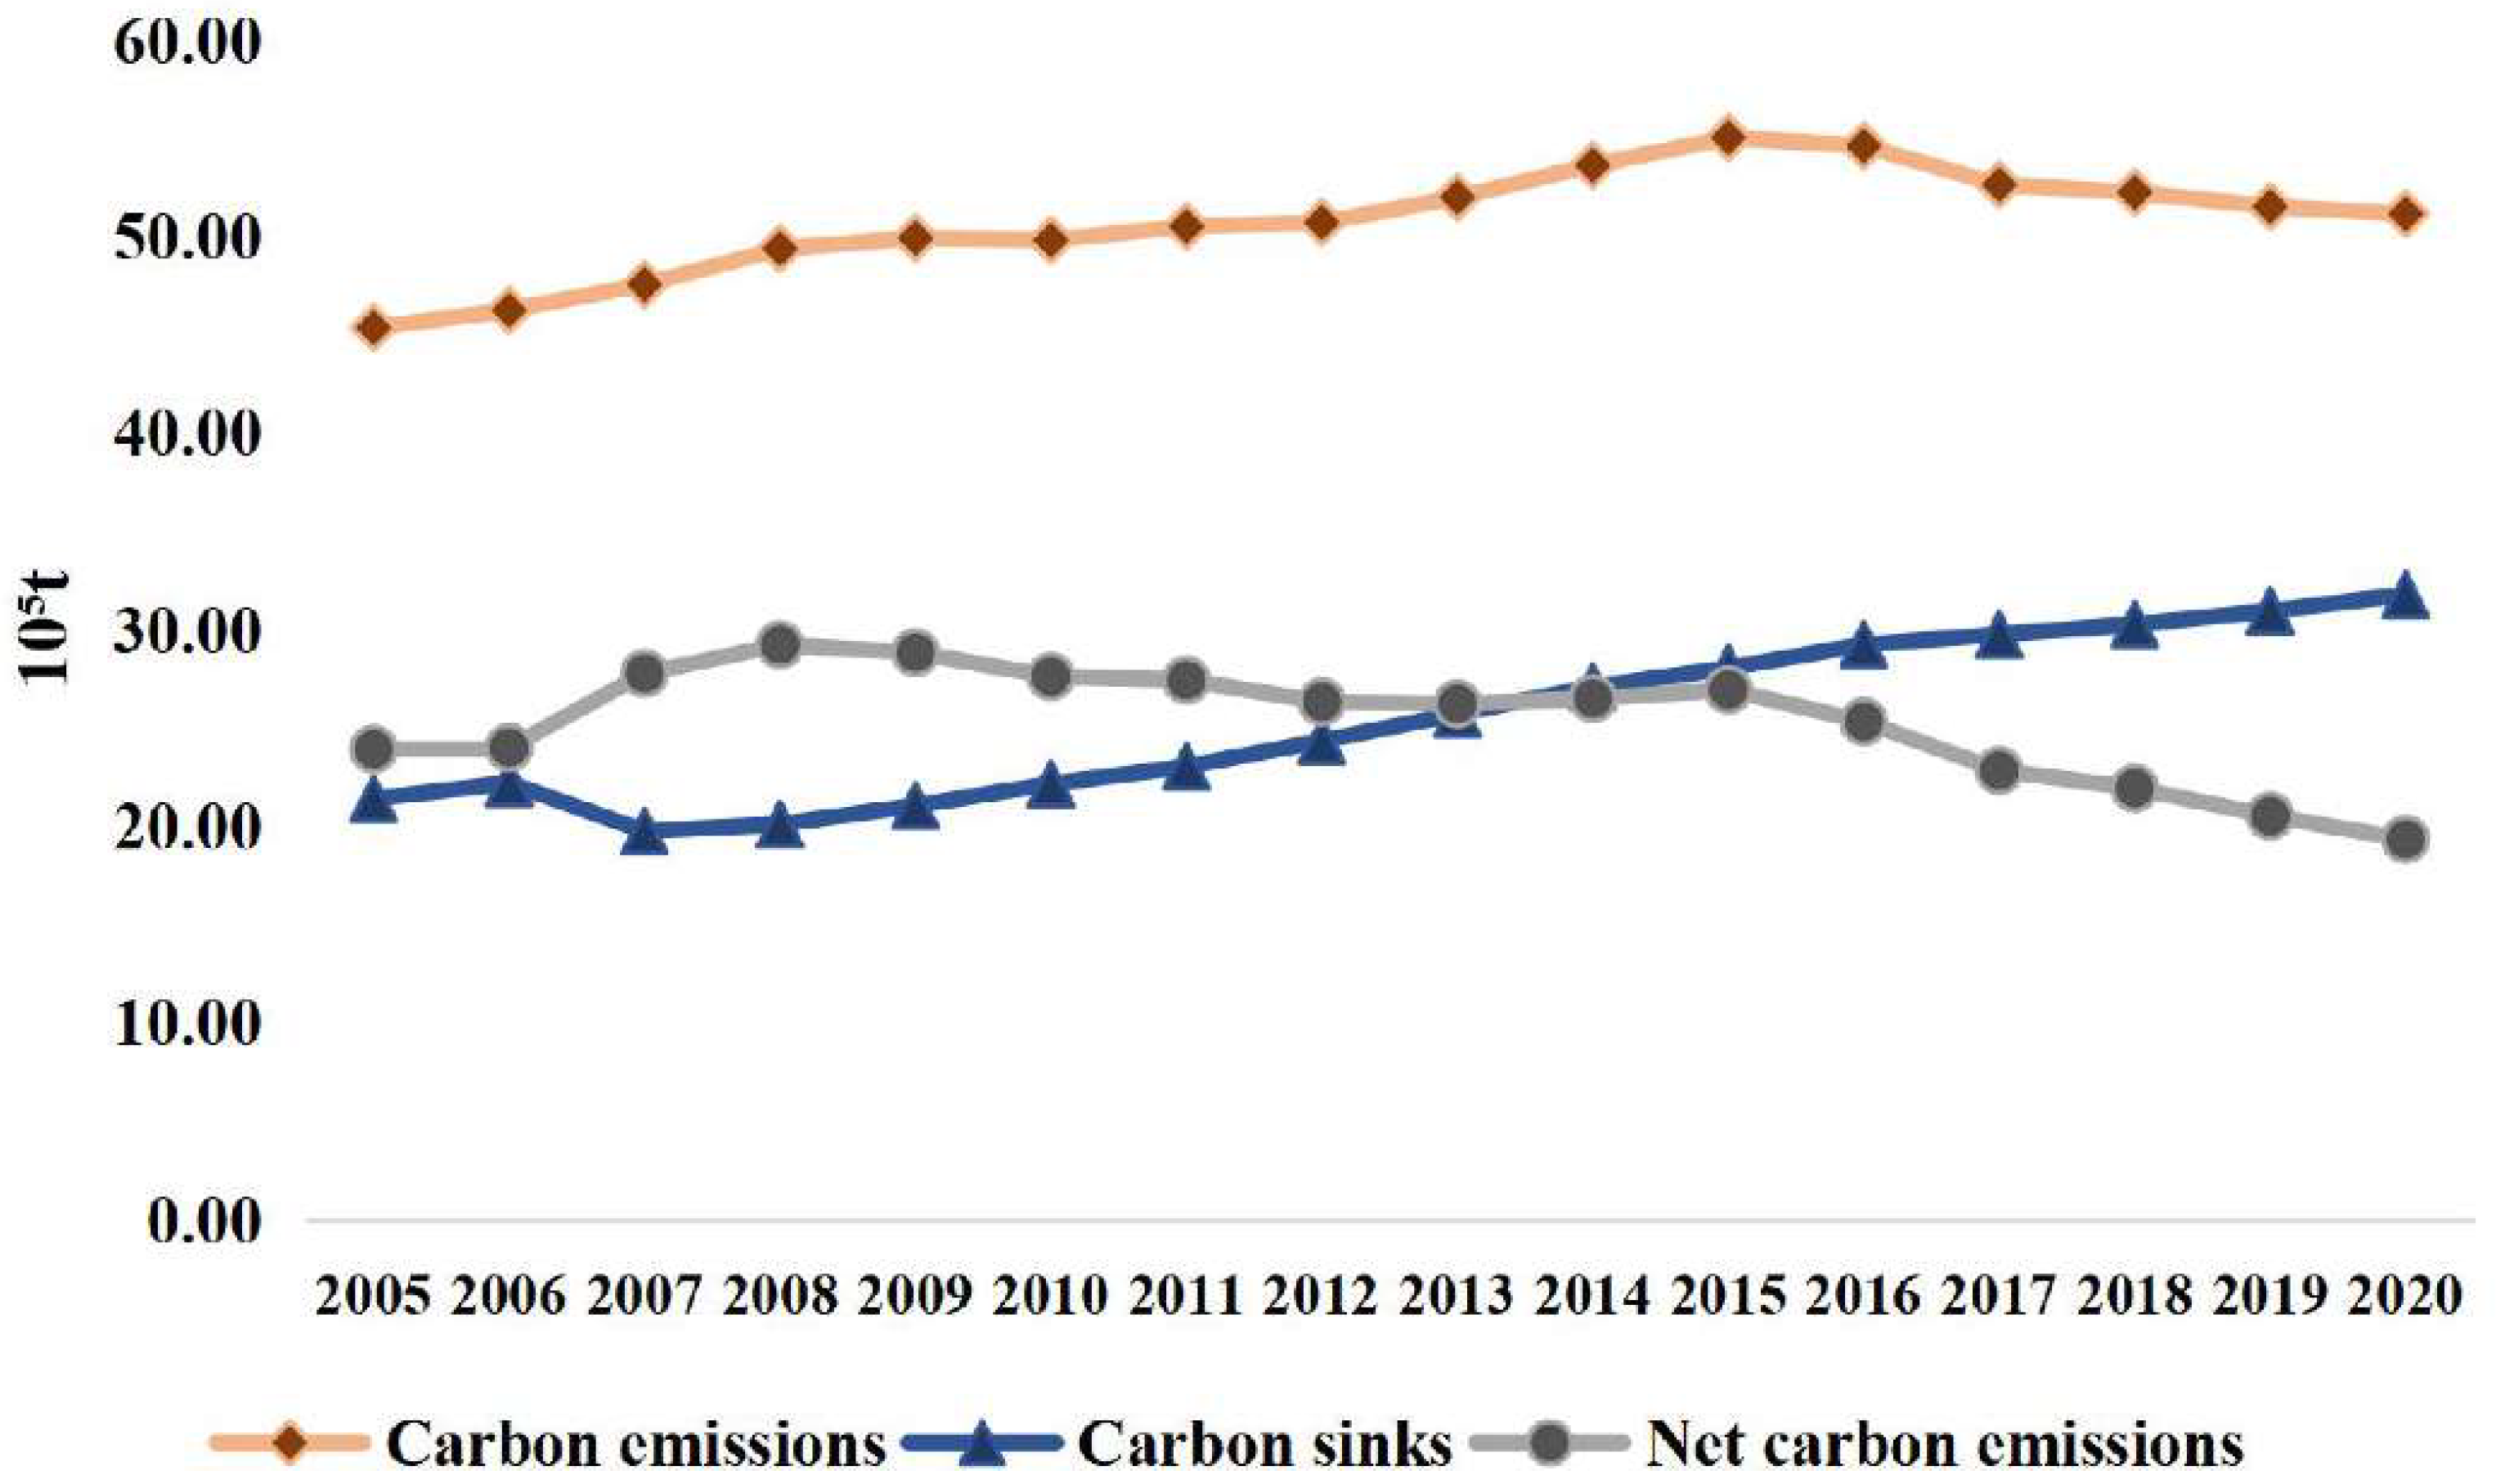
The coastal provinces differ in their level of economic development, geographic location, and climatic conditions. Therefore, they also show different locational characteristics in the development of marine fisheries. To further understand the spatial and temporal evolution of carbon emissions, carbon sinks, and net carbon emissions, the following analysis is carried out at the provincial level.

4.2.1. Provincial Characteristics of Carbon Emissions

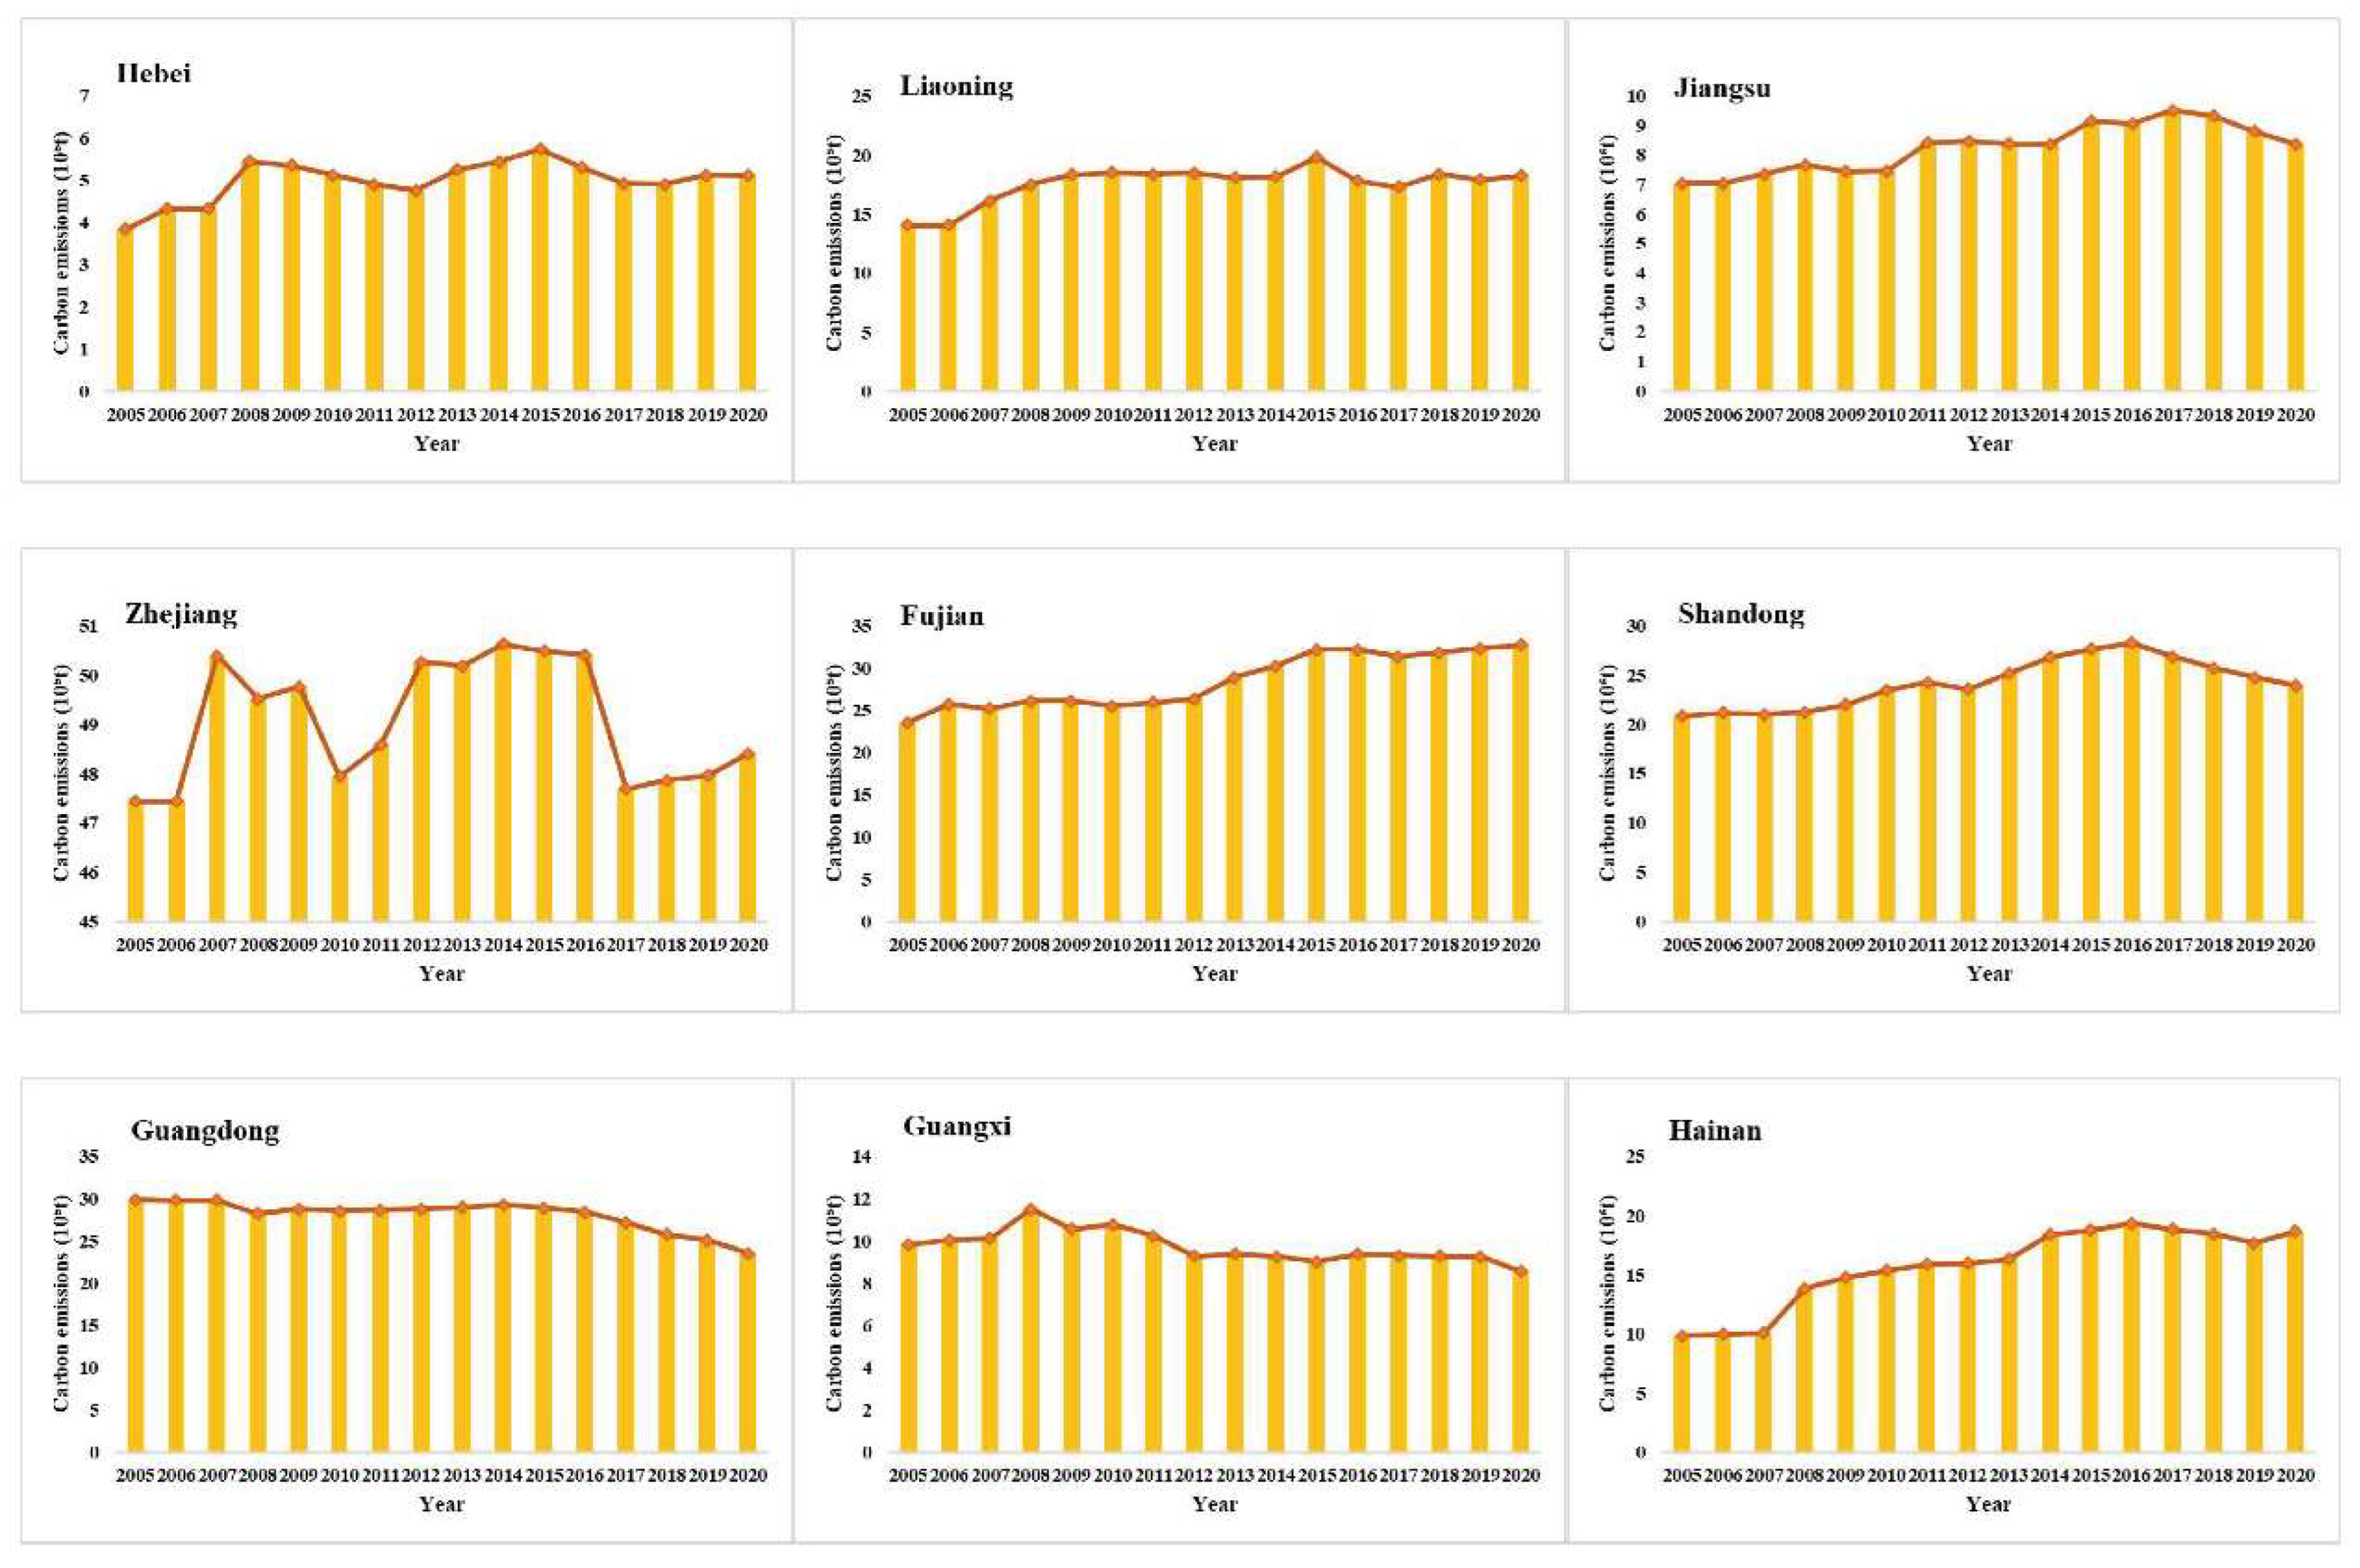
Table 3 shows that, among the nine Chinese coastal provinces, only Guangdong and Guangxi showed a decreasing trend in overall carbon emissions. Carbon emissions increased in the remaining seven provinces, and the most significant increase was seen in Hainan. In 2005, Zhejiang had the largest carbon emissions, reaching 4.744 million tons. While this total was much higher than other provinces, Zhejiang’s growth and increment were better compared with other provinces. The province with the least carbon emissions was Hebei, which was also related to the smaller farming scale in Hebei. The increase in Hebei was relatively large, which indicates that Hebei’s marine fishery needs to increase the implementation of energy conservation and emission reduction. In 2020, the provinces with the most and least carbon emissions were still Zhejiang and Hebei, but the gap between the two had narrowed. The province with the largest increase in carbon emissions was Hainan. Although Hainan’s carbon emissions were not high among the nine provinces, they had almost doubled from 2005 to 2020. Therefore, the carbon emission reduction work of China’s marine fishery can be appropriately tilted to Zhejiang and Hainan.
Figure 2 can reflect the trend of carbon emissions in nine provinces during this period. Regionally, the northern provinces include Liaoning, Hebei, and Shandong; the eastern provinces include Jiangsu and Zhejiang; and the southern provinces include Fujian, Guangdong, Guangxi, and Hainan. Carbon emissions were increasing in both the northern and eastern provinces, with the southern provinces performing better than the other two regions.
Most of the provinces showed slight fluctuation, but the trend of fluctuation was obvious in Zhejiang and Hebei. Since 2005, Zhejiang has implemented the upgrading and technological transformation of its shipbuilding industry, erasing the former of its shipbuilding as “small, scattered and low”. However, the rapid development of Zhejiang’s shipbuilding enterprises also made its carbon emissions be firmly at the forefront of China. In 2007 and 2012, there was a significant increase in carbon emissions in Zhejiang. In 2011, the State Council of China approved the Zhejiang Marine Economic Development Demonstration Zone Plan, which elevated the construction of marine economic development demonstration zones to a national strategy. This plan has driven the expansion of factory farming areas in Zhejiang, leading to a rapid increase in carbon emissions. Aquaculture engineering and equipment integration support was not enough, and it restricted, to a certain extent, the implementation of carbon emission reduction in Zhejiang marine fisheries. In 2008, Hebei’s carbon emissions increased significantly. On the one hand, Hebei continued to promote factory farming, excellent breeding selection, and other technologies. On the other hand, Hebei’s investment in science and technology for marine fisheries was weak. These factors led to notable fluctuations in Hebei’s carbon emissions. During the 11th Five-Year Plan period, Hebei promoted the transformation of marine fishery development from a quantity–speed type to a quality–benefit type. As a result, Hebei’s carbon emissions reduced for a period, starting in 2008. Yet, the shortage of scientific and technical personnel and the outdated instrumentation of Hebei’s marine fisheries caused a high growth rate of its carbon emissions.
Guangdong’s carbon emissions were on a steady downward trend. As a major aquatic province in China, Guangdong’s factory farming area was expanding. Nevertheless, Guangdong’s carbon emissions decreased rather than increased, indicating the healthy development of Guangdong’s marine fisheries. Guangdong strictly controlled its fishing intensity, promoted high-yield and low-consumption operations, and vigorously developed “deep blue fisheries” to achieve resource conservation and environmental friendliness. In addition to Guangdong, the carbon emissions of Guangxi were also declining. Guangxi had only one significant increase in emissions in 2008. The power of motorized fishing vessels in Guangxi was high that year, and then it started to fall back. In recent years, the marine fishing system in Guangxi gradually became more established, and the structure of fishing vessel operations became more reasonable, so carbon emissions showed a decreasing trend. Guangxi actively established fishery science and technology innovation platforms and accelerated the technical research and promotion application of marine fishery. Guangxi has a wealth of marine fisheries resources but they are currently underutilized and have great potential for development. When vigorously developing these fishery resources, Guangxi needs a good resource and ecological monitoring system to ensure the smooth development of the fishery.
The carbon emissions of Fujian and Hainan had been growing steadily. Fujian started to build the modern marine industry development base in 2009, which provided an opportunity to develop its marine fishery. Fujian has abundant water resources and a relatively complete fishery infrastructure in terms of fishery development. However, in developing marine fisheries, Fujian should pay attention to industrial structure optimization and expand its advantages. Hainan has been continuously optimizing the internal structure of fisheries and accelerating infrastructure construction in recent years. However, due to insufficient investment in fishery science and technology and a lack of talents, there was still a big gap between the development of its fishery and the more advanced provinces. Consequently, Hainan needs to increase investment in scientific research, strengthen the support force of science and technology, and control carbon emissions while developing marine fisheries.
The carbon emissions of Liaoning, Jiangsu, and Shandong were also fluctuating, but the fluctuation was not as noticeable. These provinces all attached great importance to the development of marine fisheries but were still searching for a development model suitable for themselves. During the 13th Five-Year Plan period, Liaoning issued the “Guiding Opinions on the Development of Fishery Industry in Liaoning Province”, highlighting that Liaoning needs to speed up the transformation of the fishery development model. In this period, Liaoning has increased scientific investment in areas such as marine engineering equipment and energy, and it has carried out essential technology research. New fishery species, marine robots, and other marine science and technology achievements have emerged one after another. As a result, there was a period of decline in Liaoning’s carbon emissions from 2016 onwards. Liaoning has a good foundation of marine resources and is actively developing ecologically healthy aquaculture and sustainable fishing. However, while developing marine fisheries, Liaoning needs to speed up the construction of fishery infrastructure and reduce the pollution of carbon emissions to the environment. As an important part of the Yangtze River Delta region, Jiangsu has convenient logistics channels for developing marine fisheries. Jiangsu released a special action plan for marine fisheries in 2017 stating the aim of reducing the environmental impact of fisheries production. Jiangsu launched a fishing boat renovation program. Jiangsu eliminated old fishing boats, renovated several energy-consuming and inefficient fishing boats, updated a group of high-quality marine fishing boats, and completed the establishment of safety equipment for fishing boats. Consequently, carbon emissions in Jiangsu declined from 2017 onwards. Since the implementation of the marine fishing vessel renewal project in 2012, Shandong has improved the quantity and quality of fishing vessels through construction and renovation. As a result, there was a marked increase in carbon emissions in Shandong. In 2016, Shandong introduced the policy of oil price subsidy for fisheries fishing and aquaculture. This policy guided the fishing fishermen to reduce the number of vessels and to switch to production and ecological restoration, so that the number and power of fishing vessels were further reduced and fishing intensity was effectively controlled. The carbon emissions of Shandong’s marine fisheries have also been gradually reduced since 2016.
It can be noted that the fishery development gap between the provinces was gradually decreasing. Different provinces should rely on their resource endowments to seize the opportunity for marine fisheries development. While developing marine fisheries, provinces need to pay attention to the green and low-carbon concepts, form a stable development space, and reduce the environmental pressure on the ocean.

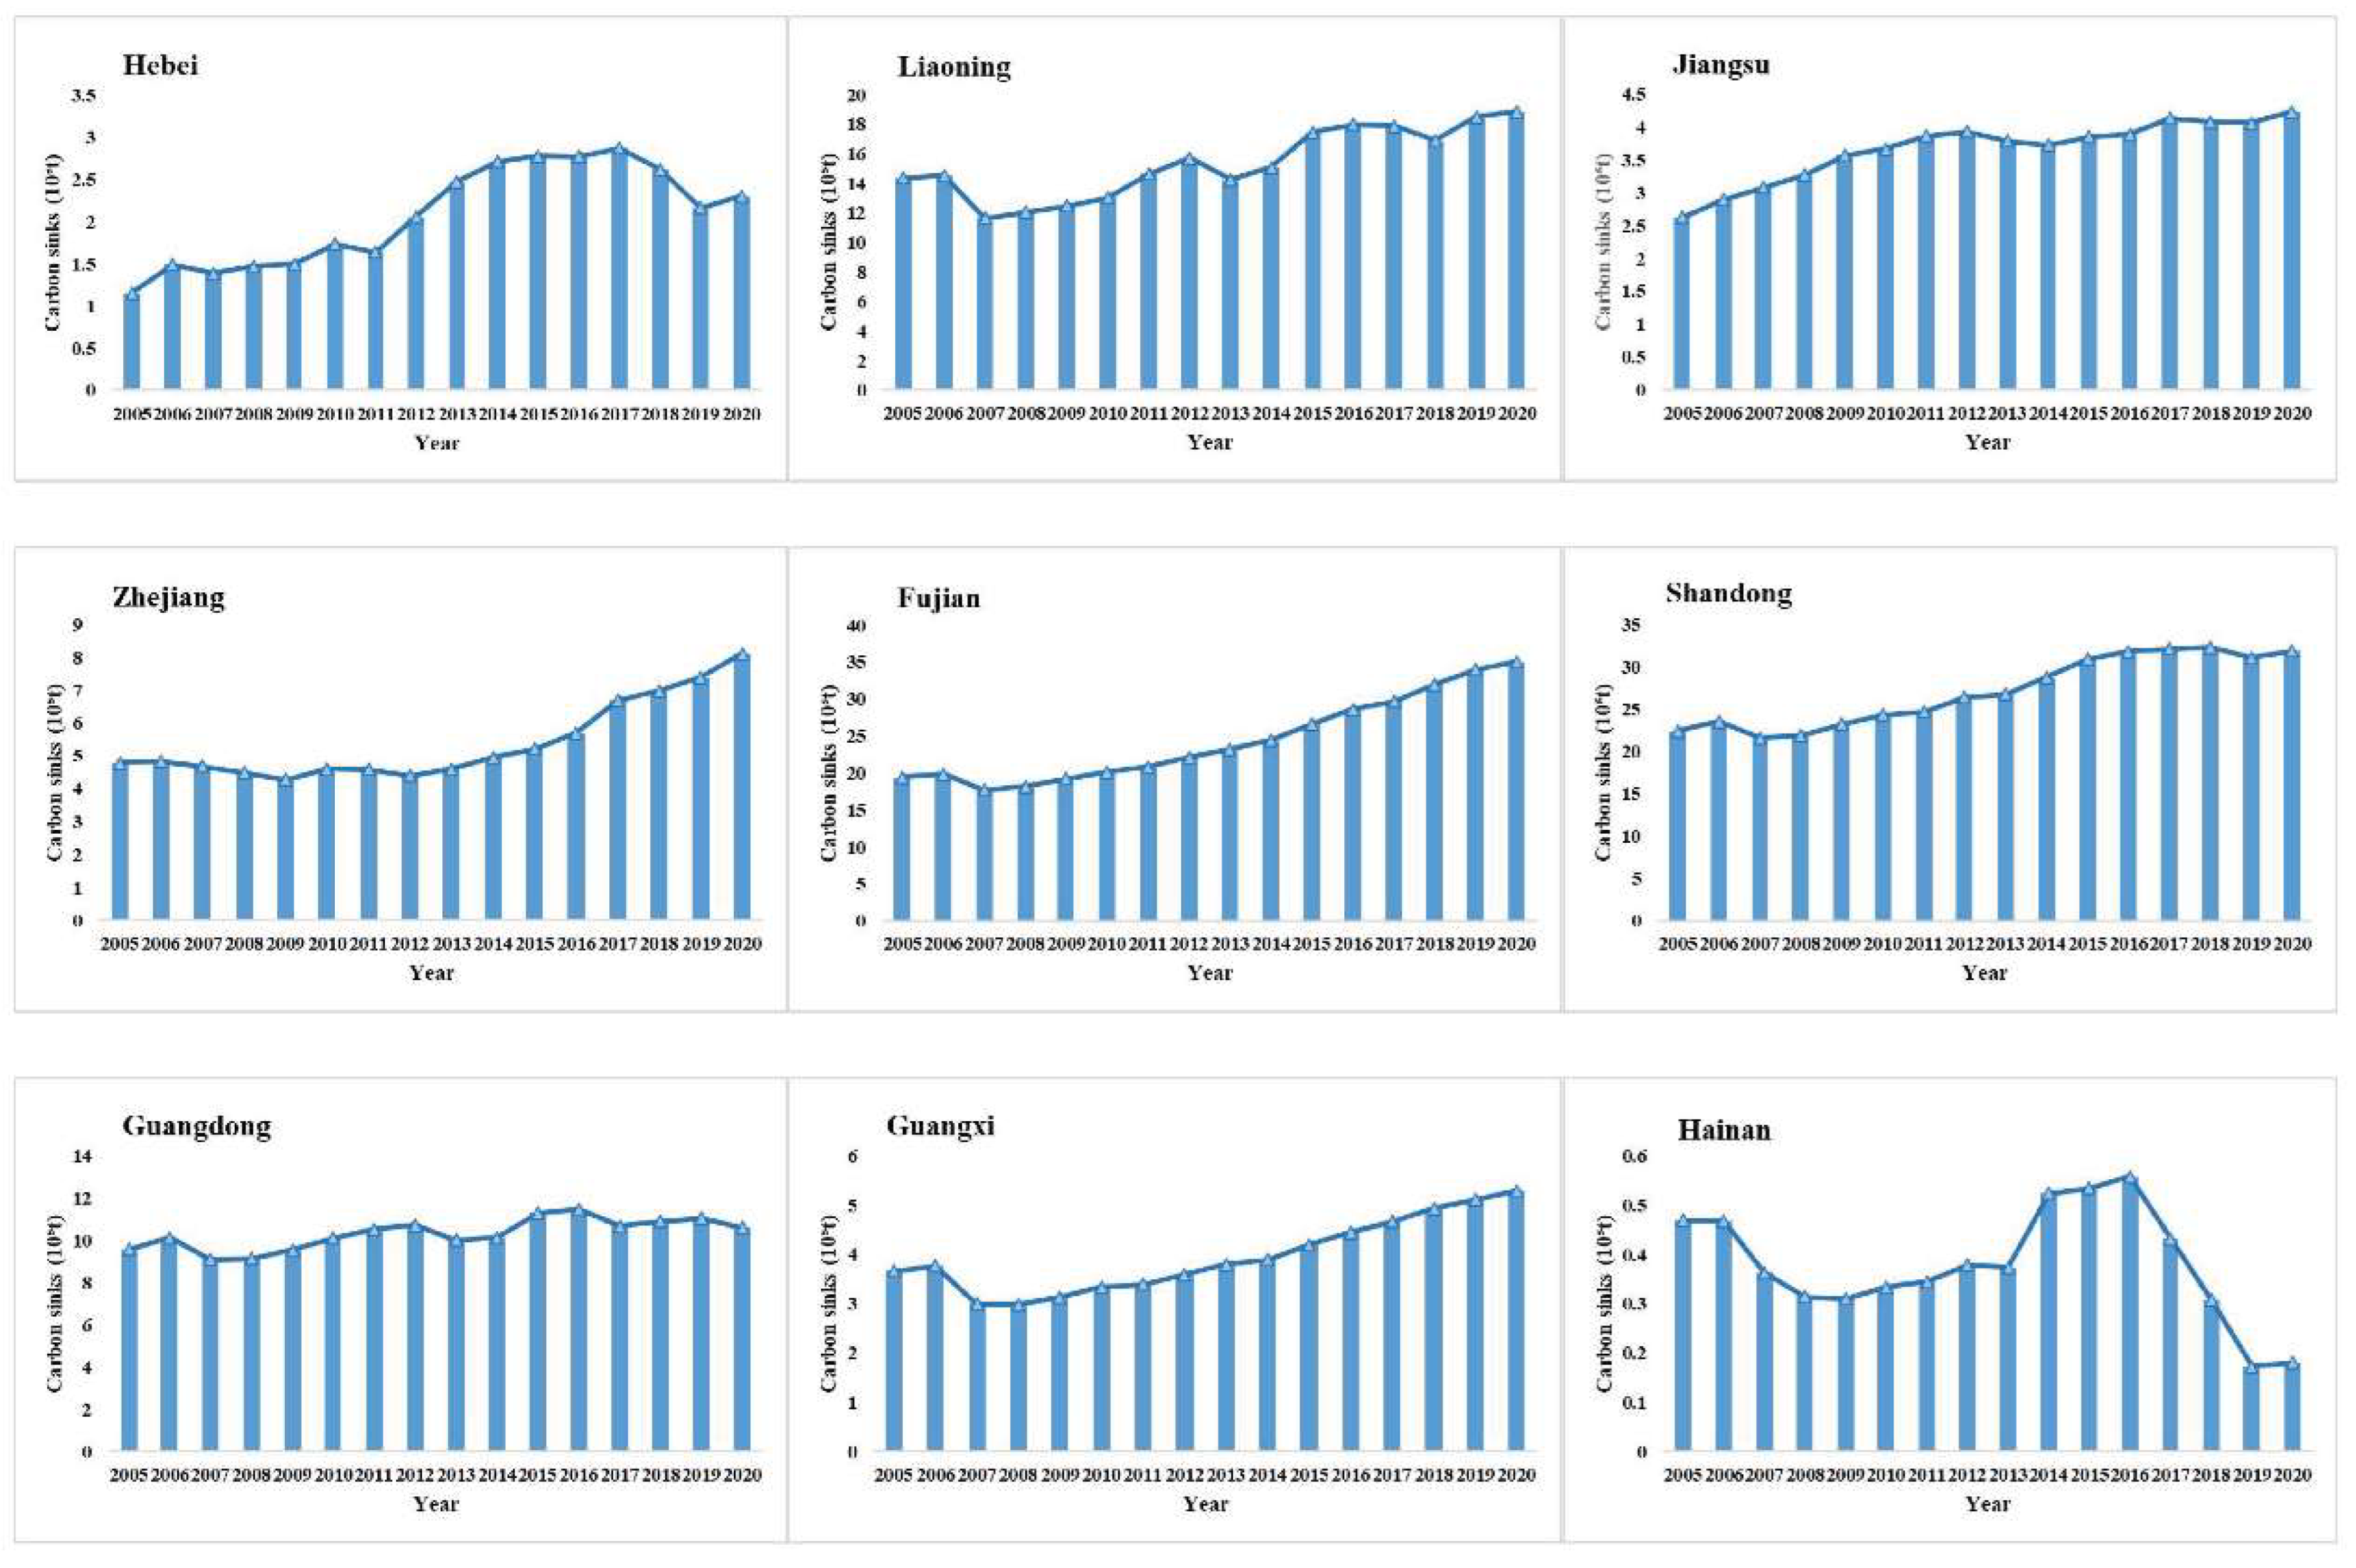
4.2.2. Provincial Characteristics of Carbon Sinks

As shown in Table 4, only the overall carbon sink of Hainan was on a decreasing trend. The remaining eight provinces saw an increase in carbon sinks, and Hebei had the most significant increase. In 2005, Shandong’s carbon sink was the largest, reaching 2.247 million tons. Hainan had the lowest carbon sink at 0.047 million tons, and its sink was still declining. In 2020, Fujian surpassed Shandong as the largest carbon sink, reaching 3.506 million tons. Hainan still had the lowest carbon sink, with only 0.018 million tons. The gap in carbon sinks between the coastal provinces was growing. The province with the largest increase in carbon sinks was Hebei, which almost doubled its carbon sinks in 2020 compared to 2005. In terms of both the number and the growth rate of carbon sinks, Hainan was lagging. Therefore, the shellfish and algae aquaculture in China’s marine fisheries requires increased efforts to promote Hainan.
Figure 3 reflects the changing trend of carbon sinks in nine coastal provinces from 2005 to 2020. The carbon sinks in the northern provinces of Hebei, Liaoning, and Shandong fluctuated and eventually showed an upward trend. The carbon sink values of Jiangsu and Zhejiang in the eastern provinces were not as good as those of other regions but were on the rise as a whole. Fujian has an abundant and steadily increasing carbon sink among the southern provinces.
The fluctuation trends of Hebei, Liaoning, and Hainan were evident. Shellfish farming is a significant pillar of Hebei’s fishing industry. Due to the rapid expansion of shellfish and algae farming in the northern marine economic circle during the 12th Five-Year Plan period, Hebei’s carbon sink increased steadily from 2011 to 2015. The expansion of the farming scale had led to high farming density in local areas of Hebei, approaching the upper limit of the carrying capacity of the marine environment. The environmental degradation of the sea area threatened the sustainable development of Hebei’s marine fisheries, and, as a result, Hebei’s carbon sink began to decline significantly in 2016. Liaoning published and implemented the Liaoning Modern Sea Ranch Construction Plan in 2011. Focusing on the goal of marine pasture construction, Liaoning carried out actions such as resource restoration and sea farming to guarantee the development of its farming scale. However, the environmental degradation of the northern marine economic zone had also affected shellfish and algae farming in Liaoning, leading to fluctuations in its carbon sink. Hainan’s marine economy has been focused on developing coastal tourism. With the construction of an international tourism island in Hainan, the land for fishing in Hainan was gradually reduced and the space for fishing development was squeezed. At the same time, the development of the Hainan farming industry accelerated the eutrophication of coastal waters, which negatively affected the ecological environment of coastal waters and restricted the sustainable development of the farming industry. As a result, the carbon sink of Hainan started to decline sharply in 2017, which eventually resulted in the carbon sink decreasing instead of rising.
The overall upward trend in Zhejiang, Fujian, Shandong, and Guangxi was relatively stable. As a pilot province for the development of China’s marine economy, the farming industry in Zhejiang has more development opportunities. In the 13th Five-Year Plan for marine ecological protection in Zhejiang Province, the government emphasized the need to actively develop shallow sea shellfish and algae ecological health culture models. Zhejiang implemented the shallow marine aquaculture space expansion project, guided the seawater pond recirculating water aquaculture and industrial recirculating water aquaculture, and developed offshore intelligent deep-water nets, large seine nets, and block nets. Consequently, between 2016 and 2020, the carbon sink in Zhejiang achieved rapid growth. With the development of port-side industries and accelerated urbanization in coastal areas, Fujian’s marine fisheries were gradually withdrawn from some traditional production areas. The fishery showed a trend of gradually increasing aquaculture output and decreasing fishing output yearly. To achieve sustainable growth of carbon sinks, Fujian should strengthen the construction of aquaculture facilities. Shandong has a vast ocean space and huge development potential. In recent years, the mariculture structure of Shandong was gradually optimized and production was steadily increased. However, in 2019 Shandong’s carbon sink had a fallback. Shandong can further improve the fisheries standards system and enhance the quality and safety of its aquaculture products. In the 11th Five-Year Plan period, Guangxi’s farming patterns were outdated, and the application of new farming patterns was not promoted much. Thus, Guangxi’s carbon sink declined in 2007. Guangxi is rich in fish farming resources, and its fishery economy’s structure and industrial layout are gradually being optimized. Guangxi established the monitoring system of the fishery ecological environment and increased the efforts of artificial breeding and releasing. As a result, the carbon sinks in Guangxi have increased steadily since 2008.
Jiangsu and Guangdong were the two provinces with insignificant fluctuation trends. Jiangsu built marine pastures offshore, created seaweed farms, and restored marine ecology, increasing the productivity of the sea. It can be seen that from 2006 to 2012, the carbon sinks in Jiangsu were steadily enhanced. However, the accelerated urbanization of Jiangsu has squeezed the development of fisheries, and the trend of increased pollution of waters and the decline of natural resources has not been fundamentally resolved. Jiangsu requires continuous strengthening of its marine living resources conservation efforts. Guangdong’s mariculture was at the leading position in China. Guangdong has taken “deep blue fisheries” as the focus of optimizing the structure of the fisheries industry. Moreover, Guangdong has established a “marine industrial zone” focusing on deep-water net tank farming. However, the performance of Guangdong’s carbon sinks was unstable and did not achieve a steady rise. In recent years, storm surges and red tide disasters have occurred in the coastal areas of Guangdong, and the government should focus on optimizing the resource environment of Guangdong’s fisheries.
It can be observed that the gap between the carbon sinks of each province was gradually widening. For provinces with more carbon sinks but unstable growth, the government should focus on marine environmental protection and promote the sustainable development of shellfish and algae farming. In provinces with low carbon sinks, the government can increase shellfish and algae farming to form more carbon sinks and neutralize the emitted carbon.

4.2.3. Provincial Characteristics of Net Carbon Emissions

Figure 4 shows the changes in net carbon emissions for the nine coastal provinces. Most provinces had positive net carbon emissions and were still far from the goal of carbon neutrality. Shandong performed best and had negative net carbon emissions every year, which indicates that Shandong’s marine fisheries have reached the carbon neutral target. As a major marine fisheries province, Shandong has been a national leader in the construction of marine pastures. Shandong vigorously developed the marine engineering manufacturing industry and completed the ship repair base. In the meantime, Shandong’s marine fishery products had remarkable structural advantages, with the expansion of the healthy aquaculture industry and technical training of fishermen. Next was Fujian, whose net carbon emissions had been negative since 2018. Fujian had strong marine universities and research institutes and sufficient marine talent resources, which laid a good foundation for the scientific and technological development of its marine fisheries. In the field of marine fishery farming and fishing, Fujian’s scientific and technological achievements have produced favorable economic and social benefits and contributed to Fujian’s achievement of the carbon neutrality target. Liaoning also reached carbon neutrality in 2005, 2006, 2016, 2017, 2019, and 2020. Liaoning has constantly built innovation platforms in the marine field and increased its talent training efforts, providing strong technical and talent support to reach its carbon neutrality target. The remaining provinces had consistently positive net carbon emissions. The worst performing provinces were Zhejiang and Hainan. The carbon sinks in these two provinces were too small to offset the emissions of C O 2 . As a large-scale province of marine fishery resources, Zhejiang had low efficiency in the transformation of scientific and technological achievements. Due to the lack of incentive policies and financial support, it was not easy to promote the achievements of Zhejiang’s marine fishery, and new technologies could not be industrialized. Hence, the C O 2 emissions from Zhejiang’s marine fishery far exceeded the carbon sink it created. The industrialization level of the marine fishery in Hainan was not high, and the various links of fishery production failed to realize effective links. Hainan’s marine science and technology forces were weak, with a lack of talent and scattered research institutions. These factors have affected the impact of the comprehensive advantages of Hainan. Shandong’s shellfish and algae aquaculture industries have been developing well and can form excess carbon sinks to absorb C O 2 from the atmosphere. However, China cannot rely on Shandong alone to achieve its goal of carbon neutrality. Other provinces need to effectively use marine ecosystems to absorb C O 2 and achieve long-term carbon storage in the ocean.

4.3. Analysis of Net Carbon Emissions Drivers

Taking 2005 as the base period, the drivers of net carbon emissions from marine fisheries were decomposed by the LMDI model. The year-by-year and cumulative effects of each driving factor were calculated in Table 5. From Table 5, it can be seen that the positive and negative driving effects of net carbon emissions from marine fisheries are relatively uneven, with carbon intensity and industrial structure being the main contributors to net carbon emissions. Carbon intensity purely suppressed net carbon emissions, while industrial structure purely promoted net carbon emissions.
Carbon intensity effect ( C i n t ) : carbon intensity was the main negative driver of net carbon emissions. As the negative driver with the highest cumulative contribution, the increase in carbon intensity played a greater role in restraining net carbon emissions. The year-by-year effect had a higher degree of influence on the changes in net carbon emissions, and all of them were negative. Overall, the negative pull of the carbon intensity effect on net carbon emissions was increasing. This indicates that China’s marine fishery development is gradually approaching low carbon development.
Industrial structure effect ( C s t r ) : industrial structure was the main positive driver of net carbon emissions. The effect was positive for all years except 2011. Specifically, the industrial structure drove the growth of net carbon emissions. In most years, the effect of carbon intensity was stronger than that of industrial structure. This implies that the net carbon emissions promoted by industrial structure could be offset by carbon intensity. The adjustment of the industrial structure did not achieve the expected effect of emission reduction and there is still much space for improvement.
Industrial efficiency effect ( C e f f ): in different years, industrial efficiency had both positive and negative effects on net carbon emissions. The final cumulative contribution of industrial efficiency to net carbon emissions was negative. The negative driving effect of industrial efficiency on net carbon emissions was apparent in 2007, 2008, and 2017. This suggests that the improvement of industrial efficiency was one of the factors that curbed net carbon emissions.
Industrial scale effect ( C s c a ): industrial scale also had both positive and negative effects on net carbon emissions, with a positive contribution most of the time. The contribution of industrial scale to net carbon emissions was more pronounced in 2008 and 2011. From this, it can be assumed that part of the increase in net carbon emissions from marine fisheries was due to the expansion of the industrial scale. This means that it is not desirable to blindly increase the number of employees and that the population should be reduced by an appropriate amount while meeting production needs.

5. Discussion

From Figure 1, it can be seen that the development trend of net carbon emissions of China’s marine fisheries was smooth and conformed to the linear change characteristics. So, in this section, a linear function is used to fit its variation pattern and predict whether China’s marine fisheries can reach the carbon neutrality target by 2060. Based on the results of the driver analysis in this paper and existing literature references, three independent variables were identified: economic output ( X 1 ), fishing production ( X 2 ), and energy consumption ( X 3 ). According to the fitting results, the trends of marine fisheries’ net carbon emissions are as follows:
y ^ = 1.23 X 1 13.29 X 2 + 28.33 X 3 89.72   ( R 2 = 0.95 )
According to the analysis results, when X 1 , X 2 , and X 3 are the data for the base year 2005, the net carbon emission of China’s marine fishery is 8.897 million tons. Based on the actual development of China’s marine fishery and the data obtained in this paper, relevant variables are set as follows: the annual growth rates of economic output, fishing production, and energy consumption are 3%, −5%, and 1%, respectively. Estimated by the fitted model, the net carbon emissions from marine fisheries will be 0.118 million tons by 2069. By 2070, the net carbon emissions of marine fisheries will be −0.407 million tons, reaching a carbon neutral state. This result falls short of China’s current goal of achieving carbon neutrality by 2060, exceeding it by 10 years. Based on this model, this paper introduces the influence of policy factors. Assuming that China’s marine fisheries fully implement the carbon emission trading policy in 2025, it will increase economic output and reduce energy consumption. Therefore, from 2025, the annual growth rates of economic output and energy consumption are set at 3.5% and 0.75%, respectively. Assuming that the marine fishery fully implements the carbon tax policy in 2030, it will further increase economic output and reduce energy consumption. So, from 2030, the annual growth rates of economic output and energy consumption are set at 4% and 0.5%, respectively. According to the data, after the policy is implemented, the net carbon emissions from marine fisheries will be 0.169 million tons by 2047. By 2048, the net carbon emissions of marine fisheries are −0.461 million tons, reaching the carbon neutrality target ahead of schedule. As a result, the emission reduction efforts of marine fisheries still need to take focused policy measures to promote the achievement of the carbon neutrality goal.
Compared to the traditional “removable carbon sink” model [44], excluding the DOC and POC sinks formed during the growth of shellfish and algae would underestimate the carbon sink capacity of marine fisheries by 37.94%. Thus, it is necessary to consider DOC and POC carbon sinks formed by shellfish and algae growth in the calculation model. The results of the carbon sink calculation in this paper are consistent with [7]. The analysis in [14] of the carbon balance trend of China’s marine fisheries indicated that China’s marine fisheries will not reach carbon balance until 2230. Their calculations of carbon sinks used the “removable carbon sink” model, which underestimated the carbon sinks formed by shellfish and algae farming, so they calculated the time to carbon balance much later. The predictions of the carbon intensity of marine fisheries by [45] also suggested that China’s current carbon reduction efforts would not achieve the goal of carbon neutrality by 2060.
The analysis results of the driving factors of net carbon emissions in this paper were similar to those of [13,29]. The result of [29] argued that carbon intensity accelerated carbon reduction, while industrial structure inhibited carbon reduction. In this paper, the results indicated that carbon intensity was a positive driver of net carbon emissions and industrial structure was a negative driver. In addition, the lower the net carbon emissions, the better the carbon reduction. Ma et al.’s study revealed that industrial structure had a negative pull on carbon emissions, but the effect of the industrial scale was mainly negative [46]. Their study of industrial-scale effects was subdivided into the populations of marine capture, fish processing, and aquaculture industries. Among them, the changes in the number of people in marine capture and fish processing mainly determined the direction of the contribution of industrial scale to carbon emissions. Guan also highlighted that carbon emission intensity and farming efficiency played a positive role in net carbon emissions. However, their expressions of carbon emission intensity and farming efficiency were different from this paper. Carbon intensity was the ratio of carbon emissions to shellfish cultivation output. Farming efficiency was the ratio of GOP to the number of people engaged in mariculture. In addition, none of the existing studies has decomposed the drivers of net carbon emissions. This paper complements previous research on marine fisheries by calculating parameters related to net carbon emissions.

6. Conclusions and Policy Suggestions

6.1. Conclusions

Every year, organisms around the world absorb large amounts of carbon through photosynthesis, with marine organisms accounting for 55% of that carbon absorption [47]. Carbon sequestration through marine fisheries is an essential pathway to carbon sink formation. Nevertheless, marine fisheries are also a source of carbon emissions. Therefore, under the carbon neutrality target, it is necessary to dissect whether the net carbon emissions from marine fisheries are neutral or not. Based on the measurement of carbon emissions and carbon sinks from marine fisheries, this paper assessed the net carbon emissions of each province in China. The drivers of net carbon emissions were analyzed through the LMDI model. The contributions of carbon intensity, industrial structure, industrial efficiency, and industrial scale to the level of net carbon emissions in China were investigated. The results provide a theoretical basis for realizing ecological values in marine fisheries. The main conclusions of this paper are as follows:
  • From 2005 to 2020, carbon emissions from China’s marine fisheries increased by 12.75%, carbon sinks increased by 48.44%, and net carbon emissions decreased by 19.14%. This result indicated that the pressure on the environment from China’s marine fisheries was decreasing but the goal of carbon neutrality was still some way off. The overall trend of carbon emissions was rising and then falling, carbon sinks were on the rise overall, and net carbon emissions were on the decline overall.
  • The results of carbon emission estimation for coastal provinces revealed that only Guangdong and Guangxi showed a decreasing trend in carbon emissions as a whole. The remaining seven provinces saw an increase in carbon emissions; the most significant increase was in Hainan. The fluctuating trend of Zhejiang and Hebei was obvious. Guangdong’s carbon emissions were on a steady downward trend, with only one significant increase in the value for Guangxi in 2008. The carbon emissions of Fujian and Hainan were growing stably. The carbon emissions of Liaoning, Jiangsu, and Shandong were also fluctuating, but the fluctuation was not significant. Among the carbon sinks of nine provinces, only Hainan showed a decreasing trend in the whole carbon sink, while the remaining eight provinces had an increase in carbon sinks. Hebei, Liaoning, and Hainan had significant fluctuation trends. The rising trend was more stable in Zhejiang, Fujian, Shandong, and Guangxi. Jiangsu and Guangdong were the two provinces with inconspicuous trends. In the performance of net carbon emissions, Shandong had a negative value every year. Since 2018, Fujian’s net carbon emissions have achieved a negative value. Liaoning also achieved carbon neutrality in 2005, 2006, 2016, 2017, 2019, and 2020. The remaining provinces had consistently positive net carbon emissions.
  • In terms of the drivers of net carbon emissions, carbon intensity was the main negative driver and industrial structure was the main positive driver. The effect of industrial efficiency and industrial scale on net carbon emissions were both positive and negative. However, the final cumulative contribution of the industrial efficiency to net carbon emissions was negative and the cumulative contribution of the industrial scale was positive.

6.2. Policy Suggestions

Based on the assessment results of carbon emissions, carbon sinks and net carbon emissions from marine fisheries, and the analysis of the drivers of net carbon emissions, this paper proposes the following policy recommendations:
  • In response to the development status of marine fisheries in different regions, the government should allocate carbon reduction development targets based on local conditions. Local governments can take strategic initiatives that match local ocean carrying capacity. Each province can focus on developing and farming profitable aquatic products to form a unique marine aquaculture system. The government should cultivate and promote ecological farming models with different sea areas and species combinations, and expand the effective space for biological carbon sequestration in coastal areas from different dimensions.
  • It is essential to increase the intensity of carbon taxation policies. A carbon tax means companies pay an environmental cost for the greenhouse gas emissions they generate. The reduction in carbon emissions by a carbon tax is far greater than that of green technology innovation [48]. Marine fishery is a source of carbon emissions. The government can adjust the type of operation of motorized fishing vessels by imposing a carbon tax, thereby reducing carbon emissions from the source.
  • By establishing a compensation mechanism for marine shellfish and algae cultivation, fishermen are encouraged to cultivate production. Shellfish and algae aquaculture not only sequester carbon, but also purify water and release oxygen [14]. Hence, the government should provide some incentives for this production process. Fishermen can enhance shellfish and algae production in marine fisheries without exceeding the carrying capacity of the resource environment. The compensation incentive criteria can refer to the economic and ecological values generated by shellfish and algae cultivation.
  • The government could promote the carbon emission trading policy. This policy can clearly define the carbon emission property rights of each marine fishery enterprise, thereby enabling the optimal allocation of carbon emissions among enterprises at a lower cost. Under the pressure of allowance, companies can be motivated to improve their technology to reduce emissions consciously, and those with more advanced technology will face less pressure for allowance.
  • It is necessary to promote international blue carbon co-operation and trading of marine fisheries. The establishment of blue carbon co-operation and trading mechanism with other countries will increase the implementation of global fishery resources and extend the industrial chain. Extending the industrial chain can increase the market demand for marine shellfish and algae, consequently increasing the carbon sink of marine fisheries.
This paper also has some limitations. The calculation of carbon emissions in this paper only considered the direct carbon emissions from fuel consumption and lacked the calculation of indirect carbon emissions from electricity consumption. Moreover, this paper explored the drivers of net carbon emissions from a national perspective, without differentiating the drivers of coastal provinces. Future research could explore these questions in depth.

Author Contributions

Conceptualization, Z.L. and L.Z.; methodology, L.Z.; software, L.Z.; validation, W.W. and W.M.; formal analysis, W.M.; investigation, L.Z.; resources, Z.L. and W.M.; data curation, W.W.; writing—original draft preparation, L.Z.; writing—review and editing, Z.L. and W.W.; funding acquisition, Z.L. All authors have read and agreed to the published version of the manuscript.

Funding

This research was funded by Sichuan Science and Technology Program, grant number No. 2021JDR0224. The APC was funded by Sichuan Science and Technology Program, grant number No. 2021JDR0224.

Institutional Review Board Statement

Not applicable.

Informed Consent Statement

Not applicable.

Data Availability Statement

Publicly available datasets were analyzed in this study. These data can be found here: http://www.stats.gov.cn/ (accessed on 4 August 2022).

Conflicts of Interest

The authors declare no conflict of interest.

Nomenclature

Symbols
C Coal consumption (105 t)
C s Shell carbon sink (105 t)
C D O C The carbon sink formed by the release of DOC (105 t)
C P O C The carbon sink formed by the release of POC (105 t)
C i n t Carbon intensity
C s t r Industrial structure
C e f f Industrial efficiency
C s c a Industrial scale
C i s t Carbon in shellfish soft tissue (105 t)
C j a Algal bodies carbon sink (105 t)
C n e t Net   C O 2 emissions (105 t)
E Employee number
F C The amount of carbon per ton of standard coal
G The economic output value of marine fisheries
h The fuel oil conversion coefficient of standard coal
i Shellfish species
j Algae species
m Operation modes of fishing boats
P Main engine power (kw)
P j a l Algal yield (105 t)
P i s h Shellfish yield (105 t)
Q c The amount of carbon (105 t)
Q c o 2 C O 2 emissions (105 t)
Q E Effective oxidation fraction
R i s Dry weight ratio of shell (%)
R i s t Dry weight ratio of soft tissue (%)
t Year
T C a l Carbon sinks of algae (105 t)
T C C O 2 a l C O 2 sinks of algae (105 t)
T C s h Carbon sinks of shellfish (105 t)
T C C O 2 s h C O 2 sinks of shellfish (105 t)
w i s Carbon content of shell (%)
w i s t Carbon content of soft tissue (%)
w j a Algal carbon content (%)
Y Fishing production (105 t)
Greek symbols
α The share of POC released during algal growth in photosynthetic productivity
β The share of DOC released during algal growth in photosynthetic productivity
μ Oil consumption coefficient (t/kw)
ω The   constant   for   carbon   to   C O 2 conversion
γ D O C Conversion ratio from DOC to carbon sinks
γ P O C Conversion ratio from POC to carbon sinks
ε Proportion of carbon in the shell from organic carbon or marine sediment to the total shell carbon
δ The   ratio   of   C O 2 emitted from fuel oil to coal combustion
Acronym
DICDissolved inorganic carbon
DOCDissolved organic carbon
ECExcretion carbon
FCFecal carbon
GCGrowth carbon
LMDILog-mean decomposition index
POCParticulate organic carbon
RCRespiration carbon
RDOCRecalcitrant dissolved organic carbon
TDCTotal dietary carbon

References

  1. Sahle, M.; Saito, O.; Furst, C.; Yeshitela, K. Quantification and mapping of the supply of and demand for carbon storage and sequestration service in woody biomass and soil to mitigate climate change in the socio-ecological environment. Sci. Total Environ. 2018, 624, 342–354. [Google Scholar] [CrossRef] [PubMed]
  2. Moore, J.K.; Fu, W.; Primeau, F.; Britten, G.L.; Lindsay, K.; Long, M.; Doney, S.C.; Mahowald, N.; Hoffman, F.; Randerson, J.T. Sustained climate warming drives declining marine biological productivity. Science 2018, 359, 1139–1142. [Google Scholar] [CrossRef]
  3. Javadi, M.A.; Abhari, M.K.; Ghasemiasl, R.; Ghomashi, H. Energy, exergy and exergy-economic analysis of a new multigeneration system based on double-flash geothermal power plant and solar power tower. Sustain. Energy Technol. Assess. 2021, 47, 101536. [Google Scholar] [CrossRef]
  4. Yang, C.X.; Hao, Y.; Irfan, M. Energy consumption structural adjustment and carbon neutrality in the post-COVID-19 era. Struct. Chang. Econ. Dyn. 2021, 59, 442–453. [Google Scholar] [CrossRef] [PubMed]
  5. What Is Carbon Neutrality and How Can It Be Achieved by 2050? Available online: https://www.europarl.europa.eu/news/en/headlines/society/20190926STO62270/what-is-carbon-neutrality-and-how-can-it-be-achieved-by-2050 (accessed on 13 August 2022).
  6. Javadi, M.A.; Khalaji, M.; Ghasemiasl, R. Exergoeconomic and environmental analysis of a combined power and water desalination plant with parabolic solar collector. Desalination Water Treat. 2020, 193, 212–223. [Google Scholar] [CrossRef]
  7. Yang, L.; Hao, X.; Shen, C.; An, D. Assessment of carbon sink capacity and potential of marine fisheries in China under the carbon neutrality target. Resour. Sci. 2022, 44, 716–729. [Google Scholar] [CrossRef]
  8. Ren, W.H. Study on the removable carbon sink estimation and decomposition of influencing factors of mariculture shellfish and algae in China-a two-dimensional perspective based on scale and structure. Environ. Sci. Pollut. Res. 2021, 28, 21528–21539. [Google Scholar] [CrossRef]
  9. Jihong, Z.; Yi, L.; Wenguang, W.; Xinmeng, W.; Yi, Z. Overview of the marine fishery carbon sink project methodology. Prog. Fish. Sci. 2022, 43, 151–159. [Google Scholar]
  10. Bao, R. Evaluating the carbon sink in Chinese marginal seas in the context of carbon neutrality goals: Insight from carbon ages. Period. Ocean. Univ. China 2022, 52, 50–56. [Google Scholar]
  11. Shao, G.; Chu, R.; Li, C. Research on carbon balance of marine fishery in Shandong Province using the calculation results of carbon emission and carbon sink. Chin. Fish. Econ. 2018, 36, 105032. [Google Scholar]
  12. Li, Y.T.; Kong, J.J.; Ji, J.Y. Environmental regulation, technological innovation and development of marine fisheries-evidence from ten coastal regions in China. Fishes 2022, 7, 20. [Google Scholar] [CrossRef]
  13. Guan, H.J.; Sun, Z.Z.; Wang, J.Y. Decoupling Analysis of Net Carbon Emissions and Economic Growth of Marine Aquaculture. Sustainability 2022, 14, 5886. [Google Scholar] [CrossRef]
  14. Yu, D.-D.; Wa, L.-M.; Hai, F.; Rui, G.; Peng, F.Z.H. Development strategy of marine fisheries in China based on the carbon balance. J. Agric. Sci. Technol. 2016, 18, 1–8. [Google Scholar]
  15. Ghosh, S.; Rao, M.V.H.; Kumar, M.S.; Mahesh, V.U.; Muktha, M.; Zacharia, P.U. Carbon footprint of marine fisheries: Life cycle analysis from Visakhapatnam. Curr. Sci. 2014, 107, 515–521. [Google Scholar]
  16. Kong, H.J.; Shi, L.F.; Da, D.; Li, Z.J.; Tang, D.C.; Xing, W. Simulation of China’s carbon emission based on influencing factors. Energies 2022, 15, 3272. [Google Scholar] [CrossRef]
  17. Shao, L.; Guan, D.; Zhang, N.; Shan, Y.; Chen, G.Q. Carbon emissions from fossil fuel consumption of Beijing in 2012. Environ. Res. Lett. 2016, 11, 114028. [Google Scholar] [CrossRef]
  18. Liu, Y.Y.; Ye, K.H.; Wu, L.; Chen, D.D. Estimating quantity and equity of carbon emission from roads based on an improved LCA approach: The case of China. Int. J. Life Cycle Assess. 2022, 27, 759–779. [Google Scholar] [CrossRef]
  19. Wang, G.F.; Liao, M.L.; Jiang, J. Research on Agricultural Carbon Emissions and Regional Carbon Emissions Reduction Strategies in China. Sustainability 2020, 12, 2627. [Google Scholar] [CrossRef]
  20. Sun, L.C.; Cao, X.X.; Alharthi, M.; Zhang, J.J.; Taghizadeh-Hesary, F.; Mohsin, M. Carbon emission transfer strategies in supply chain with lag time of emission reduction technologies and low-carbon preference of consumers. J. Clean. Prod. 2020, 264, 121664. [Google Scholar] [CrossRef]
  21. Xu, S.C.; Long, R.Y. Empirical research on the effects of carbon taxes on economy and carbon emissions in China. Environ. Eng. Manag. J. 2014, 13, 1071–1078. [Google Scholar]
  22. Sun, L.C.; Wang, Q.W.; Zhou, P.; Cheng, F.X. Effects of carbon emission transfer on economic spillover and carbon emission reduction in China. J. Clean. Prod. 2016, 112, 1432–1442. [Google Scholar] [CrossRef]
  23. Hua, G.W.; Cheng, T.C.E.; Wang, S.Y. Managing carbon footprints in inventory management. Int. J. Prod. Econ. 2011, 132, 178–185. [Google Scholar] [CrossRef]
  24. Guo, Q.Q.; Su, Z.F.; Chiao, C.S. Carbon emissions trading policy, carbon finance, and carbon emissions reduction: Evidence from a quasi-natural experiment in China. Econ. Chang. Restruct. 2022, 55, 1445–1480. [Google Scholar] [CrossRef]
  25. Zhang, X.F.; Fan, D.C. The Spatial-Temporal Evolution of China’s Carbon Emission Intensity and the Analysis of Regional Emission Reduction Potential under the Carbon Emissions Trading Mechanism. Sustainability 2022, 14, 7442. [Google Scholar] [CrossRef]
  26. Fan, F.Y.; Wang, Y.Y.; Liu, Q.Y. China’s carbon emissions from the electricity sector: Spatial characteristics and interregional transfer. Integr. Environ. Assess. Manag. 2022, 18, 258–273. [Google Scholar] [CrossRef]
  27. Du, Q.; Shao, L.; Zhou, J.; Huang, N.; Bao, T.N.; Hao, C.C. Dynamics and scenarios of carbon emissions in China’s construction industry. Sustain. Cities Soc. 2019, 48, 101556. [Google Scholar] [CrossRef]
  28. Kim, K.; Kim, D.H.; Kim, Y. Fisheries: A Missing Link in Greenhouse Gas Emission Policies in South Korea. Sustainability 2021, 13, 5858. [Google Scholar] [CrossRef]
  29. Wang, Q.; Wang, S.S. Carbon emission and economic output of China’s marine fishery—A decoupling efforts analysis. Mar. Policy 2022, 135, 104831. [Google Scholar] [CrossRef]
  30. Maia, V.A.; Santos, A.B.M.; de Aguiar-Campos, N.; de Souza, C.R.; de Oliveira, M.C.F.; Coelho, P.A.; Morel, J.D.; da Costa, L.S.; Farrapo, C.L.; Fagundes, N.C.A.; et al. The carbon sink of tropical seasonal forests in southeastern Brazil can be under threat. Sci. Adv. 2020, 6, eabd4548. [Google Scholar] [CrossRef]
  31. Shi, X.L.; Wang, T.L.; Lu, S.Y.; Chen, K.; He, D.; Xu, Z. Evaluation of China’s forest carbon sink service value. Environ. Sci. Pollut. Res. 2022, 29, 44668–44677. [Google Scholar] [CrossRef]
  32. Xu, Q.; Dong, Y.X.; Yang, R. Influence of the geographic proximity of city features on the spatial variation of urban carbon sinks: A case study on the Pearl River Delta. Environ. Pollut. 2018, 243, 354–363. [Google Scholar] [CrossRef]
  33. Smith, P. Do grasslands act as a perpetual sink for carbon? Glob. Chang. Biol. 2014, 20, 2708–2711. [Google Scholar] [CrossRef]
  34. Bu, X.Y.; Dong, S.C.; Mi, W.B.; Li, F.J. Spatial-temporal change of carbon storage and sink of wetland ecosystem in arid regions, Ningxia Plain. Atmos. Environ. 2019, 204, 89–101. [Google Scholar]
  35. Wu, J.H.; Li, B. Spatio-temporal evolutionary characteristics of carbon emissions and carbon sinks of marine industry in China and their time-dependent models. Mar. Policy 2022, 135, 104879. [Google Scholar] [CrossRef]
  36. Chung, I.K.; Beardall, J.; Mehta, S.; Sahoo, D.; Stojkovic, S. Using marine macroalgae for carbon sequestration: A critical appraisal. J. Appl. Phycol. 2011, 23, 877–886. [Google Scholar] [CrossRef]
  37. Liu, C.; Liu, G.; Casazza, M.; Yan, N.; Xu, L.; Hao, Y.; Franzese, P.P.; Yang, Z. Current status and potential assessment of China’s ocean carbon sinks. Environ. Sci. Technol. 2022, 56, 6584–6595. [Google Scholar] [CrossRef]
  38. Jones, A.R.; Alleway, H.K.; McAfee, D.; Reis-Santos, P.; Theuerkauf, S.J.; Jones, R.C. Climate-Friendly Seafood: The Potential for Emissions Reduction and Carbon Capture in Marine Aquaculture. Bioscience 2022, 72, 123–143. [Google Scholar] [CrossRef]
  39. Gu, H.L.; Yin, K.D. Forecasting algae and shellfish carbon sink capability on fractional order accumulation grey model. Math. Biosci. Eng. 2022, 19, 5409–5427. [Google Scholar] [CrossRef]
  40. Tang, Q.S.; Zhang, J.H.; Fang, J.G. Shellfish and seaweed mariculture increase atmospheric CO2 absorption by coastal ecosystems. Mar. Ecol. Prog. Ser. 2011, 424, 97–104. [Google Scholar] [CrossRef]
  41. Quan, W.; Ying, M.; Zhou, Q.; Xu, C. Carbon source analysis of bivalve-culture based on stable carbon isotope technique. J. Shanghai Ocean. Univ. 2018, 27, 175–180. [Google Scholar]
  42. Kaya, Y. Impact of Carbon Dioxide Emission on GNP Growth: Interpretation of Proposed Scenarios. In Paris: Presentation to the Energy and Industry Subgroup, Response Strategies Working Group; IPCC: Geneva, Switzerland, 1989. [Google Scholar]
  43. Liu, Y.; Zhang, C.; Sun, S.; Sun, J.; Yang, G. Carbon Sequestration Potential Research of Macroalage in the Intertidal Rocky Zone in Naozhou Island. J. Guangdong Ocean. Univ. 2019, 39, 78–84. [Google Scholar]
  44. Li, H.; Zhang, Z.; Xiong, T.; Tang, K.; He, C.; Shi, Q.; Jiao, N.; Zhang, Y. Carbon sequestration and its potentiality of marine shellfish and seaweed cultures in Fujian Province, China. J. Appl. Oceanogr. 2022, 41, 53–59. [Google Scholar]
  45. Gao, Y.; Fu, Z.-W.; Zhao, Z.-M. Analysis and Prediction of Carbon Emission Reduction Potential of Marine Fishery in China. J. Guangdong Ocean. Univ. 2022, 42, 39–44. [Google Scholar]
  46. Ma, G.; Zhang, Y.; Yao, F. Study on the Driving Factors of Carbon Emission of Fishery Economy in China—Dual Perspective Analysis Based on LMDI and Decoupling Model. J. Qingdao Univ. 2022, 35, 117–123. [Google Scholar]
  47. Falkowski, P.G.; Katz, M.E.; Knoll, A.H.; Quigg, A.; Raven, J.A.; Schofield, O.; Taylor, F.J.R. The evolution of modern eukaryotic phytoplankton. Science 2004, 305, 354–360. [Google Scholar] [CrossRef] [Green Version]
  48. Cheng, N.; Chen, C. Marine Carbon Sink, Carbon Tax, and Green Technology: A Research on Combination Strategy to Achieve “Double Carbon” Goals. J. Shandong Univ. 2021, 06, 150–161. [Google Scholar]
Figure 1. Changes in marine fishery carbon emissions, carbon sinks, and net carbon emissions from 2005 to 2020 (105 t/year).
Jmse 10 01179 g001
Figure 2. Changes in carbon emissions from the marine fishery industry in coastal provinces from 2005 to 2020.
Jmse 10 01179 g002
Figure 3. Changes in carbon sinks in coastal provinces from 2005 to 2020.
Jmse 10 01179 g003
Figure 4. Changes in net carbon emissions in coastal provinces from 2005 to 2020.
Jmse 10 01179 g004
Table 1. Biological parameters used in the model (%).
SpeciesThe Dry Weight Ratio of Shells (%)The Carbon Content of Shells (%)The Dry Weight Ratio of Soft Tissue (%)The Carbon Content of Soft Tissue or Algae (%)
Shellfish
Crassostrea gigas63.8011.521.3044.90
Ruditapes philippinarum44.6511.407.6742.84
Chlamys farreri56.5811.447.3243.87
Mytilus edulis70.6412.684.6345.98
Sinonovacula constricta64.7813.246.6244.99
Scapharca subcrenata68.6411.295.8345.86
Others61.5211.935.5644.74
Algae
Laminaria japonica 31.20
Undaria pinnatifida 30.48
Gracilaria verrucosa 24.50
Porphyra tenera 29.09
Gelidium amansii 29.48
Sargassum fusiforme 23.87
Enteromorpha clathrata 29.04
Others 28.24
Table 2. Estimation results of net carbon emissions from marine fisheries in China from 2005 to 2020 (105 t/year).
YearCarbon EmissionsCarbon SinksNet Carbon Emissions
2005166.4778.6087.86
2006169.7381.5688.17
2007174.5372.54101.99
2008181.2173.86107.35
2009183.2277.33105.89
2010182.8181.39101.42
2011185.3884.64100.74
2012186.1189.4196.70
2013190.8194.4796.34
2014196.8099.4997.31
2015201.95103.0098.96
2016200.39107.3993.00
2017193.17109.2883.90
2018191.73111.1580.58
2019189.08113.6975.39
2020187.70116.6771.04
Table 3. Increased carbon emissions of the marine fishery.
ProvincesCarbon Emissions (105 t/year)Rate of Increase in Carbon Emissions (%)
20052020
Hebei3.865.1232.73
Liaoning14.1118.2829.58
Jiangsu7.038.3618.90
Zhejiang47.4448.412.06
Fujian23.5232.7539.26
Shandong20.8823.9414.67
Guangdong29.9423.56−21.32
Guangxi9.848.58−12.83
Hainan9.8518.7089.79
Table 4. Increased carbon sinks of the marine fishery.
ProvincesCarbon Sinks (105 t/year)Rate of Increase in Carbon Sinks (%)
20052020
Hebei1.162.3099.01
Liaoning14.3718.8731.34
Jiangsu2.644.2461.06
Zhejiang4.808.1269.08
Fujian19.4535.0680.24
Shandong22.4731.9842.33
Guangdong9.5810.6210.80
Guangxi3.675.2944.22
Hainan0.470.18−61.57
Table 5. LMDI decomposition results in net carbon emissions from marine fisheries in China (105 t).
Year Δ C n e t Δ C i n t Δ C s t r Δ C e f f Δ C s c a
YearlyCumulationYearlyCumulationYearlyCumulationYearlyCumulationYearlyCumulation
2005–20060.310.31−7.70−7.709.079.071.981.98−3.04−3.04
2006–200713.8214.136.86−0.8421.5130.59−15.77−13.791.22−1.82
2007–20085.3619.49−3.98−4.8213.7744.35−15.35−29.1510.939.10
2008–2009−1.4618.03−9.43−14.255.3049.661.51−27.641.1610.26
2009–2010−4.4613.56−18.55−32.8111.9061.550.49−27.141.7011.96
2010–2011−0.6812.8813.06−19.75−16.9144.64−3.77−30.916.9418.90
2011–2012−4.058.83−47.96−67.7141.9186.55−1.95−32.863.9522.85
2012–2013−0.368.47−11.23−78.9411.3797.92−2.18−35.041.6924.54
2013–20140.989.45−5.31−84.254.96102.882.68−32.36−1.3623.17
2014–20151.6411.09−1.88−86.130.93103.823.79−28.57−1.2021.97
2015–2016−5.965.14−9.42−95.552.46106.282.16−26.41−1.1620.81
2016–2017−9.11−3.97−12.14−107.6818.62124.90−16.06−42.470.4721.28
2017–2018−3.31−7.28−10.93−118.6112.81137.72−4.47−46.94−0.7220.56
2018–2019−5.19−12.47−3.61−122.221.80139.52−1.31−48.25−2.0818.48
2019–2020−4.36−16.83−8.94−131.168.55148.07−0.90−49.15−3.0715.42
Publisher’s Note: MDPI stays neutral with regard to jurisdictional claims in published maps and institutional affiliations.

