Review

A Review on Recent Development of Numerical Modelling of Local Scour around Hydraulic and Marine Structures

School of Engineering, Design and Built Environment, Western Sydney University, Penrith 2751, NSW, Australia
J. Mar. Sci. Eng. 2022, 10(8), 1139; https://doi.org/10.3390/jmse10081139
Submission received: 27 July 2022 / Revised: 15 August 2022 / Accepted: 16 August 2022 / Published: 18 August 2022
(This article belongs to the Section Ocean Engineering)

Abstract

:
This paper reviews the recent development of numerical modelling of local scour around hydraulic and marine structures. The numerical models for simulating local scour are classified into five categories: sediment transport rate models, two-phase models, CFD-DEM models, equilibrium scour models and depth-averaged models. The sediment transport rate models are the most popularly used models because of their high calculation speed and availability of empirical formulae for predicting sediment transport rates. Two-phase models were developed to simulate sediment transport in the format of sheet flow under strong current velocity or strong turbulence. The CFD-DEM model simulates the motion of every individual sediment particle. Its speed is the slowest, but it provides the opportunity to understand fundamental mechanisms of flow–particle interaction and particle–particle interaction using small-scale simulations. Equilibrium scour models predict the final scour profile at the equilibrium stage but cannot predict scour history. The depth-averaged models that were developed early are not recommended for local scour problems because they are not able to predict three-dimensional features around structures. Although many numerical models have been developed and many studies have been conducted to investigate local scour, some challenging problems remain to be solved, for example, the effects from scaling and sediment gradation. In addition, people’s understanding of local scour of cohesive sand is still very shallow, and more experimental and numerical research in this area is needed.

1. Introduction

When a hydraulic/marine structure is installed in water with current or waves, it causes an increase in the sediment transport capacity locally and leads to scour [1]. Scour is the one of the biggest hazards for structural safety, and scour protection takes a significant percentage of the costs of hydraulic and marine infrastructures. A lot of studies have been conducted to investigate local scour around hydraulic and marine structures, and several review articles have been published to review the studies of bridge piers [2,3], offshore monopiles [4,5] and spur dikes in curved channels [6]. Scour protection and remediation techniques of various structures have also been reviewed recently [7,8,9]. Many books have also been published to introduce fundamental knowledge [10,11] and existing research outcomes [1], design formulae and guidelines [12,13,14] for scour.
Numerical methods have been increasingly used in the study of scour around structures because of their high efficiency and the quickly growing capability of computers for large-scale numerical simulations. Because local scour involves complex interactions between sediment, water flow and structures, it is impossible to ensure all the similarities in a laboratory experiment on scour. As a result, small-scale laboratory experiments have errors caused by scale effect [15,16,17,18]. It is hoped that numerical methods can be used to predict scour without the scaling effect under prototype conditions. The development of advanced and efficient numerical models for predicting scour problems has become increasingly important. In addition, numerical simulations can provide a good understanding of the mechanisms of scour that cannot be measured with experiments. Figure 1 is a sketch of flow around a simple, submerged underwater cylindrical structure on a flat seabed. In addition to the velocity amplification on the two sides of the structure, the horseshoe vortex and the lee wake vortices play important roles on the scour. If the structure is underwater, the interaction between the vortex from the top of the structure and the lee wake vortices also affects the scour. Scour around other vertical underwater structures, such as suction bucket foundations, gravity foundations and tripod foundations, will be more complex than the simple structure in Figure 1, but the horseshoe vortex and lee wake vortices may still exist. To predict scour accurately, an accurate prediction of flow features is critically important.
Conducting three-dimensional computational fluid dynamics (CFD) simulations can provide a good understanding of these vortex structures shown in Figure 1, which are responsible for scour. In addition, conducting numerical simulations of scour under different model scales can help reveal the scaling effect and correct the error caused by scale effect in scour prediction [18]. The numerical study of scour below pipelines under different scales [19] found that scour under small-scale pipelines overpredicted the scour depth.
Numerical studies of scour have extended from hydraulic structures in steady current to more complex flows and geometries. Fully nonlinear wave models based on RANS equations have been used in recent studies of wave-induced scour of pipelines. The motion of free-surface waves has been simulated by the Arbitrary Lagrangian–Eulerian (ALE) method [20,21] and the Volume of fluid method (VOF) [22,23,24]. Numerical studies have also been implemented to simulate more complex cases of the combination of scour and vibration of subsea pipelines [25,26]. The scour was found to be significantly enhanced by the vibration of the pipelines. Both experimental and numerical studies of scour have been mainly focused on inviscid, loose sand. The published books on scour mentioned at the beginning of this section only discussed scour of inviscid sand. Viscous sediment has not received as much attention because hydraulic and marine structures on loose sand bed are more prone to scour.
Sumer reviewed numerical studies of scour problems in 2007 [27] and 2015 [28]. After the latest review on the numerical methods of local scour by Sumer in 2015 [28], more advanced numerical models were developed. Díaz-Carrasco, Croquer [29] reviewed recent numerical models, but they were limited to wave–structure–seabed interaction. The aim of this paper is to provide a comprehensive review of existing numerical methods for predicting local scour around hydraulic and marine structures, make comparisons between different methods, evaluate the suitability of each method in particular conditions and identify the challenges and opportunities of future numerical studies.
After reviewing the literature, I found that the existing numerical models can be classified into five categories: sediment transport rate models, equilibrium scour models, two-phase flow models, CFD-DEM models and depth-averaged models. Sediment transport rate models are the most used models because they have the highest efficiency and proven accuracy. Equilibrium scour models are earlier models that only predict the scour profile at the equilibrium stage. They are not able to predict the history of scour. Two-phase models simulate the flow of both water and sand phases, and they are suitable for sheet-flow conditions caused by high flow velocity. In this paper, a systematic review of numerical methods of local scour around hydraulic and marine structures will be conducted. This paper mainly reviews the numerical methods for simulating scour of inviscid, loose sand. In the rest of the paper, the sediment transport rate models are discussed in Section 2, and other models are discussed in Section 3, followed by the conclusion in Section 4.

2. Sediment Transport Rate Models

A sediment transport rate model is a one-phase model that includes a flow model and a scour model. It is classified as a one-phase model because the flow model is independent from the scour model, and the sediment motion in the water is assumed to have no effects on the flow. The sediment motion is calculated based on the solution of flow but does not have any effect on the flow considering that the density of the suspended sediment particles in water is very small. The sediment transport rate is calculated as the volume of the sediment that passes per unit width of the flow. It includes bed load and suspended load, which will be discussed in this section. This type of model is defined as a sediment transport rate model because proper formulae for calculating the sediment transport rate are critically important for accurate scour prediction. Different sediment transport rate models may be different from each other, but they all include two parts: flow model and scour model, which include the calculation of sediment transport rates and prediction of the scour. In this section, the methods of these two parts will be reviewed.

2.1. Flow Model

In sediment transport rate models, the flow around structures is simulated numerically, and the motion of the sediment is quantified by empirical formulae. The most used governing equations for simulating the flow are the Reynolds-Averaged Navier–Stokes (RANS) equations because of their high efficiency. The Reynolds stress term requires additional turbulence models to close the RANS equations. A variety of turbulence models have been used in scour models, including Smagorinsky subgrid scale models [30,31,32], k-ε models [33,34,35] and k-ω models [36,37,38].
After the flow is simulated, the distribution of the shear stress of the flow acting on the seabed is obtained. When local shear stress exceeds the critical shear stress, sediment particles start to move. The non-dimensional shear stress is referred to as Shields parameter θ :
θ = τ ρ g ( s 1 ) d s
where ρ is the fluid density, g is the gravitational acceleration, s is the specific gravity of the sediment and d s is the sediment particle size, which is replaced by the median particle size d 50 for non-uniform sediment in many studies. The critical Shields number for sediment to move is related to the sediment particle size. Based on experimental data, Soulsby [10] derived an empirical formula to calculate the critical Shields number θ c r 0 on a horizontal plane:
θ c r 0 = 0.30 1 + 1.2 D * + 0.055 [ 1 exp ( 0.020 D * ) ]
where D * is the non-dimensional sediment particle size defined as:
D * = [ g ( s 1 ) ν 2 ] 1 / 3 d s
The measured data of the critical Shields number are very scattered, as seen in in Ref. [10], and Equation (2) fits the measured data the best. In the simulations of scour around three-dimensional structures with a slope bed, the critical Shields parameter needs to be modified to account for the effect from the slope. Figure 2 shows a sketch of a bed load sediment particle moving on a slope bed. The slope angle is β, and the angle between the flow direction and the downslope direction is α. Assuming the particle is not moving, the direction of the Shields parameter is the same as the flow direction. According to the force balance, the critical Shields parameter for the sand to move is [36]:
θ c r = θ c r 0 ( cos β 1 sin 2 α   tan 2 β μ s 2 cos α   sin β μ s )
where μ s = tan φ s is the static friction coefficient, and φ s is the static repose angle of the sediment particles.
Sediment particles move in the water in the forms of bed load and suspended load once the threshold is exceeded. Bed load includes sediment particles that roll, slide or saltate along the seabed surface, and the suspended load includes the sediment particles that are entrained off the bed and suspended in water volume. In numerical simulations, bed load and suspended load are artificially divided at a reference level above the seabed, which is defined as z a . The sediment particles above and below this level are treated as suspended load and bed load, represented by qs and qb, respectively. It should be noted that there is not a clearly defined boundary between bed load and suspended load in reality. The reference level is used mainly to facilitate numerical analysis.

2.2. Bed Load

According to the force balance of the sediment particles, Engelund and Fredsoe [39] derived an empirical formula for calculating the bed load transport rate:
q b = 1 6 π d s 3 P E F d s 2 U b
where Ub is the velocity of the motion of the bed load particles, and P E F is the fraction of the sediment particles that move as bed load calculated by:
P E F = [ 1 + ( π μ d 6 ( θ θ c r ) ) 4 ] 1 / 4
where μ d is the dynamic friction coefficient, which is related to the dynamic repose angle φ d as μ d = tan ( φ d ) . On a horizontal bed, the bed load particle velocity is:
U b = a U f ( 1 0.7 θ c r / θ )
where U f = τ / ρ is the friction velocity, and parameter a is a constant taken as 10 in [36] and [39]. Inserting Equation (8) into Equation (6) yields:
q b g ( s 1 ) d s 3 5 P E F ( θ 0.7 θ c r )
Roulund, Sumer [36] extended Equation (8) to the one for a slope bed, and their method of calculating Ub and qb is described below. Figure 2 shows a sketch of forces acting on a sand particle on a slope bed with a local slope angle β. U is the fluid velocity vector that the particle experiences. It is related to the friction velocity by U = a U f . Because of the effect from the slope, the direction of the moving particle is deflected from U by an angle ψ. As a result, the relative velocity between the fluid and the particle is U r = U U b = a U f U b .
The forces on the sediment particles include the component W sin ( β ) of gravity force in the downslope direction, the fluid drag force FD in the direction of Ur and the friction force μ d W cos ( β ) in the opposite direction of Ub, where W is the submerged weight:
W = 1 6 π ρ g ( s 1 ) d s 3
and the drag force is:
F D = 1 2 ρ C π 4 d s 2 U r 2
where C is the force coefficient. Based on the force balance of a bed load particle at the critical velocity on a horizontal plane:
C = 4 μ s 3 a 2 θ c r 0
However, the suggested formula for C is [36]:
C = 8 3 a 2 θ c r 0
because it fits the experimental data better. The force balance Equation in the direction of Ub is:
F D cos ψ 1 + W sin β cos ( α ψ ) μ d W cos β = 0
and the force balance equation in the perpendicular direction of Ub is:
F D sin ψ 1 W sin β sin ( α ψ ) = 0
The velocity relationship in the direction of Ub is:
U r cos ψ 1 a U f cos ψ + U b = 0
and the velocity relationship in the perpendicular direction of Ub is:
U r sin ψ 1 a U f sin ψ = 0
The variables of U b , U r , ψ and ψ 1 can be found by solving Equations (13) to (16). Then, the bed load is calculated using Equations (5) and (6).
The abovementioned bed load formula on a slope has been used in numerical models of three-dimensional local scour [38,40,41]. The two-dimensional version of the bed load formula is popularly used in the study of local scour around pipelines [37,42]. Many other bed load formulae have also been developed for calculating bed load. In addition to the one by Roulund, Sumer [36], six other bed load formulae were listed in [10]. Here, I list the three most commonly used formulae.
The bed load formula developed by van Rijn [43] is:
q b g ( s 1 ) d s 3 = 0.053 T 2.1 D * 0.3
where T = ( θ θ c r ) / θ c r is the non-dimensional excess shear stress. Equation (17) was implemented in the numerical models for simulating two-dimensional scour [23,34,44,45,46] and three-dimensional scour [47,48,49]. The numerical study of scour around pipelines by Brørs [33] used the bed load formula developed by Nielson [50]:
q b g ( s 1 ) d s 3 = 12 ( θ θ c r ) θ 1 / 2
The bed load formula by Meyer-Peter and Müller [51]:
q b g ( s 1 ) d s 3 = 8 ( θ θ c r ) 1.5
is also used in scour studies [52,53,54,55,56].

2.3. Suspended Load

Sediment particles that are suspended in water above the reference level are the suspended load. After the flow is solved, the suspended sediment is quantified by the volume concentration c of the suspended sediment particles, which is calculated by solving the convection–diffusion Equation:
c t + ( u + w s ) · c = · [ ( ν + ν s ) c ]
where u is the velocity vector, ws is the falling velocity vector, which only has one component in the vertical direction with a magnitude of w s , w s is the falling velocity of the sediment particles in water, and ν s is the diffusion coefficient of the sediment, which is the same as the turbulent viscosity ν t in [44,47,57] and is equal to 1.125 ν t in [34,42]. The most popularly used formula for calculating falling velocity of the sediment is the one derived by Soulsby [10]:
w s = ν d s [ ( 10.36 2 + 1.049 D * 3 ) 1 / 2 10.36 ]
Several empirical formulae are available for calculating the suspended concentration at the reference level under equilibrium condition. The formulae for calculating the suspended sediment concentration c a at the reference level z a by van Rijn [43]:
c a = 0.015 d 50 T 1.5 z a D * 0.3
was used in [44,48,49,58]. The studies of scour around subsea pipelines [59,60] used the formula proposed by Engelund and Fredsoe [39]:
c a = c 0 ( 1 + 1 / λ b ) 3
where c 0 = 0.65 and λ b is:
  λ b 2 = κ 2 α 1 2 0.013 s θ ( θ θ c r π 6 μ d P E F )
where α 1   =   3.5 , and κ=0.4 is the von Kármán constant. The formula by Zyserman and Fredsøe [61]:
c a = 0.331 ( θ 0.045 ) 1.75 1 + 0.720 ( θ 0.045 ) 1.75
was used in the studies of scour around pipelines and piers [21,38,62,63]. In Equation (24), the critical Shields parameter for the suspension of the sediment is 0.045.
When solving the suspended concentration equation using Equation (20), a source of suspended sediment needs to be given at the reference level as the bottom boundary condition. This source term is the erosion rate defined as E , or the sediment quantities that are entrained to suspension by the flow. This source is related to the gradient of the sediment concentration in the vertical direction and the diffusion rate at the reference level by E = ν s c z . However, the large gradient of c near the seabed needs very fine mesh near the bed to accurately calculate c z . In some studies, E = ν s c z was replaced by E = w s c a , considering the erosion rate is the same as the settling rate (also called deposition rate, D = w s c a ) under equilibrium stage [38,64].

2.4. Scour Prediction

In sediment transport rate models, the evolution of the seabed profile is predicted by solving the conservation of the sediment mass. For simulating scour of three-dimensional structures, the equation of conservation of the sediment mass is two-dimensional on the seabed surface [38,47,48,57,65,66,67,68]:
Z b t = 1 1 λ ( · q b + D E )
where Z b is the bed level, t is time, q b is the bed load sediment transport rate vector and λ is porosity of the sand. The method of calculating the disposition rate D and the erosion rate E have been given in Section 2.2. In the simulation of scour around two-dimensional structures such as pipelines, Equation (27) becomes a one-dimensional equation [58,59,60].
In some scour models, the contribution of the suspended sediment is quantified by a suspended load, which is the integration of the sediment flux over the water depth as [34,37,42,69]:
q s = Z a h u c d z
where q s is the suspended load vector, and h is the water depth. If Equation (26) is used for considering the sediment load, the conservation equation of sediment mass for simulating scour is:
Z b t = 1 1 λ [ · ( q b + q s ) ]
In some numerical studies in nearly clear water scour conditions, only the bed load terms in Equations (25) and (26) are considered, and suspended load is neglected [40,55,70,71,72] because the contribution of the suspended load is negligibly small. Some numerical studies used the sediment transport model embedded in commercial software, such as ANSYS Fluent [73,74] or Flow3D [52,53,75,76,77,78,79,80], or in open-source software OpenFoam [58,81] to simulate local scour. Omara, Elsayed [82] conducted a detailed numerical study to examine the accuracy of Flow3D in the simulation of scour around bridge piers and demonstrated the accuracy of the hydromorphological model.
The time for the scour to develop from the initial stage to the equilibrium stage is significantly longer than the time for the flow to fully develop. Sediment transport rate models are very efficient because they use empirical formulae to calculate the sediment transport rates instead of simulating the complex interaction between the flow and individual sediment particles, which is not achievable for large-scale problems under existing computer power. Because of their high efficiency, the sediment transport rate models have been used to simulate complex geometries, such as monopile with protection [83], tripod foundations [56,84] and wave-induced scour under complex seabed [85]. Considering the seabed changes very slowly, especially at the late stage of scour, scour simulation was sped up by increasing the scour computational time step in some numerical studies of scour under a steady current. This approach was proven to have negligible effect on scour below subsea pipelines [34,37]. In [58,81], the scour computational time step was 10 times the flow time step. This means that the scour simulation was sped up by 10 times. How much scour can be sped up depends on the flow condition. The scour time step can be increased more at small flow velocity compared to large flow velocity. However, it is not recommended to make the scour time step greater than the flow time step for scour under waves because the scour rate varies significantly within one wave period [22].

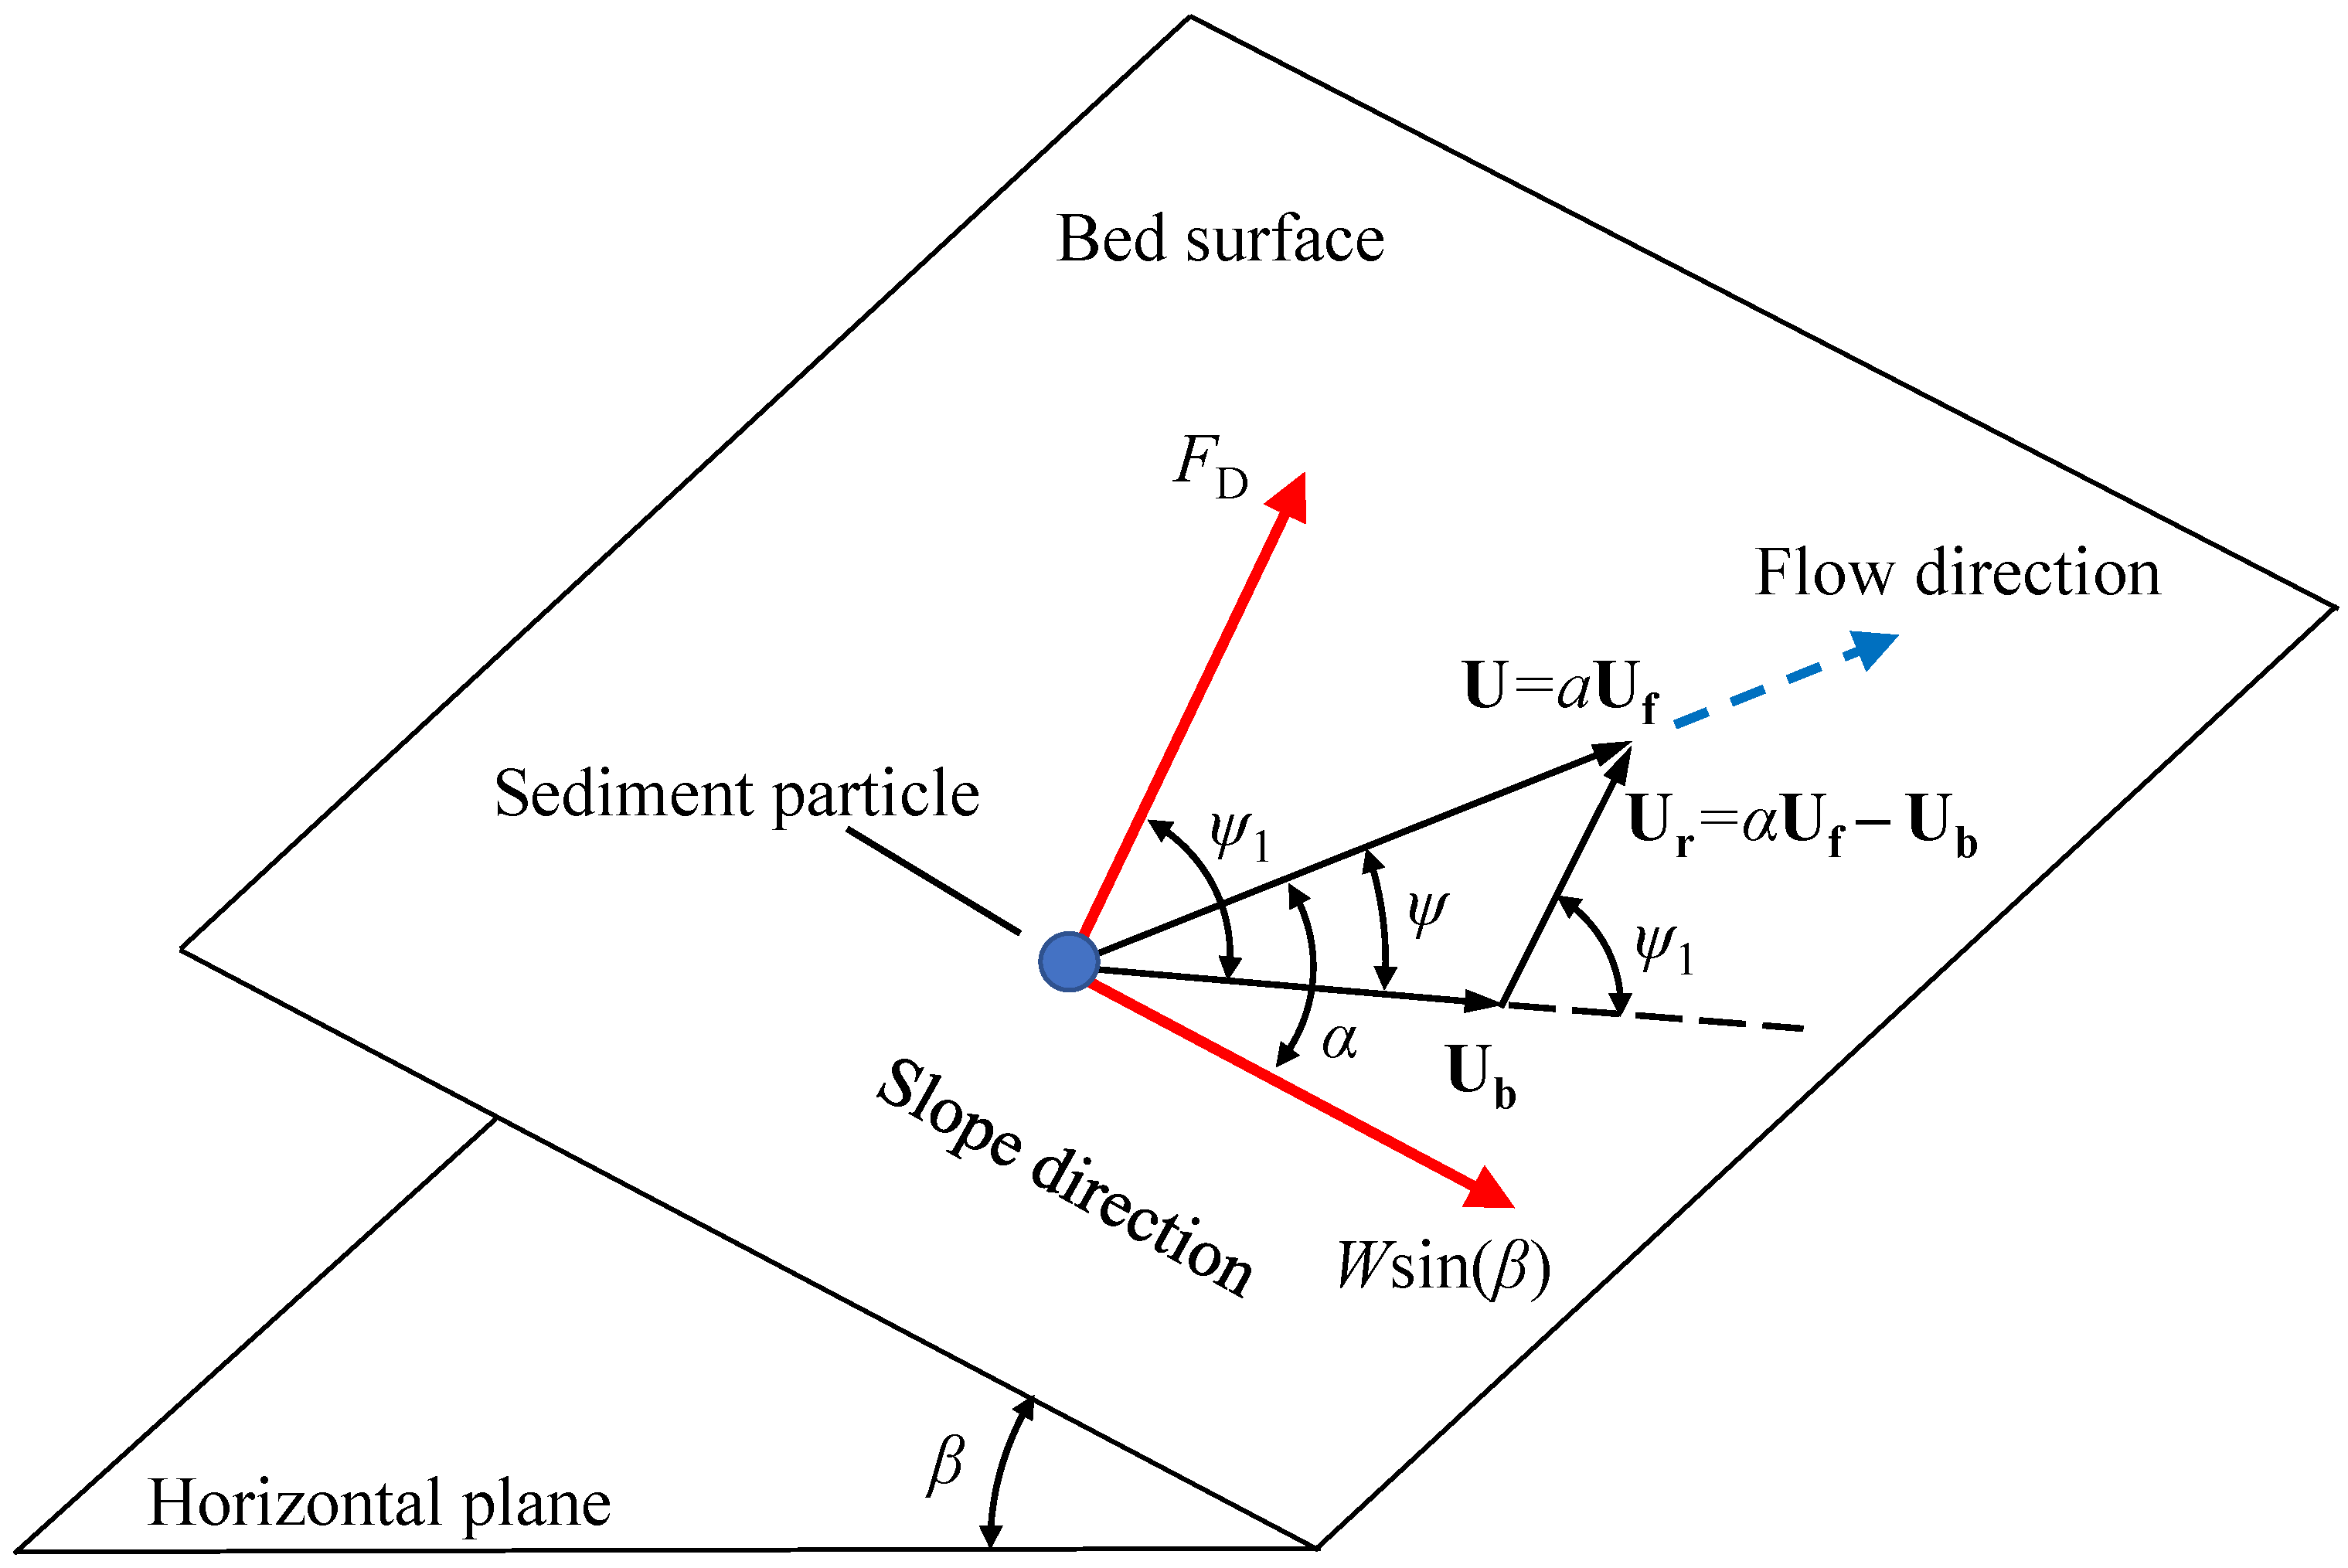
2.5. Sand-Slide Models

The bed slope of inviscid, loose sand cannot realistically exceed the static repose angle. However, in numerical simulations, the bed slope may exceed the static repose angle due to the accumulation of numerical errors or errors from sediment transport calculation. An excessively large bed slope could cause numerical inaccuracy and instability. Sand-slide models were developed to ensure the sand can slide downslope whenever the slope angle of the bed exceeds φ s . In vertical two-dimensional numerical models, the evolution equation of the seabed, Equation (25) or (26), is a one-dimensional equation. Liang, Cheng [34] and Niemann, Fredsøe [54] achieved sand-slide at locations where the bed slope was greater than φ s by artificially raising the lower node and lowering the higher node of a two-point linear computational cell. In the sand-slide model for three-dimensional scour [59,81], the heights of the nodes of the two-dimensional elements with excessive slope angles were adjusted to make sure the slope angle did not exceed φ s . In the three-dimensional scour model by [36], sand-slide was achieved by updating the bed profile using the calculated bed load transport rate of sediment in the downslope direction. In addition to the sand-slide model, some smoothing techniques were also implemented to further ensure the stability of the scour models [34,54].

3. Other Scour Models
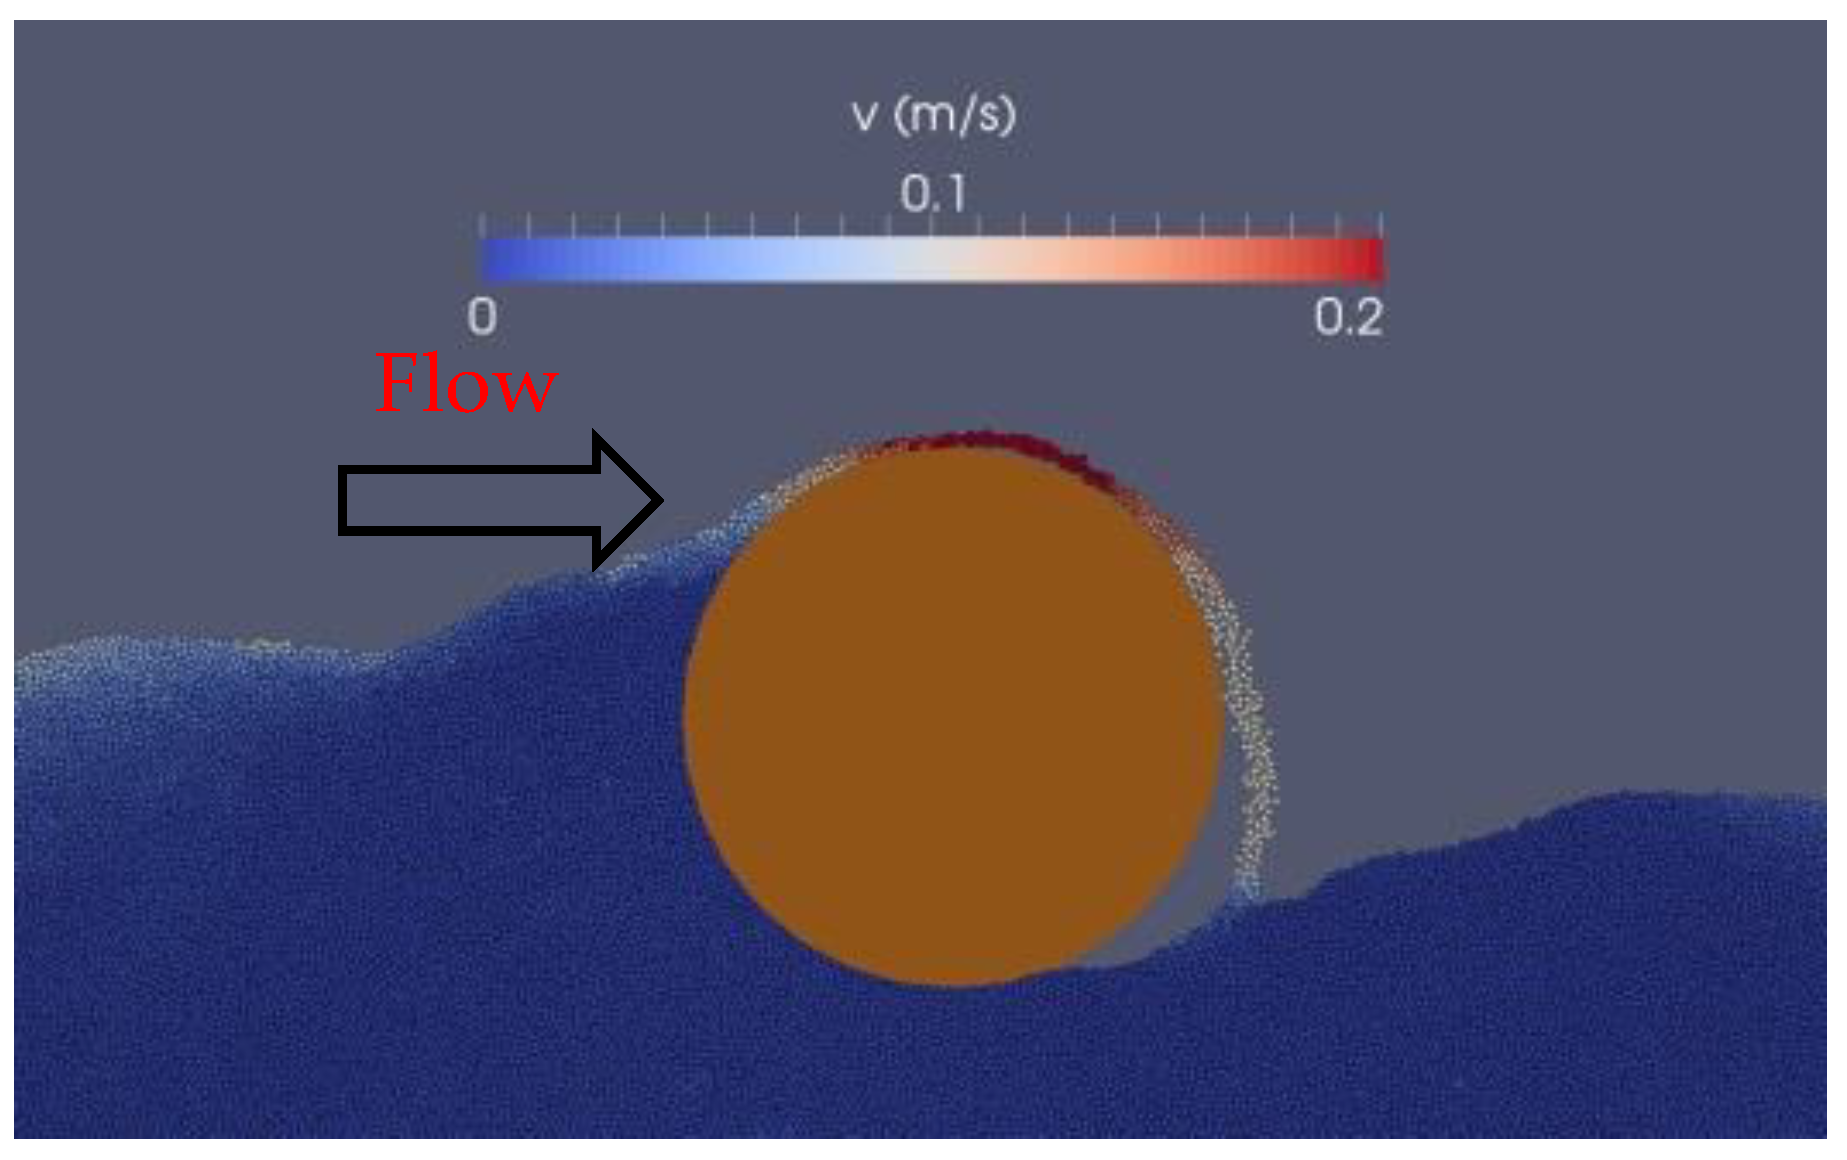
3.1. CFD-DEM Models

CFD-DEM is a novel method that uses the combination of the Discrete Element Method (DEM) and Computational Fluid Dynamics (CFD) for simulating local scour around structures. DEM is a numerical model that predicts the motion of each individual sediment particle using the equation of motion of particles as illustrated in Figure 3. It has been widely accepted as an effective method for simulating granular flows, powder mechanics and rock mechanics and was recently used for scour simulation. In CFD-DEM, water flow is simulated by CFD, and the motion of sediment particles is predicted by the equation of motion considering the forces of fluid on the particles, as well as gravity and particle–particle collision. Compared with the sediment transport rate models, the CFD-DEM models cost much more computational time because the motion of all sediment particles must be predicted. As a result, CFD-DEM models are mostly used for small-scale scour study to discover the fundamental mechanism of scour of subsea pipelines [86,87,88], scour around small piers [89], jet-flow-induced scour [90] and scour in front of breakwaters [91]. The accuracy of the motion of every sediment particle in the CFD-DEM model is highly dependent on the empirical formulae for determining the hydraulic forces on the particles and the model for the collision between particles. In all studies using CFD-DEM, the sediment particles are assumed to be spherical instead of irregular shapes. Considering random shapes of sediment particles in CFD-DEM models is still challenging.

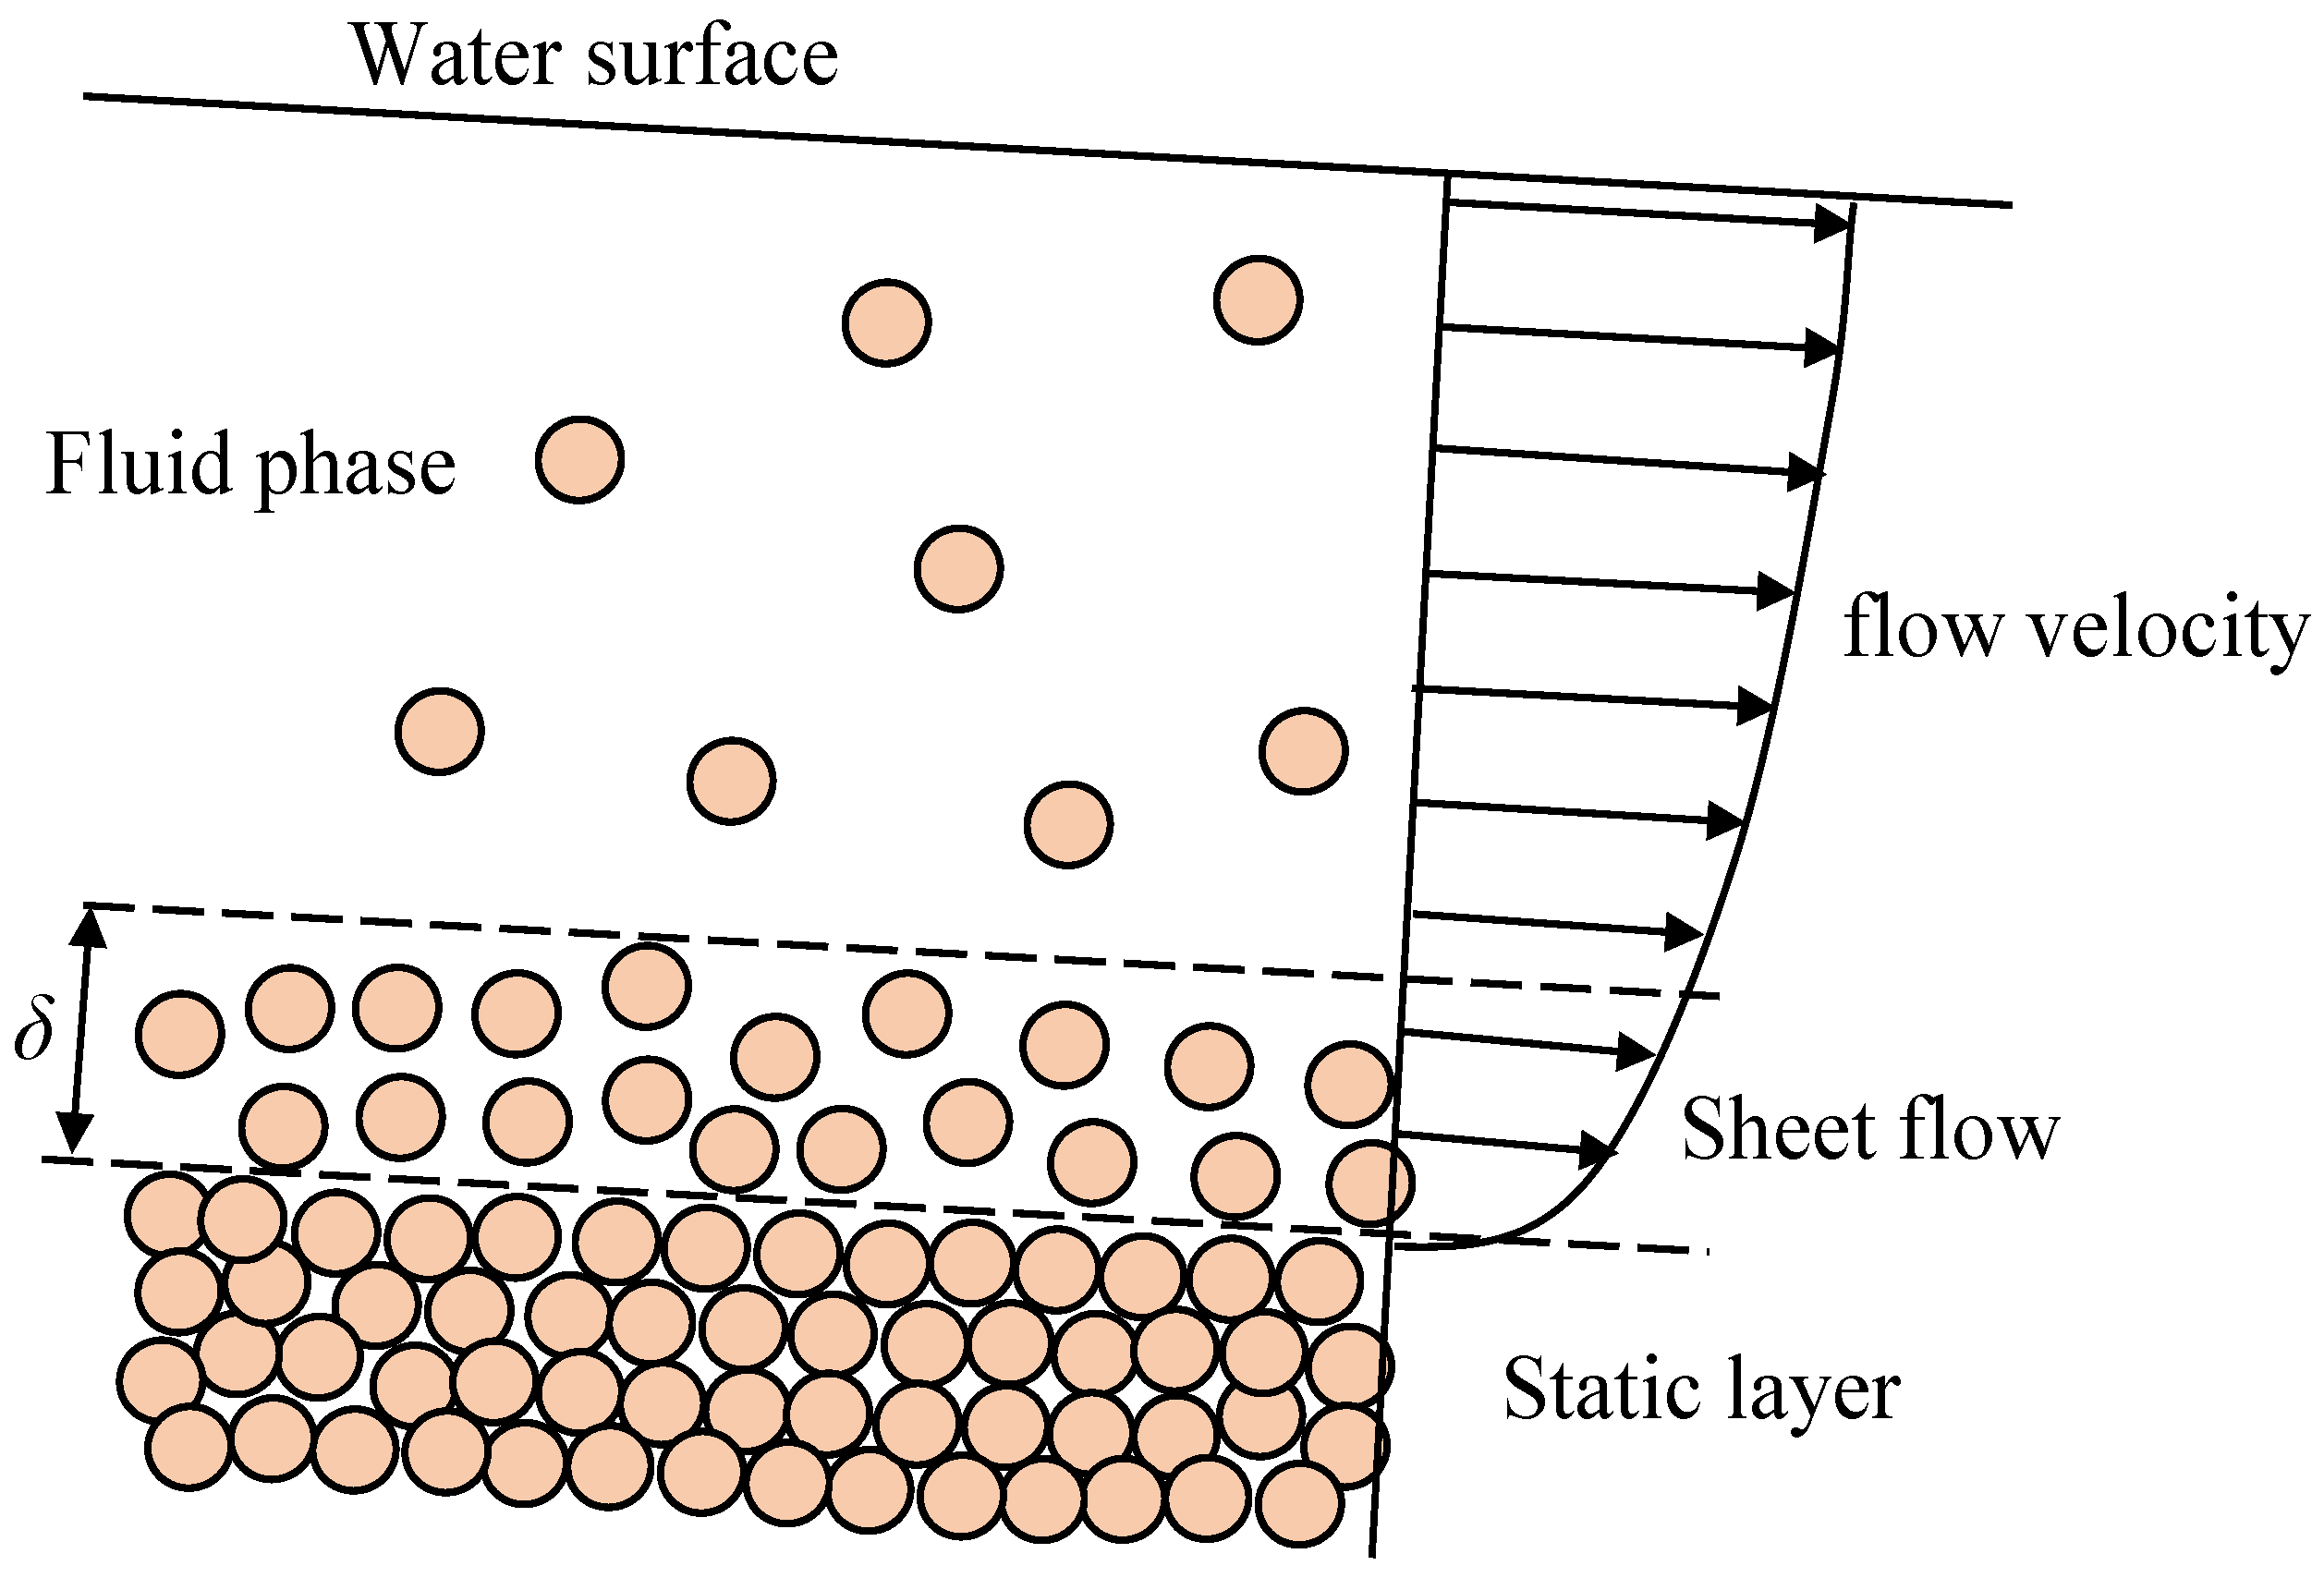
3.2. Two-Phase Model

The one-phase sediment transport rate models were generally used in the studies of the cases where the fluid velocity was sufficiently small that the suspended sediment did not affect the water flow. Under high flow velocity conditions or strong turbulence conditions, a high density of the suspended sediment moves in the water flow in the form of sheet flow [92,93], where a massive amount of sediment is mobilized and transported within a near-bottom thin layer, which is called sheet-flow layer, as illustrated in Figure 4.
To simulate the sand flow in the sheet-flow layer, two-phase models for sand transport in the sheet-flow regime have been developed. In the two-phase models, continuity equations and momentum equations in both the fluid phase and sediment phase (sheet-flow layer) are the governing equations. The sediment concentration in water and the fluid and sediment velocities can be obtained by solving the governing equations. Amoudry, Hsu [94] developed a two-phase model for sand transport in a sheet-flow regime [95]. This model uses a collisional theory and a k—ε fluid turbulence closure to respectively model the sediment and fluid phase stresses. The two-way interaction between sediment stress and turbulence stress is considered in the two-phase model, but not at the level of individual sediment particles as in CFD-DEM. Two-phase models were commonly used to simulate the sheet flow under oscillatory flow or waves. The two-phase model for simulating sheet flows in the open-source CFD software OpenFOAM is referred to as SedFOAM [96,97,98]. SedFOM has achieved accurate prediction of scour around subsea pipelines [99,100,101]. However, the two-phase models have not been used in cases with complex geometries as much as the one-phase sediment transport rate models, mainly due to their slower computational speed.
Figure 4. A schematic diagram of sheet flow with a thickness of δ (reproduced following [101]).
Jmse 10 01139 g004

3.3. Equilibrium Scour Models

Equilibrium scour models can quickly predict the scour profiles at the equilibrium stage but are not able to predict the scour history. Li and Cheng [102], Li and Cheng [103] and Lu, Li [104] developed efficient numerical models for predicting the equilibrium scour profile below subsea pipelines using an erodible boundary adjustment method. These numerical models use the shear stress along the seabed to quantify the erosion capacity of the sand, which is further used to adjust the seabed level to an equilibrium stage where the bed shear stress at any location is either the same as the critical shear stress or the shear stress of incoming flow. Olsen and Kjellesvig [105] and Pang, Skote [106] developed equilibrium scour models for predicting scour around a vertical pile and obtained good prediction of maximum scour depth. Although equilibrium scour models can predict the maximum scour depth quickly and accurately, they cannot predict the history of the scour. In many engineering applications, structures fail before the scour reaches equilibrium. On the other hand, it also happens very often that the duration of storms experienced by a structure during its lifetime is not sufficiently long to allow the scour to reach equilibrium. With the fast development of computing power, it is desirable to have the transient scour model to predict the history until the equilibrium stage.

3.4. Two-Dimensional Depth-Averaged Models

To reduce the cost of computational time and make the scour simulation affordable for large-scale problems, some early numerical models were simplified, two-dimensional depth-averaged models due to the limitation of computer power. These models solve shallow water equations for simulating flow. Since the flow equations are depth-averaged equations, they cannot predict the variation of the flow along the water depth. After the shallow water equations are solved, the bed shear stress and sediment transport rates are calculated based on the depth-averaged flow velocity. Because these models cannot directly predict complex flow features, such as the horseshoe vortices, some modifications need to be implemented to simulate scour around structures. Mohamed Rajab and Thiruvenkatasamy [62] used a 2D-averaged model to simulate scour of a vertical pile in a steady current. The scour depth on the side of the pile due to velocity acceleration was predicted well, but the scour in front of the pile due to the horseshoe vortex was not. Liao, Yeh [107] implemented a repose angle formula and a bed geometry adjustment mechanism into the 2D depth-averaged scour model and obtained good prediction of scour around spur dikes. In some numerical models for scour around large-scale vertical cylinders, the depth-averaged wave equations are used for simulating the wave-induced flow [69,107,108,109,110,111]. Because the KC number is small for large-scale vertical cylinders and the horseshoe vortex does not play an important role in scour, the depth-averaged wave models can predict the scour with reasonable accuracy. Pan and Huang [112] used a 2D depth-averaged wave model to simulate tsunami-induced scour of a vertical cylinder and received a good agreement between the numerical results and experimental data. Pan, He [113] and Pu and Lim [114] solved 2D shallow-water equations to simulate current-induced scour of a porous vertical cylinder. Pan, He [113] demonstrated that the depth-averaged 2D model cannot predict scour caused by a horseshoe vortex but can predict the effect of the permeability on the scour well. In the numerical simulation of scour around vertical piles using 2D shallow-water equations by Mohamed Rajab and Thiruvenkatasamy [62], it is apparent that the scour due to a horseshoe vortex in front of the piles was not accurately predicted.

4. Conclusions and Future Work

This paper provides a review of recent numerical studies of local scour around hydraulic and marine structures. The advantages and disadvantages of the five different types of numerical models for simulating local scour are summarized in Table 1.
Numerical studies of local scour have advanced from the simple models, such as 2D depth-averaged models and equilibrium scour models, to the transient sediment transport rate model and further to two-phase models and advanced CFD-DEM models. However, I believe the sediment transport rate models will still be welcome because of their high efficiency and proven accuracy in many studies. The advanced CFD-DEM models and two-phase models are not as efficient as the sediment transport models. They also involve many empirical formulae for calculating the interaction between the sediment particles and the water flow, which are critical for the accuracy of the methods. The CFD-DEM should have great potential to find the mechanisms of the interaction between turbulence flow and sediment particle, which can improve our understanding of scour.
In all sediment transport rate models, the flow is simulated by solving RANS equations, and the scour is simulated by solving the conservation equation of the sediment mass. Various formulae are available for calculating bed load and reference contraction of the suspended sediment, and some of these formulae have been proven to work with good accuracy for cases investigated in numerical studies. However, very few studies have been conducted to check the difference between the scour from different empirical formulae.
Numerical models are supposed to have the capability of investigating the scaling effect that cannot be avoided in experimental tests. However, most of the numerical studies on local scour have been conducted in small-scale experimental conditions, probably because no large-scale measured data or survey data are available for model validation. Only limited numerical research on scaling effects has been found in the literature. It is desirable to quantify the scaling effect using advanced models to provide a guideline for engineers to extrapolate laboratory experiments to prototype scenarios.
Nearly all the existing numerical models are for inviscid, loose sand with uniform particle size. Using a median diameter as the representative particle size is acceptable if the sand uniformity is good. However, the studies on non-uniform, graded sand are very rare, either experimentally or numerically. Future research needs to address the challenge of the gradation of sediment.

Funding

This research received no external funding.

Institutional Review Board Statement

Not applicable.

Informed Consent Statement

Not applicable.

Data Availability Statement

The study did not report any data.

Conflicts of Interest

The authors declare no conflict of interest.

References

  1. Sumer, B.M.; Fredsøe, J. The Mechanics of Scour in the Marine Environment; World Scientific: Singapore, 2002. [Google Scholar]
  2. Tafarojnoruz, A.; Gaudio, R.; Dey, S. Flow-altering countermeasures against scour at bridge piers: A review. J. Hydraul. Res. 2010, 48, 441–452. [Google Scholar] [CrossRef]
  3. Majid, S.A.; Tripathi, S. Pressure-Flow Scour Due to Vertical Contraction: A Review. J. Hydraul. Eng. 2021, 147, 03121002. [Google Scholar] [CrossRef]
  4. Tang, Z.H.; Melville, B.; Singhal, N.; Shamseldin, A.; Zheng, J.H.; Guan, D.W.; Cheng, L. Countermeasures for local scour at offshore wind turbine monopile foundations: A review. Water Sci. Eng. 2022, 15, 15–28. [Google Scholar] [CrossRef]
  5. Guan, D.W.; Xie, Y.X.; Yao, Z.S.; Chiew, Y.M.; Zhang, J.S.; Zheng, J.H. Local scour at offshore windfarm monopile foundations: A review. Water Sci. Eng. 2022, 15, 29–39. [Google Scholar] [CrossRef]
  6. Tripathi, R.P.; Pandey, K.K. Scour around spur dike in curved channel: A review. Acta Geophys. 2022; in press. [Google Scholar] [CrossRef]
  7. Fazeres-Ferradosa, T.; Chambel, J.; Taveira-Pinto, F.; Rosa-Santos, P.; Taveira Pinto, F.V.C.; Giannini, G.; Haerens, P. Scour protections for offshore foundations of marine energy harvesting technologies: A review. J. Mar. Sci. Eng. 2021, 9, 297. [Google Scholar] [CrossRef]
  8. Harasti, A.; Gilja, G.; Potočki, K.; Lacko, M. Scour at bridge piers protected by the riprap sloping structure: A review. Water 2021, 13, 3606. [Google Scholar] [CrossRef]
  9. Singh, N.B.; Devi, T.T.; Kumar, B. The local scour around bridge piers—a review of remedial techniques. ISH J. Hydraul. Eng. 2022, 28, 527–540. [Google Scholar] [CrossRef]
  10. Soulsby, R. Dynamics of Marine Sands; Thomas Telfork: London, UK, 1997. [Google Scholar]
  11. Sleath, J.F.A. Sea Bed Mechanics; John Wiley & Sons: Hoboken, NJ, USA, 1984. [Google Scholar]
  12. Hoffmans, G.J.; Verheij, H.J. Scour Manual; Taylor and Francis: London, UK, 1997; p. 205. [Google Scholar]
  13. Whitehouse, R. Scour at Marine Structures: A Manual for Practical Applications; Thomas Telford: London, UK, 1997. [Google Scholar]
  14. Melville, B.W.; Coleman, S.E. Bridge Scour; Water Resources Pubns: Boulder, CO, USA, 2000.
  15. Lee, S.O.; Sturm, T.W. Effect of sediment size scaling on physical modeling of bridge pier scour. J. Hydraul. Eng. 2009, 135, 793–802. [Google Scholar] [CrossRef]
  16. Wang, Y.H.; Jiang, W.G.; Wang, Y.H. Scale effects in scour physical-model tests: Cause and alleviation. J. Mar. Sci. Technol. 2013, 21, 532–537. [Google Scholar]
  17. Ettema, R.; Melville, B.W.; Barkdoll, B. Scale effect in pier-scour experiments. J. Hydraul. Eng. 1998, 124, 639–642. [Google Scholar] [CrossRef]
  18. Huang, W.; Yang, Q.; Xiao, H. CFD modeling of scale effects on turbulence flow and scour around bridge piers. Comput. Fluids 2009, 38, 1050–1058. [Google Scholar] [CrossRef]
  19. Liang, D.; Cheng, L.; Yeow, K. Numerical study of the Reynolds-number dependence of two-dimensional scour beneath offshore pipelines in steady currents. Ocean Eng. 2005, 32, 1590–1607. [Google Scholar] [CrossRef]
  20. Liu, M.M. Numerical investigation of local scour around submerged pipeline in shoaling conditions. Ocean Eng. 2021, 234, 109258. [Google Scholar] [CrossRef]
  21. Liu, M.M.; Lu, L.; Teng, B.; Zhao, M.; Tang, G.Q. Numerical modeling of local scour and forces for submarine pipeline under surface waves. Coast. Eng. 2016, 116, 275–288. [Google Scholar] [CrossRef]
  22. Li, J.; Fuhrman, D.R.; Kong, X.; Xie, M.; Yang, Y. Three-dimensional numerical simulation of wave-induced scour around a pile on a sloping beach. Ocean Eng. 2021, 233, 109174. [Google Scholar] [CrossRef]
  23. Li, J.; Kong, X.; Yang, Y.; Deng, L.; Xiong, W. CFD investigations of tsunami-induced scour around bridge piers. Ocean Eng. 2022, 244, 110373. [Google Scholar] [CrossRef]
  24. Liu, X.; García, M.H. Three-Dimensional numerical model with free water surface and mesh deformation for local sediment scour. J. Waterw. Port Coast. Ocean Eng. 2008, 134, 203–217. [Google Scholar] [CrossRef]
  25. Zhao, M.; Cheng, L. Numerical investigation of local scour below a vibrating pipeline under steady currents. Coast. Eng. 2010, 57, 397–406. [Google Scholar] [CrossRef]
  26. Liu, M.M.; Jin, X.; Wang, L.; Yang, F.; Tang, J. Numerical investigation of local scour around a vibrating pipeline under steady currents. Ocean Eng. 2021, 221, 108546. [Google Scholar] [CrossRef]
  27. Sumer, B.M. Mathematical modelling of scour: A review. J. Hydraul. Res. 2007, 45, 723–735. [Google Scholar] [CrossRef]
  28. Sumer, B.M. A review of recent advances in numerical modelling of local scour problems. In Proceedings of the 7th International Conference on Scour and Erosion, ICSE 2014, Perth, WA, Australia, 2–4 December 2014; pp. 61–72. [Google Scholar]
  29. Díaz-Carrasco, P.; Croquer, S.; Tamimi, V.; Lacey, J.; Poncet, S. Advances in numerical reynolds-averaged navier–stokes modelling of wave-structure-seabed interactions and scour. J. Mar. Sci. Eng. 2021, 9, 611. [Google Scholar] [CrossRef]
  30. Cheng, L.; Li, F. Modelling of local scour below a sagging pipeline. Coast. Eng. J. 2003, 45, 189–210. [Google Scholar] [CrossRef]
  31. Kim, H.S.; Nabi, M.; Kimura, I.; Shimizu, Y. Numerical investigation of local scour at two adjacent cylinders. Adv. Water Resour. 2014, 70, 131–147. [Google Scholar] [CrossRef]
  32. Li, F.; Cheng, L. Prediction of lee-wake scouring of pipelines in currents. J. Waterw. Port Coast. Ocean Eng. 2001, 127, 106–112. [Google Scholar] [CrossRef]
  33. Brørs, B. Numerical modeling of flow and scour at pipelines. J. Hydraul. Eng. 1999, 125, 511–522. [Google Scholar] [CrossRef]
  34. Liang, D.; Cheng, L.; Li, F. Numerical modeling of flow and scour below a pipeline in currents. Part II. Scour simulation. Coast. Eng. 2005, 52, 43–62. [Google Scholar]
  35. Yu, P.; Liu, J.; Sun, Z. Study on the Self-Sustaining Inlet Boundary Conditions for Numerical Simulation on Local Scour. J. Waterw. Port Coast. Ocean Eng. 2020, 146, 04020027. [Google Scholar] [CrossRef]
  36. Roulund, A.; Sumer, B.M.; Fredsøe, J.; Michelsen, J. Numerical and experimental investigation of flow and scour around a circular pile. J. Fluid Mech. 2005, 534, 351–401. [Google Scholar] [CrossRef]
  37. Zhao, M.; Cheng, L. Numerical modeling of local scour below a piggyback pipeline in currents. J. Hydraul. Eng. 2008, 134, 1452–1463. [Google Scholar] [CrossRef]
  38. Zhao, M.; Cheng, L.; Zang, Z. Experimental and numerical investigation of local scour around a submerged vertical circular cylinder in steady currents. Coast. Eng. 2010, 57, 709–721. [Google Scholar] [CrossRef]
  39. Engelund, F.; Fredsoe, J. Sediment Transport Model For Straight Alluvial Channels. Hydrol. Res. 1976, 7, 293–306. [Google Scholar] [CrossRef]
  40. Kim, H.S.; Chen, H.C.; Briaud, J.L. Numerical Simulation of Scour Hole Backfilling in Unidirectional Flow. J. Hydraul. Eng. 2022, 148, 04022013. [Google Scholar] [CrossRef]
  41. Liu, M.M.; Wang, H.C.; Tang, G.Q.; Shao, F.F.; Jin, X. Investigation of local scour around two vertical piles by using numerical method. Ocean Eng. 2022, 244, 110405. [Google Scholar] [CrossRef]
  42. Ajdehak, E.; Zhao, M.; Cheng, L.; Draper, S. Numerical investigation of local scour beneath a sagging subsea pipeline in steady currents. Coast. Eng. 2018, 136, 106–118. [Google Scholar] [CrossRef]
  43. Van Rijn, L.C. Mathematical Modelling of Morphological Processes in the Case of Suspended Sediment Transport; Delft Hydraul. Lab.: Delft, The Netherlands, 1987. [Google Scholar]
  44. Ahmad, N.; Bihs, H.; Myrhaug, D.; Kamath, A.; Arntsen, Ø.A. Numerical modeling of breaking wave induced seawall scour. Coast. Eng. 2019, 150, 108–120. [Google Scholar] [CrossRef]
  45. Ahmad, N.; Bihs, H.; Myrhaug, D.; Kamath, A.; Arntsen, Ø.A. Numerical modelling of pipeline scour under the combined action of waves and current with free-surface capturing. Coast. Eng. 2019, 148, 19–35. [Google Scholar] [CrossRef]
  46. Omara, H.; Elsayed, S.M.; Abdeelaal, G.M.; Abd-Elhamid, H.F.; Tawfik, A. 3-D numerical study of local scour around bridge piers. In Proceedings of the AIP Conference Proceedings, Maharashtra, India, 28 September 2018. [Google Scholar]
  47. Ahmad, N.; Bihs, H.; Myrhaug, D.; Kamath, A.; Arntsen, A. Three-dimensional numerical modelling of wave-induced scour around piles in a side-by-side arrangement. Coast. Eng. 2018, 138, 132–151. [Google Scholar] [CrossRef]
  48. Ahmad, N.; Kamath, A.; Bihs, H. 3D numerical modelling of scour around a jacket structure with dynamic free surface capturing. Ocean Eng. 2020, 200, 107104. [Google Scholar] [CrossRef]
  49. Ehteram, M.; Mahdavi Meymand, A. Numerical modeling of scour depth at side piers of the bridge. J. Comput. Appl. Math. 2015, 280, 68–79. [Google Scholar] [CrossRef]
  50. Nielson, P. Coastal Bottom Boundary Layers and Sediment Transport; World Scientific Publishing: Singapore, 1992. [Google Scholar]
  51. Meyer-Peter, E.; Müller, R. Formulas for Bed-Load Transport; Report of Second Meeting of International Association of Hydraulic Structures Research; IAHR: Stockholm, Sweden, 1948; pp. 39–64. [Google Scholar]
  52. Deng, X.; He, S.; Cao, Z. Numerical investigation of the local scour around a coconut tree root foundation under wave-current joint actions. Ocean Eng. 2022, 245, 110563. [Google Scholar] [CrossRef]
  53. Jalal, H.K.; Hassan, W.H. Three-dimensional numerical simulation of local scour around circular bridge pier using Flow-3D software. Proc. IOP Conf. Ser. Mater. Sci. Eng. 2020, 745, 012150. [Google Scholar] [CrossRef]
  54. Niemann, S.L.; Fredsøe, J.; Jacobsen, N.G. Sand dunes in steady flow at low froude numbers: Dune height evolution and flow resistance. J. Hydraul. Eng. 2010, 137, 5–14. [Google Scholar] [CrossRef]
  55. Quezada, M.; Tamburrino, A.; Niño, Y. Numerical simulation of scour around circular piles due to unsteady currents and oscillatory flows. Eng. Appl. Comput. Fluid Mech. 2018, 12, 354–374. [Google Scholar] [CrossRef]
  56. Yang, Q.; Yu, P.; Liu, H. CFD modelling of local scour around Tri-USAF in sand with different arrangements under steady current. Ocean Eng. 2021, 235, 109359. [Google Scholar] [CrossRef]
  57. Baykal, C.; Sumer, B.M.; Fuhrman, D.R.; Jacobsen, N.G.; Fredsoe, J. Numerical investigation of flow and scour around a vertical circular cylinder. Philos. Trans. R. Soc. A Math. Phys. Eng. Sci. 2015, 373, 20140104. [Google Scholar] [CrossRef]
  58. Fan, F.; Liang, B.; Li, Y.; Bai, Y.; Zhu, Y.; Zhu, Z. Numerical Investigation of the Influence of Water Jumping on the Local Scour beneath a Pipeline under Steady Flow. Water 2017, 9, 642. [Google Scholar] [CrossRef]
  59. Fuhrman, D.R.; Baykal, C.; Mutlu Sumer, B.; Jacobsen, N.G.; Fredsøe, J. Numerical simulation of wave-induced scour and backfilling processes beneath submarine pipelines. Coast. Eng. 2014, 94, 10–22. [Google Scholar] [CrossRef]
  60. Li, Y.; Ong, M.C.; Fuhrman, D.R.; Larsen, B.E. Numerical investigation of wave-plus-current induced scour beneath two submarine pipelines in tandem. Coast. Eng. 2020, 156, 103619. [Google Scholar] [CrossRef]
  61. Zyserman, J.A.; Fredsøe, J. Data analysis of bed concentration of suspended sediment. J. Hydraul. Eng. 1994, 120, 1021–1042. [Google Scholar] [CrossRef]
  62. Mohamed Rajab, P.; Thiruvenkatasamy, K. Comparison of 2D-numerical modelling of local scour around a circular bridge pier in steady current. J. Eng. Appl. Sci. 2018, 13, 5243–5251. [Google Scholar]
  63. Zhou, C.; Li, J.; Wang, J.; Tang, G. Numerical study of local scour around a submarine pipeline with a spoiler using a symmetry boundary condition. Symmetry 2021, 13, 1847. [Google Scholar] [CrossRef]
  64. Wu, W.; Rodi, W.; Weaka, T. 3D numerical modeling of flow and sediment transport in open channels. J. Hydraul. Eng. 2000, 126, 4–15. [Google Scholar] [CrossRef]
  65. Ahmad, N.; Bihs, H.; Kamath, A.; Arntsen, Ø.A. CFD modeling of local scour around a pair of tandem cylinders under wave conditions. In Proceedings of the International Conference on Port and Ocean Engineering under Arctic Conditions, POAC, Trondheim, Norway, 14–18 June 2015. [Google Scholar]
  66. Ahmad, N.; Bihs, H.; Kamath, A.; Arntsen, Ø.A. 3D Numerical modelling of pile scour with free surface profile under waves and current using the level set method in model REEF3D. In Proceedings of Scour and Erosion—Proceedings of the 8th International Conference on Scour and Erosion; ICSE 2016; Mathematical Institute: Oxford, UK, 2016; pp. 69–76. [Google Scholar]
  67. Baykal, C.; Sumer, B.M.; Fuhrman, D.R.; Jacobsen, N.G.; Fredsøe, J. Numerical simulation of scour and backfilling processes around a circular pile in waves. Coast. Eng. 2017, 122, 87–107. [Google Scholar] [CrossRef]
  68. Duc, B.M.; Rodi, W. Numerical simulation of contraction scour in an open laboratory channel. J. Hydraul. Eng. 2008, 134, 367–377. [Google Scholar] [CrossRef]
  69. Ezzeldin, R.M. Numerical and experimental investigation for the effect of permeability of spur dikes on local scour. J. Hydroinformatics 2019, 21, 335–342. [Google Scholar] [CrossRef]
  70. Chen, B. The numerical simulation of local scour in front of a vertical-wall breakwater. J. Hydrodyn. 2006, 18, 134–138. [Google Scholar] [CrossRef]
  71. Dixen, M.; Sumer, B.M.; Fredsøe, J. Numerical and experimental investigation of flow and scour around a half-buried sphere. Coast. Eng. 2013, 73, 84–105. [Google Scholar] [CrossRef]
  72. Peng, Y.; Zhu, L. Numerical simulation of local scour around bridge piers using novel inlet turbulent boundary conditions. Ocean Eng. 2020, 218, 108166. [Google Scholar] [CrossRef]
  73. Zhang, Z.; Shi, B. Numerical simulation of local scour around underwater pipeline based on FLUENT software. J. Appl. Fluid Mech. 2016, 9, 711–718. [Google Scholar] [CrossRef]
  74. Wei, K.; Qiu, F.; Qin, S. Experimental and numerical investigation into effect of skirted caisson on local scour around the large-scale bridge foundation. Ocean Eng. 2022, 250, 111052. [Google Scholar] [CrossRef]
  75. Zhang, Q.; Zhou, X.L.; Wang, J.H. Numerical investigation of local scour around three adjacent piles with different arrangements under current. Ocean Eng. 2017, 142, 625–638. [Google Scholar] [CrossRef]
  76. Lian, J.; Li, J.; Guo, Y.; Wang, H.; Yang, X. Numerical study on local scour characteristics of multi-bucket jacket foundation considering exposed height. Appl. Ocean Res. 2022, 121, 103092. [Google Scholar] [CrossRef]
  77. Samma, H.; Khosrojerdi, A.; Rostam-Abadi, M.; Mehraein, M.; Cataño-Lopera, Y. Numerical simulation of scour and flow field over movable bed induced by a submerged wall jet. J. Hydroinformatics 2020, 22, 385–401. [Google Scholar] [CrossRef]
  78. Tang, J.H.; Puspasari, A.D. Numerical simulation of local scour around three cylindrical piles in a tandem arrangement. Water 2021, 13, 3623. [Google Scholar] [CrossRef]
  79. Xiang, Q.; Wei, K.; Li, Y.; Zhang, M.; Qin, S. Experimental and Numerical Investigation of Local Scour for Suspended Square Caisson under Steady Flow. KSCE J. Civ. Eng. 2020, 24, 2682–2693. [Google Scholar] [CrossRef]
  80. Yang, S.; Guo, Y.; Shi, B.; Yu, G.; Yang, L.; Zhang, M. Numerical investigation of the influence of the small pipeline on local scour morphology around the piggyback pipeline. Ocean Eng. 2021, 240, 109973. [Google Scholar] [CrossRef]
  81. Fan, F.; Liang, B.; Bai, Y.; Zhu, Z.; Zhu, Y. Numerical modeling of local scour around hydraulic structure in sandy beds by dynamic mesh method. J. Ocean Univ. China 2017, 16, 738–746. [Google Scholar] [CrossRef]
  82. Omara, H.; Elsayed, S.M.; Abdeelaal, G.M.; Abd-Elhamid, H.F.; Tawfik, A. Hydromorphological Numerical Model of the Local Scour Process around Bridge Piers. Arab. J. Sci. Eng. 2019, 44, 4183–4199. [Google Scholar] [CrossRef]
  83. Yu, P.; Hu, R.; Yang, J.; Liu, H. Numerical investigation of local scour around USAF with different hydraulic conditions under currents and waves. Ocean Eng. 2020, 213, 107696. [Google Scholar] [CrossRef]
  84. Hu, R.; Wang, X.; Liu, H.; Chen, D. Numerical Study of Local Scour around Tripod Foundation in Random Waves. J. Mar. Sci. Eng. 2022, 10, 475. [Google Scholar] [CrossRef]
  85. Xu, J.; Xia, J.; Wang, L.; Zhu, H.; Avital, E.J. Direct numerical simulation on local scour around the cylinder induced by internal solitary waves propagating over a slope. Ocean Eng. 2022, 247, 110525. [Google Scholar] [CrossRef]
  86. Zhang, Y.; Zhao, M.; Kwok, K.C.S.; Liu, M.M. Computational fluid dynamics-discrete element method analysis of the onset of scour around subsea pipelines. Appl. Math. Model. 2014, 39, 7611–7619. [Google Scholar] [CrossRef]
  87. Hu, D.; Tang, W.; Sun, L.; Li, F.; Ji, X.; Duan, Z. Numerical simulation of local scour around two pipelines in tandem using CFD–DEM method. Appl. Ocean Res. 2019, 93, 101968. [Google Scholar] [CrossRef]
  88. Yang, J.; Low, Y.M.; Lee, C.H.; Chiew, Y.M. Numerical simulation of scour around a submarine pipeline using computational fluid dynamics and discrete element method. Appl. Math. Model. 2018, 55, 400–416. [Google Scholar] [CrossRef]
  89. Li, J.; Tao, J. CFD-DEM Two-Way Coupled Numerical Simulation of Bridge Local Scour Behavior under Clear-Water Conditions. Transp. Res. Rec. 2018, 2672, 107–117. [Google Scholar] [CrossRef]
  90. Abdelrazek, A.M.; Kimura, I.; Shimizu, Y. Numerical simulation on local scour below a weir using Two-phase WC-SPH method. In Proceedings of Scour and Erosion—Proceedings of the 8th International Conference on Scour and Erosion, Oxford, UK, 12–15 September 2016; ICSE: Oxford, UK; pp. 61–68.
  91. Yeganeh-Bakhtiary, A.; Houshangi, H.; Abolfathi, S. Lagrangian two-phase flow modeling of scour in front of vertical breakwater. Coast. Eng. J. 2020, 62, 252–266. [Google Scholar] [CrossRef]
  92. Horikawa, K.; Watanabe, A.; Katori, S. Sediment Transport Under Sheet Flow Condition. In Proceedings of the Coastal Engineering Conference, Cape Town, South Africa, 1 November 1994; pp. 1335–1352. [Google Scholar]
  93. Asano, T. Sediment transport under sheet-flow conditions. J. Waterw. Port Coast. Ocean Eng. 1995, 121, 239–246. [Google Scholar] [CrossRef]
  94. Amoudry, L.; Hsu, T.J.; Liu, P.L.F. Two-phase model for sand transport in sheet flow regime. J. Geophys. Res. Ocean. 2008, 113, C03011. [Google Scholar] [CrossRef]
  95. Zhao, Z.; Fernando, H.J.S. Numerical simulation of scour around pipelines using an Euler—Euler coupled two-phase model. Environ. Fluid Mech. 2007, 7, 121–142. [Google Scholar] [CrossRef]
  96. Cheng, Z.; Hsu, T.J.; Calantoni, J. SedFoam: A multi-dimensional Eulerian two-phase model for sediment transport and its application to momentary bed failure. Coast. Eng. 2017, 119, 32–50. [Google Scholar] [CrossRef]
  97. Chauchat, J.; Cheng, Z.; Nagel, T.; Bonamy, C.; Hsu, T.J. SedFoam-2.0: A 3-D two-phase flow numerical model for sediment transport. Geosci. Model Dev. 2017, 10, 4367–4392. [Google Scholar] [CrossRef]
  98. Zhu, H.; Qi, X.; Lin, P.; Yang, Y. Numerical simulation of flow around a submarine pipe with a spoiler and current-induced scour beneath the pipe. Appl. Ocean Res. 2013, 41, 87–100. [Google Scholar] [CrossRef]
  99. Huang, J.; Yin, G.; Ong, M.C.; Myrhaug, D.; Jia, X. Numerical investigation of scour beneath pipelines subjected to an oscillatory flow condition. J. Mar. Sci. Eng. 2021, 9, 1102. [Google Scholar] [CrossRef]
  100. Mathieu, A.; Chauchat, J.; Bonamy, C.; Nagel, T. Two-phase flow simulation of tunnel and lee-wake erosion of scour below a submarine pipeline. Water 2019, 11, 1727. [Google Scholar] [CrossRef]
  101. Lee, C.H.; Low, Y.M.; Chiew, Y.M. Multi-dimensional rheology-based two-phase model for sediment transport and applications to sheet flow and pipeline scour. Phys. Fluids 2016, 28, 053305. [Google Scholar] [CrossRef]
  102. Li, F.; Cheng, L. Numerical simulation of pipeline local scour with lee-wake effects. In Proceedings of the 1999 Ninth International Offshore and Polar Engineering Conference, Osaka, Japan, 21–26 June 1999; pp. 212–216. [Google Scholar]
  103. Li, F.; Cheng, L. Numerical simulation of pipeline local scour with lee-wake effects. Int. J. Offshore Polar Eng. 2000, 10, 195–199. [Google Scholar]
  104. Lu, L.; Li, Y.; Qin, J. Numerical simulation of the equilibrium profile of local scour around submarine pipelines based on renormalized group turbulence model. Ocean Eng. 2005, 32, 2007–2019. [Google Scholar] [CrossRef]
  105. Olsen, N.R.B.; Kjellesvig, H.M. Three-dimensional numerical flow modeling for estimation of maximum local scour depth. J. Hydraul. Res. 1998, 36, 579–590. [Google Scholar] [CrossRef]
  106. Pang, A.L.J.; Skote, M.; Lim, S.Y.; Gullman-Strand, J.; Morgan, N. A numerical approach for determining equilibrium scour depth around a mono-pile due to steady currents. Appl. Ocean Res. 2016, 57, 114–124. [Google Scholar] [CrossRef]
  107. Liao, C.T.; Yeh, K.C.; Lan, Y.C.; Jhong, R.K.; Jia, Y. Improving the 2d numerical simulations on local scour hole around spur dikes. Water 2021, 13, 1462. [Google Scholar] [CrossRef]
  108. Zhao, M.; Teng, B. Numerical simulation of local scour around A large circular cylinder under wave action. China Ocean Eng. 2001, 15, 371–382. [Google Scholar]
  109. Zhao, M.; Teng, B.; Cheng, L. Numerical simulation of wave-induced local scour around a large cylinder. Coast. Eng. J. 2004, 46, 291–314. [Google Scholar] [CrossRef]
  110. Zhao, M.; Teng, B.; Liu, S.X. Numerical simulation of wave scour around a large-scale circular cylinder. China Ocean Eng. 2002, 16, 513–523. [Google Scholar]
  111. Jyothi, K.; Mani, J.S.; Pranesh, M.R. Numerical modelling of flow around coastal structures and scour prediction. Ocean Eng. 2001, 29, 417–444. [Google Scholar] [CrossRef]
  112. Pan, C.; Huang, W. Numerical modeling of Tsunami wave run-up and effects on sediment scour around a cylindrical pier. J. Eng. Mech. 2012, 138, 1224–1235. [Google Scholar] [CrossRef]
  113. Pan, J.; He, Z.; Shih, W.; Cheng, N. Numerical modeling of scour and deposition around permeable cylindrical structures. Int. J. Sediment Res. 2020, 35, 278–286. [Google Scholar] [CrossRef]
  114. Pu, J.H.; Lim, S.Y. Efficient numerical computation and experimental study of temporally long equilibrium scour development around abutment. Environ. Fluid Mech. 2014, 14, 69–86. [Google Scholar] [CrossRef]
Figure 1. Definition sketch of flow around a submerged vertical cylinder.
Jmse 10 01139 g001
Figure 2. A sketch of sediment transport on a slope bed.
Jmse 10 01139 g002
Figure 3. Flow and sediment transport around a subsea pipeline coloured by the flow velocity [86].
Jmse 10 01139 g003
Table 1. Comparison between different scour models.
MethodAdvantageDisadvantage
Sediment transport rate modelsHigh efficiency, fast calculating speedAccuracy relies on the empirical formulae for sediment transport rate. Not suitable for sheet flow.
Two-phase modelsMainly developed for high-velocity sheet-flow conditionLower efficiency than the sediment transport rate method because the sand phase needs be solved.
CFD-DEM modelsSuitable for study of fundamental mechanisms of scour because motion of every sediment particle is simulatedUnaffordable computing time for large-scale problems.
Equilibrium scour modelsPredicts equilibrium scour profile quicklyUnable to predict history of scour.
Depth-averaged modelsEarly models that can simulate scour efficiently where the flow is nearly two-dimensionalUnable to simulate scour around three-dimensional structure with complex vortex structures.
Publisher’s Note: MDPI stays neutral with regard to jurisdictional claims in published maps and institutional affiliations.

