Impacts of Shipping Carbon Tax on Dry Bulk Shipping Costs and Maritime Trades—The Case of China

Abstract
:1. Introduction
2. Methods and Materials
2.1. Shipping Carbon Emissions Model
2.2. Data Collection
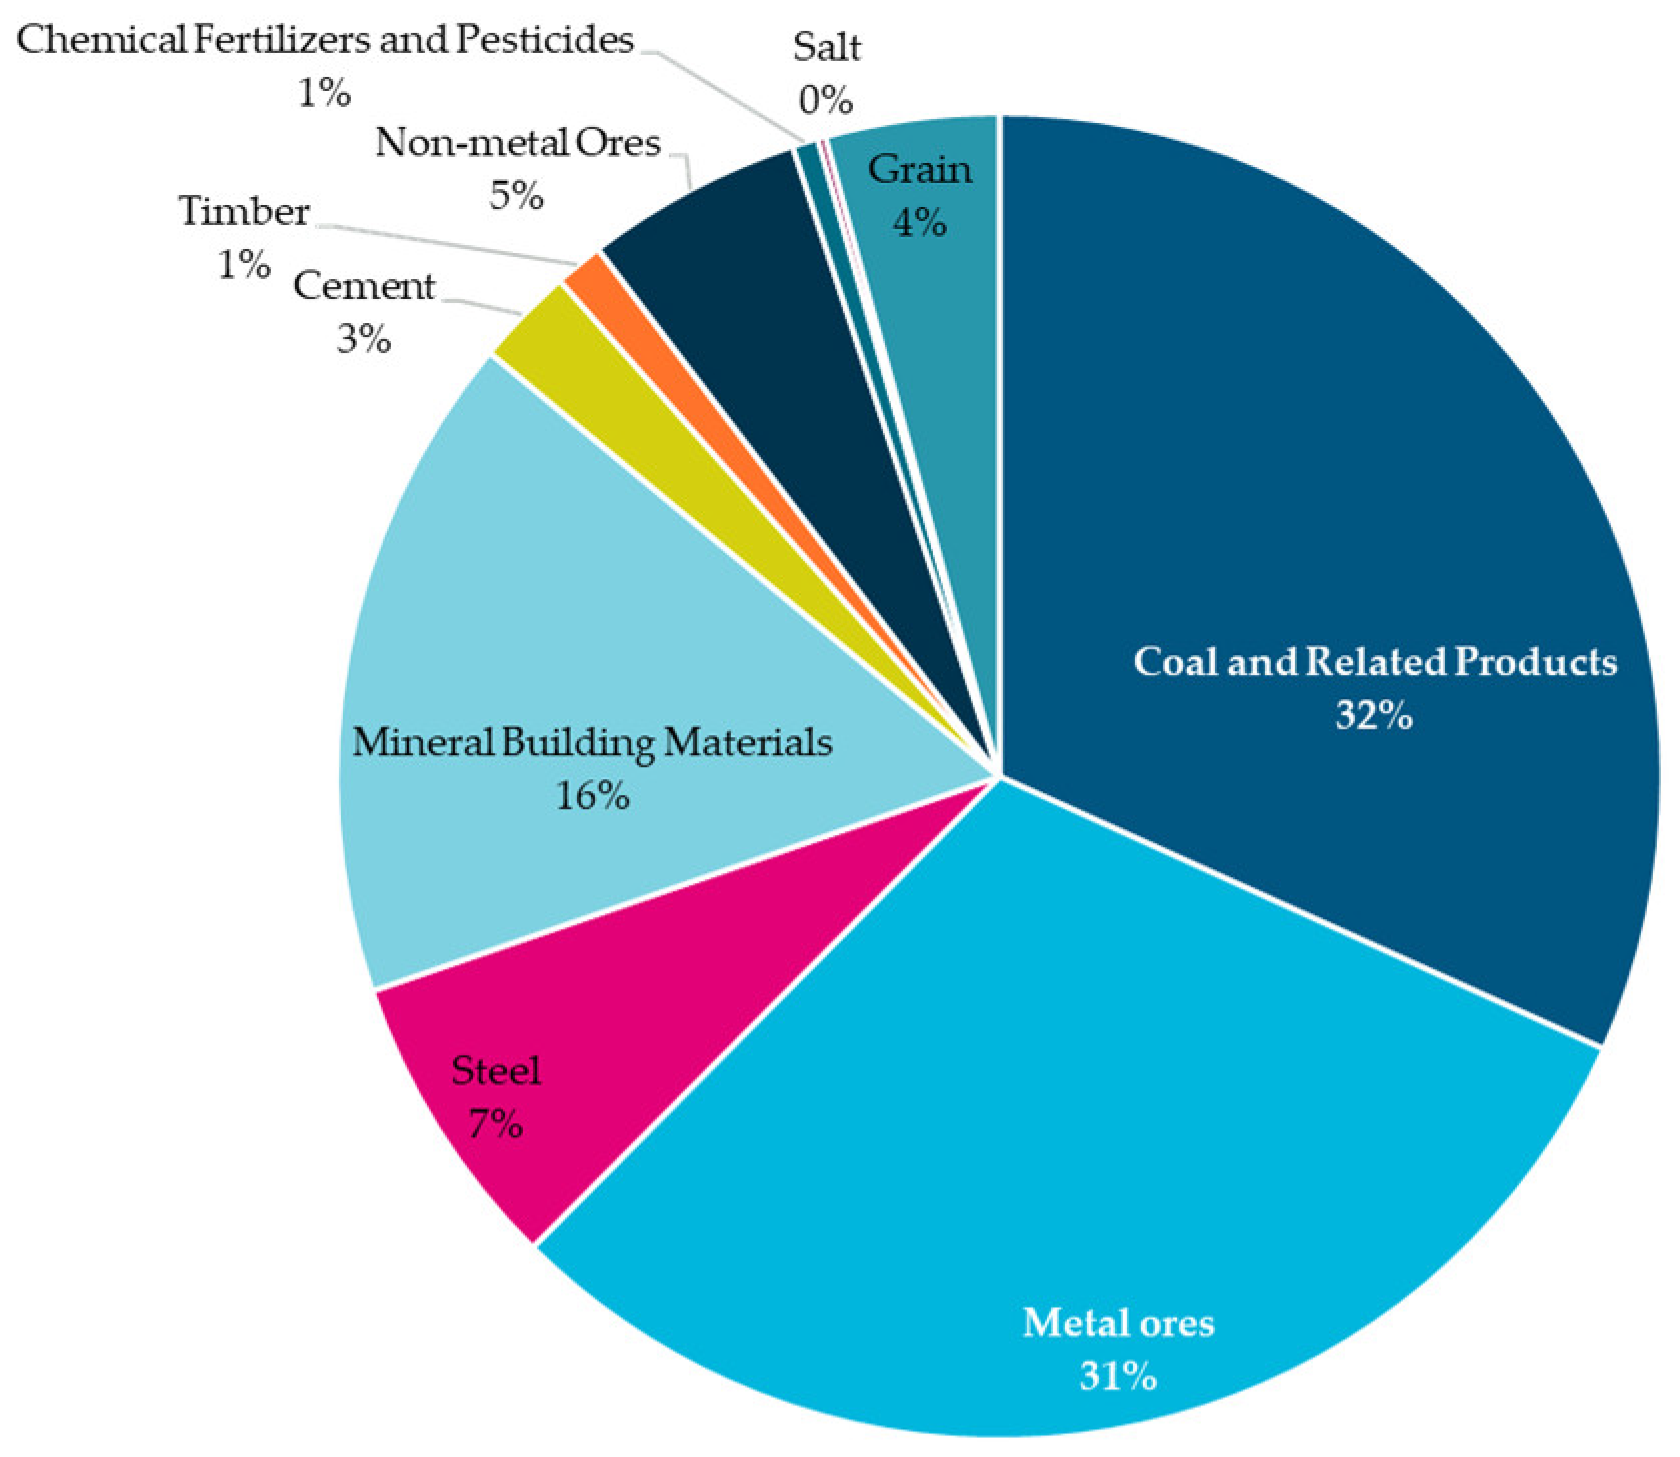
2.2.1. China’s Dry Bulk Shipping Trade
2.2.2. China’s Dry Bulk Trade Vessel Sizes and Sailing Distances
3. Results
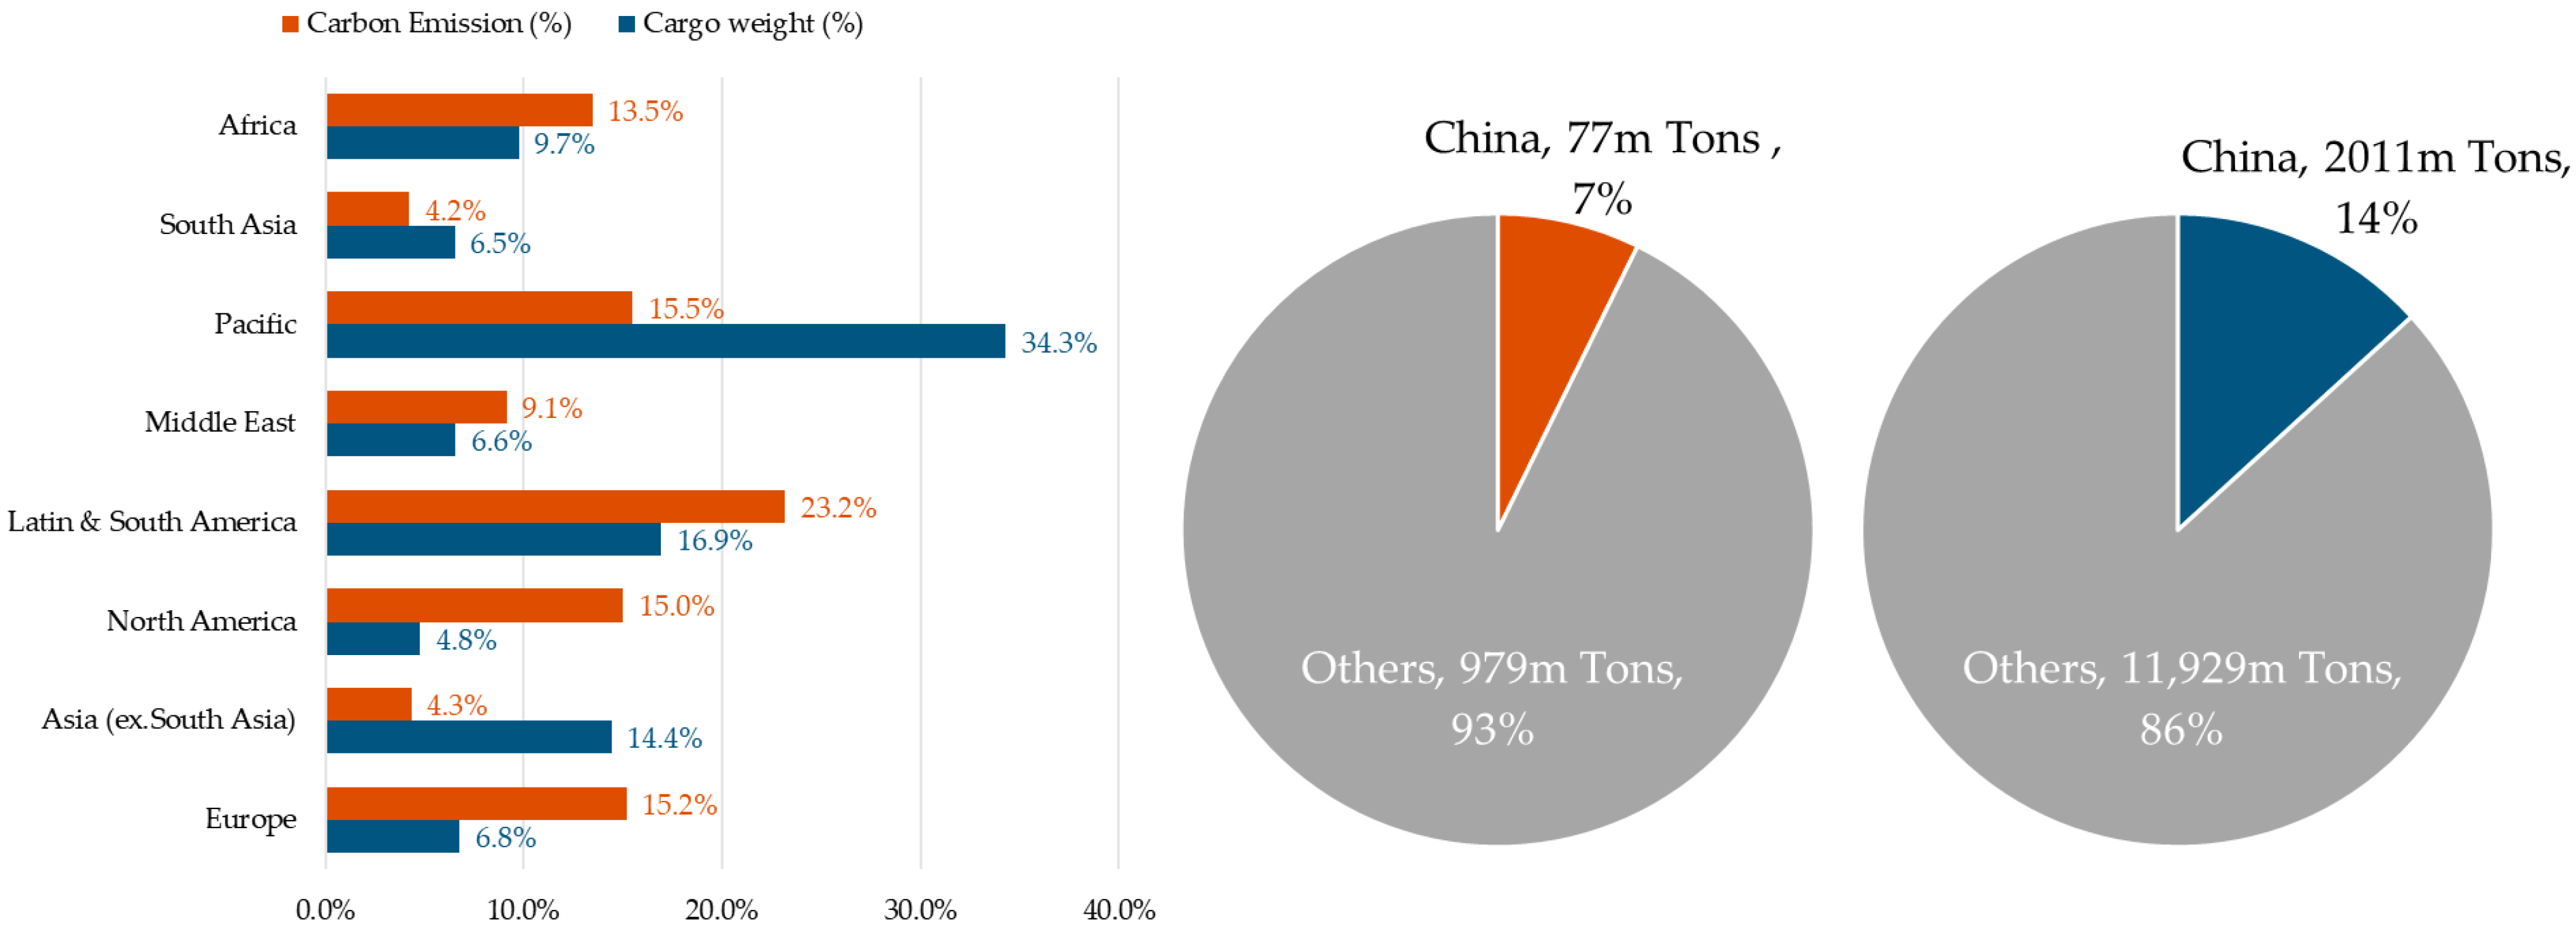
3.1. Carbon Emissions Estimation
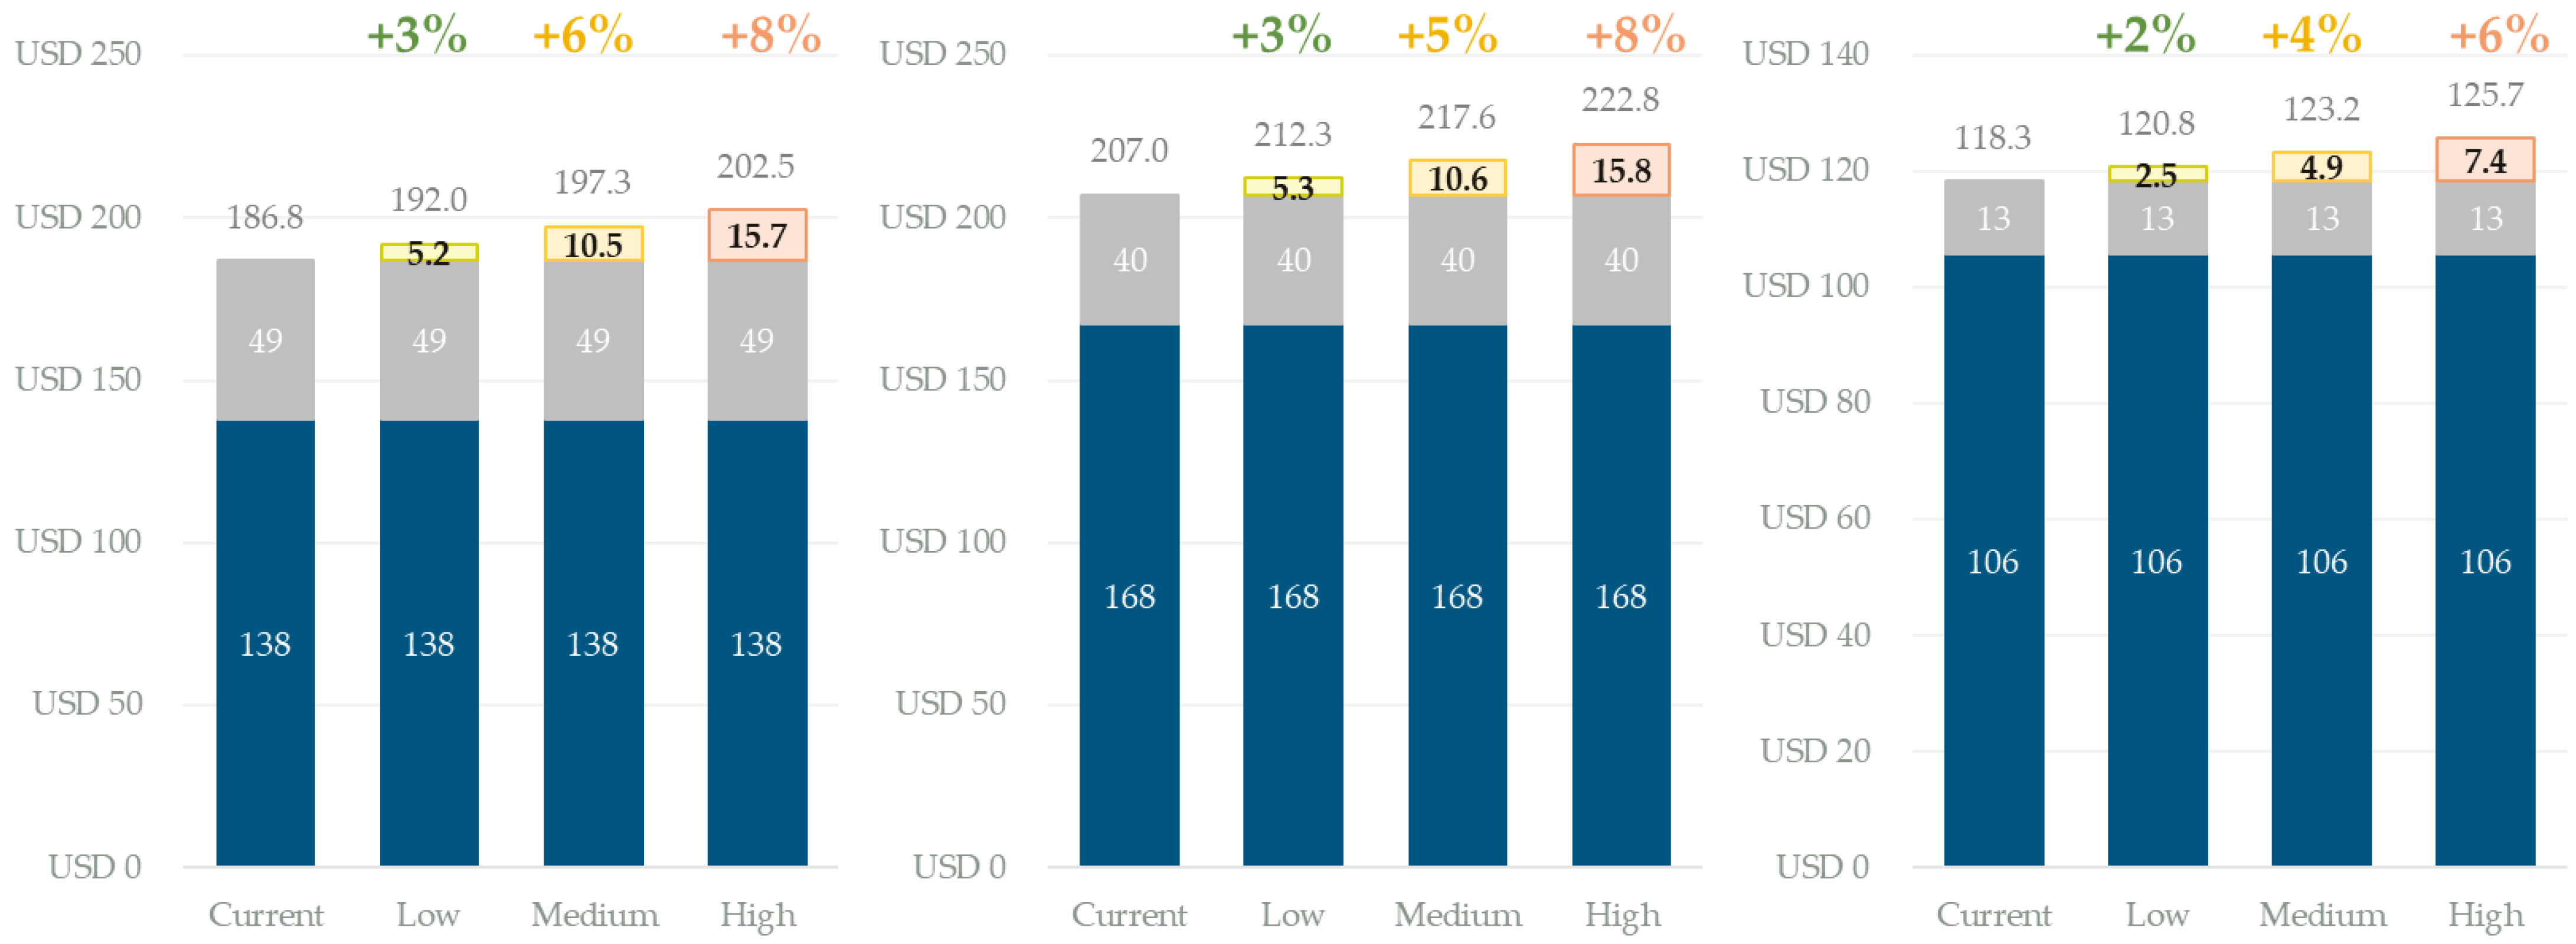
3.2. Carbon Costs Estimation
4. Discussion
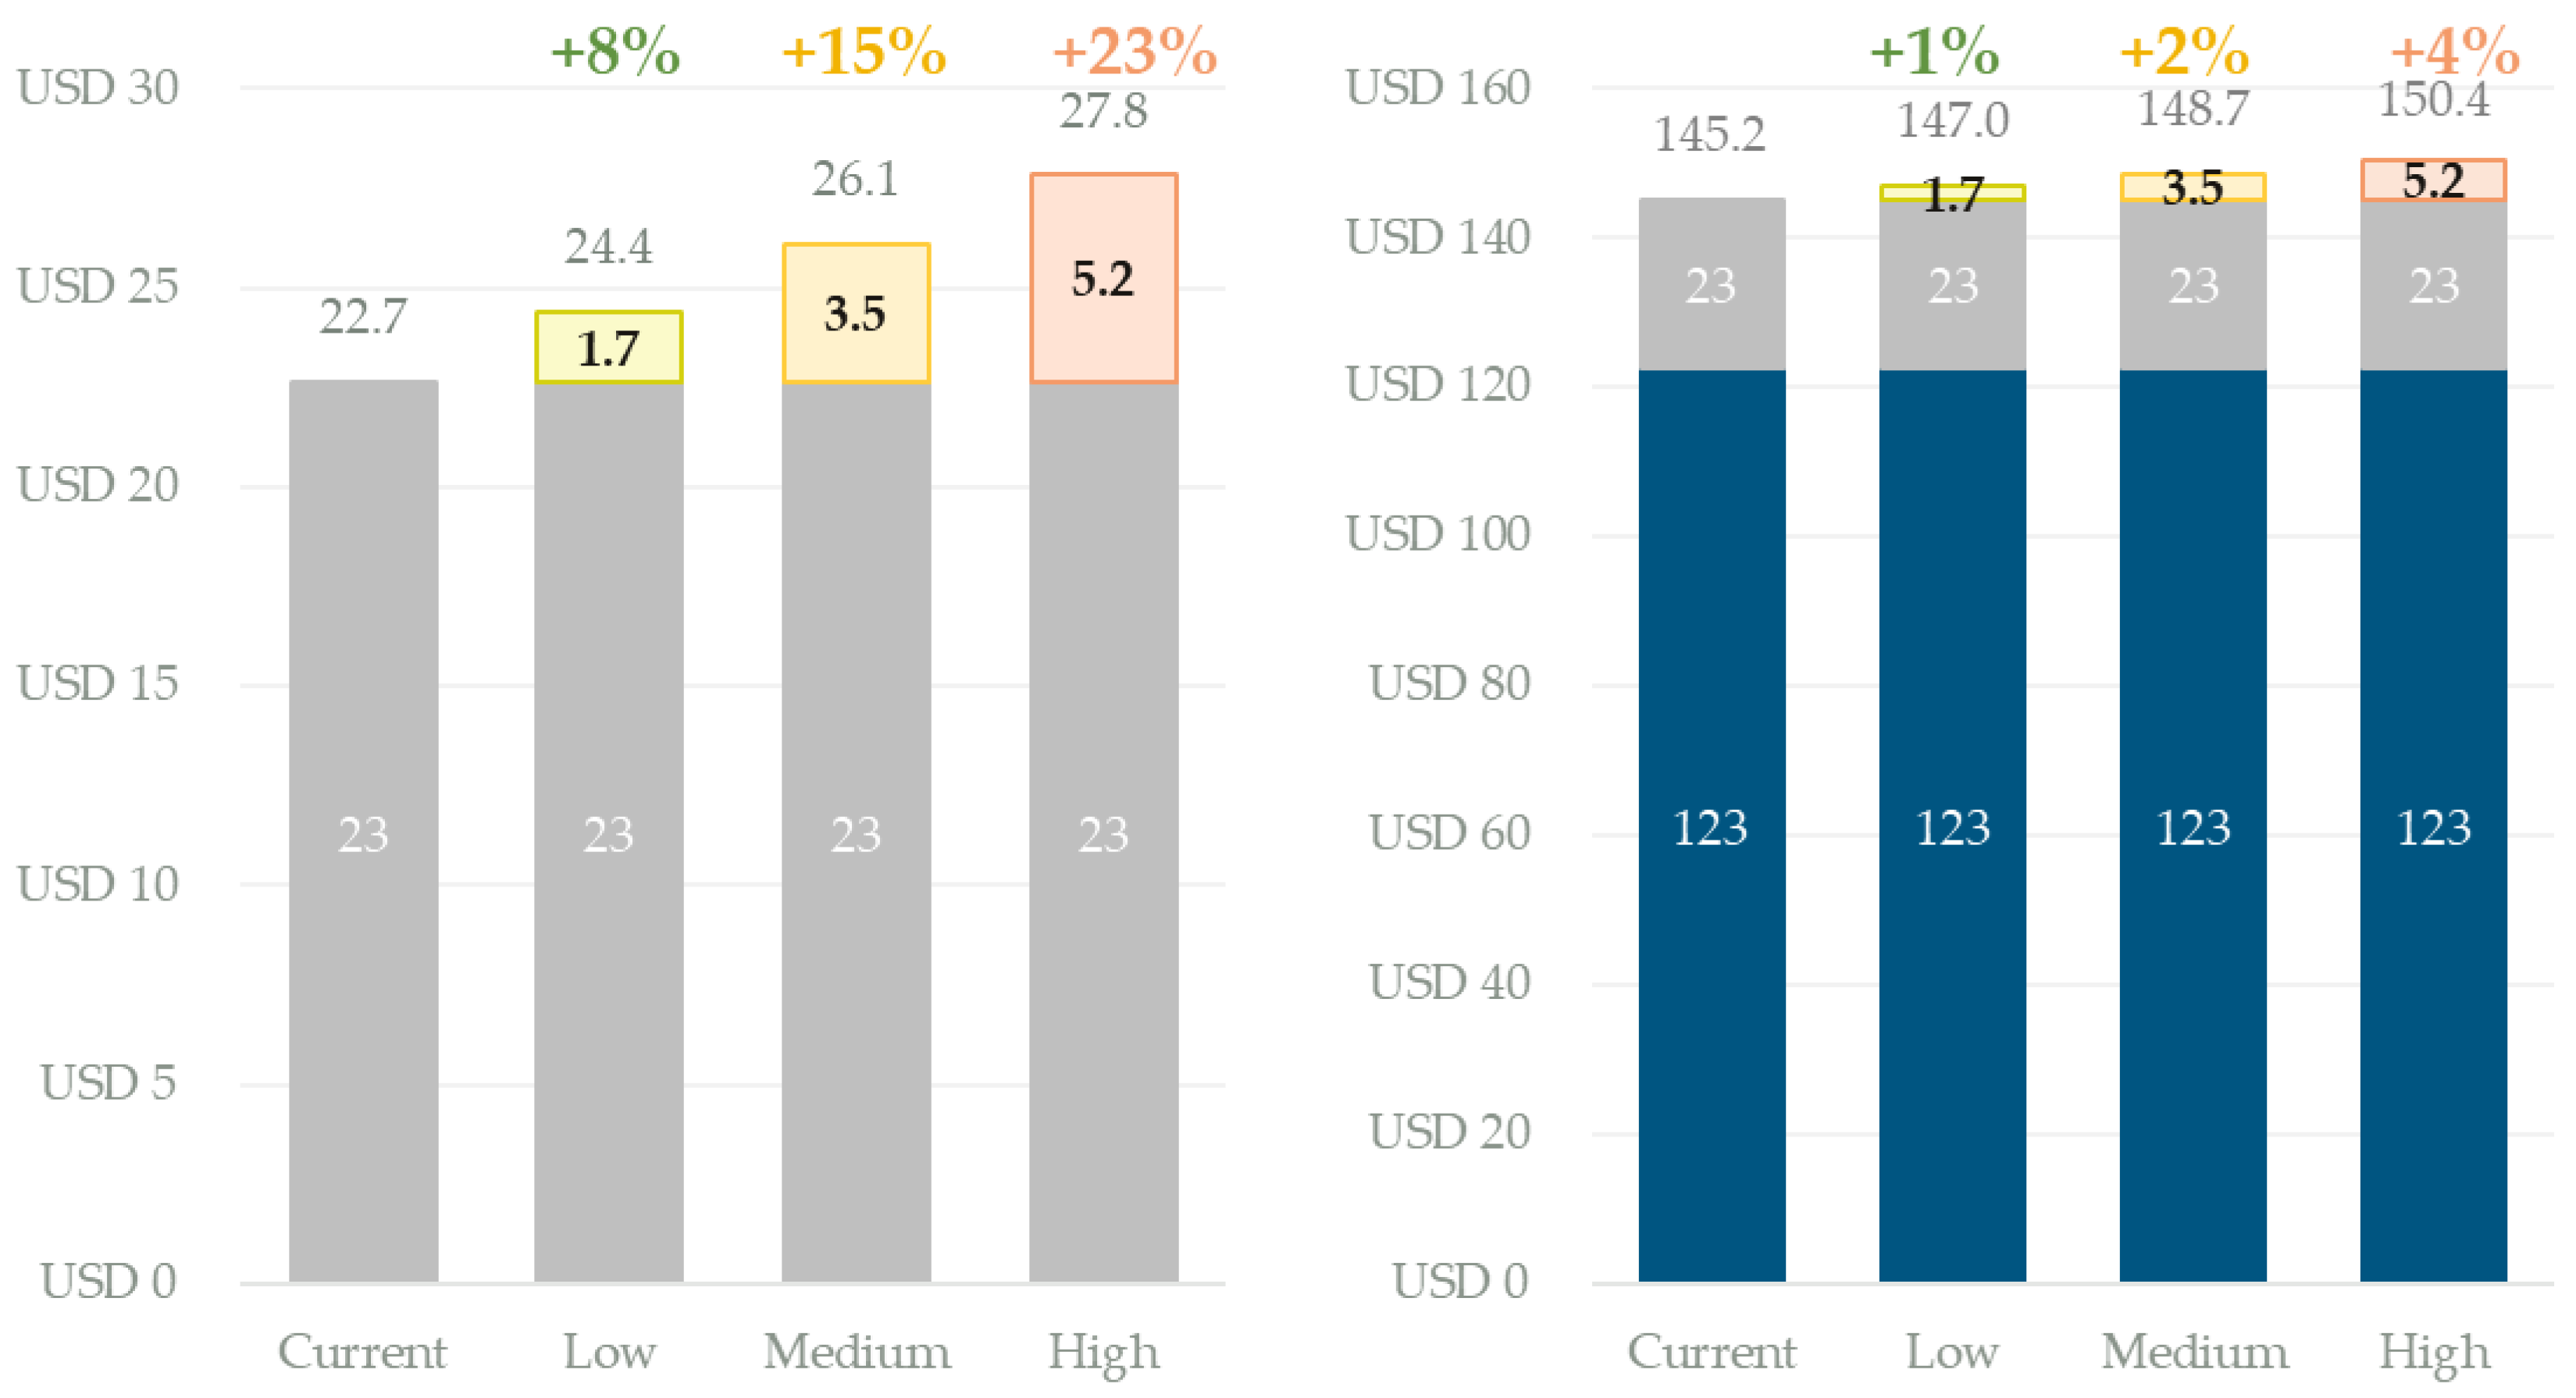
4.1. Impact of the Carbon Tax on Freight Rates and Trading Prices
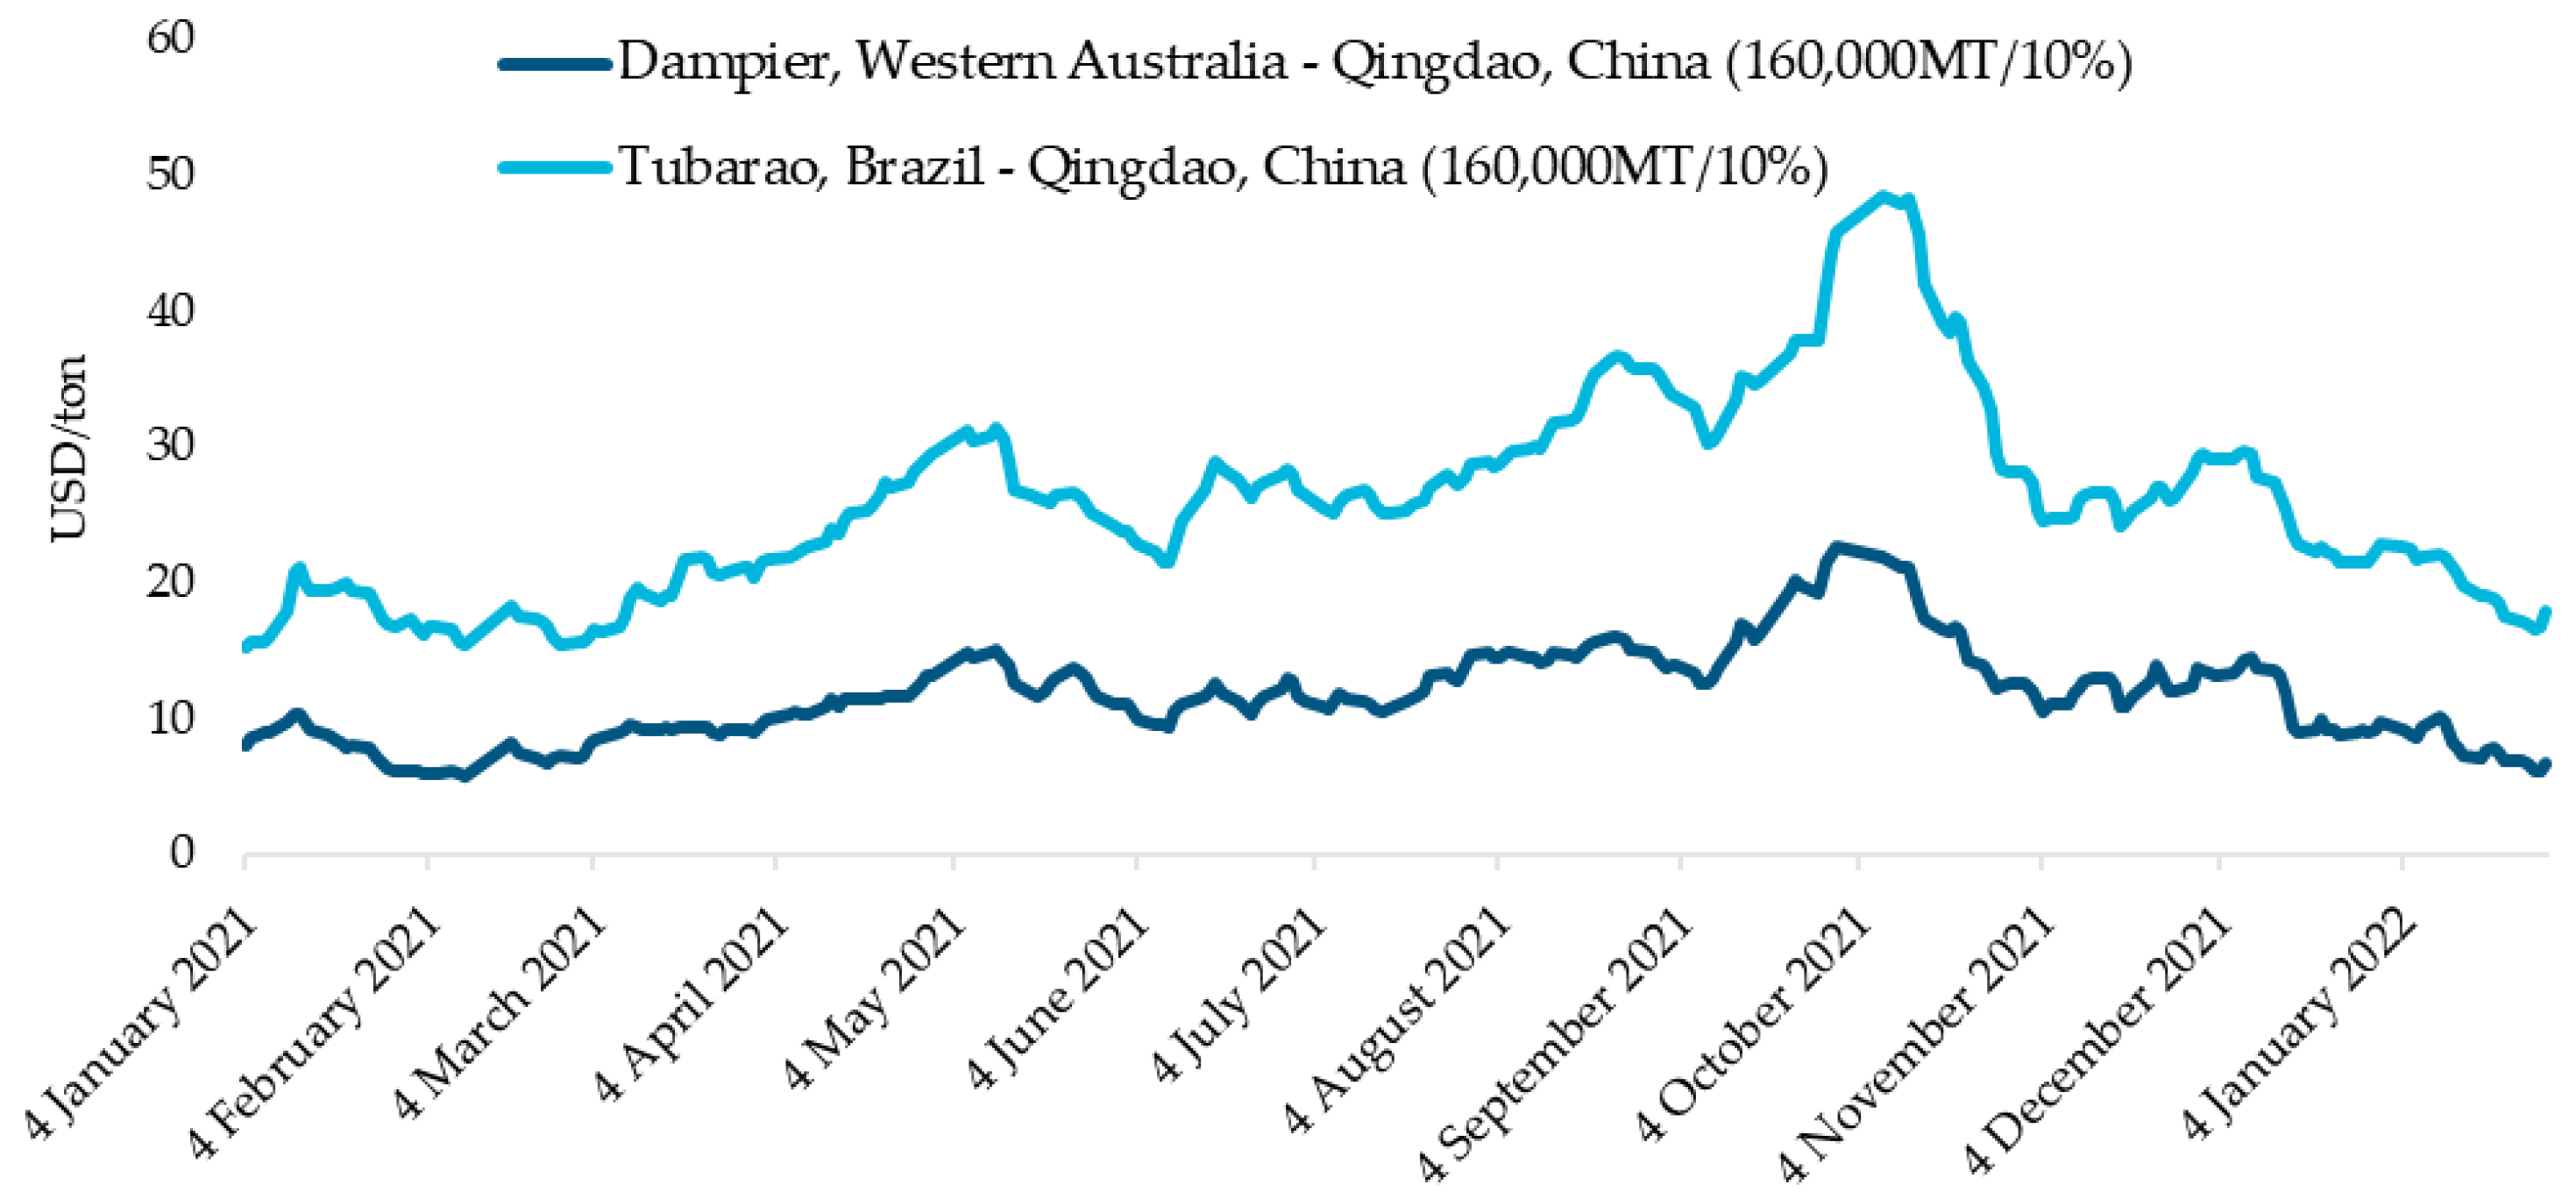
4.1.1. Iron Ore
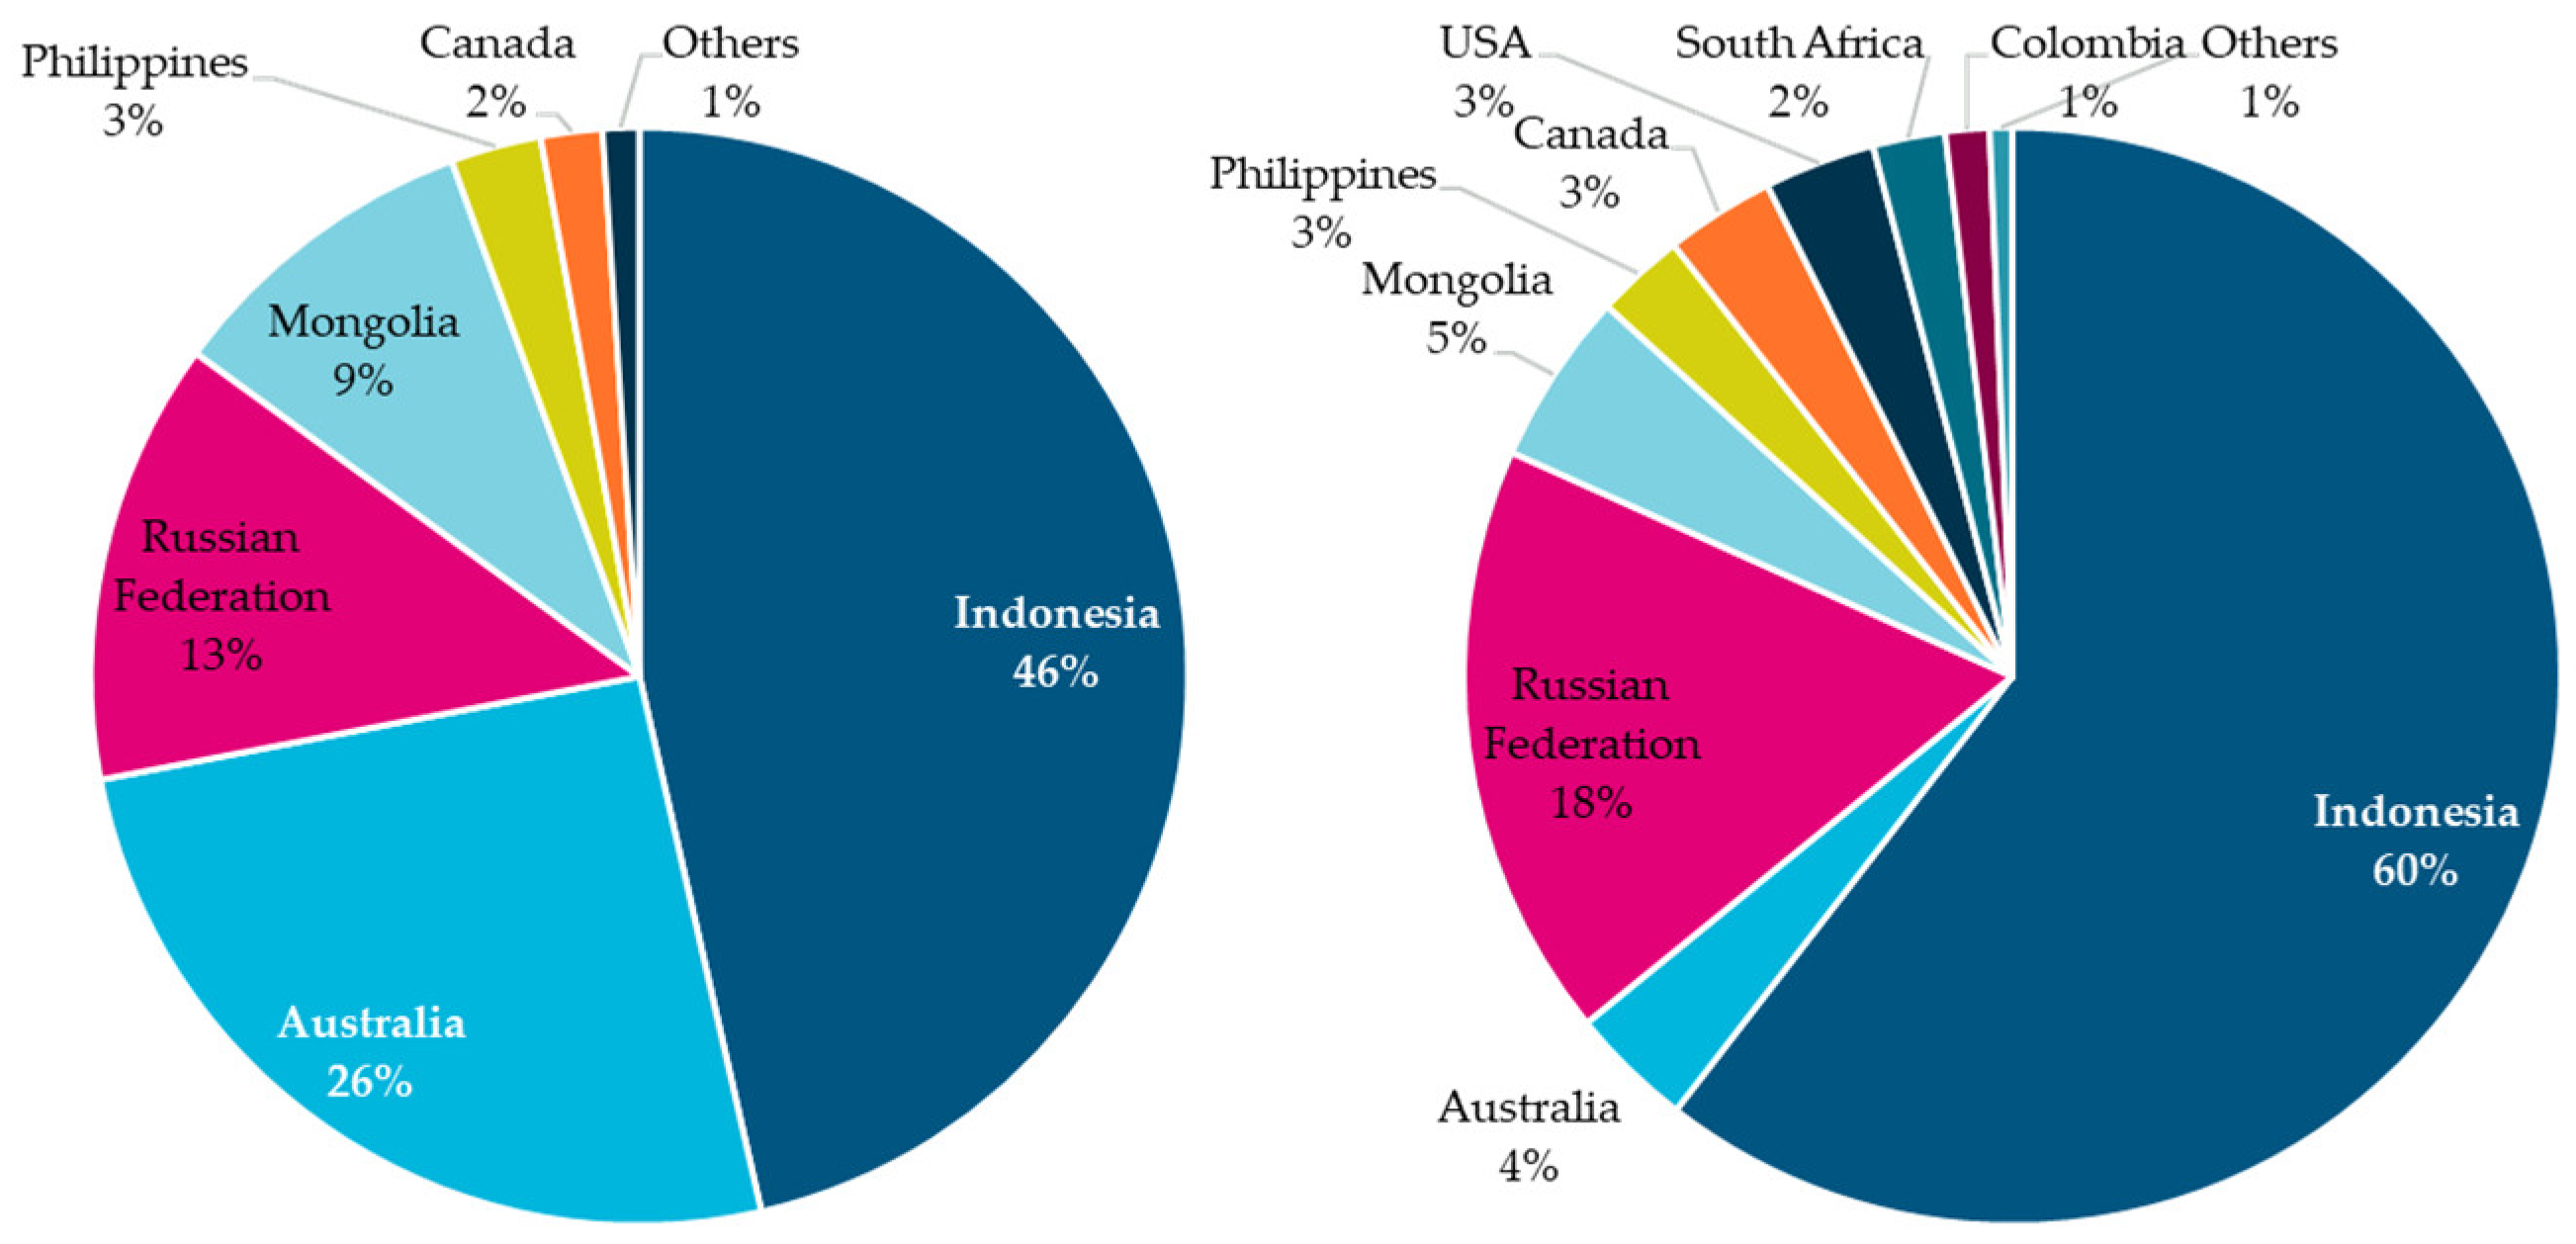
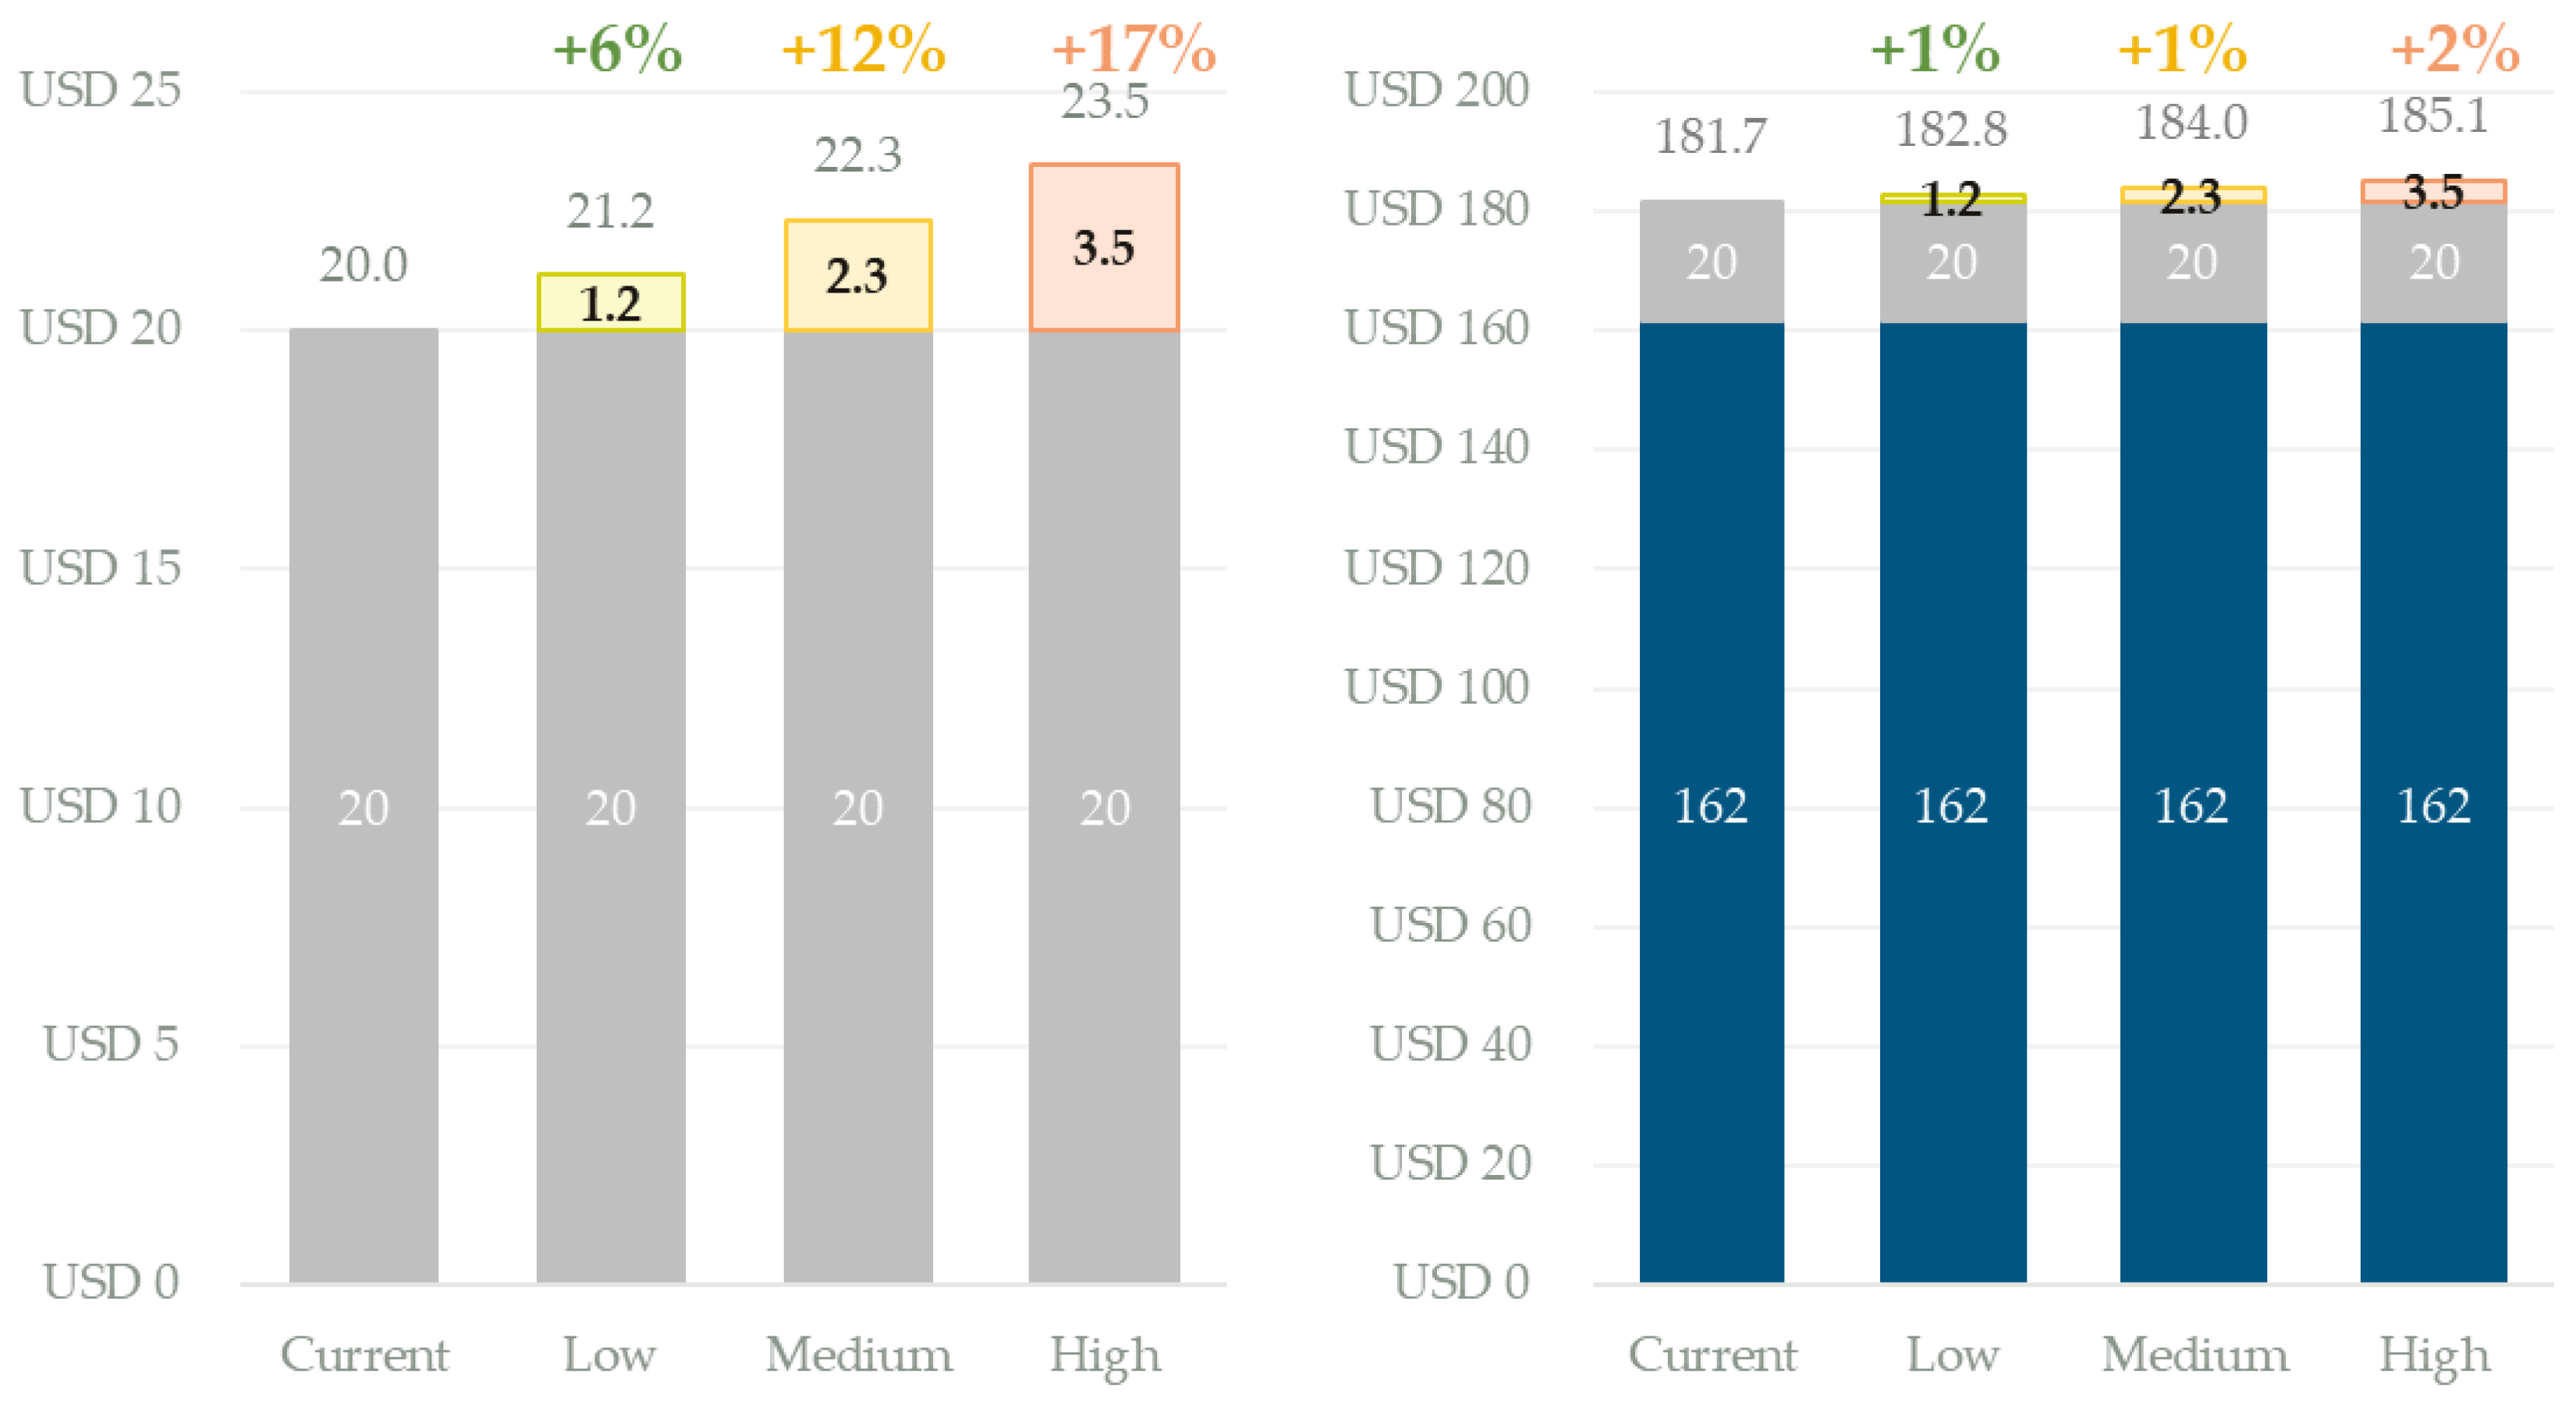
4.1.2. Coal
4.2. Impact of the Carbon Tax on Shipping Trade Pattern
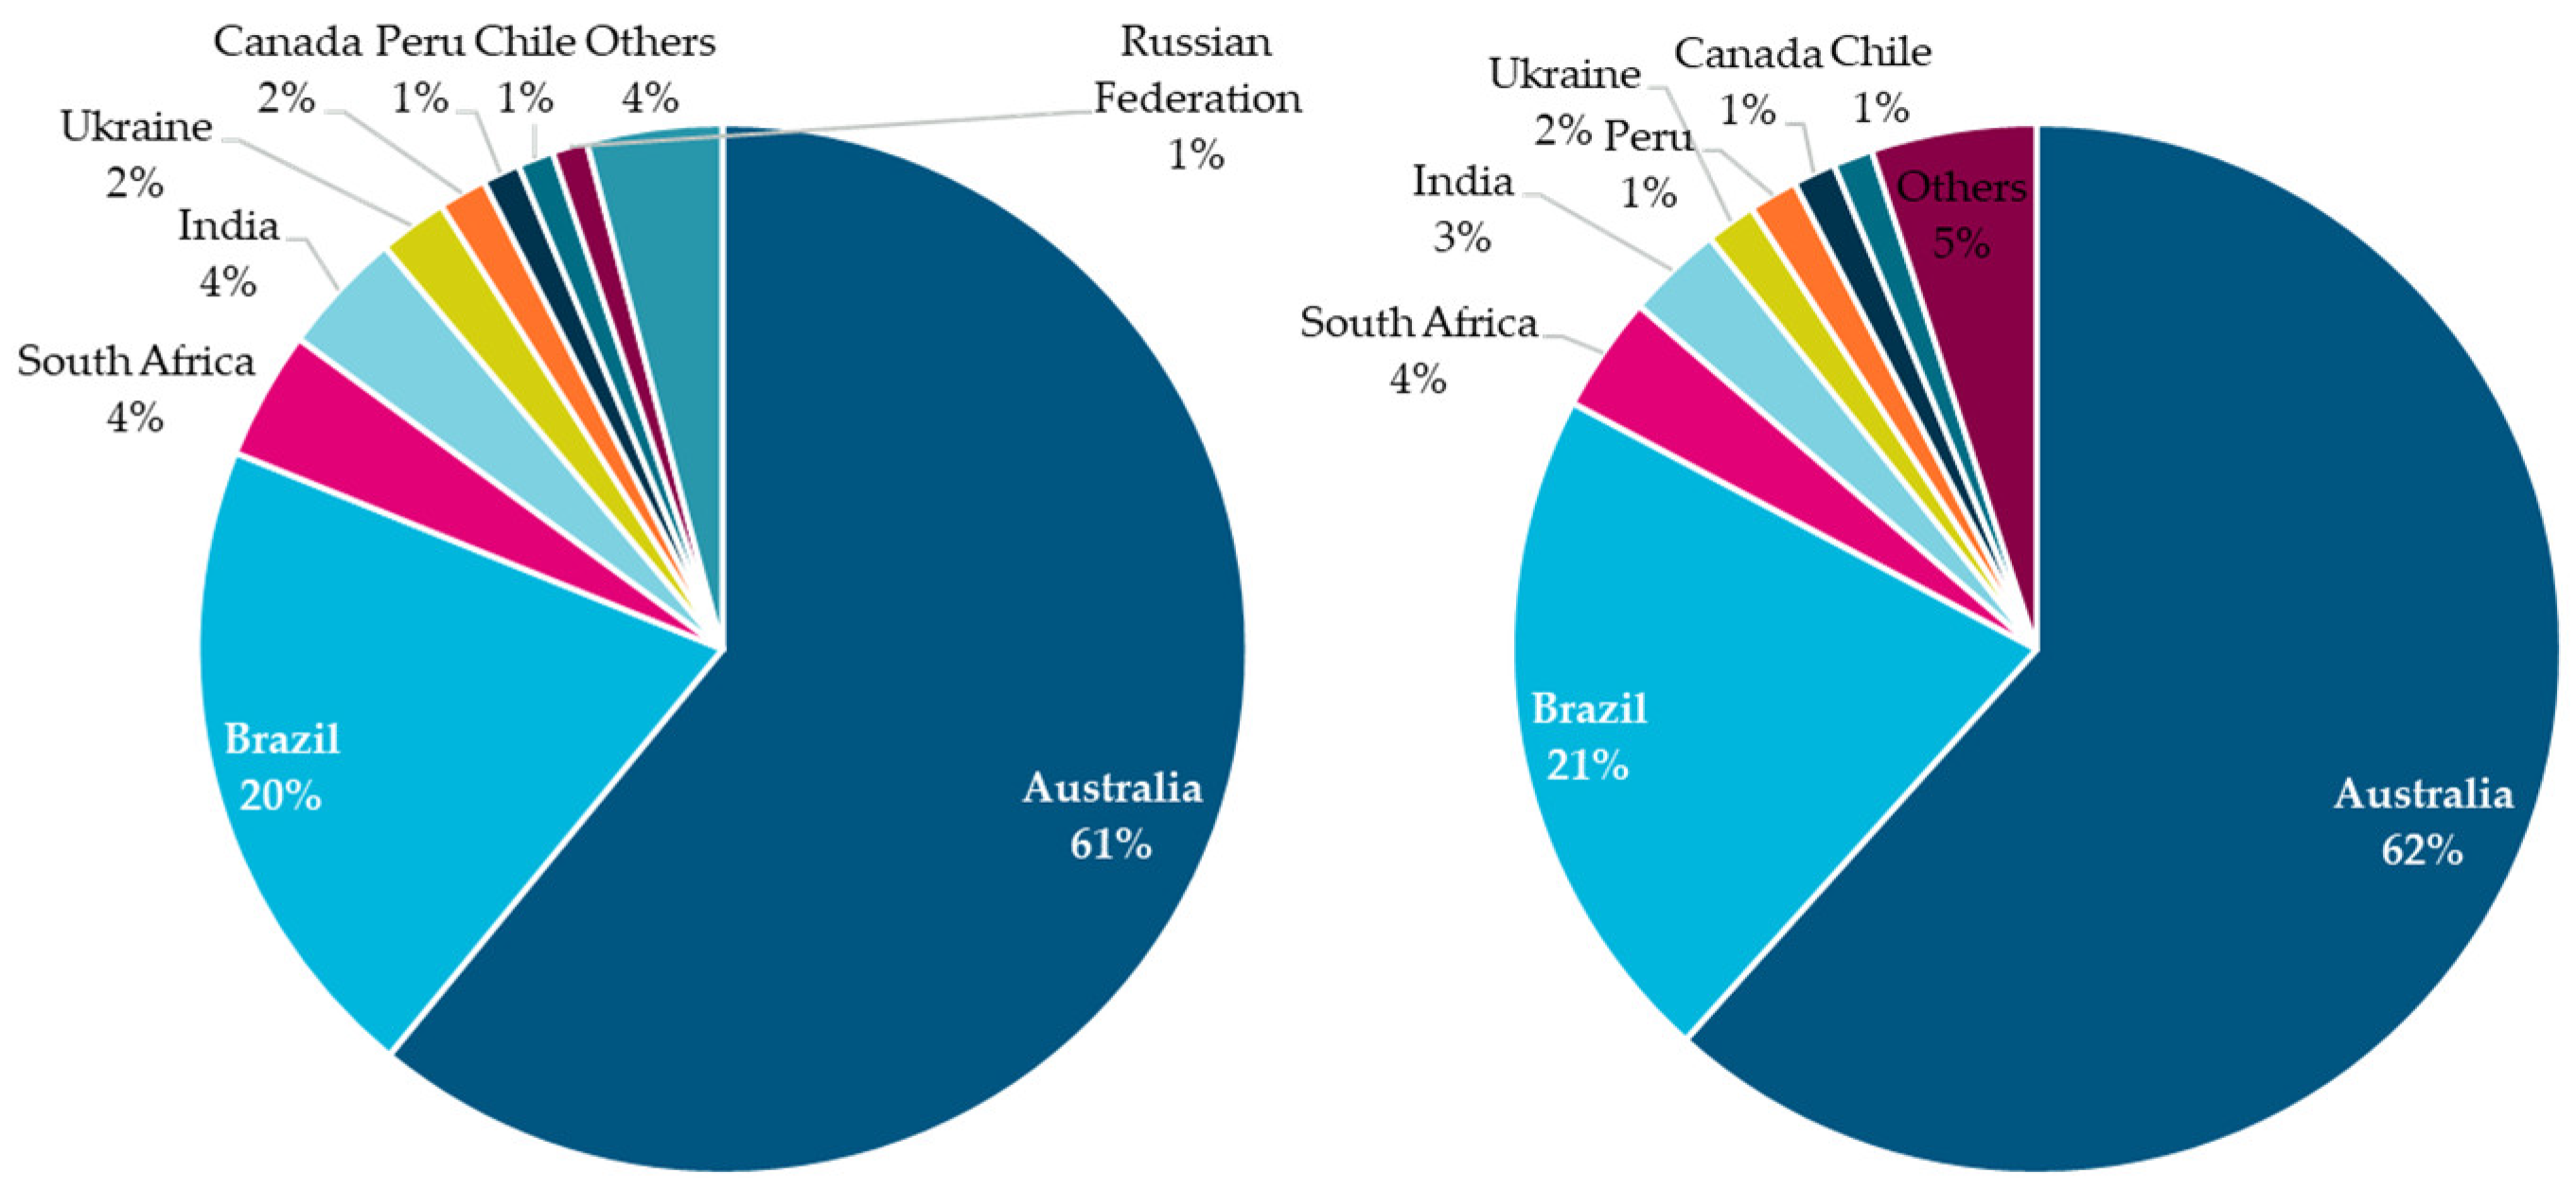
4.2.1. Iron Ore
4.2.2. Coal
5. Conclusions
Author Contributions
Funding
Institutional Review Board Statement
Informed Consent Statement
Data Availability Statement
Acknowledgments
Conflicts of Interest
References
- Brancaccio, G.; Kalouptsidi, M.; Papageorgiou, T. Geography, Transportation, and Endogenous Trade Costs. Econometrica 2020, 88, 657–691. [Google Scholar] [CrossRef]
- Reducing Emissions from the Shipping Sector. Available online: https://ec.europa.eu/clima/eu-action/transport-emissions/reducing-emissions-shipping-sector_en (accessed on 8 July 2022).
- Faber, J.; Hanayama, S.; Zhang, S.; Pereda, P.; Comer, B.; Hauerhof, E.; Schim van der Loeff, W.; Smith, T.; Zhang, Y.; Kosaka, H.; et al. Fourth IMO Greenhouse Gas Study 2020: Technical Report; International Maritime Organization: London, UK, 2020.
- Horowitz, C.A. Paris Agreement. Int. Leg. Mater. 2016, 55, 740–755. [Google Scholar] [CrossRef]
- Doelle, M.; Chircop, A. Decarbonizing International Shipping: An Appraisal of the IMO’s Initial Strategy. Rev. Eur. Comp. Int. Environ. Law 2019, 28, 268–277. [Google Scholar] [CrossRef]
- Rutherford, D.; Comer, B. The International Maritime Organization’s Initial Greenhouse Gas Strategy; International Maritime Organization: London, UK, 2018.
- Bouman, E.A.; Lindstad, E.; Rialland, A.I.; Strømman, A.H. State-of-the-Art Technologies, Measures, and Potential for Reducing GHG Emissions from Shipping—A Review. Transp. Res. Part Transp. Environ. 2017, 52, 408–421. [Google Scholar] [CrossRef]
- Schwartz, H.; Gustafsson, M.; Spohr, J. Emission Abatement in Shipping—Is It Possible to Reduce Carbon Dioxide Emissions Profitably? J. Clean. Prod. 2020, 254, 120069. [Google Scholar] [CrossRef]
- Psaraftis, H.N.; Zis, T.; Lagouvardou, S. A Comparative Evaluation of Market Based Measures for Shipping Decarbonization. Marit. Transp. Res. 2021, 2, 100019. [Google Scholar] [CrossRef]
- Garcia, B.; Foerster, A.; Lin, J. Net Zero for the International Shipping Sector? An Analysis of the Implementation and Regulatory Challenges of the IMO Strategy on Reduction of GHG Emissions. J. Environ. Law 2021, 33, 85–112. [Google Scholar] [CrossRef]
- Balcombe, P.; Brierley, J.; Lewis, C.; Skatvedt, L.; Speirs, J.; Hawkes, A.; Staffell, I. How to Decarbonise International Shipping: Options for Fuels, Technologies and Policies. Energy Convers. Manag. 2019, 182, 72–88. [Google Scholar] [CrossRef]
- de Fournas, N.; Wei, M. Techno-Economic Assessment of Renewable Methanol from Biomass Gasification and PEM Electrolysis for Decarbonization of the Maritime Sector in California. Energy Convers. Manag. 2022, 257, 115440. [Google Scholar] [CrossRef]
- Di Micco, S.; Mastropasqua, L.; Cigolotti, V.; Minutillo, M.; Brouwer, J. A Framework for the Replacement Analysis of a Hydrogen-Based Polymer Electrolyte Membrane Fuel Cell Technology on Board Ships: A Step towards Decarbonization in the Maritime Sector. Energy Convers. Manag. 2022, 267, 115893. [Google Scholar] [CrossRef]
- Inal, O.B.; Zincir, B.; Deniz, C. Investigation on the Decarbonization of Shipping: An Approach to Hydrogen and Ammonia. Int. J. Hydrogen Energy 2022, 47, 19888–19900. [Google Scholar] [CrossRef]
- Ampah, J.D.; Yusuf, A.A.; Afrane, S.; Jin, C.; Liu, H. Reviewing Two Decades of Cleaner Alternative Marine Fuels: Towards IMO’s Decarbonization of the Maritime Transport Sector. J. Clean. Prod. 2021, 320, 128871. [Google Scholar] [CrossRef]
- Watanabe, M.D.B.; Cherubini, F.; Cavalett, O. Climate Change Mitigation of Drop-in Biofuels for Deep-Sea Shipping under a Prospective Life-Cycle Assessment. J. Clean. Prod. 2022, 364, 132662. [Google Scholar] [CrossRef]
- Smith, T.; Raucci, C.; Hosseinloo, S.H.; Rojon, I.; Calleya, J.; De La Fuente, S.S.; Wu, P.; Palmer, K. CO2 Emissions from International Shipping: Possible Reduction Targets and Their Associated Pathways; UMAS: London, UK, 2016. [Google Scholar]
- Halim, R.; Kirstein, L.; Merk, O.; Martinez, L. Decarbonization Pathways for International Maritime Transport: A Model-Based Policy Impact Assessment. Sustainability 2018, 10, 2243. [Google Scholar] [CrossRef]
- Mallouppas, G.; Yfantis, E.A. Decarbonization in Shipping Industry: A Review of Research, Technology Development, and Innovation Proposals. J. Mar. Sci. Eng. 2021, 9, 415. [Google Scholar] [CrossRef]
- Intersessional Working Group on Reduction of GHG Emissions from Ships (ISWG-GHG 12), 16–20 May 2022. Available online: https://www.imo.org/en/MediaCentre/MeetingSummaries/Pages/ISWG-GHG-12.aspx (accessed on 28 May 2022).
- Trafigura Proposes New Levy on Marine Fuels to Cut Emissions. Available online: https://lloydslist.maritimeintelligence.informa.com/LL1134033/Trafigura-proposes-new-levy-on-marine-fuels-to-cut-emissions (accessed on 27 May 2022).
- Marshall Islands Demands $100 Tax on Shipping Emissions. Available online: https://lloydslist.maritimeintelligence.informa.com/LL1136097/Marshall-Islands-demands-$100-tax-on-shipping-emissions (accessed on 27 May 2022).
- Maersk Calls on Carbon Tax for Fossil Fuel Bunkers to Bridge Transition Gap|Hellenic Shipping News Worldwide. Available online: https://www.hellenicshippingnews.com/maersk-calls-on-carbon-tax-for-fossil-fuel-bunkers-to-bridge-transition-gap/ (accessed on 29 May 2022).
- Carbon Taxes in the Shipping Industry—Assessing Japan’s Proposal. Available online: https://news.bloombergtax.com/daily-tax-report-international/carbon-taxes-in-the-shipping-industry-assessing-japans-proposal (accessed on 28 July 2022).
- Mundaca, G.; Strand, J.; Young, I.R. Carbon Pricing of International Transport Fuels: Impacts on Carbon Emissions and Trade Activity. J. Environ. Econ. Manag. 2021, 110, 102517. [Google Scholar] [CrossRef]
- Psaraftis, H.N. Speed Optimization vs Speed Reduction: The Choice between Speed Limits and a Bunker Levy. Sustainability 2019, 11, 2249. [Google Scholar] [CrossRef]
- Lagouvardou, S.; Psaraftis, H.N.; Zis, T. Impacts of a Bunker Levy on Decarbonizing Shipping: A Tanker Case Study. Transp. Res. Part Transp. Environ. 2022, 106, 103257. [Google Scholar] [CrossRef]
- Avetisyan, M. Impacts of Global Carbon Pricing on International Trade, Modal Choice and Emissions from International Transport. Energy Econ. 2018, 76, 532–548. [Google Scholar] [CrossRef]
- Forum, I.T. Decarbonising Maritime Transport: Pathways to Zero-Carbon Shipping by 2035; OECD Publishing: Paris, France, 2018. [Google Scholar]
- Pomaska, L.; Acciaro, M. Bridging the Maritime-Hydrogen Cost-Gap: Real Options Analysis of Policy Alternatives. Transp. Res. Part Transp. Environ. 2022, 107, 103283. [Google Scholar] [CrossRef]
- Ding, W.; Wang, Y.; Dai, L.; Hu, H. Does a Carbon Tax Affect the Feasibility of Arctic Shipping? Transp. Res. Part Transp. Environ. 2020, 80, 102257. [Google Scholar] [CrossRef]
- Trivyza, N.L.; Rentizelas, A.; Theotokatos, G. Impact of Carbon Pricing on the Cruise Ship Energy Systems Optimal Configuration. Energy 2019, 175, 952–966. [Google Scholar] [CrossRef]
- Zhuge, D.; Wang, S.; Wang, D.Z.W. A Joint Liner Ship Path, Speed and Deployment Problem under Emission Reduction Measures. Transp. Res. Part B Methodol. 2021, 144, 155–173. [Google Scholar] [CrossRef]
- Xin, X.; Wang, X.; Tian, X.; Chen, Z.; Chen, K. Green Scheduling Model of Shuttle Tanker Fleet Considering Carbon Tax and Variable Speed Factor. J. Clean. Prod. 2019, 234, 1134–1143. [Google Scholar] [CrossRef]
- Wang, C.; Chen, J. Strategies of Refueling, Sailing Speed and Ship Deployment of Containerships in the Low-Carbon Background. Comput. Ind. Eng. 2017, 114, 142–150. [Google Scholar] [CrossRef]
- Kim, J.-G.; Kim, H.-J.; Lee, P.T.-W. Optimising Containership Speed and Fleet Size under a Carbon Tax and an Emission Trading Scheme. Int. J. Shipp. Transp. Logist. 2013, 5, 571–590. [Google Scholar] [CrossRef]
- Rojon, I.; Lazarou, N.-J.; Rehmatulla, N.; Smith, T. The Impacts of Carbon Pricing on Maritime Transport Costs and Their Implications for Developing Economies. Mar. Policy 2021, 132, 104653. [Google Scholar] [CrossRef]
- Lee, T.-C.; Chang, Y.-T.; Lee, P.T.W. Economy-Wide Impact Analysis of a Carbon Tax on International Container Shipping. Transp. Res. Part Policy Pract. 2013, 58, 87–102. [Google Scholar] [CrossRef]
- Halim, R.A.; Smith, T.; Englert, D. Understanding the Economic Impacts of Greenhouse Gas Mitigation Policies on Shipping: What Is the State of the Art of Current Modeling Approaches? World Bank: Washington, DC, USA, 2019. [Google Scholar]
- UNCTAD. Review of Maritime Transport 2021; UNCTAD: New York, NY, USA, 2021. [Google Scholar]
- Chinese Imports Heading for 50% Market Share of the Dry Bulk Market after a Turbulent Year. Available online: https://www.bimco.org/news/market_analysis/2021/20210113_chinese_imports_heading_for_50_market_share_of_the_dry_bulk_market (accessed on 31 May 2022).
- Eggleston, H.S.; Buendia, L.; Miwa, K.; Ngara, T.; Tanabe, K. 2006 IPCC Guidelines for National Greenhouse Gas Inventories; IPCC: Geneva, Switzerland, 2006. [Google Scholar]
- Hao, H.; Geng, Y.; Ou, X. Estimating CO2 Emissions from Water Transportation of Freight in China. Int. J. Shipp. Transp. Logist. 2015, 7, 676–694. [Google Scholar] [CrossRef]
- Psaraftis, H.N.; Kontovas, C.A. CO2 Emission Statistics for the World Commercial Fleet. WMU J. Marit. Aff. 2009, 8, 1–25. [Google Scholar] [CrossRef]
- Schroer, M.; Panagakos, G.; Barfod, M.B. An Evidence-Based Assessment of IMO’s Short-Term Measures for Decarbonizing Container Shipping. J. Clean. Prod. 2022, 363, 132441. [Google Scholar] [CrossRef]
- Song, S.-K.; Shon, Z.-H. Current and Future Emission Estimates of Exhaust Gases and Particles from Shipping at the Largest Port in Korea. Environ. Sci. Pollut. Res. 2014, 21, 6612–6622. [Google Scholar] [CrossRef] [PubMed]
- National Bureau of Statistics of China. Available online: https://data.stats.gov.cn/english/easyquery.htm?cn=C01 (accessed on 28 July 2022).
- Global Trade Outlook 2022. High Global Trade Volume Growth in 2021 and Significant Moderation in 2022. Supply Chains Disruption Is Likely to Continue in the First Half of 2022 | IHS Markit. Available online: https://ihsmarkit.com/research-analysis/Global-Trade-Outlook-2022.html (accessed on 2 July 2022).
- Summary of Imports and Exports (In USD). Available online: http://english.customs.gov.cn/Statics/bb598fd1-56f0-4e6e-b087-6237c12d310c.html (accessed on 27 July 2022).
- How China Is Moving beyond Australia for Its Iron Ore Hunger—Mining Technology. Available online: https://www.mining-technology.com/analysis/how-china-is-moving-beyond-australia-for-its-iron-ore-hunger/ (accessed on 28 July 2022).
- Guinea Iron Ore Reserves Could Reshape Global Supply Chain. Available online: https://furtherafrica.com/2020/10/01/guineas-iron-ore-reserves-could-reshape-the-commodities-global-supply-chain/ (accessed on 28 July 2022).
- Guinea Set to Supply Iron Ore from 2026|Hellenic Shipping News Worldwide. Available online: https://www.hellenicshippingnews.com/guinea-set-to-supply-iron-ore-from-2026/ (accessed on 28 July 2022).


| Region | Cargo Weight (million tons) | Average Vessel Size (dwt) | EEOI (gCO2/t·nm) | Average Sailing Distance (nm) | Sailing Route |
|---|---|---|---|---|---|
| Europe | 136.0 | 86,000 | 7.9 | 10,857 | Qingdao to Rotterdam (via Suez) |
| Asia (excluding South Asia) | 290.0 | 60,000 | 7.9 | 1458 | Shanghai to Vanino |
| North America | 96.5 | 86,000 | 7.9 | 15,135 | Shanghai to New Orleans |
| Latin and South America | 340.0 | 325,000 | 4.7 | 11,156 | Qingdao to Tubarao |
| Middle East | 132.0 | 56,000 | 9.4 | 5656 | Shanghai to Jebel Ali |
| Pacific | 689.0 | 185,000 | 5.3 | 3256 | Shanghai to Hedland |
| South Asia | 131.5 | 63,000 | 7.9 | 3127 | Shanghai to Padang |
| Africa | 196.0 | 215,000 | 4.7 | 11,235 | Qingdao to Boffa |
| Average | 251.4 | 134,500 | 7 | 7735 | - |
| Region | Cargo Weight (million tons) | Cargo Weight (%) | Carbon Emission (tons) | Carbon Emission (%) | Carbon Emission/Cargo Weight |
|---|---|---|---|---|---|
| Europe | 136.0 | 6.8% | 11,664,761 | 15.2% | 0.09 |
| Asia (excluding South Asia) | 290.0 | 14.4% | 3,340,278 | 4.3% | 0.01 |
| North America | 96.5 | 4.8% | 11,540,559 | 15.0% | 0.12 |
| Latin and South America | 340.0 | 16.9% | 17,827,288 | 23.2% | 0.05 |
| Middle East | 132.0 | 6.6% | 7,017,965 | 9.1% | 0.05 |
| Pacific | 689.0 | 34.3% | 11,889,935 | 15.5% | 0.02 |
| South Asia | 131.5 | 6.5% | 3,248,484 | 4.2% | 0.02 |
| Africa | 196.0 | 9.7% | 10,349,682 | 13.5% | 0.05 |
| Total | 2011.0 | 100% | 76,878,951 | 100% | - |
| Region | Carbon Charge = 100 USD/ton (Low) | Carbon Charge = 200 USD/ton (Medium) | Carbon Charge = 300 USD/ton (High) | |||
|---|---|---|---|---|---|---|
| Carbon Cost (million USD) | Cost/Weight (USD/ton) | Carbon Cost (million USD) | Cost/Weight (USD/ton) | Carbon Cost (million USD) | Cost/Weight (USD/ton) | |
| Europe | 1166 | 8.58 | 2333 | 17.15 | 3499 | 25.73 |
| Asia (excluding South Asia) | 334 | 1.15 | 668 | 2.30 | 1002 | 3.46 |
| North America | 1154 | 11.90 | 2308 | 23.79 | 3462 | 35.69 |
| Latin and South America | 1783 | 5.24 | 3565 | 10.49 | 5348 | 15.73 |
| Middle East | 702 | 5.32 | 1404 | 10.63 | 2105 | 15.95 |
| Pacific | 1189 | 1.73 | 2378 | 3.45 | 3567 | 5.18 |
| South Asia | 325 | 2.46 | 650 | 4.92 | 975 | 7.38 |
| Africa | 1035 | 5.28 | 2070 | 10.56 | 3105 | 15.84 |
| Total | 7688 | - | 15,376 | - | 23,064 | - |
| Region | Trade Value (%) | Carbon Cost/Trade Value | ||
|---|---|---|---|---|
| Low | Medium | High | ||
| Europe | 19.5% | 0.1% | 0.2% | 0.3% |
| Asia (excluding South Asia) | 41.7% | 0.0% | 0.0% | 0.0% |
| North America | 13.9% | 0.1% | 0.3% | 0.4% |
| Latin and South America | 7.5% | 0.4% | 0.8% | 1.2% |
| Middle East | 5.8% | 0.2% | 0.4% | 0.6% |
| Pacific | 4.4% | 0.4% | 0.9% | 1.3% |
| South Asia | 3.1% | 0.2% | 0.3% | 0.5% |
| Africa | 4.2% | 0.4% | 0.8% | 1.2% |
| Total | 100.0% | Carbon Cost: USD 7.7–23.1 Billion | ||
Publisher’s Note: MDPI stays neutral with regard to jurisdictional claims in published maps and institutional affiliations. |
© 2022 by the authors. Licensee MDPI, Basel, Switzerland. This article is an open access article distributed under the terms and conditions of the Creative Commons Attribution (CC BY) license (https://creativecommons.org/licenses/by/4.0/).
Share and Cite
Wu, Y.; Wen, K.; Zou, X. Impacts of Shipping Carbon Tax on Dry Bulk Shipping Costs and Maritime Trades—The Case of China. J. Mar. Sci. Eng. 2022, 10, 1105. https://doi.org/10.3390/jmse10081105
Wu Y, Wen K, Zou X. Impacts of Shipping Carbon Tax on Dry Bulk Shipping Costs and Maritime Trades—The Case of China. Journal of Marine Science and Engineering. 2022; 10(8):1105. https://doi.org/10.3390/jmse10081105
Chicago/Turabian StyleWu, Yongzhong, Kang Wen, and Xuelian Zou. 2022. "Impacts of Shipping Carbon Tax on Dry Bulk Shipping Costs and Maritime Trades—The Case of China" Journal of Marine Science and Engineering 10, no. 8: 1105. https://doi.org/10.3390/jmse10081105