1. Introduction
The multidecadal variability in the large-scale heat transfer between oceans and continents is an important feature of the internal dynamics in the current global climatic system. The phenomenon was observed in the Northern Hemisphere, and reported first in [
1]. During weak ocean–atmosphere heat exchange, the active upper layer (AUL) of the World Ocean (WO) accumulates heat, while the thermal discharge of AUL occurs during increased heat transfer. At the same time, the following contemporary climatic oscillations were discovered [
2]. They consisted of the alternation of relatively humid climatic phases related to periods of AUL heat discharge, e.g., 1905–1935 and 1975–1999, and essentially dry climatic phases corresponding to the periods of WO heat accumulation (1940–1974 and 2000–2018).
Changes in the frequency and intensity of cyclonic activity in the atmosphere, and near-surface temperature variations were observed in the late 1930s–1940s [
3] and in the mid-1970s [
4]. Evidence was found of the global oscillation presence in the dynamics of the climatic ocean–atmosphere–continents interface. Results consisted of a number of papers that showed quasisynchronous multidecadal phase disturbances appearing over the whole global ocean. In particular, one can note the Pacific and Indian Oceans’ level and vorticity of the wind field [
5], climatic processes in the Okhotsk and Greenland seas [
6], water temperatures of the surface layer in the northwestern Atlantic and east of the equatorial Pacific [
7], and AUL heat discharge in informative regions of the Atlantic, Pacific, and Southern Oceans [
8].
The reason appeared to believe that planetary-scale teleconnections [
9] in the ocean–atmosphere–continent interface can cause such environmental structures as global atmospheric oscillation (GAO) and multidecadal oscillation of the heat content in the ocean (MOHO), which synchronize all known regional oscillations, such as NAO and ENSO, in the atmosphere and the ocean, respectively.
A single oscillation cycle of the modern climate lasts about 60 years, consisting of two qualitatively different phases [
10,
11]: wet and dry. The change in the climatic phase occurs suddenly and takes several years, and is perceived as a climatic shift [
12,
13,
14,
15,
16]. The current phase of the climate, transition to which occurred at the turn of the 21st century, is dry. It is determined by a number of specific features, the most notable of which is a decrease in the humidity of the planetary atmosphere [
17,
18,
19] accompanied by an increase in fire hazards and, as a consequence, by a widespread occurrence of natural forest fires [
20]. Since the preparation of a climatic phase change takes a certain amount of time (25–35 years), it makes it feasible to forecast the next climatic shift and allows one to study the factors that cause the suddenness and irreversibility of the observed process.
Diagnostic computations [
21], materials of numerical modelling [
22], and experimental data [
23] helped in concluding that the change in climatic phases presents a change in the heat exchange regime between the ocean and the atmosphere (for example, [
24]) in the global and regional context: the ocean successively passes from the thermal discharge phase into the heat accumulation phase, and then again to the thermal discharge phase. Such phase transitions in the climatic system obviously took place in 1935–1940, 1973–1977, and at the turn of the 20th and 21st centuries [
2]. Another shift may have already occurred during the current decade [
21]. Global changes should naturally be accompanied by changes in planetary-scale structures in both the ocean and atmosphere. In the atmosphere, this structure is the GAO. Important features of GAO and its statistical significance were discussed in detail in [
25]. In the ocean, the presence of planetary quasisynchronous MOHO was identified in [
8]. In the present paper, we further explore the structure and features of MOHO. We also characterise the main heat sources of multidecadal oscillations in the WO, focusing on their location and significance.
2. Materials and Methods
The main materials for studying the structure of MOHO were the results of numerical modelling of the ocean circulation performed with the ocean general circulation model (OGCM) developed at the Institute of Numerical Mathematics of the Russian Academy of Sciences, which is known in international practice as the Institute of Numerical Mathematics Ocean Model (INMOM) [
22]. Diagnostic computations [
21] along with field observation data obtained in large-scale hydrophysical experiments POLYGON-70, POLYMODE, MEGAPOLIGON and ATLANTEX-90 [
23,
26,
27,
28] were used to validate and confirm the results of the numerical modelling. A brief description of the INMOM mostly adopted from [
29] is provided below.
The INMOM is based on the physically complete equations of oceanic large-scale hydrothermodynamics in Boussinesq and hydrostatic approximations, formulated in a generic orthogonal coordinate system in a horizontal subspace, and in an isobathic
-coordinate system in the vertical direction. The prognostic variables of the INMOM are the horizontal components of the velocity vector, potential temperature, salinity, and sea surface height (SSH) deviation from the undisturbed state. A nonlinear equation of state is used that allows for the compressibility of water that was specifically designed for OGCMs [
30]. The main feature of INMOM distinguishing it from other well-known models is that its numerical implementation uses the method of splitting into physical processes [
31]. At the upper boundary, the condition of the free surface is used, which renders it possible to reproduce long gravity waves including tides and wind surges. The splitting method allows a dedication of an independent problem of barotropic circulation also known as linear “shallow water” equations at each time step. These equations are solved using an original implicit method, which allows one to avoid using a strong time step constraint in the case of a deep ocean. This is especially important for simulations with high spatial resolution. A sea ice model embedded into the INMOM for better simulations at high latitudes consists of three components: thermodynamics [
32], transport [
33], and elastic-viscous-plastic rheology [
34].
In this study, we used the results of the simulation of WO circulation and its climatic variability obtained with the INMOM [
22] for the period of 1948–2007. International programme Coordinated Ocean-ice Reference Experiments (CORE) is most relevant to the problem of reproducing the characteristics of the ocean’s general circulation. Its goals consist of researching WO circulation and its variability based on a multimodel approach where all models participating in the comparison use the same experimental scenarios and prescribed data to compute the atmospheric forcing. The aim of the first series of CORE-I simulations [
35] was the reproduction of the climatic mean quasistationary state of the ocean and sea ice. In the second experimental series, CORE-II [
36,
37,
38,
39], the aim was to investigate their interannual variability, while simulation results were compared with a wide range of a comprehensive set of observational data. This paper presents the results of numerical experiments performed with the INMOM in the scope of CORE-II.
The initial conditions were set as absence of snow and ice, the state of rest in the ocean, and the January climatic mean temperature and salinity interpolated to the model region from the Levitus dataset [
40] having an original spatial resolution 1/4
in longitude and latitude, and 33 standard oceanographic levels in depth. The use of a realistic initial thermohaline state allows one to reduce the OGCM integration time to 50–60 years to obtain a realistic circulation. The temperature and salinity fields contain a significant part of information on ocean dynamics. When starting from a homogeneous thermohaline state, several thousand years of model time are required to achieve a state that is close to a real one with using prescribed characteristics of the atmosphere.
Following the CORE-II scenario [
36,
37,
38,
39], INMOM was integrated for five consecutive 60-year cycles corresponding to the period of 1948–2007. This is due to the fact that the most important attribute of the climatic system is its long-term oscillations, and the most pronounced of them is of a period of about 60 years. Thus, there was an attempt to reproduce a fairly realistic evolution of atmospheric characteristics and, as a consequence, the adaptation of ocean hydrodynamics to it.
To perform experiments involving computations of the atmospheric forcing, we used a special database, CORE [
41], of near-surface atmospheric characteristics, which is based on NCEP/NCAR reanalysis data affected by special corrections. The CORE atmospheric characteristics include air temperature, humidity, wind speed at the height of 10 m and sea level pressure with the time discrepancy of 6 h, longwave and shortwave radiations with time discrepancy of 24 h, and monthly mean precipitation and river runoff. The sea surface fluxes of heat, freshwater, and momentum were computed using bulk formulas (see, e.g., [
42]). The river runoff was incorporated in the model in the form of pseudoprecipitation located in water areas adjacent to river mouths.
Since there is a natural negative feedback for sea surface temperature to the prescribed air temperature through sensible heat flux, no surface heat flux correction was applied. On the other hand, there is no such feedback for salinity. Therefore, surface salinity was nudged to climatic data [
40] by introducing a relaxation term to the sea surface salinity pseudoflux expressed as a difference between the simulated and prescribed near-surface salinities multiplied by a coefficient equal to
cm/s. This can be interpreted as the relaxation of model salinity averaged over the 10 m upper layer to climatic values with a time scale of about 80 days. The need for sea surface salinity flux correction is also explained by the fact that the accuracy of precipitation and river runoff datasets is not high enough.
According to the CORE-II scenario, which is a mandatory requirement for all models participating in this project [
36,
37,
38,
39], the results of the final fifth 60 year cycle were the needed data characterising variability in WO circulation for the period of 1948–2007.
The results of numerical modelling [
10] were compared to diagnostic computations [
21] and local data [
28] obtained in hydrophysical experiments POLYGON-70 (North Atlantic, 1970), POLYMODE (North Atlantic, 1977–1978), MEGAPOLIGON (North Pacific, 1987) and ATLANTEX-90 (North Atlantic, 1990). The hydrophysical experiments listed above used groups of research vessels that carried out complex instrumental observations of the ocean thermodynamic state within several predefined study regions. This allowed one to assess the phase of the ocean climatic characteristics in a certain area during the experiment. A comparison of the model results and observational data demonstrated their satisfactory agreement.
3. Results
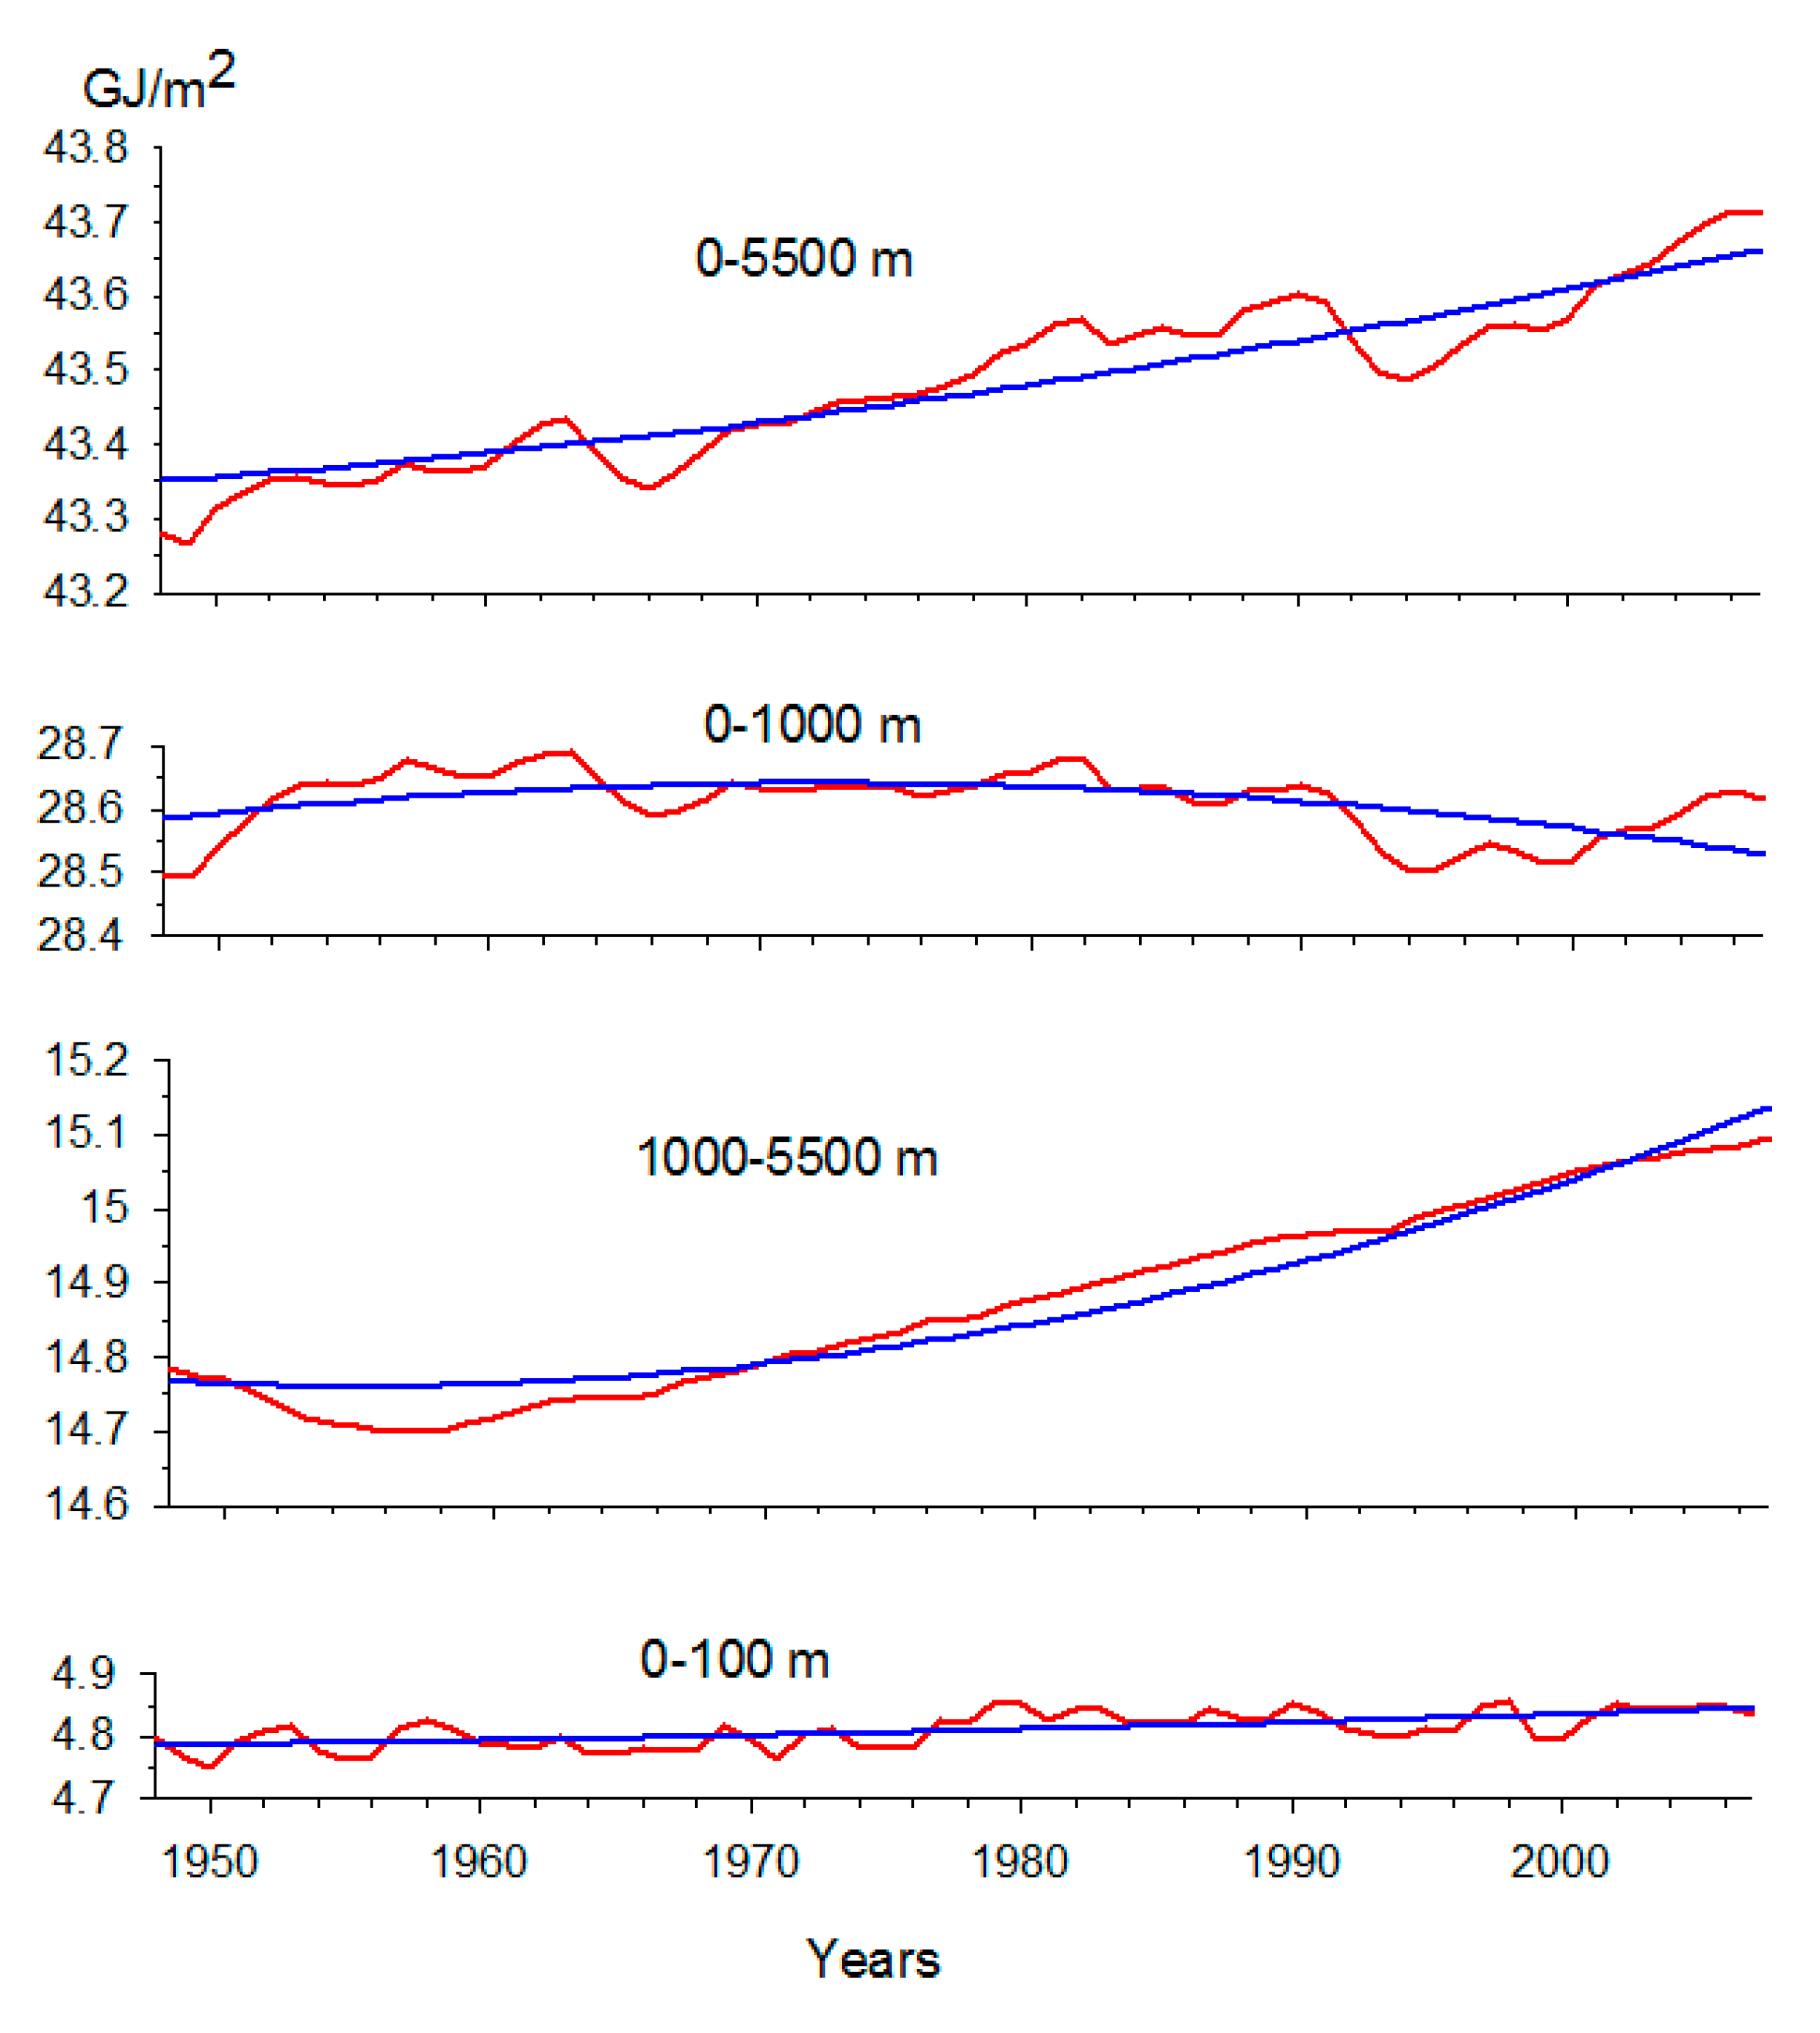
Features of the WO thermal structure evolution for the time period of 1948–2007 can be seen in
Figure 1, which presents evolution of heat content in the 0–5500 m layer, in the active upper layer (AUL) 0–1000 m including the upper mixed layer 0–100 m, and in the deep layer over the range of 1000–5500 m. The WO heat content (0–5500 m) shows a general increase breaking in the 1950s–1960s and 1980s–1990s. In the upper 1000 m WO layer, the change in the water heat content experienced multidecadal perturbations relative to a certain critical level, and in the deep (1000–5500 m) layer, it increased during the entire period under consideration. The observed two-layer structure of the WO heat content evolution indicates the presence of two different modes and sources of such variability.
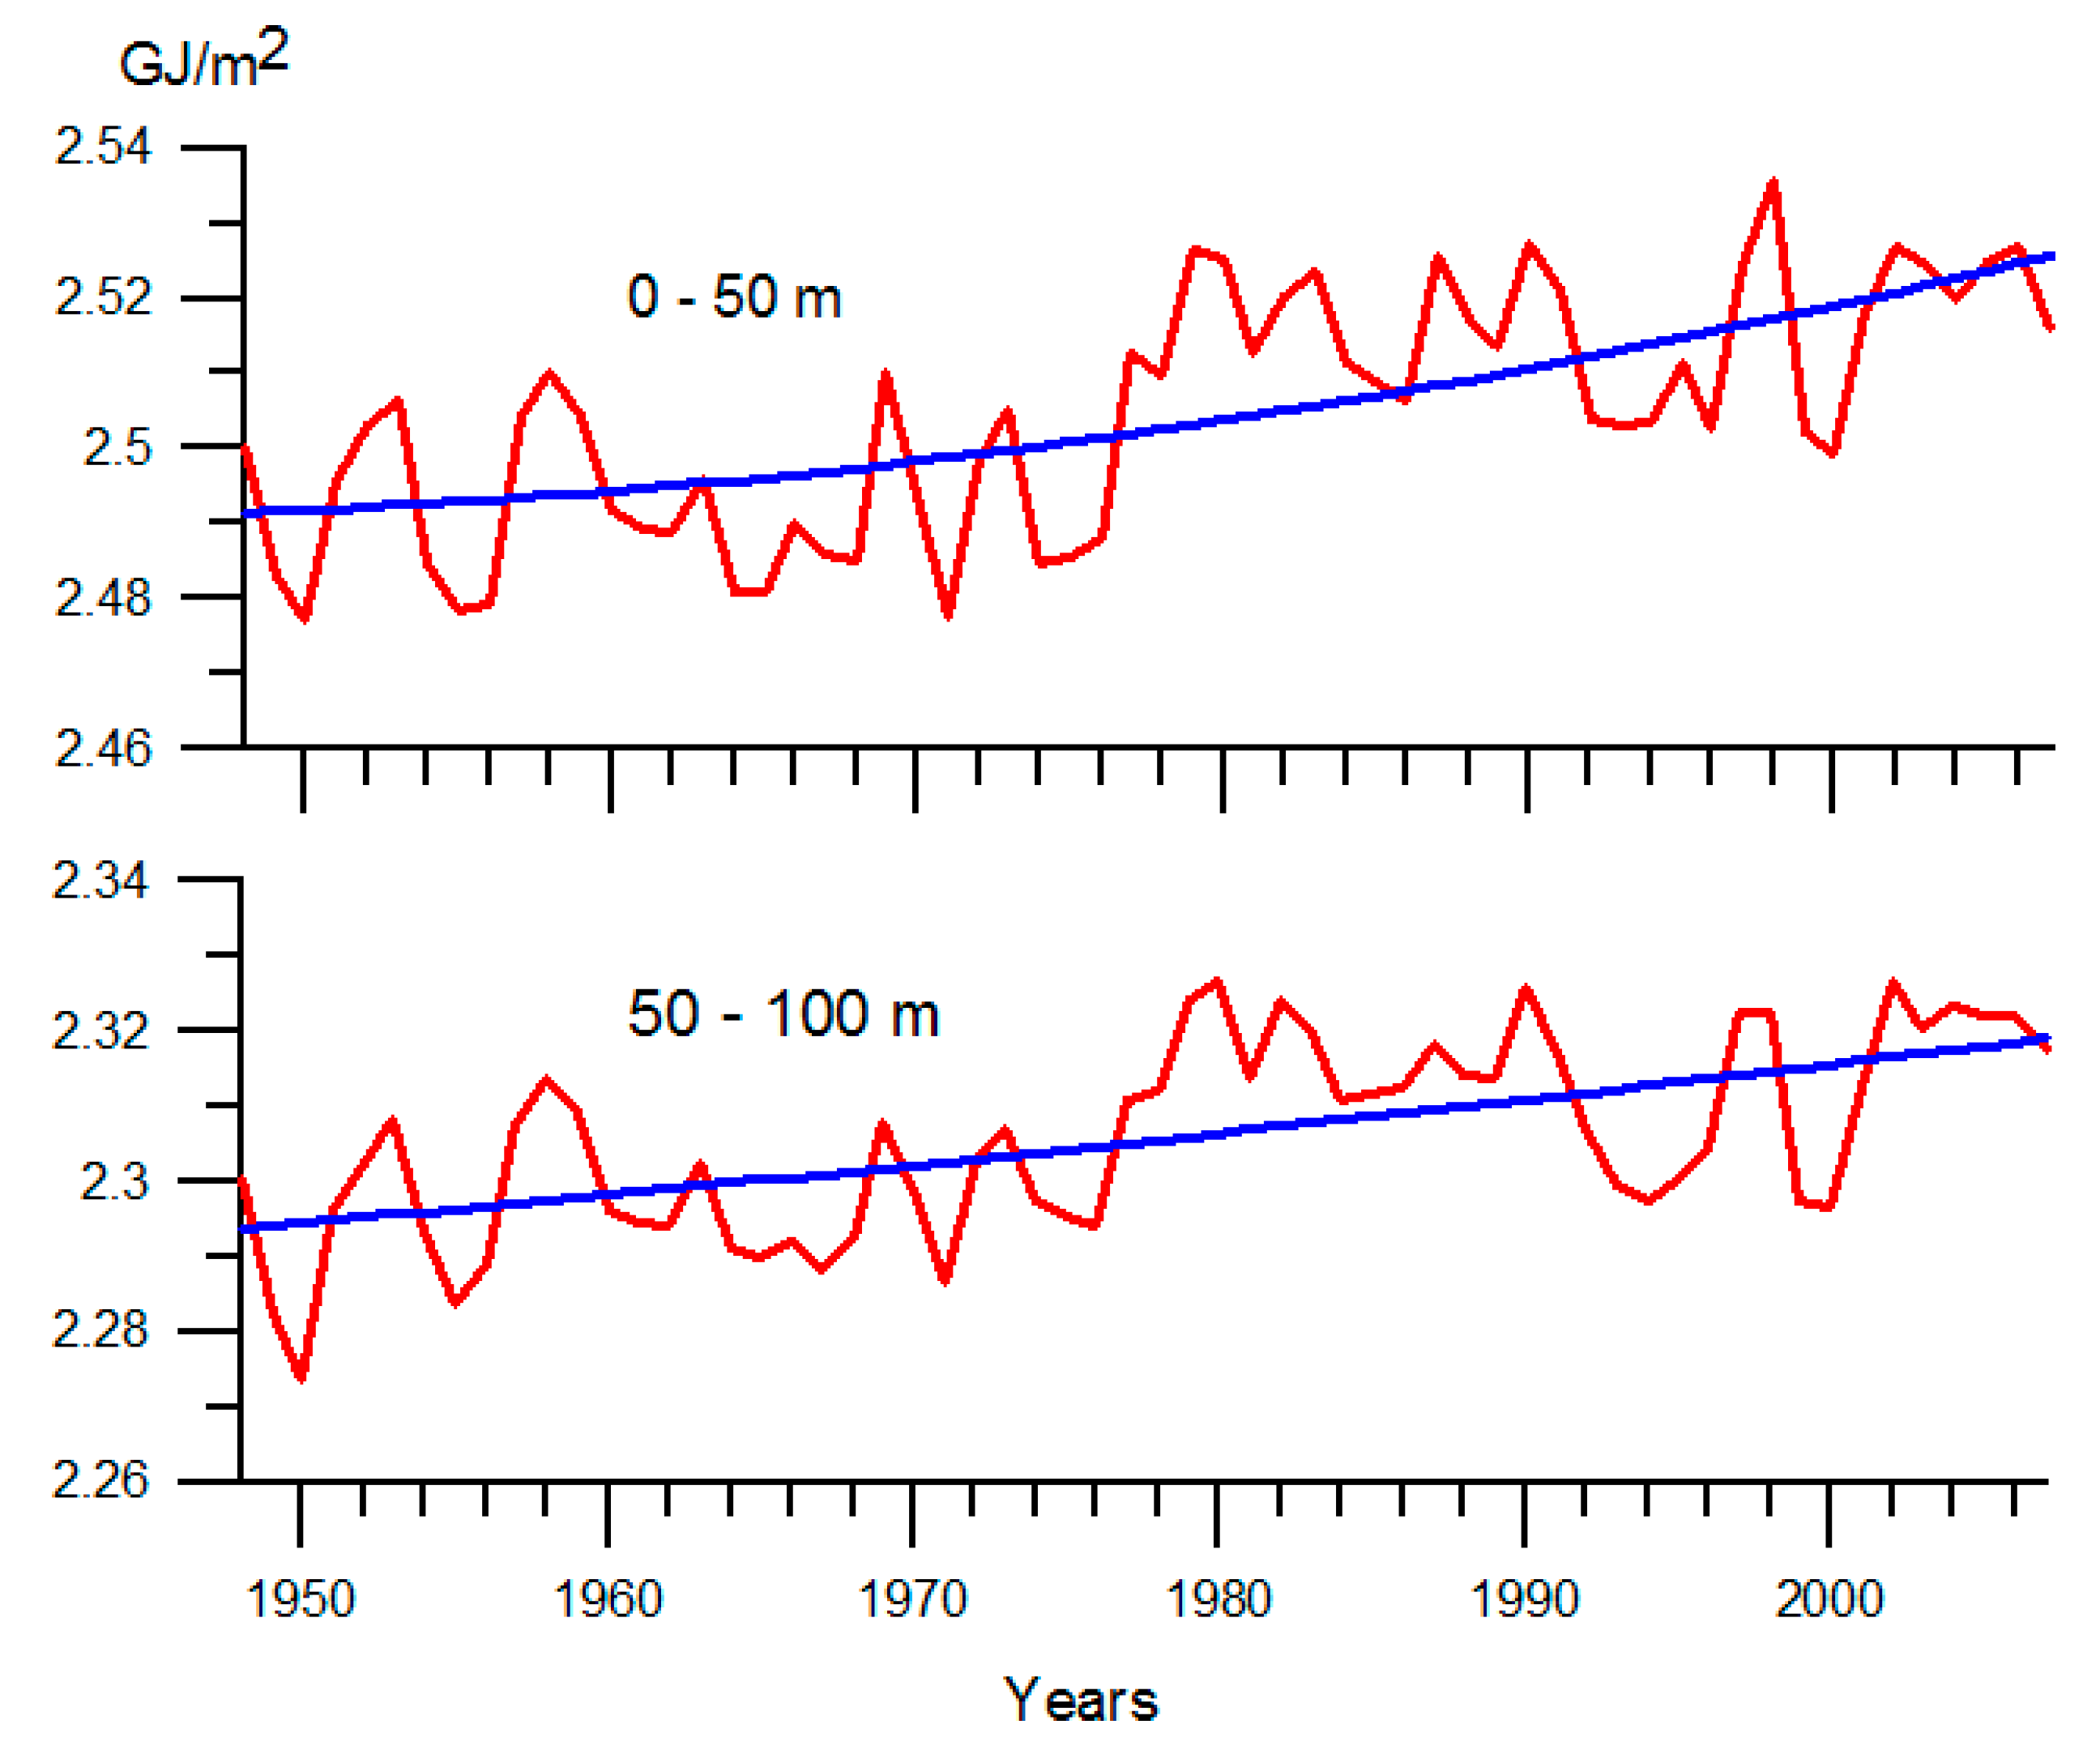
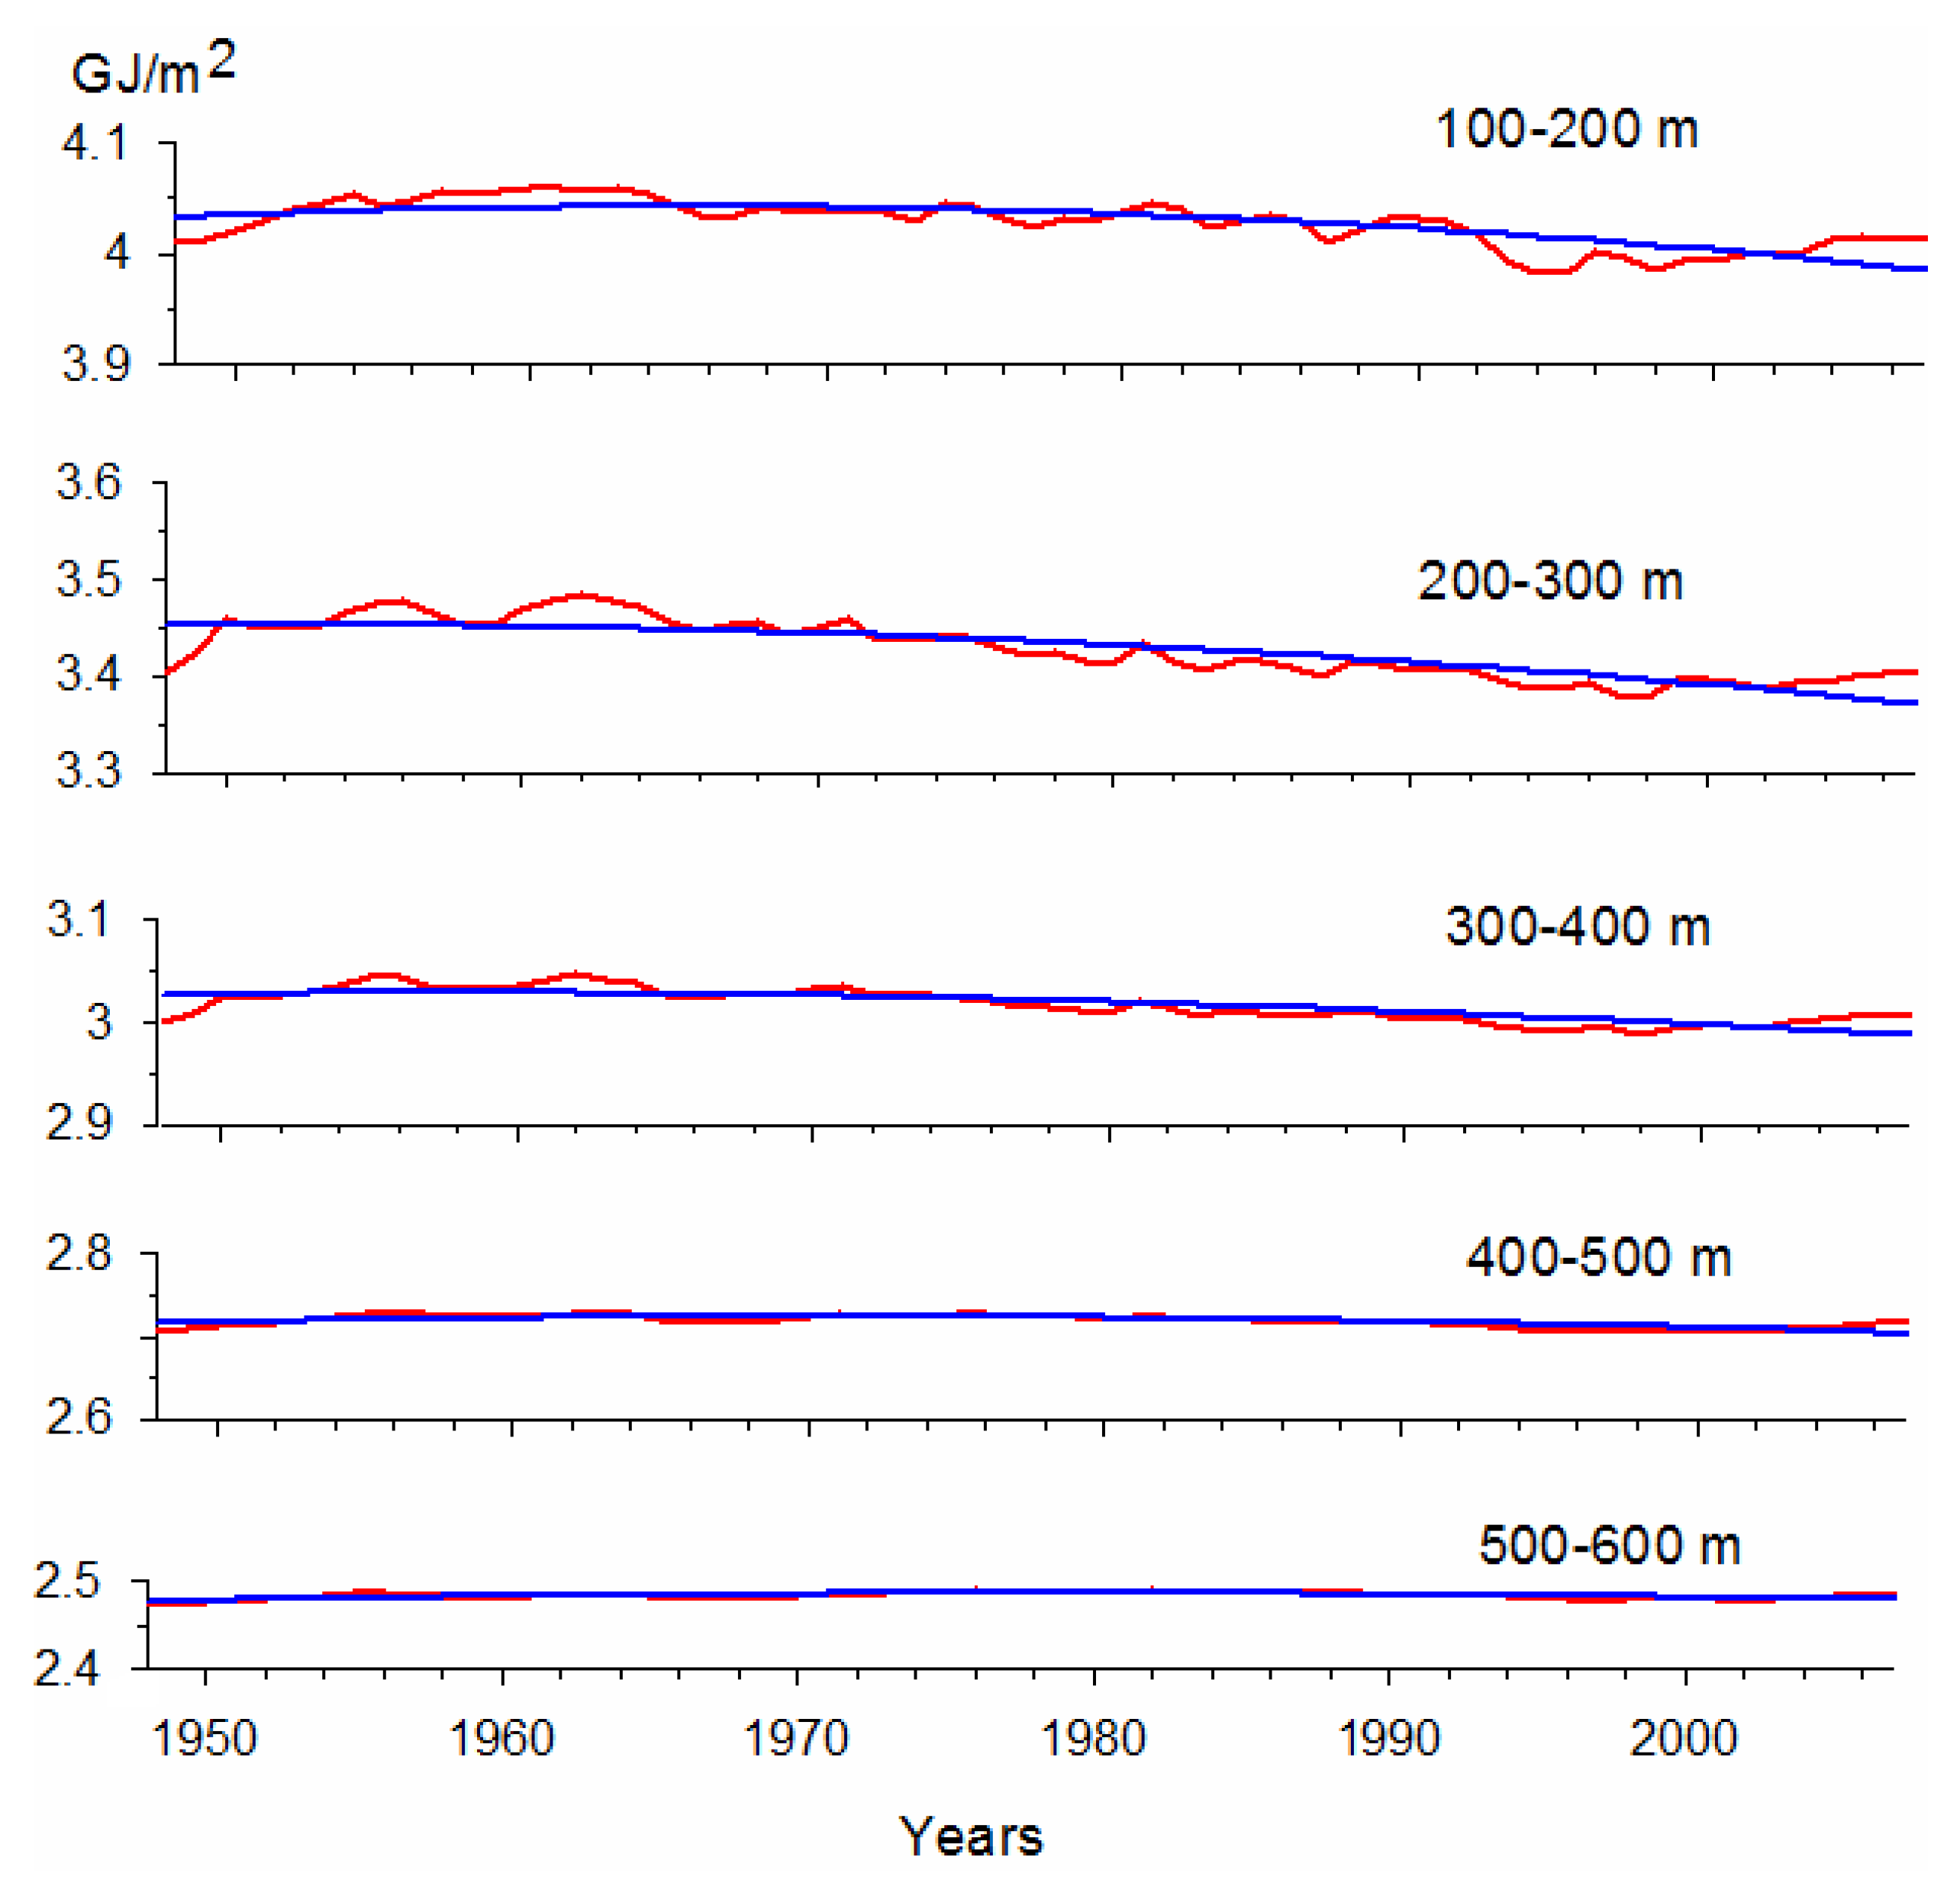
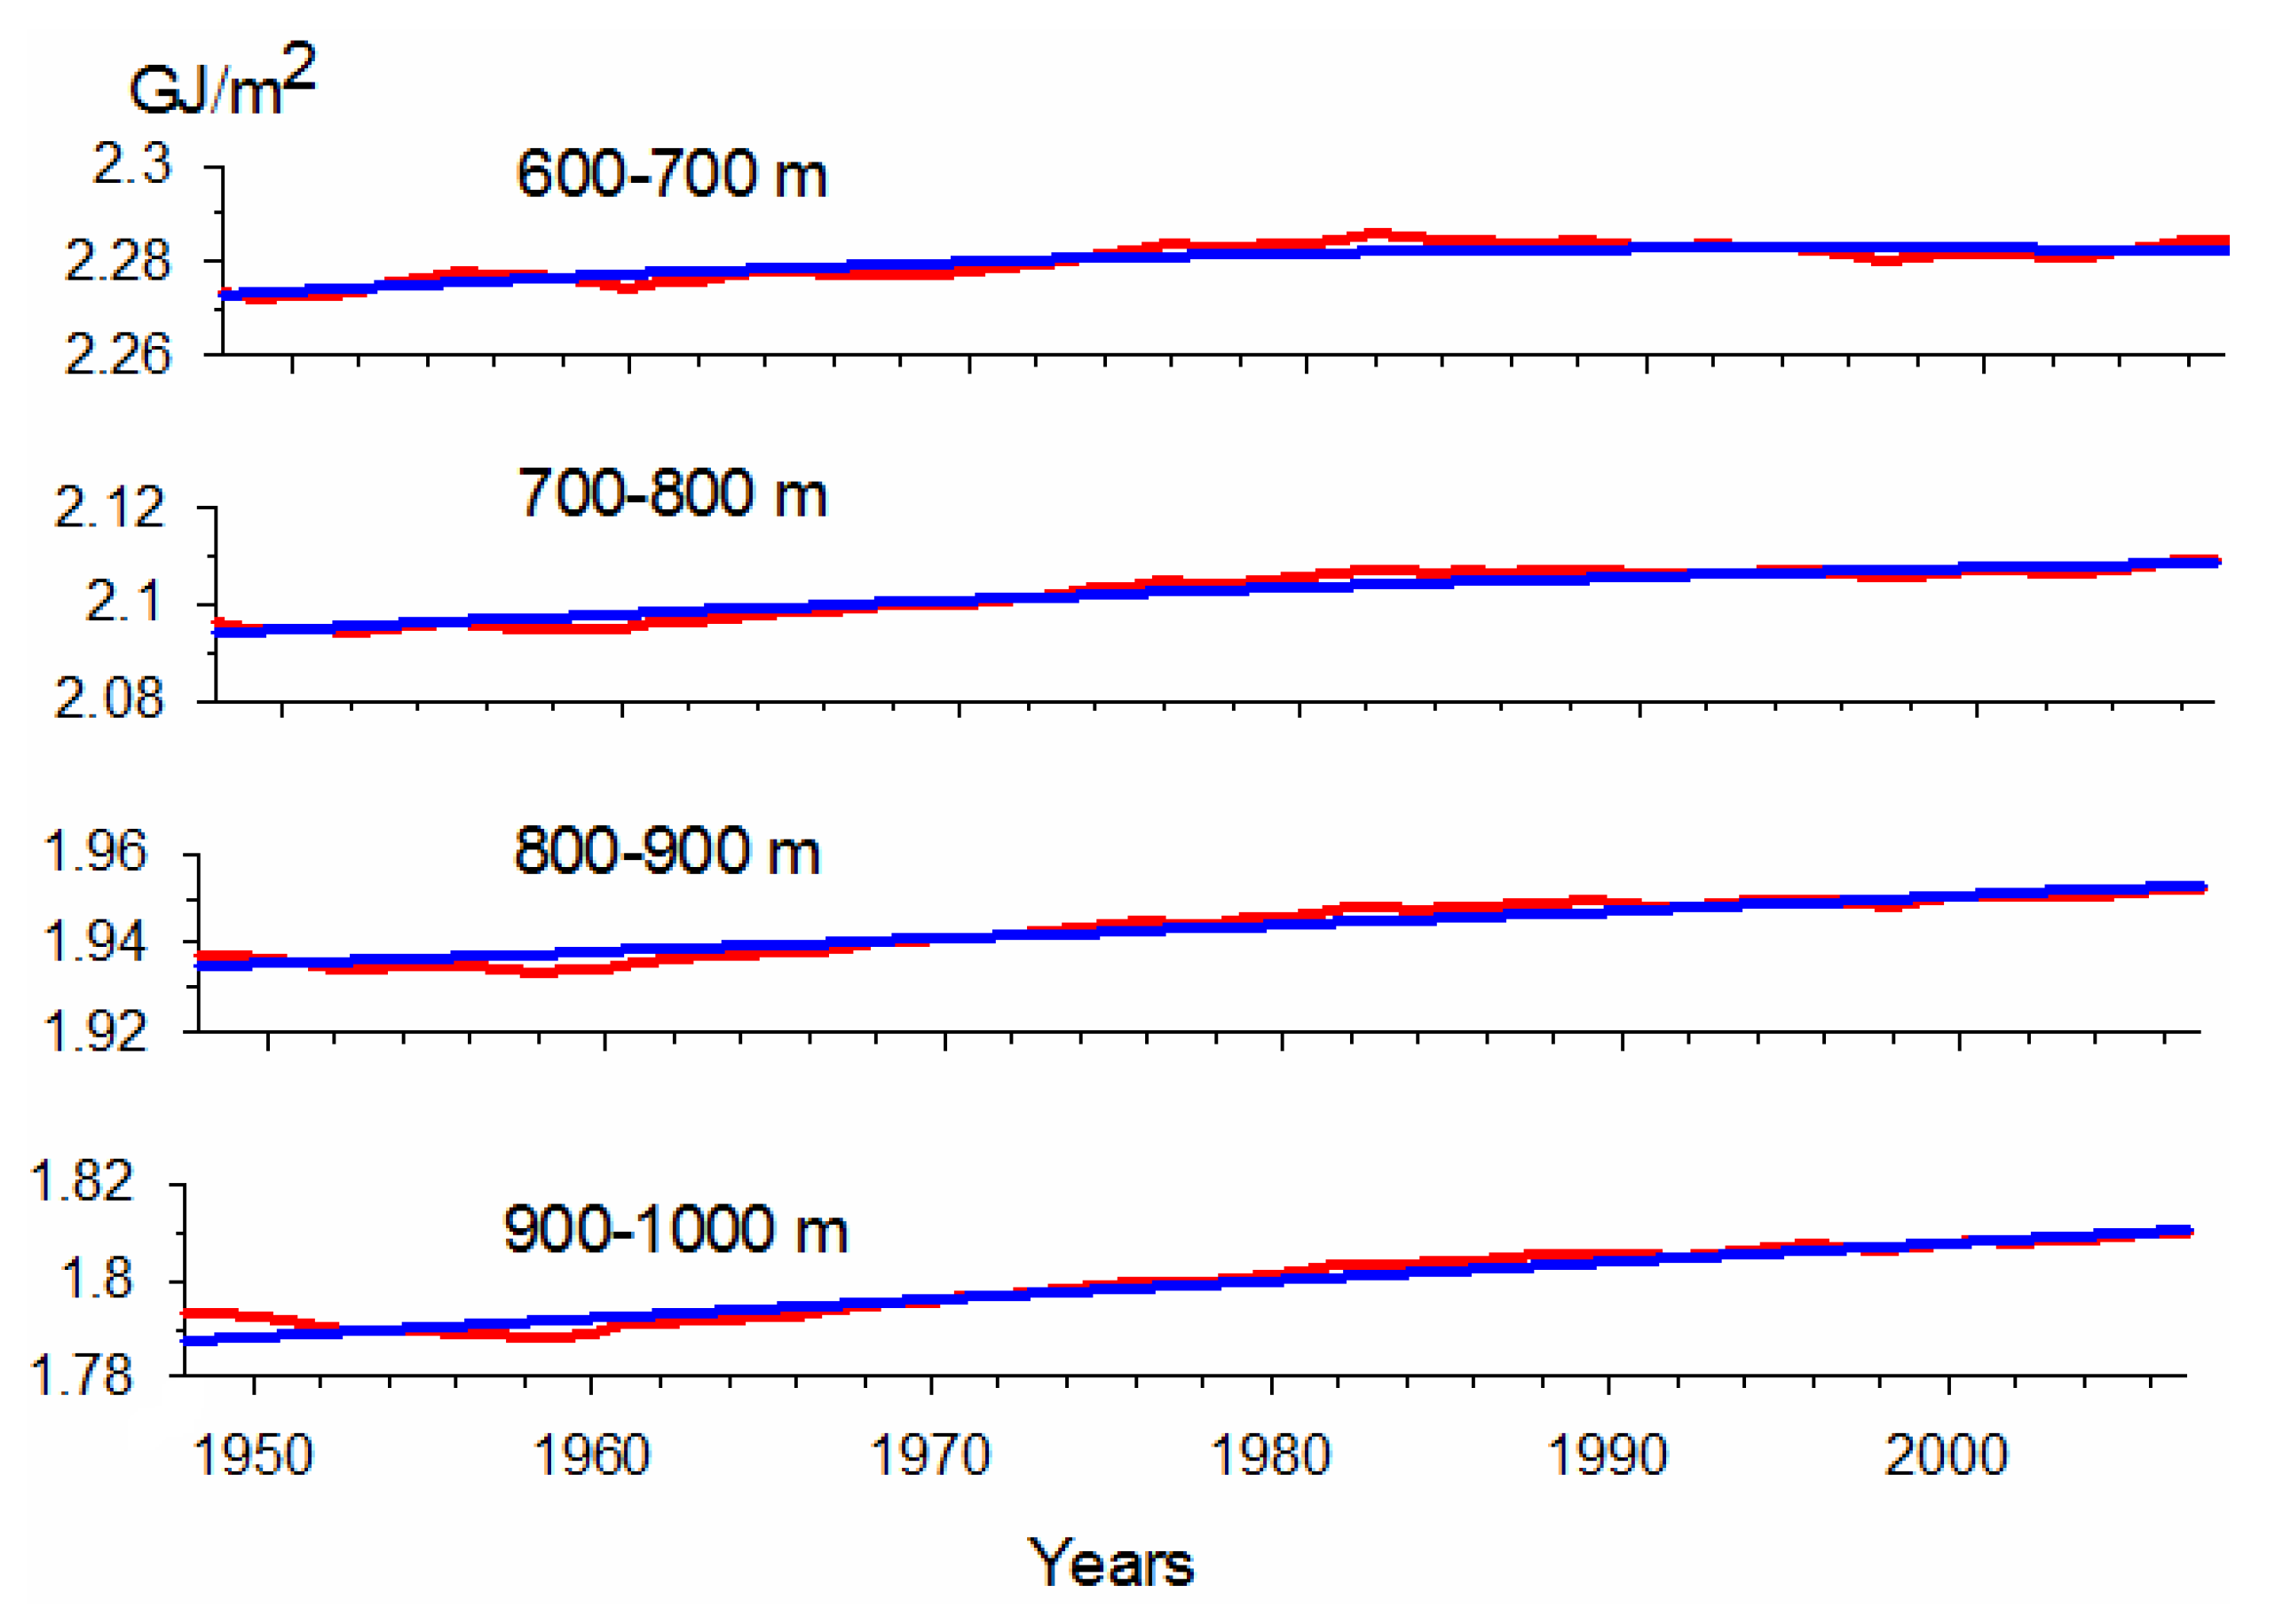
Estimates of the heat content evolution in the upper 1000 m layer at higher vertical resolution (over 100 m layers) reveal a number of important details of the multidecadal rearrangement of the WO AUL (
Figure 2,
Figure 3 and
Figure 4). For the period of 1948–2007, the heat content of the near-surface 100 m layer (
Figure 2) showed a positive trend. In deeper layers (
Figure 3), at least in the layer of 100–500 m, the heat content decreased for the indicated period. Further, as shown in
Figure 4, the heat content at the same time was sequentially switched from the regime of some decrease(100–500 m) to an increase (600–1000 m). The near-surface 100 m layer of the WO mainly reflects seasonal changes, which are well-correlated with processes in the atmospheric boundary layer. The intermediate layer of 100–500 m is more presentable with respect to processes occurring in the main thermocline. The main thermocline presents vertical and horizontal changes in temperature, salinity, and density. Due to geostrophic relationships in the main thermocline, the main changes in horizontal velocities were concentrated along the vertical direction [
43].
Thus, it follows from the analysis of the WO heat content evolution based on the numerical simulation results (
Figure 1,
Figure 2,
Figure 3 and
Figure 4) that the MOHO is not expressed in the upper (0–100 m) mixed layer. It is manifested in the layer of the main thermocline (100–500 m) (
Figure 2 and
Figure 3).
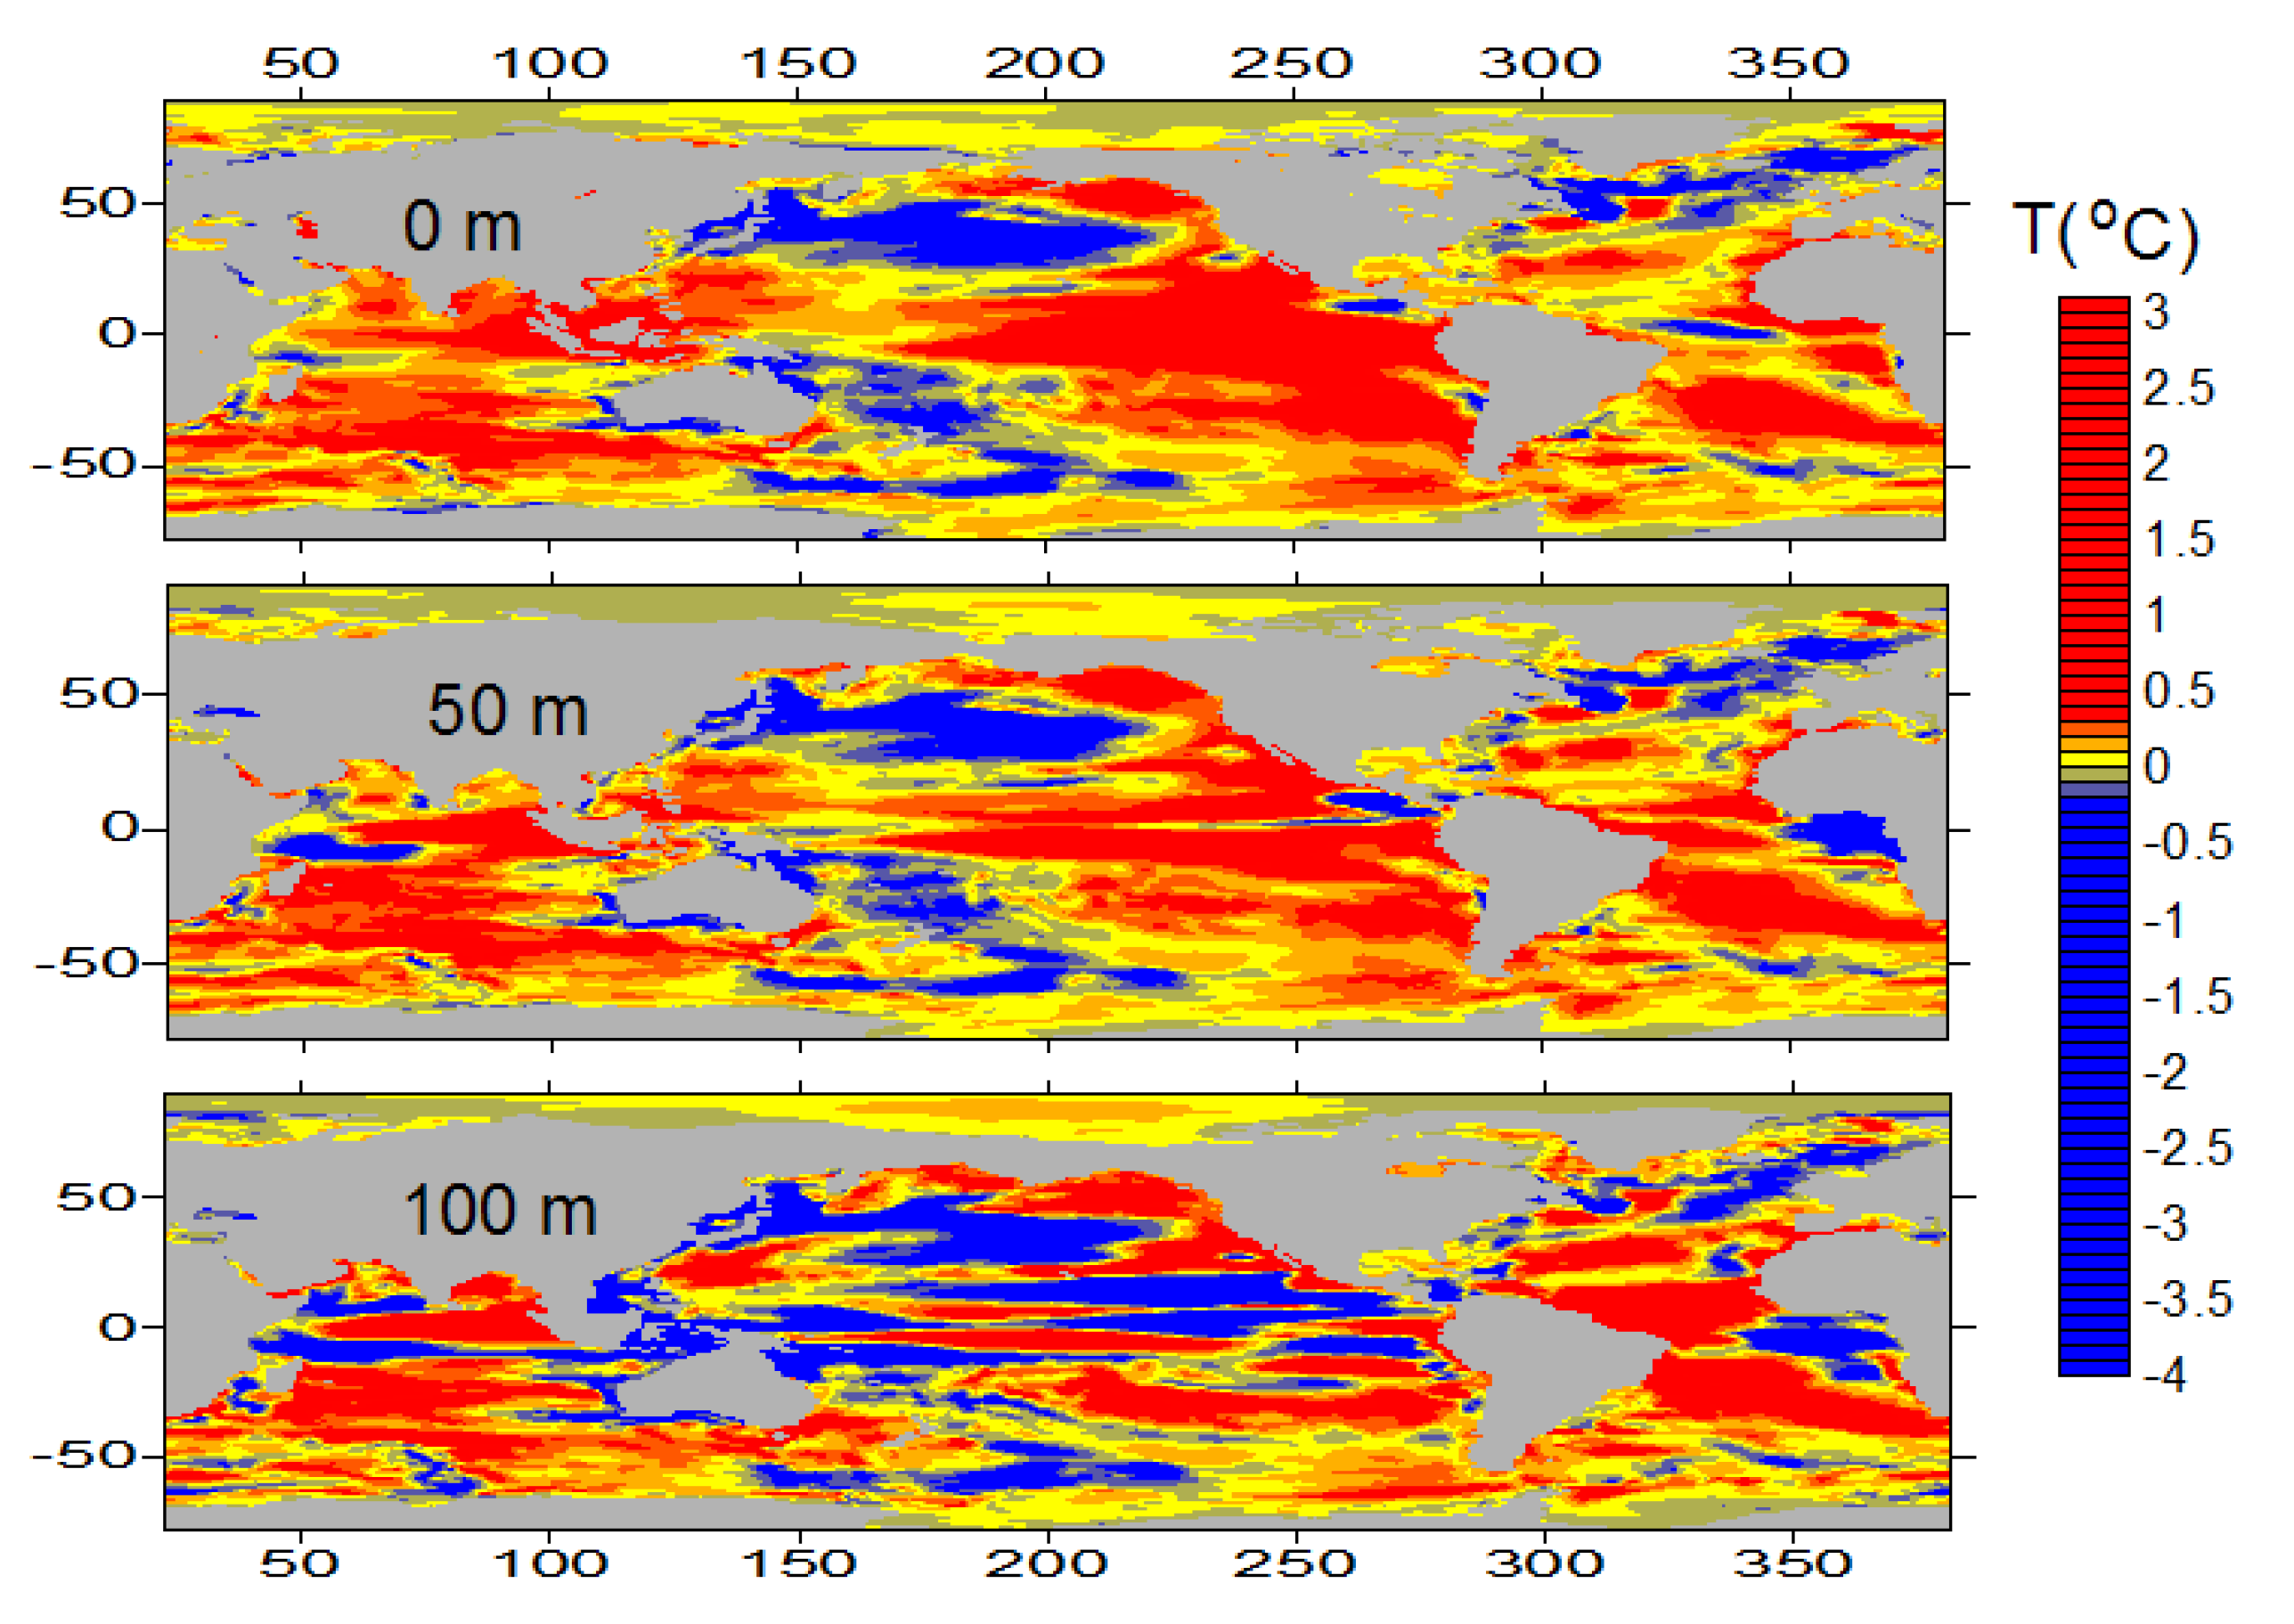
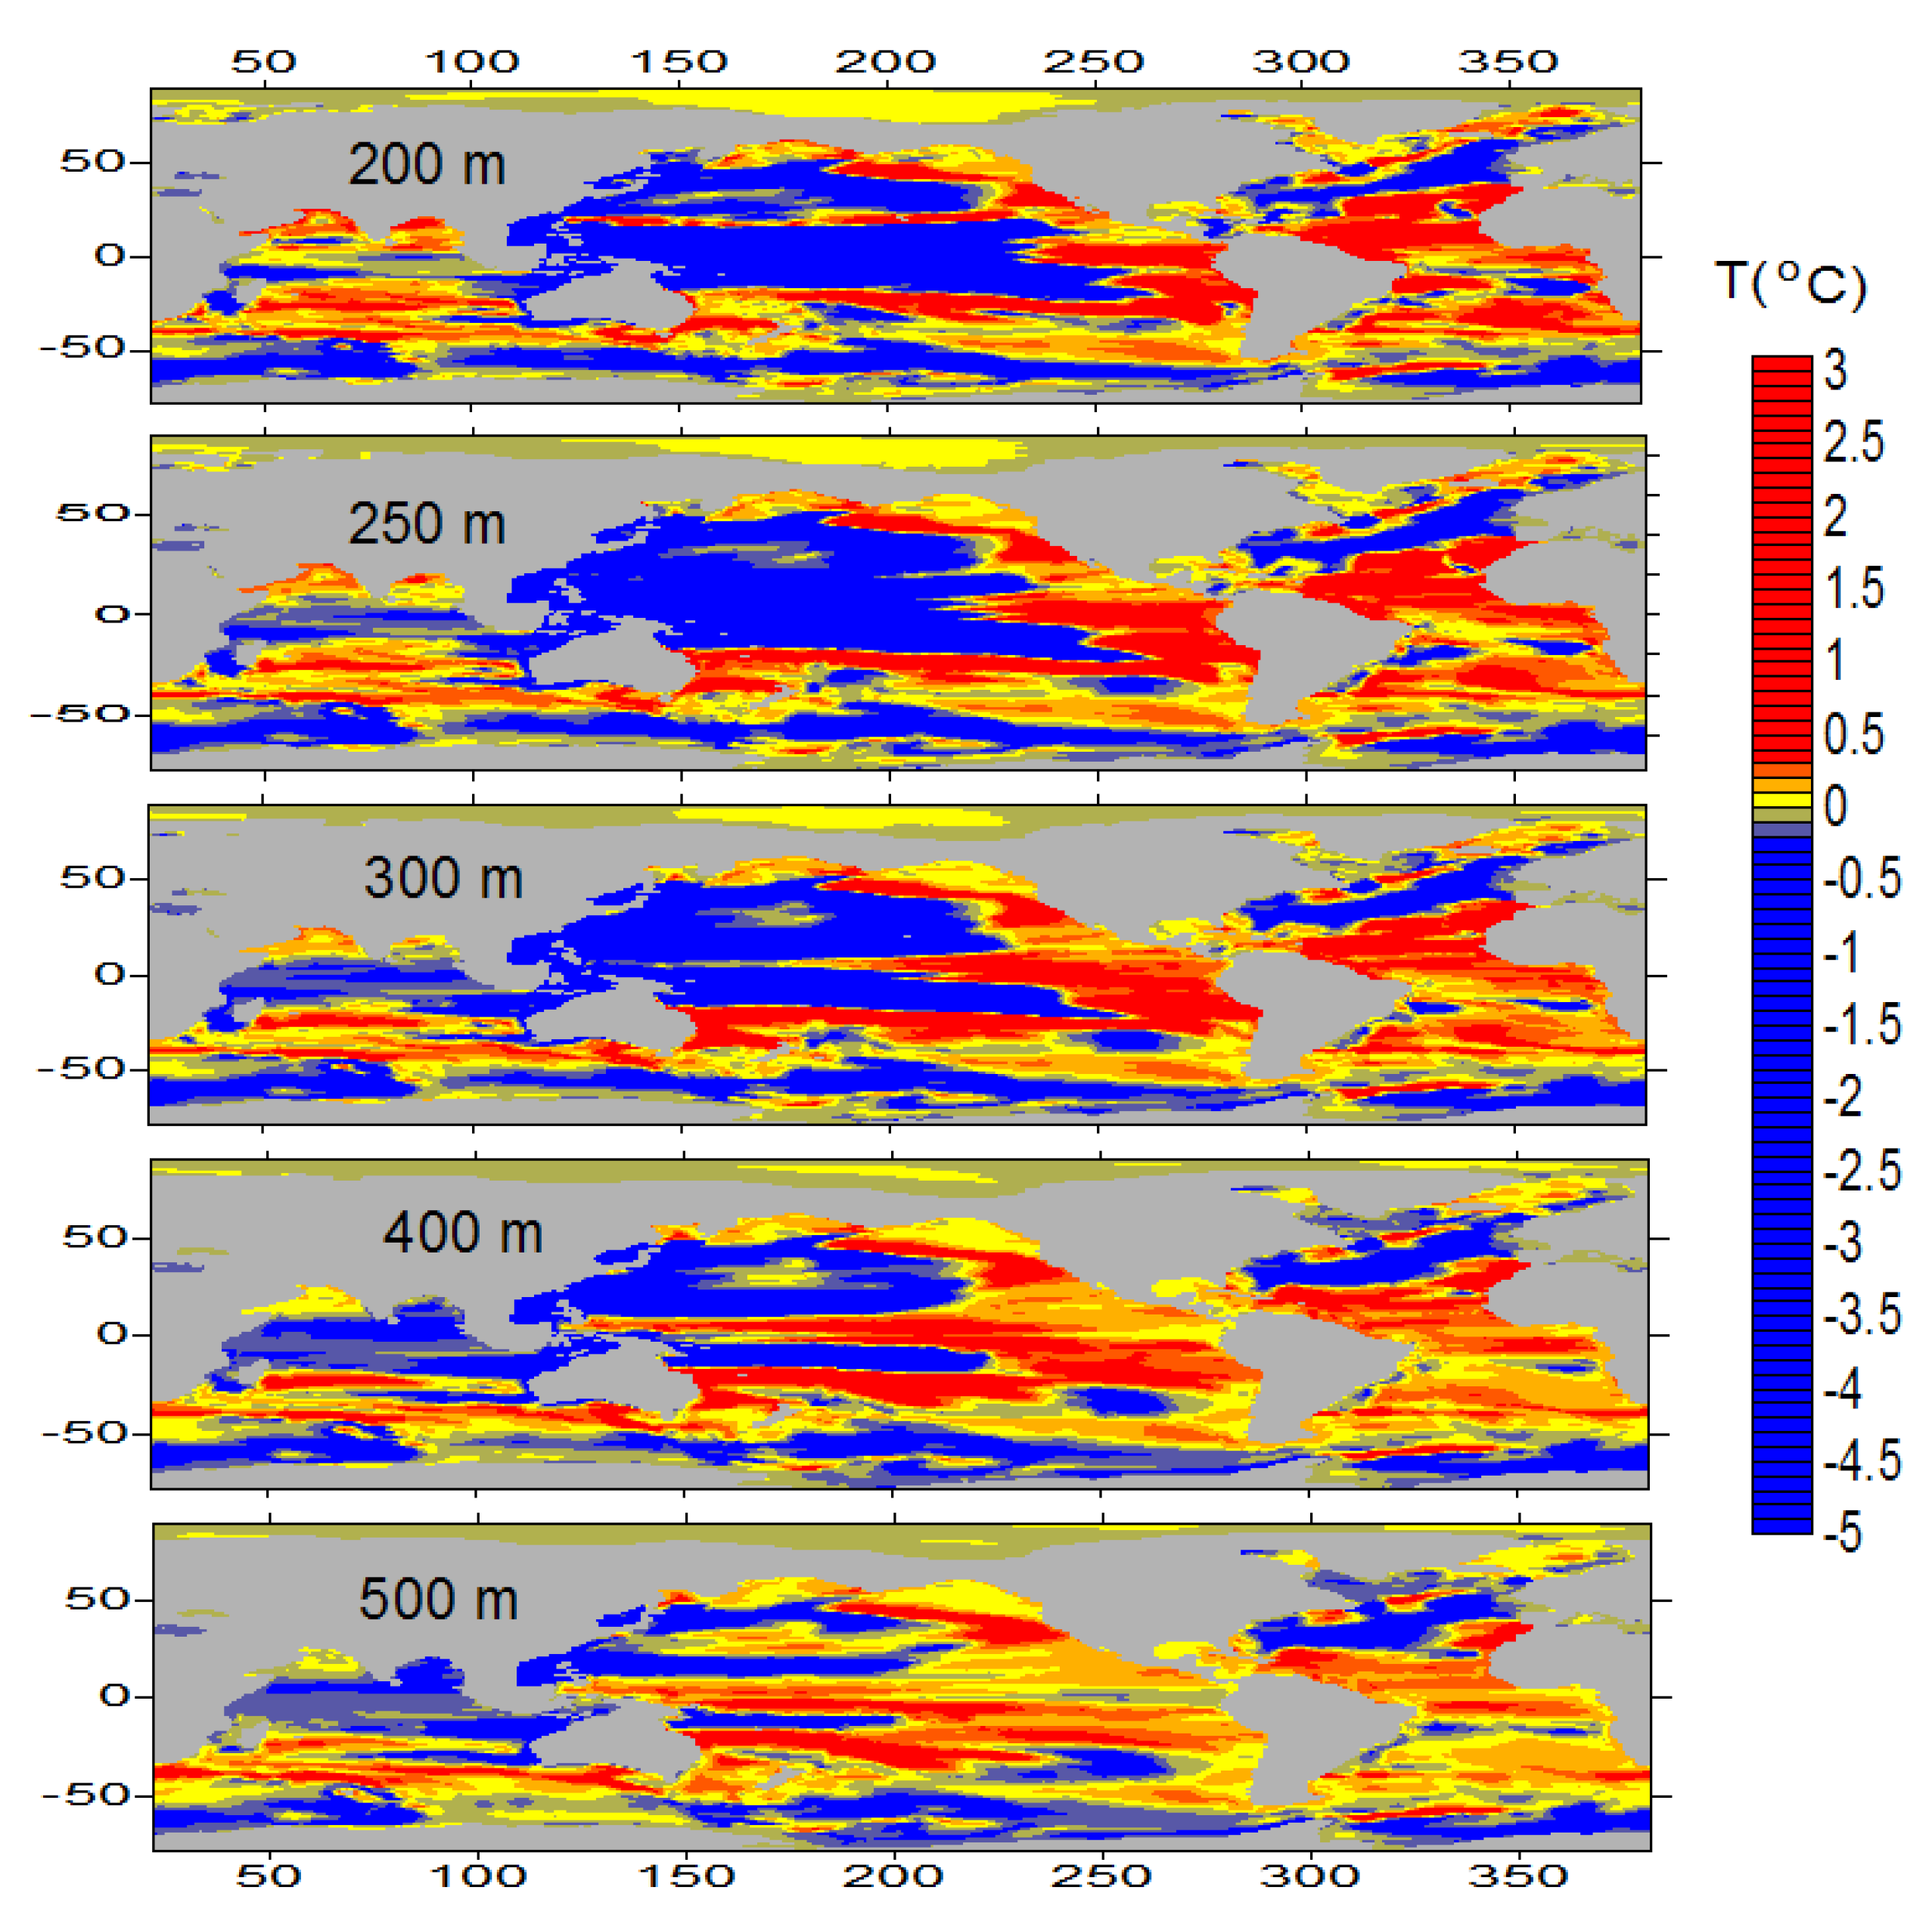
The nature of the MOHO spatial structure and its features can be considered by analysing
Figure 5,
Figure 6,
Figure 7 and
Figure 8, which present cnange in WO temperature in the period of 1948–1999. The centres of WO AUL cooling noted above at the near-surface (
Figure 5) and intermediate (
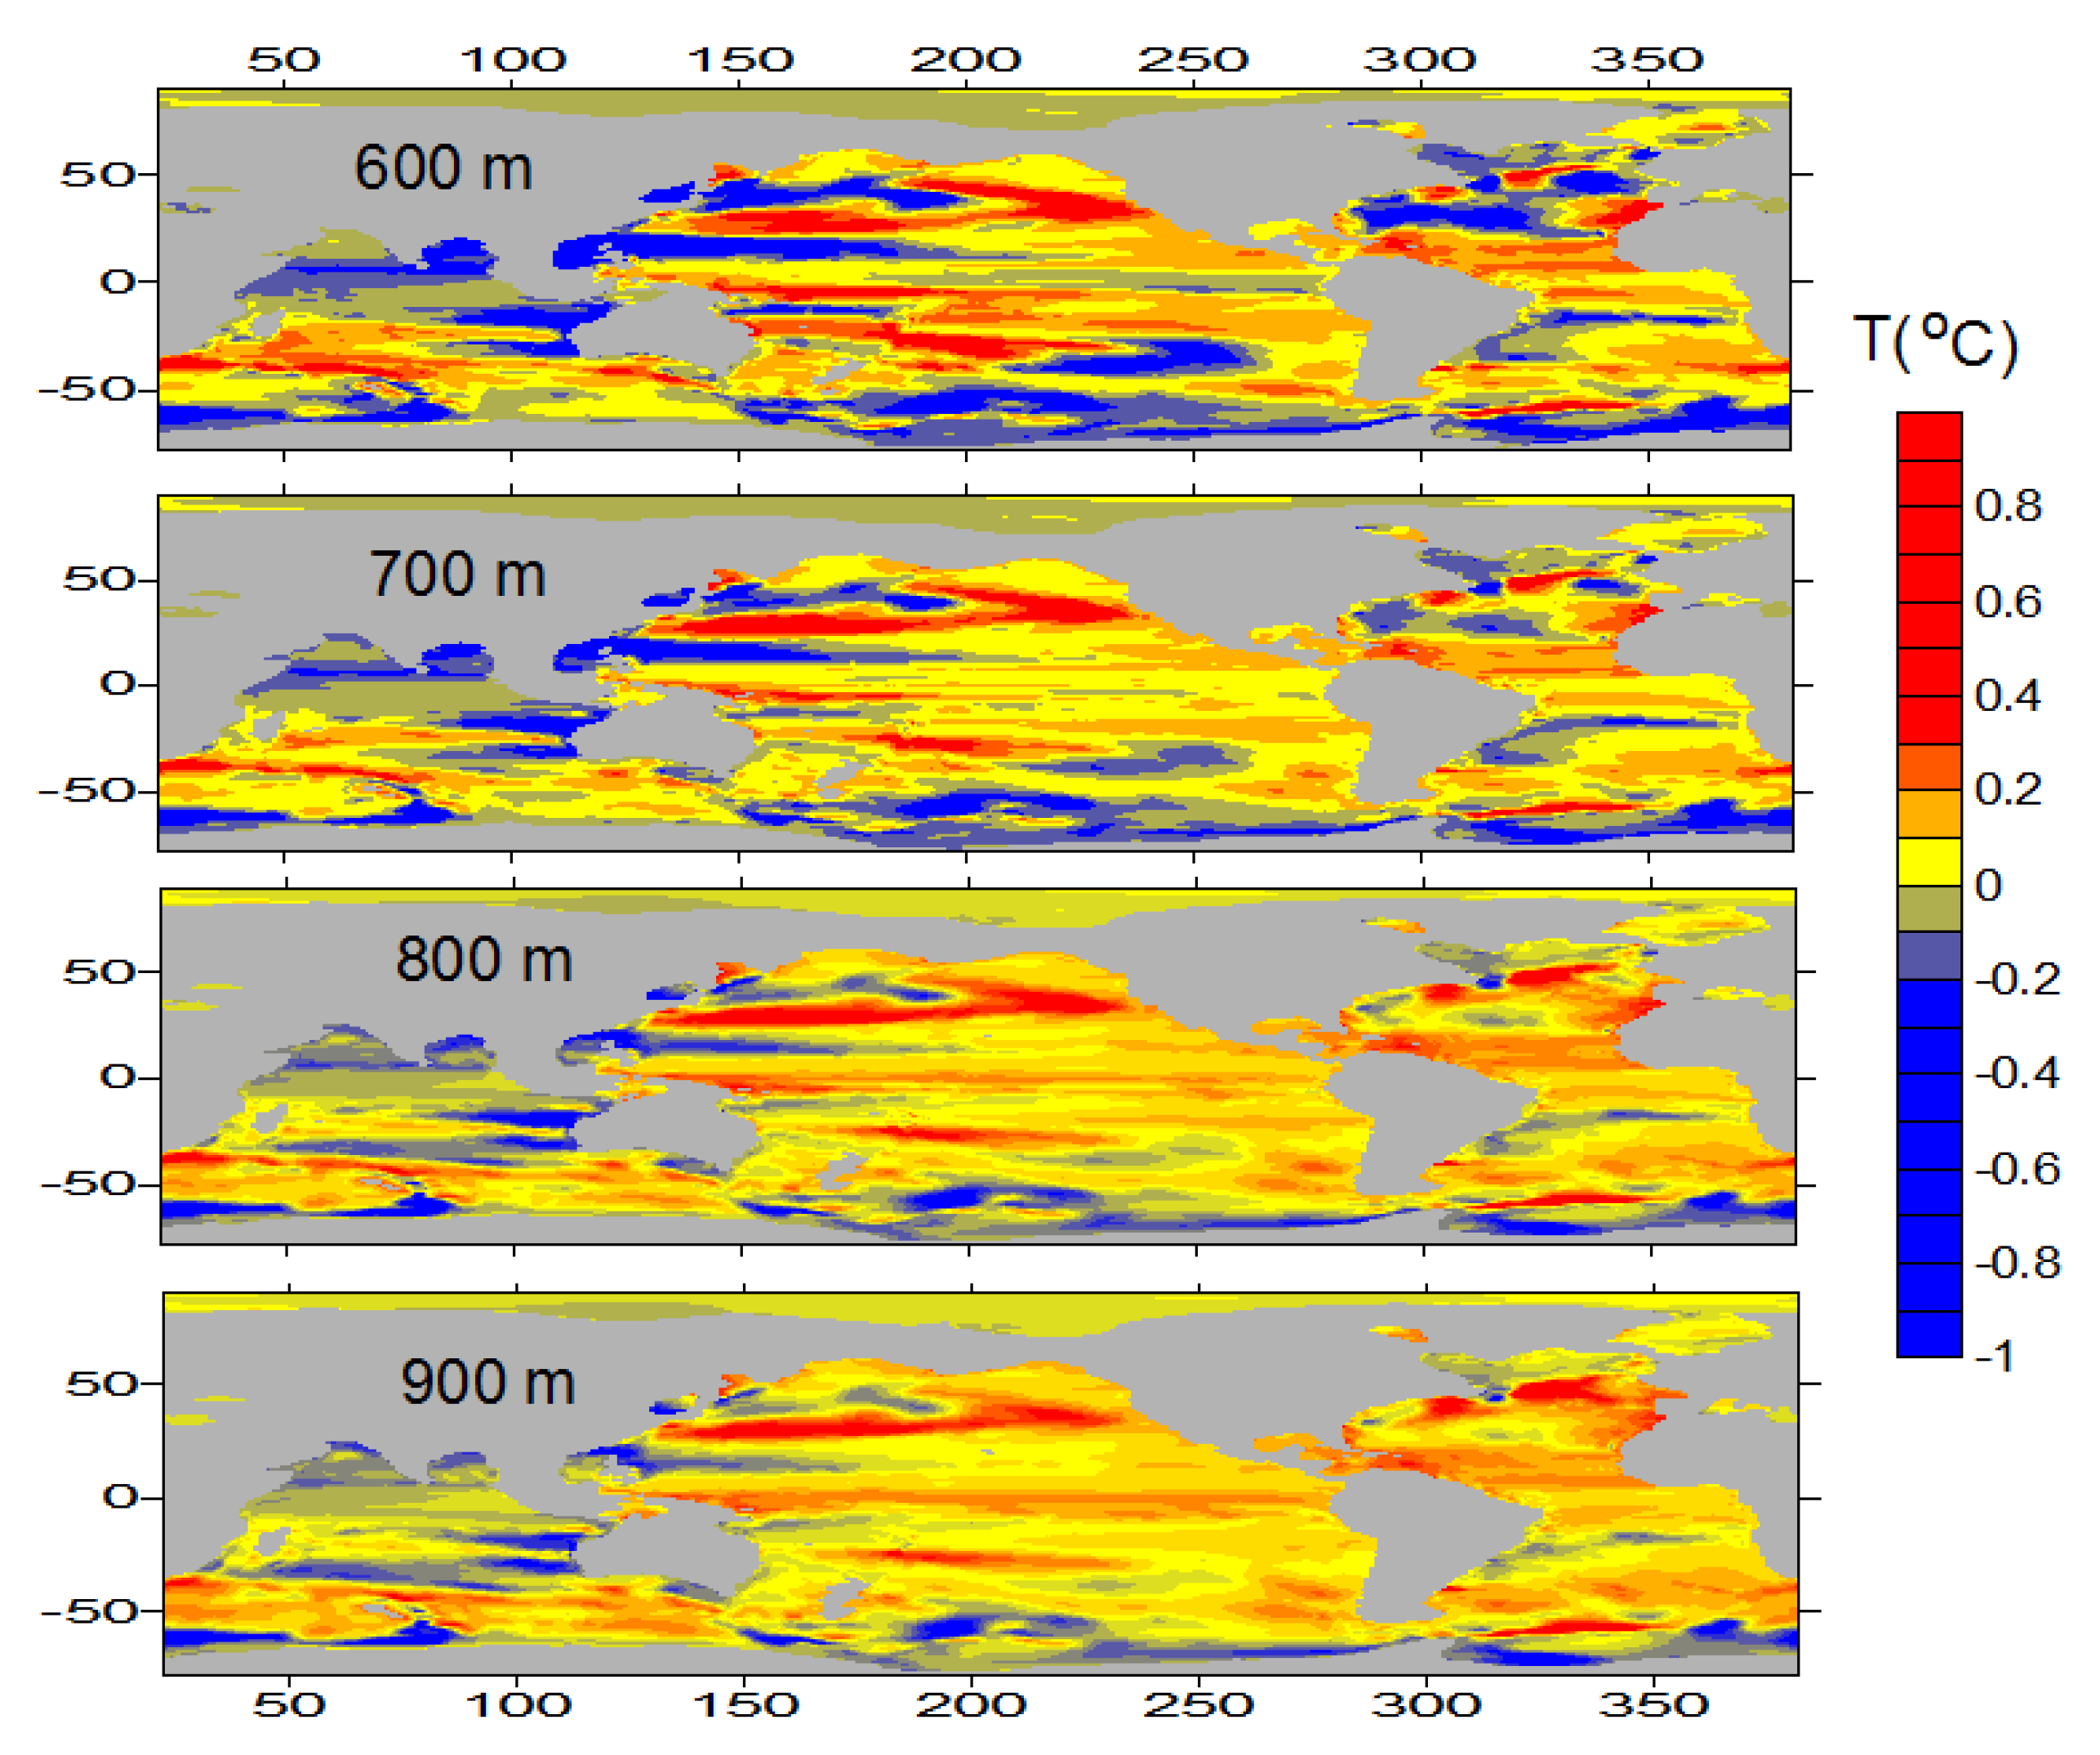
Figure 6) levels were also seen at the depth levels of 600 and 700 m (
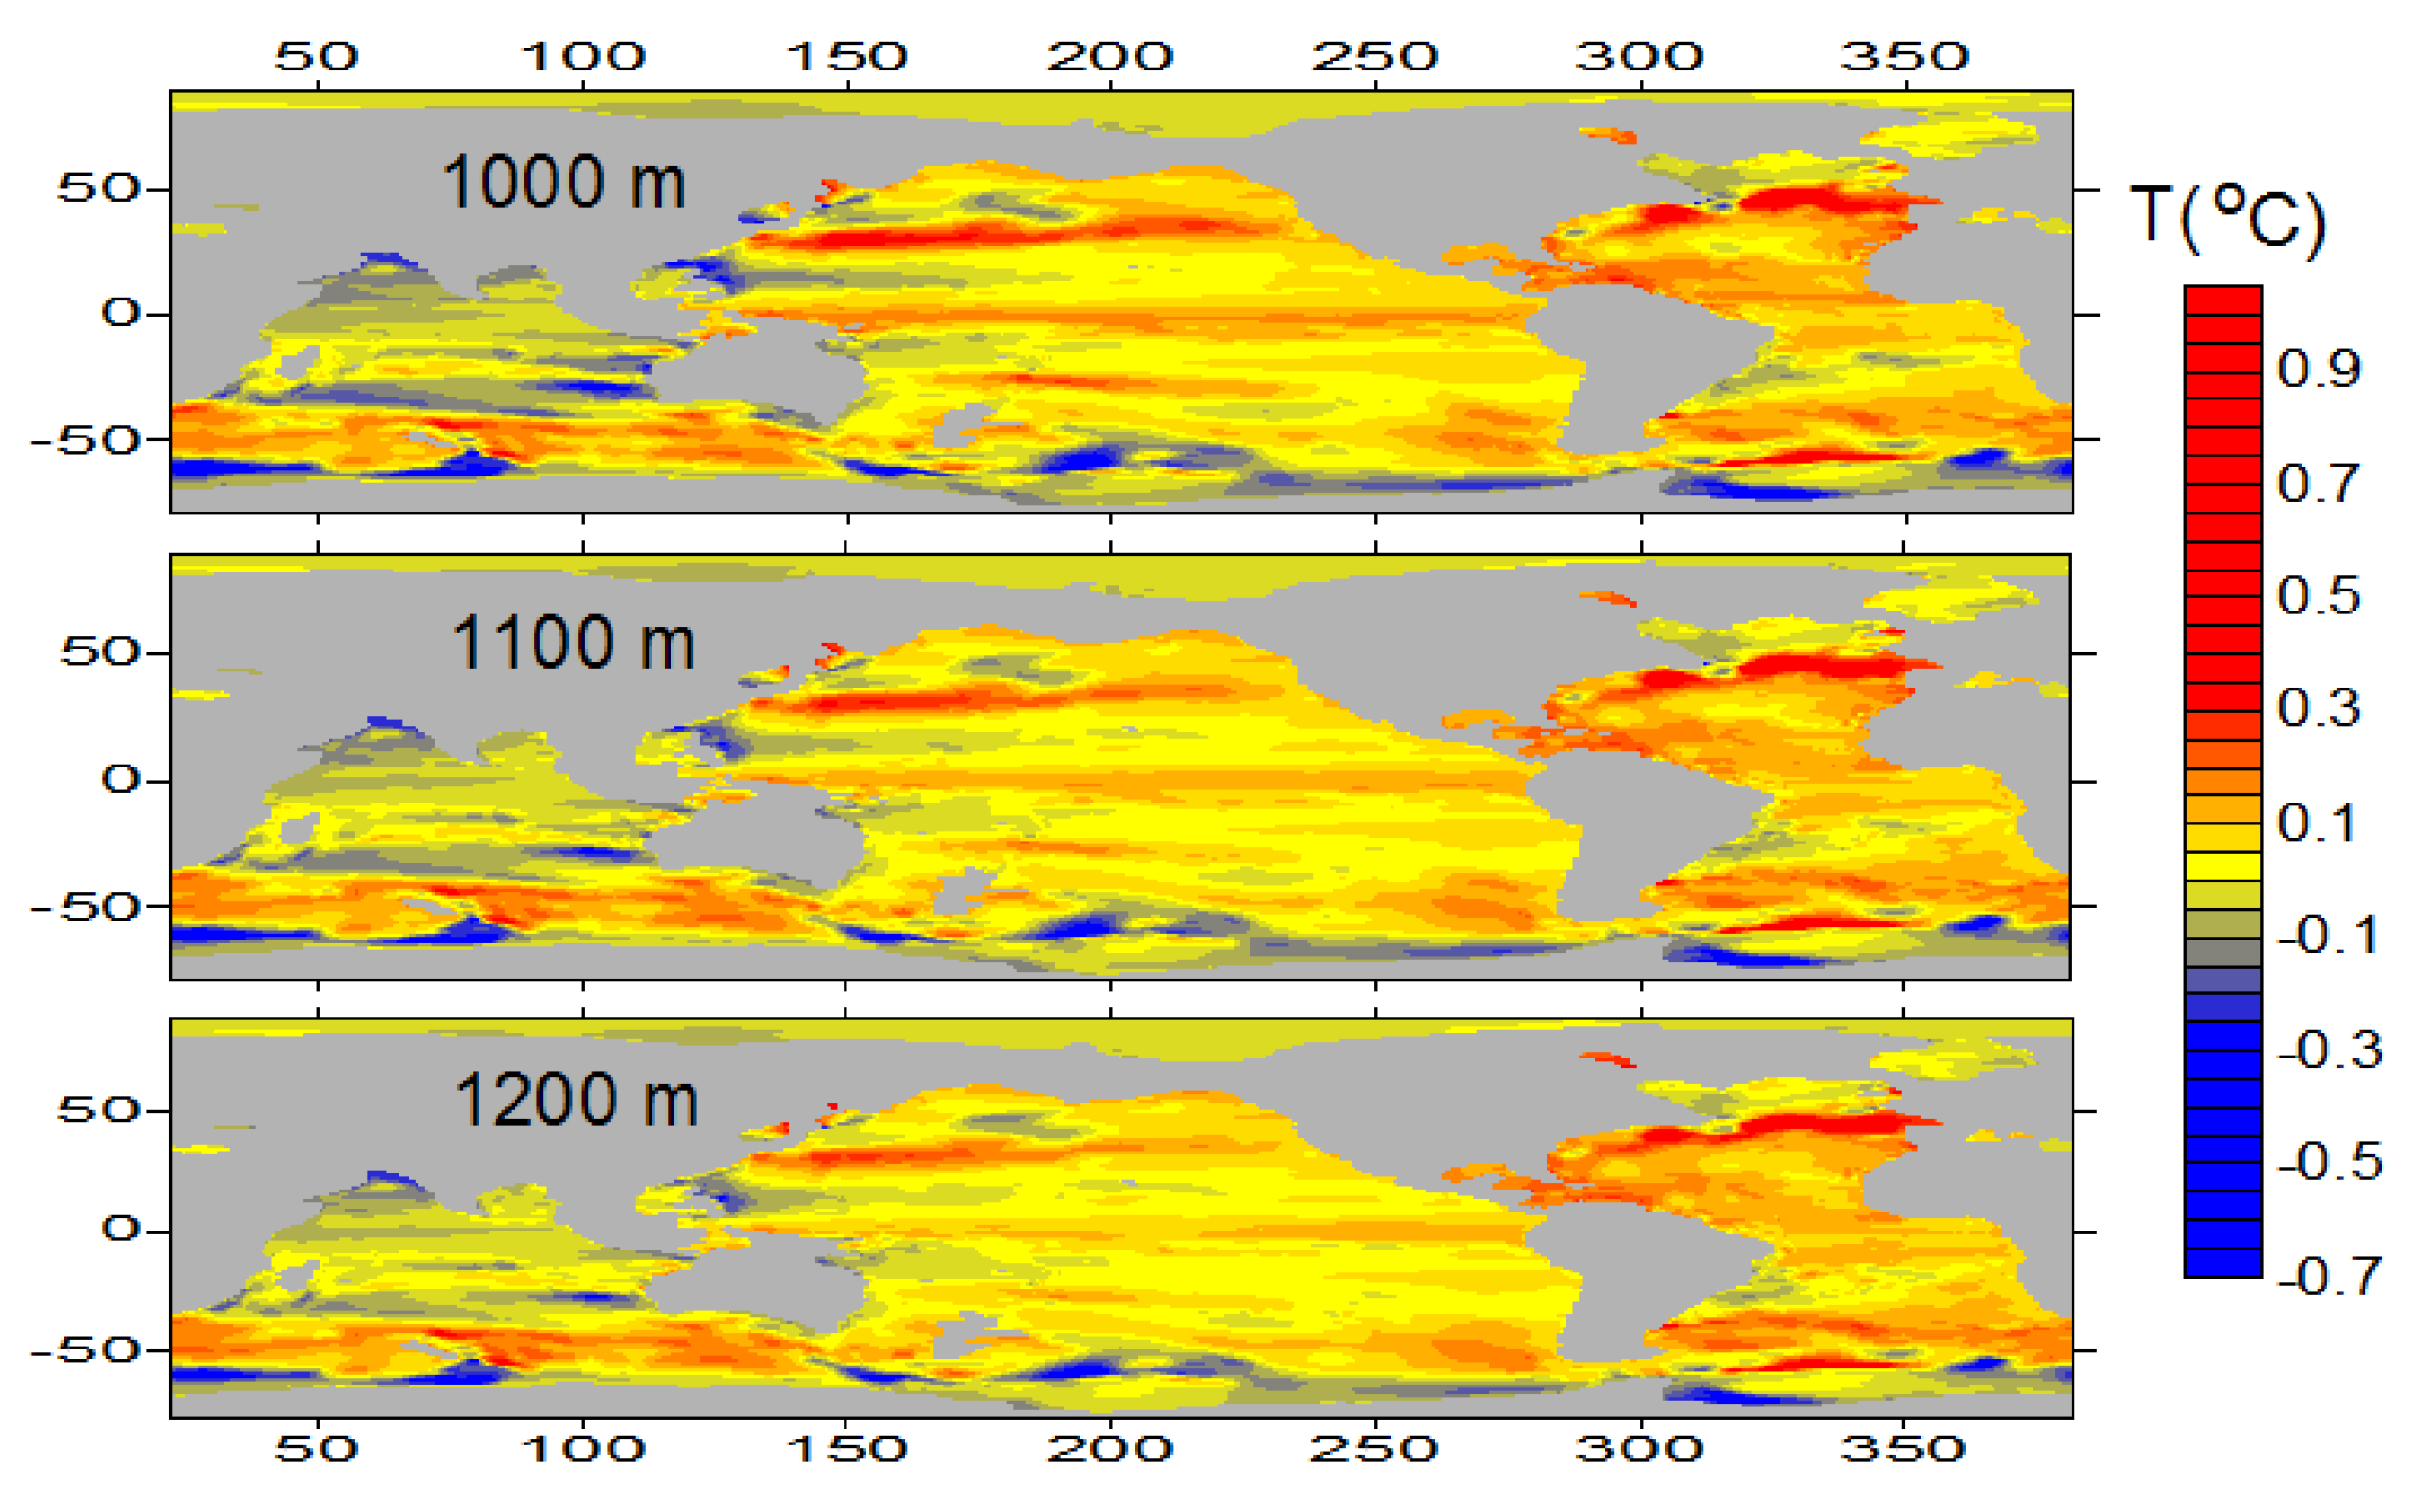
Figure 7). At depths of 800 and 900 m (
Figure 7), the signal on the the AUL heat content decrease in the northern regions of the Atlantic and Pacific was noticeably weakened; in the Southern Ocean, it was observed at the levels of 1000, 1100, and 1200 m (
Figure 8).
However, for the time period of 1975–1999, in a large area of the WO, the AUL experienced an increase in heat content. In particular, this was observed along the eastern boundaries of the Atlantic and Pacific. Thus, MOHO is a structure with negative and positive changes in the heat content of AUL of the WO. The centres of the AUL heat content decrease are natural sources of oceanic heat in the climatic phase (1975–1999) supplying the atmosphere and promoting the intensification of cyclogenesis in it. As an example, it is sufficient to mention the Barents Sea, where the warm intermediate layer of Atlantic waters presents the source of cyclogenesis in the atmosphere, forming a relatively warm and mild climate in the region. This problem was also discussed in [
8,
23]. On the other hand, positive changes in the AUL heat content point to regions where the weakening of cyclogenesis occurred in the indicated period.
Each of the World Ocean areas determines its own contribution (sign and magnitude) to the considered oscillation. The most significant indicators of this participation are shown in
Figure 6, which shows the disturbance anomalies in the MOHO core.
4. Discussion
The nature of the WO heat content evolution (
Figure 1) allows for considering its structure as a superposition of two modes of variability, namely, trend and wave fluctuations. The trend characterises the WO deep layer (1000–5500 m) and represents secular or longer changes, whereas multidecadal wave oscillations (0–1000 m) characterise the AUL.
The WO thermal regime is demonstrated by two layers: multidecadal heat content perturbations in the AUL and its continuous growth in the deep layer. The growth of the heat content in the deep layer (source power, 0.25 W/m
2) is associated mostly with the anthropogenic factor [
44,
45,
46,
47,
48]. A certain effect may be attributed to natural processes, for example, a decrease in the intensity of upwellings along the western coasts of continents, a decrease in the generation of Antarctic bottom waters, and a weakening of circulation in the global oceanic conveyor [
49].
On the basis of the factual material, a positive trend in the deep layer (1000–3000 m) of WO was identified [
44]. According to the data of ATLANTEX-90 experiment [
23] in the North Atlantic, which acts as one of the heat sources, in the AUL (0–1000 m), negative anomalies of heat content were revealed; deeper (1000–2000 m), obviously not by chance, the positive ones were found. The ATLANTEX-90 experiment was carried out during the WO thermal discharge phase (1975–1999).
In the WO AUL and deep layer, heat content evolution is fundamentally different. In the AUL, there are multidecadal oscillations of the heat content with its episodic increases (in the 1950s–1960s) and decreases (in the 1980s–1990s), thus conditionally maintaining a critical level of the parameter.
MOHO undoubtedly reflects an important role of the latter in the formation of the structure of the present-day climate change. Earlier multidecadal WO rhythms and their quasisynchronous relationship were revealed on the corresponding time scales with the variability in the planetary atmosphere [
2,
8]. This allows for substantiating the existence of processes consisting of the redistribution of heat in the global intrasystem (ocean–atmosphere–continent) originating from the WO AUL.
The thermodynamic regime of the present-day global climate multidecadal rhythm, for example, 1940–1999, should be examined in more detail. It is also important to analyse and understand the behaviour of the global atmosphere and the WO during a specific time interval. On the eve of the accepted climatic rhythm, i.e., in the late 1930s–early 1940s in the Northern Hemisphere, anomalous temperature contrasts developed in the near-surface layer of the atmosphere over the oceans (Atlantic and Pacific) and the Eurasian continent. Correspondingly, ocean surfaces turned out to be abnormally heated, and the surface of the central continental regions was abnormally cold. A similar state of the regional climate system was observed with the dominance of Arctic air mass invasions over the Eurasian and North American continents. It was accompanied by a weakening of the zonal western atmospheric circulation, and a by reduction in the thermal effect of the oceans over the Eurasian [
2] and North American [
12] continents.
Along with the development of meridional southern processes of atmospheric circulation over the oceans, meridional northern processes develop over the continents, and during periods of more frequent northern processes over the oceans, an increase in the frequency of southern processes over the continents is observed. The diagnosis of the amplitude-phase diagrams of the balances between such changes indicates their multidecadal rhythm.
In 1975–1999, the intrusions of cold Arctic air masses into warm waters, spreading to the high latitudes of the Atlantic (North Atlantic current) and the Pacific (North Pacific current), were the cause of extreme heat and moisture fluxes into the atmosphere. Anomalous cloudiness was developed over regions of intense heat exchange and, as a consequence, the supply of shortwave solar radiation to the ocean surface was decreased. The cooling and salinisation of surface waters on a multidecadal time scale of 25–35 years were accompanied by the development of deep convection up to 1000 m and over in the Atlantic [
23] and up to 400–500 m in the Pacific [
21], which predetermined the energy of the WO AUL.
The significant cooling of the upper 1000 m ocean layer at a certain moment leads to a sudden interruption of deep convection, together with high heat fluxes from the ocean into the atmosphere and a decrease in the thickness of the cloud cover. An increase in the inflow of shortwave solar radiation to the ocean surface is also observed. A significant cooling of the upper ocean 1000 m layer occurs as a result of many years of intense fluxes of sensible and latent heat with a simultaneous weakening of the inflow of shortwave solar radiation to the ocean surface due to clouds. The ocean–atmosphere system changes the regime of thermodynamic interaction within 2–3 years and passes from the state of thermal WO AUL discharge to the state of its heat accumulation. This is perceived as a climatic shift. Then, the system turns into the mode of AUL recovery to its initial heat content.
The transitions of the climatic system occuring suddenly from the humid to the continental and then again to the humid phase are accompanied by either the weakening of the western transfer of moist and warm oceanic air masses to the continents or its strengthening. These transitions significantly impact the economic, social, and political lives of huge territories (droughts, floods, forest fires, etc.).
The significant cooling of the upper 1000 m WO layer at a certain point leads to the rapid restructuring of atmospheric circulation in the Northern Hemisphere: the intrusions of Arctic air masses onto the oceans decrease and become more frequent over the continents. At the same time, deep convection in the ocean is interrupted, heat fluxes from the ocean to the atmosphere are reduced, weakened cloudiness, and an increase in incoming shortwave solar radiation at the ocean surface are observed. However, the processes of WO AUL heat content recovery, following its thermal discharge, take a long time of 25–35 years, and demonstrate phase changes in the ocean [
8]. The latter can be identified by occasionally performing hydrological observations in informative areas. Thus, the forecast of climatic shifts of the present-day climate can be based on monitoring the multidecadal phase state of the WO AUL heat content.
MOHO represents quasisynchronous planetary changes in the water temperature that can be seen at the near-surface (
Figure 5), intermediate (
Figure 6), and deep (
Figure 7 and
Figure 8) levels. The most important elements of the MOHO are oceanic heat sources, which present large-scale AUL WO cooling centres established in the northern regions of the Atlantic and Pacific, and in each sector of the Southern Ocean. In the Southern Ocean, due to the presence of a warm intermediate layer, water cooling is well-pronounced in the intermediate and deep layers rather than at the surface. Noteworthy are the positive perturbations of water temperature near the western boundaries of the continents, which may occur due to the weakening of upwelling intensity in the phase of the WO AUL thermal discharge.
The structure of MOHO presents a set of observed positive and negative large-scale perturbations of the temperature in the AUL, concerned with the main elements of WO general circulation [
43]. These include the system of currents (Gulf Stream, Kuroshio, Antarctic Circumpolar Current, etc.), zones of divergences (subpolar, northern and southern tropical, Antarctic) and convergence (northern subtropical and tropical, southern subtropical and tropical) of each ocean, and upwellings at the western coasts. Noteworthy is a certain difference in the structure of inhomogeneities in the Atlantic, Pacific, and Indian oceans, which is probably associated not only with the features of the ocean (for example, their stratification) and with the complex distribution of continents, but also with the nature of the WO AUL interaction with the boundary layer of the atmosphere (either the flux from the ocean to the atmosphere or from the atmosphere to the ocean dominates). There is satisfactory agreement between the results of numerical modelling and diagnostic computations based on the reanalysis data of phase disturbances of the near-surface temperature in the Northern Hemisphere [
50].
The phase trajectory of the differences in heat fluxes between the southern and northern regions in the Pacific and Atlantic revealed the links between thermodynamic processes in the two oceans, expressed as a multidecadal cycle with a time scale of at least 20–25 years. Instrumental observations carried out in the ATLANTEX-90 experiment during the thermal discharge phase of the WO AUL (1975–1999) presented an increase in water circulation intensity in the Gulf Stream system, an abnormally high discharge of the North Atlantic current, the intensification of transfrontal exchange, and the development of deep convection [
23].
The analysis of WO temperature perturbation maps corresponding to the climatic phases periods of 1948–1974 and 1975–1999 (
Figure 5,
Figure 6 and
Figure 7) allows for us to draw attention to the specific features of the MOHO structure, characterised by the intensification of convergence in the centres of the northern and southern anticyclonic gyres of the Atlantic. This is expressed in the formation of positive anomalies in the heat content of tropical waters in the upper 600m layer. At the same time, an opposite tendency is seen in the Pacific: the convergence in the centres of the corresponding gyres is weakening, which in turn is expressed in a reduction in the heat content of the tropical waters of the basin. This is consistent with the diagnostic computations performed before. The analysis of the long-term time series (1961–1993) of the annual mean surface temperature and heat fluxes in the northern parts of the Atlantic and Pacific found that the time series of the differences in heat fluxes between the equatorial and middle latitudes in the Pacific and Atlantic is in an antiphase. Variability in the temperature fields in the North Atlantic region presented in our analysis agreed with the results of the recent studies on the dynamics of the Atlantic multidecadal oscillation (AMO) [
51].
There are centres of water cooling along the Antarctic shelf and at the edge of the continental slope that obviously correspond to the location of the sources of the generation of bottom Antarctic water. An opportunity arises to test the hypothesis regarding the presence of climatic phases with an intensive formation of the bottom water in 1975–1999 and of climatic phases with a significant weakening of this process. Earlier studies showed that Antarctic bottom waters approach the Vema Channel connecting the Argentine and Brazilian bottom basins by a chain of mesoscale eddies [
52]. The velocity of the current during the passage of eddies through the channel at the depth of 4150 m significantly increases to up to 66 cm/s, and the water temperature decreases by 0.1 °C [
53].
The mechanism of contemporary climate variability, an important feature of which is its observed rhythm, is realised as follows. The propagation of Arctic air masses during the 1975–1999 phase to warm North Atlantic and North Pacific waters results in the intensification of the heat exchange between the ocean and the atmosphere, the generation of cyclones in the atmosphere, and an increase in the western transport of warm and humid air masses to the Eurasian and North American continents. With a strong long-term exchange of heat and moisture between the ocean and the atmosphere, deep convection develops in the area of the heat source in the ocean, which increases the thickness of the layer interacting with the atmosphere in the ocean. Significant clouds develop over the area of intense heat exchange, reducing the flux of shortwave solar radiation at the ocean surface. This does not compensate for the observed heat losses (experiments MEGAPOLIGON and ATLANTEX-90). Over the continents, a phase of relatively humid climate occurs. The long-term process of the ocean cooling, on the one hand, and an increase in the interaction layer in the ocean, on the other hand, entail the weakening of cyclogenesis in the atmosphere and, as a consequence, its interruption. At the same time, these processes also entail the interruption of deep convection and a decrease in cloudiness. The ocean is entering a phase of the recovery of its initial AUL heat content, which takes several decades. On the continents, a phase of a drier climate is established. After the AUL returns to its initial thermal state, the ocean would again be capable of its next thermal discharge.
5. Conclusions
The evolution of the WO heat content indicates the presence of two modes of variability, one representing the processes in the AUL within 0–1000 m depth, and the other the deeper ocean within 1000–5500 m. The multidecadal perturbations of the ocean AUL heat content characterise a quasisynchronous relationship with atmospheric variability on the corresponding time scales. This allows for understanding that the observed features of the present-day climate are due to intrasystem (ocean–atmosphere–continent) processes of heat redistribution, the source of which is the WO AUL.
The observed multidecadal phase variability of the present-day climate is characterised by a certain rhythm, and realised with the participation of the two planetary structures, the MOHO and GAO. A separate rhythm of the climate lasts about 60 years and consists of two phases of 25–35 years that are qualitatively different: one is relatively humid, and the other is essentially continental. The interphase transition is determined by an abrupt change in the current climate and is perceived as a climatic shift. The forecast of this shift is possible and extremely important. The source of multidecadal phase climatic variability is the WO AUL heat content. The work shows that MOHO is a structure with large-scale foci of quasisynchronous cooling of waters in the north of the Atlantic and Pacific Oceans, and in the Southern Ocean, with heat sources that occasionally initiate an intensification of the westerly transport of warm and humid air masses from the ocean to the continents, changing the climate of the latter. The discovery of such structures as MOHO and GAO allows for revising and relating a number of important experimental results obtained in the framework of experimental field studies and during the Razrezy programme (“Sections”).
The mechanism of the contemporary climate variability, an important feature of which is its observed rhythm, is realized as follows. The propagation of Arctic air masses during the 1975–1999 phase to warm North Atlantic and North Pacific waters results in intensification of the heat exchange between the ocean and the atmosphere, generation of cyclones in the atmosphere, and an increase in the western transport of warm and humid air masses to the Eurasian and North American continents. With a significant and long-term exchange of heat and moisture between the ocean and the atmosphere, deep convection develops in the area of the heat source in the ocean, which increases the thickness of the layer interacting with the atmosphere in the ocean. Significant clouds develop over the area of intense heat exchange, which reduce the flux of short-wave solar radiation at the ocean surface. It does not compensate for the observed heat losses (experiments MEGAPOLIGON and ATLANTEX-90). Over the continents, a phase of relatively humid climate occurs. The long-term process of the ocean cooling, on the one hand, and an increase in the interaction layer in the ocean, on the other hand, entail weakening of cyclogenesis in the atmosphere and, as a consequence, its interruption. At the same time, these processes also entail the interruption of deep convection and decrease of cloudiness. The ocean is entering a phase of recovery of its initial AUL heat content, which takes several decades. On the continents, a phase of a more dry climate is established. After the AUL returns to its initial thermal state, the ocean is again capable of its next thermal discharge.
In conclusion, the perception of the planetary oceanic oscillation MOHO is complicated due to both the dissection of the World Ocean and the absence (
Figure 1 and
Figure 2) of a MOHO signal in the upper mixed layer (0–100 m).


