
Geologic Framework, Anthropogenic Impacts, and Hydrodynamics Contribute to Variable Sediment Availability and Shoreface Morphology at the Rockaway Peninsula, NY


Abstract
:1. Introduction
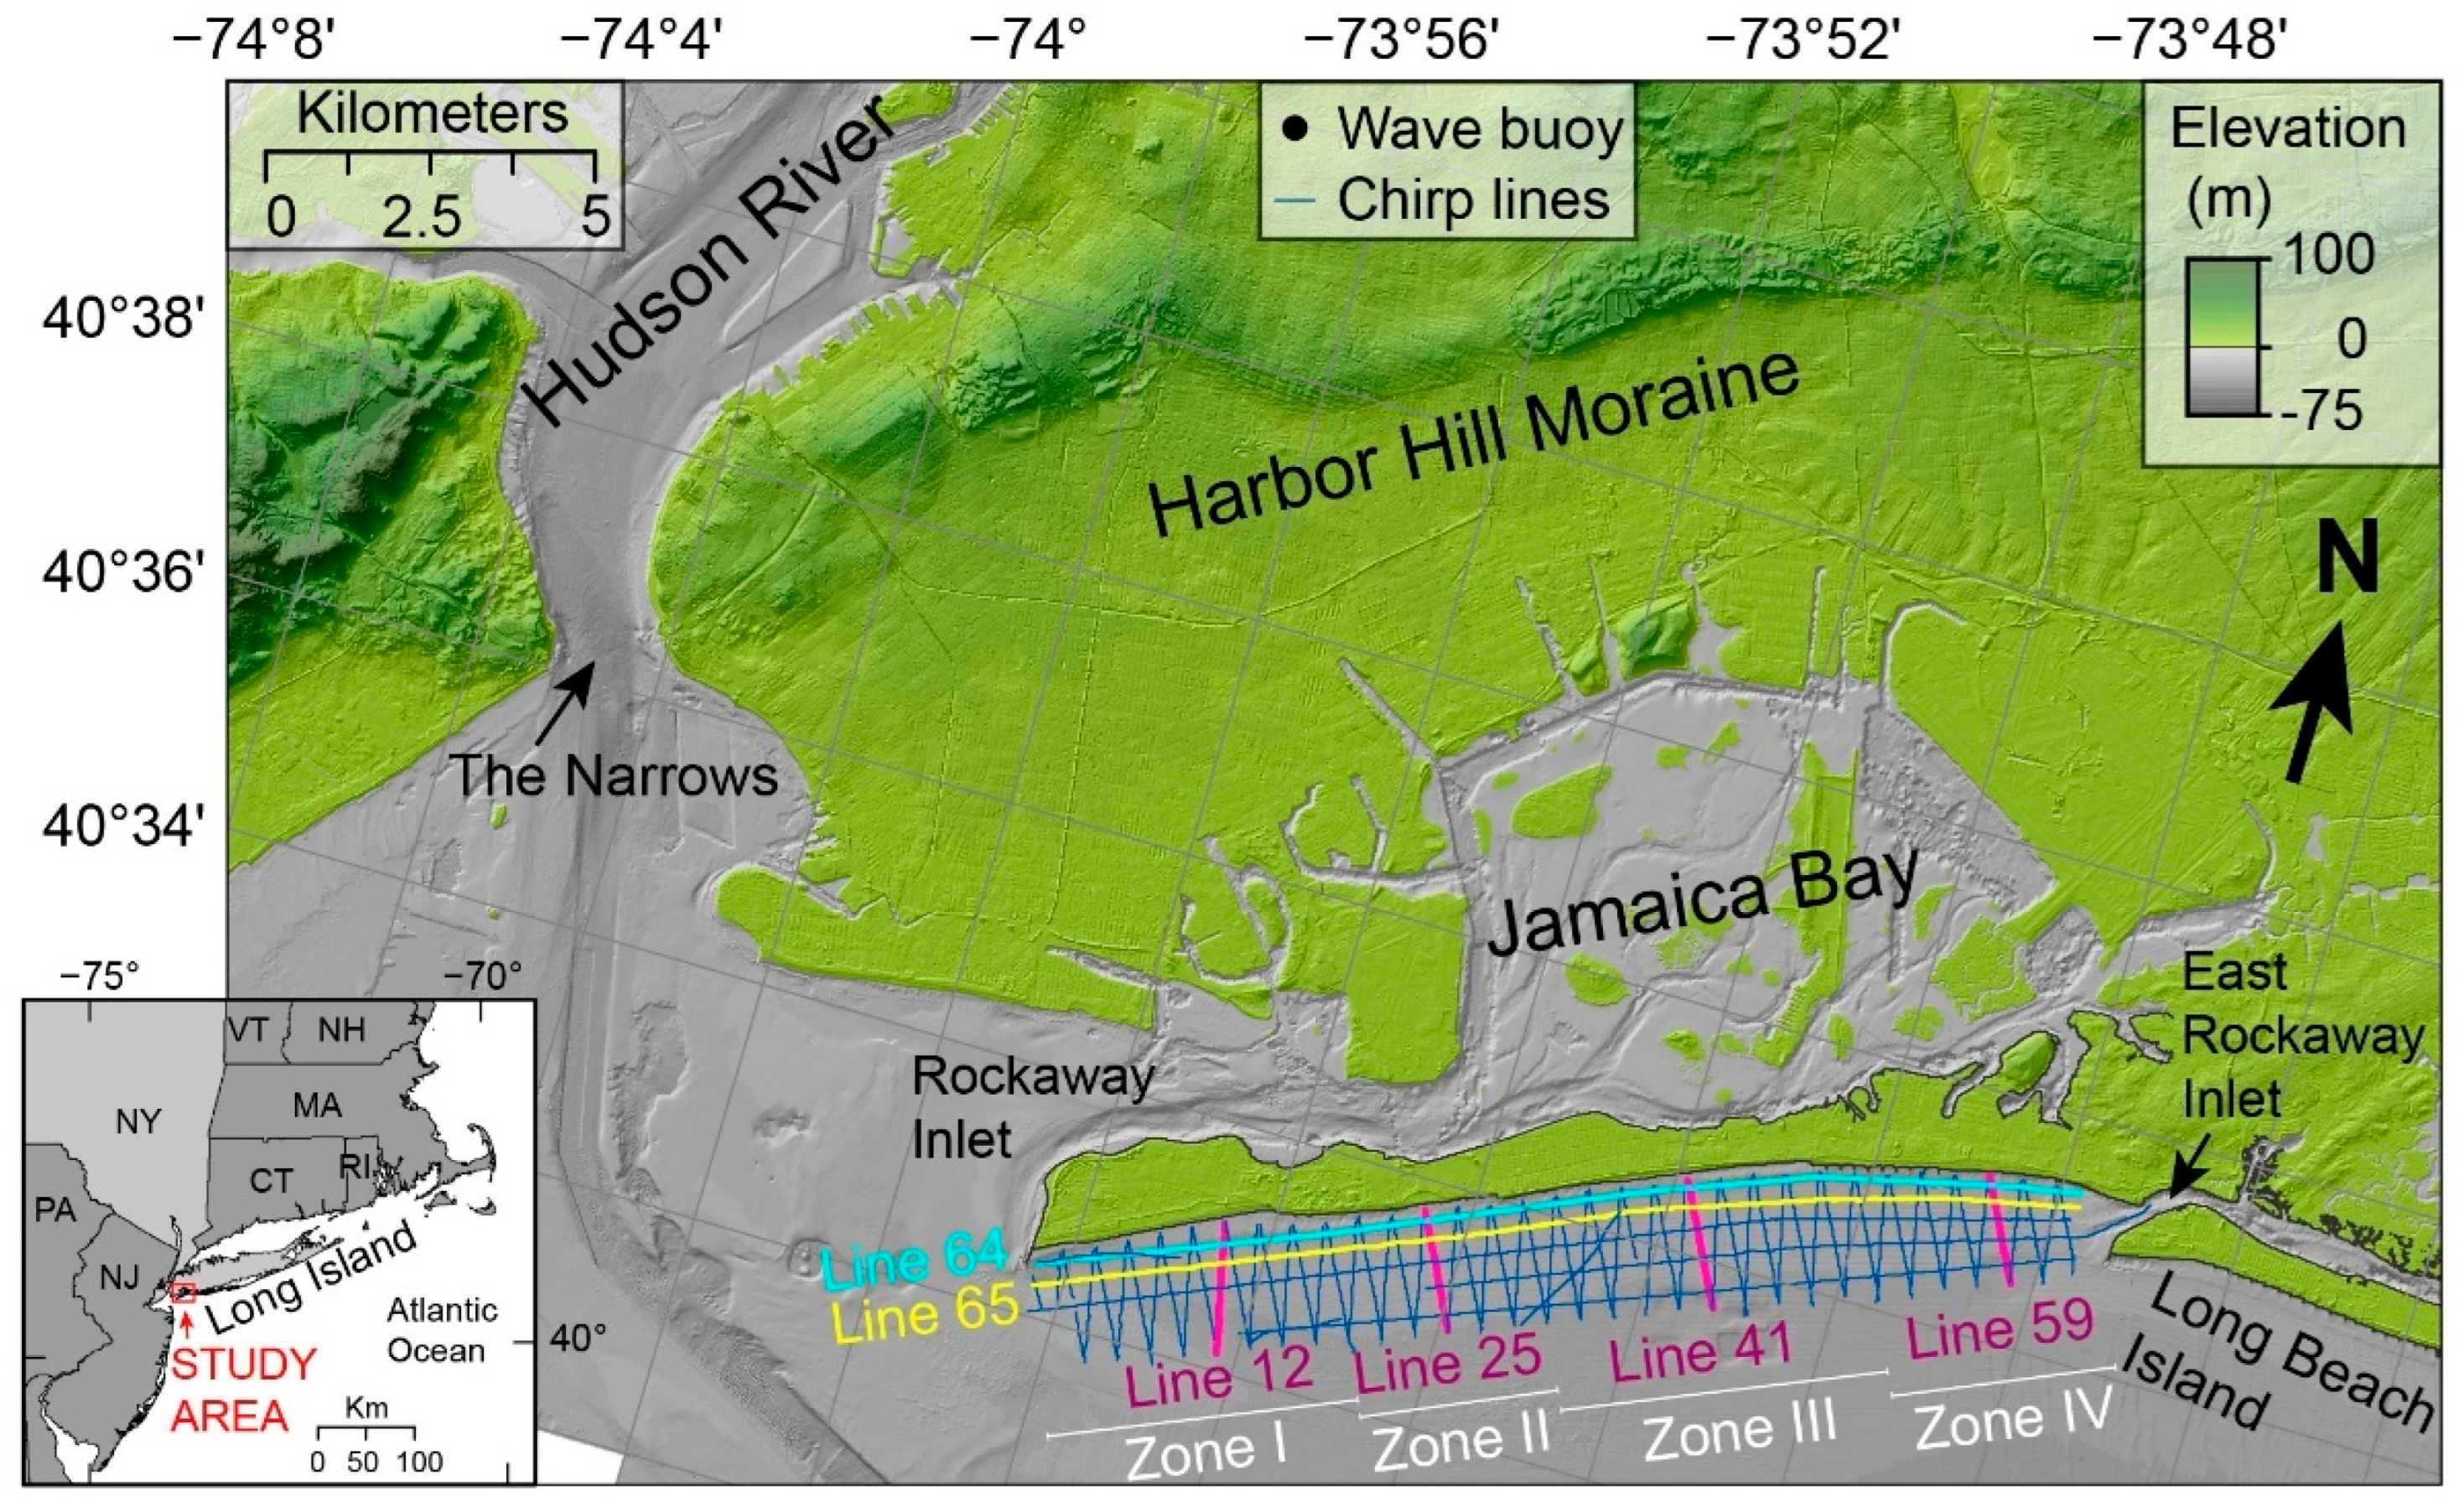
2. Study Area
3. Data Acquisition and Processing
4. Results
4.1. Seafloor Morphology and Texture
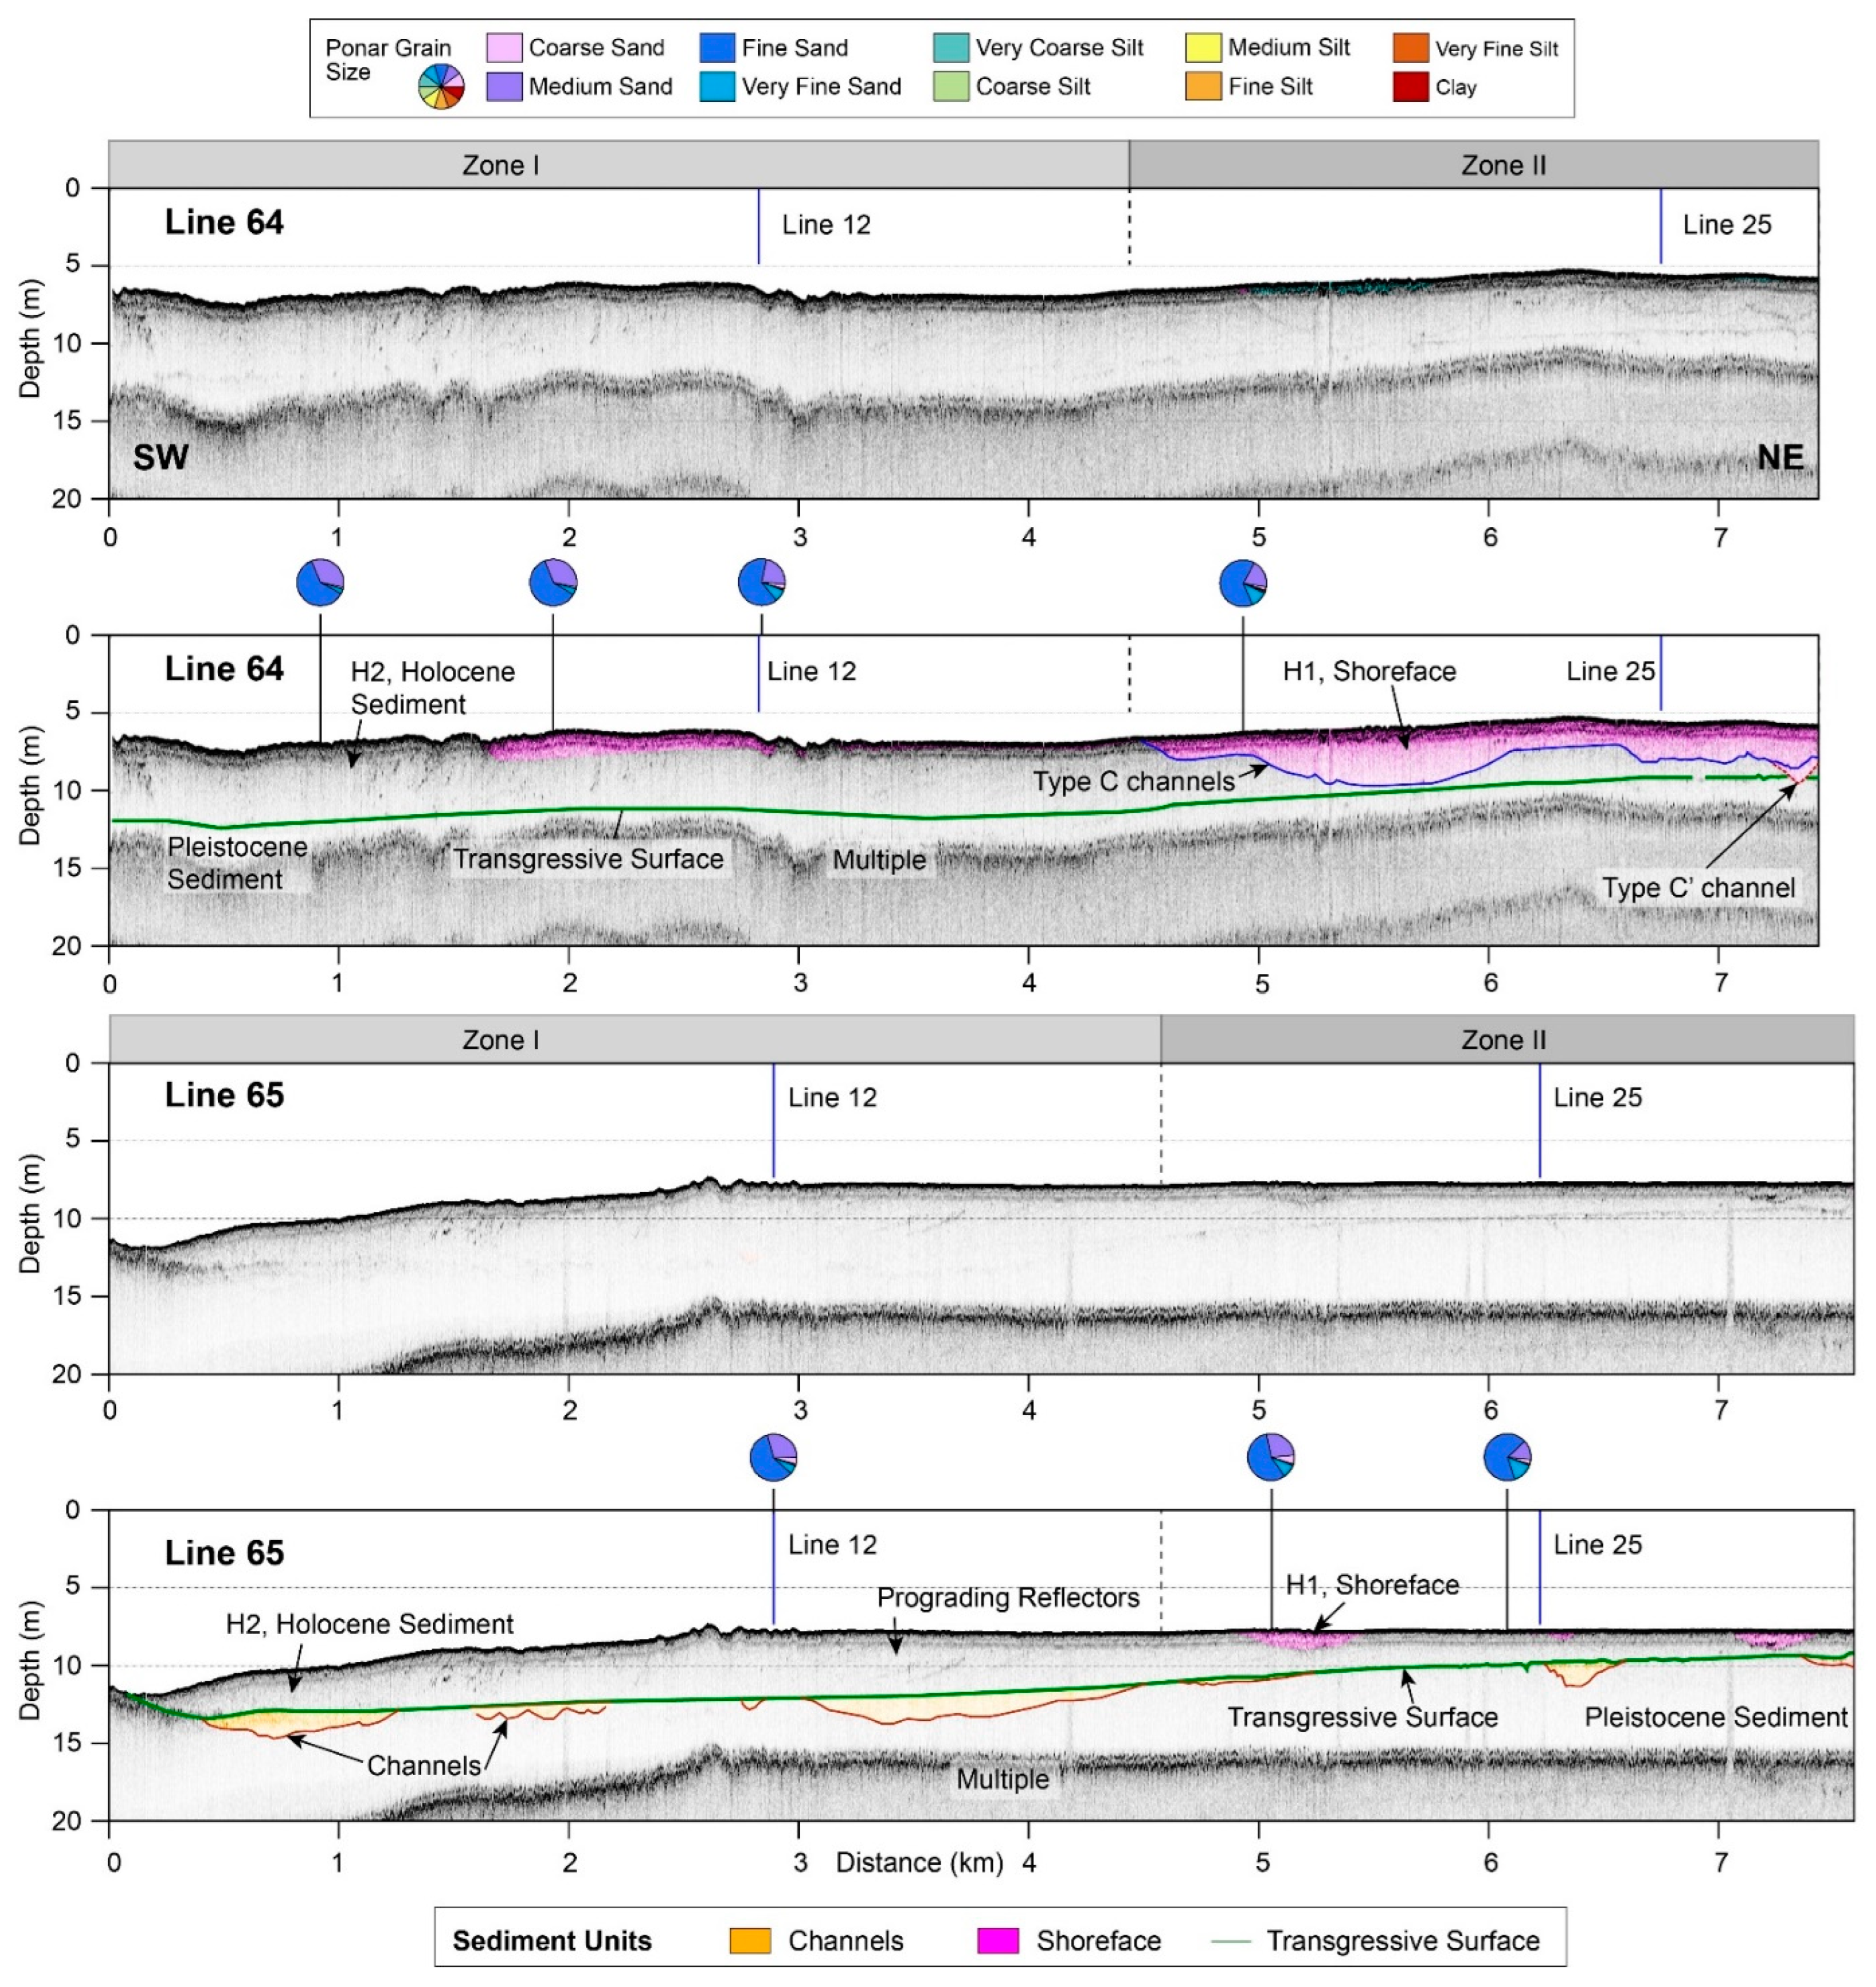
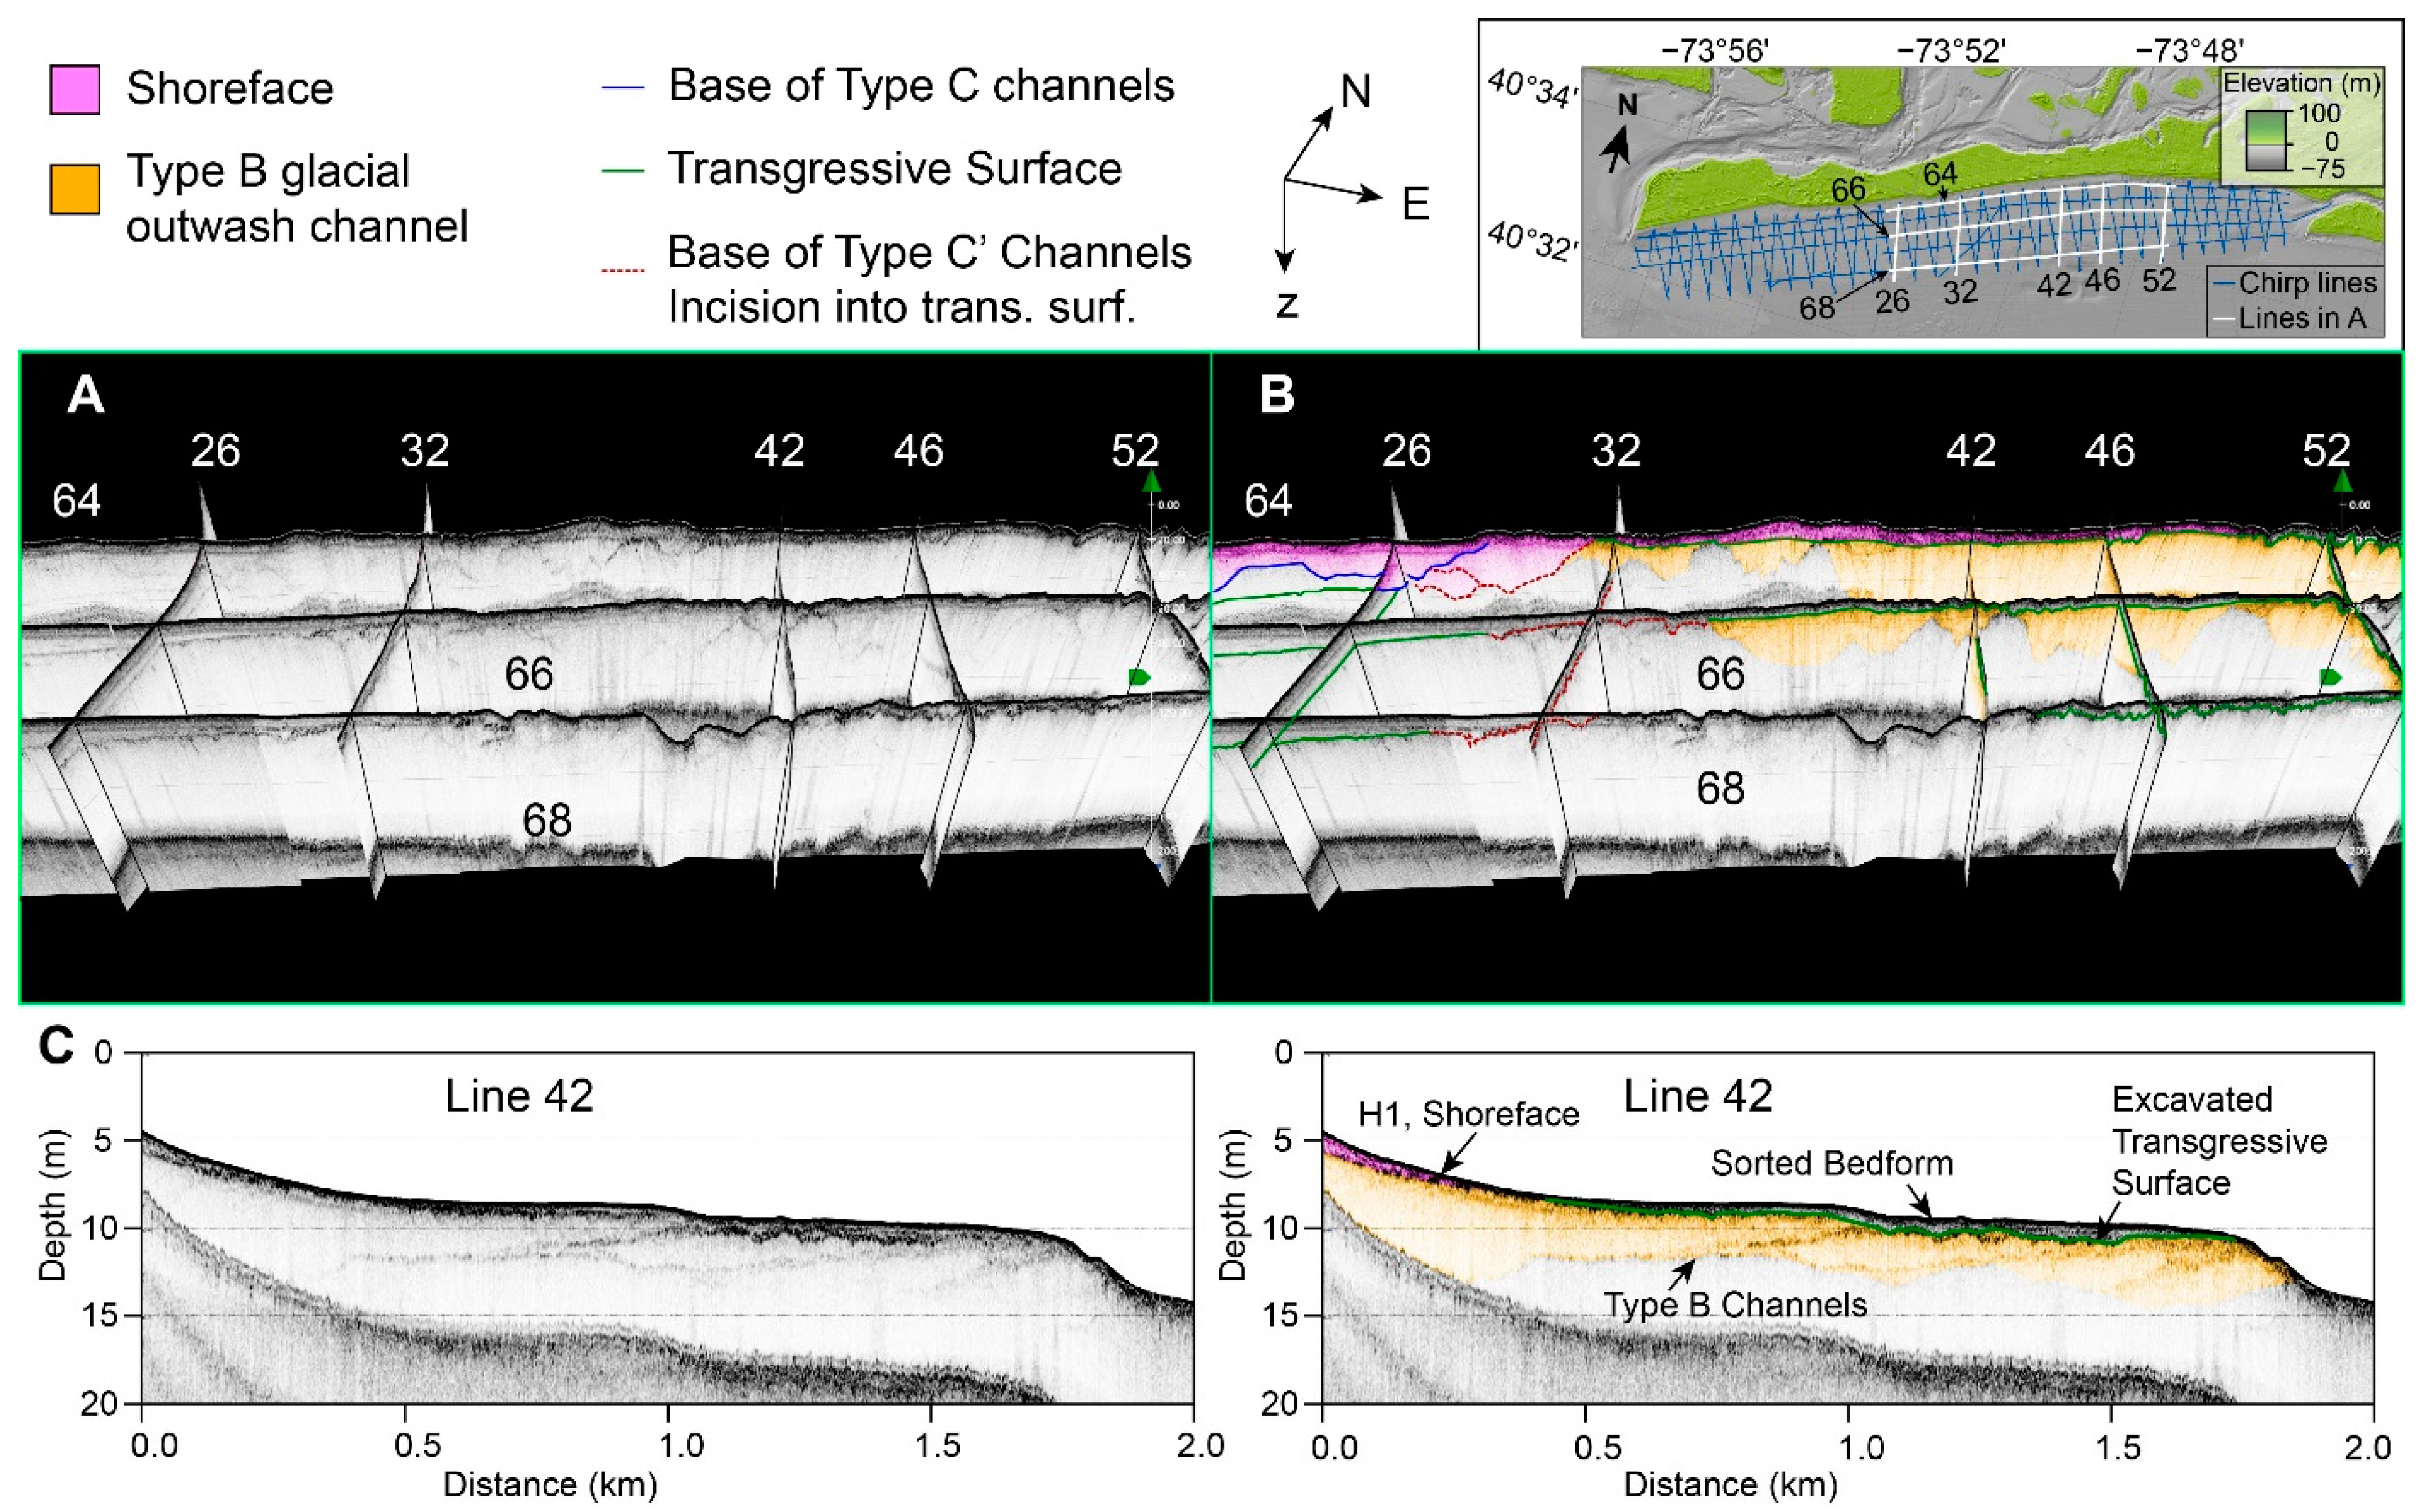
4.2. Seismic Stratigraphic Framework
4.2.1. Regional Unconformity
4.2.2. Sub-Seafloor Channels
4.2.3. Upper Unit and Shoreface Stratigraphy
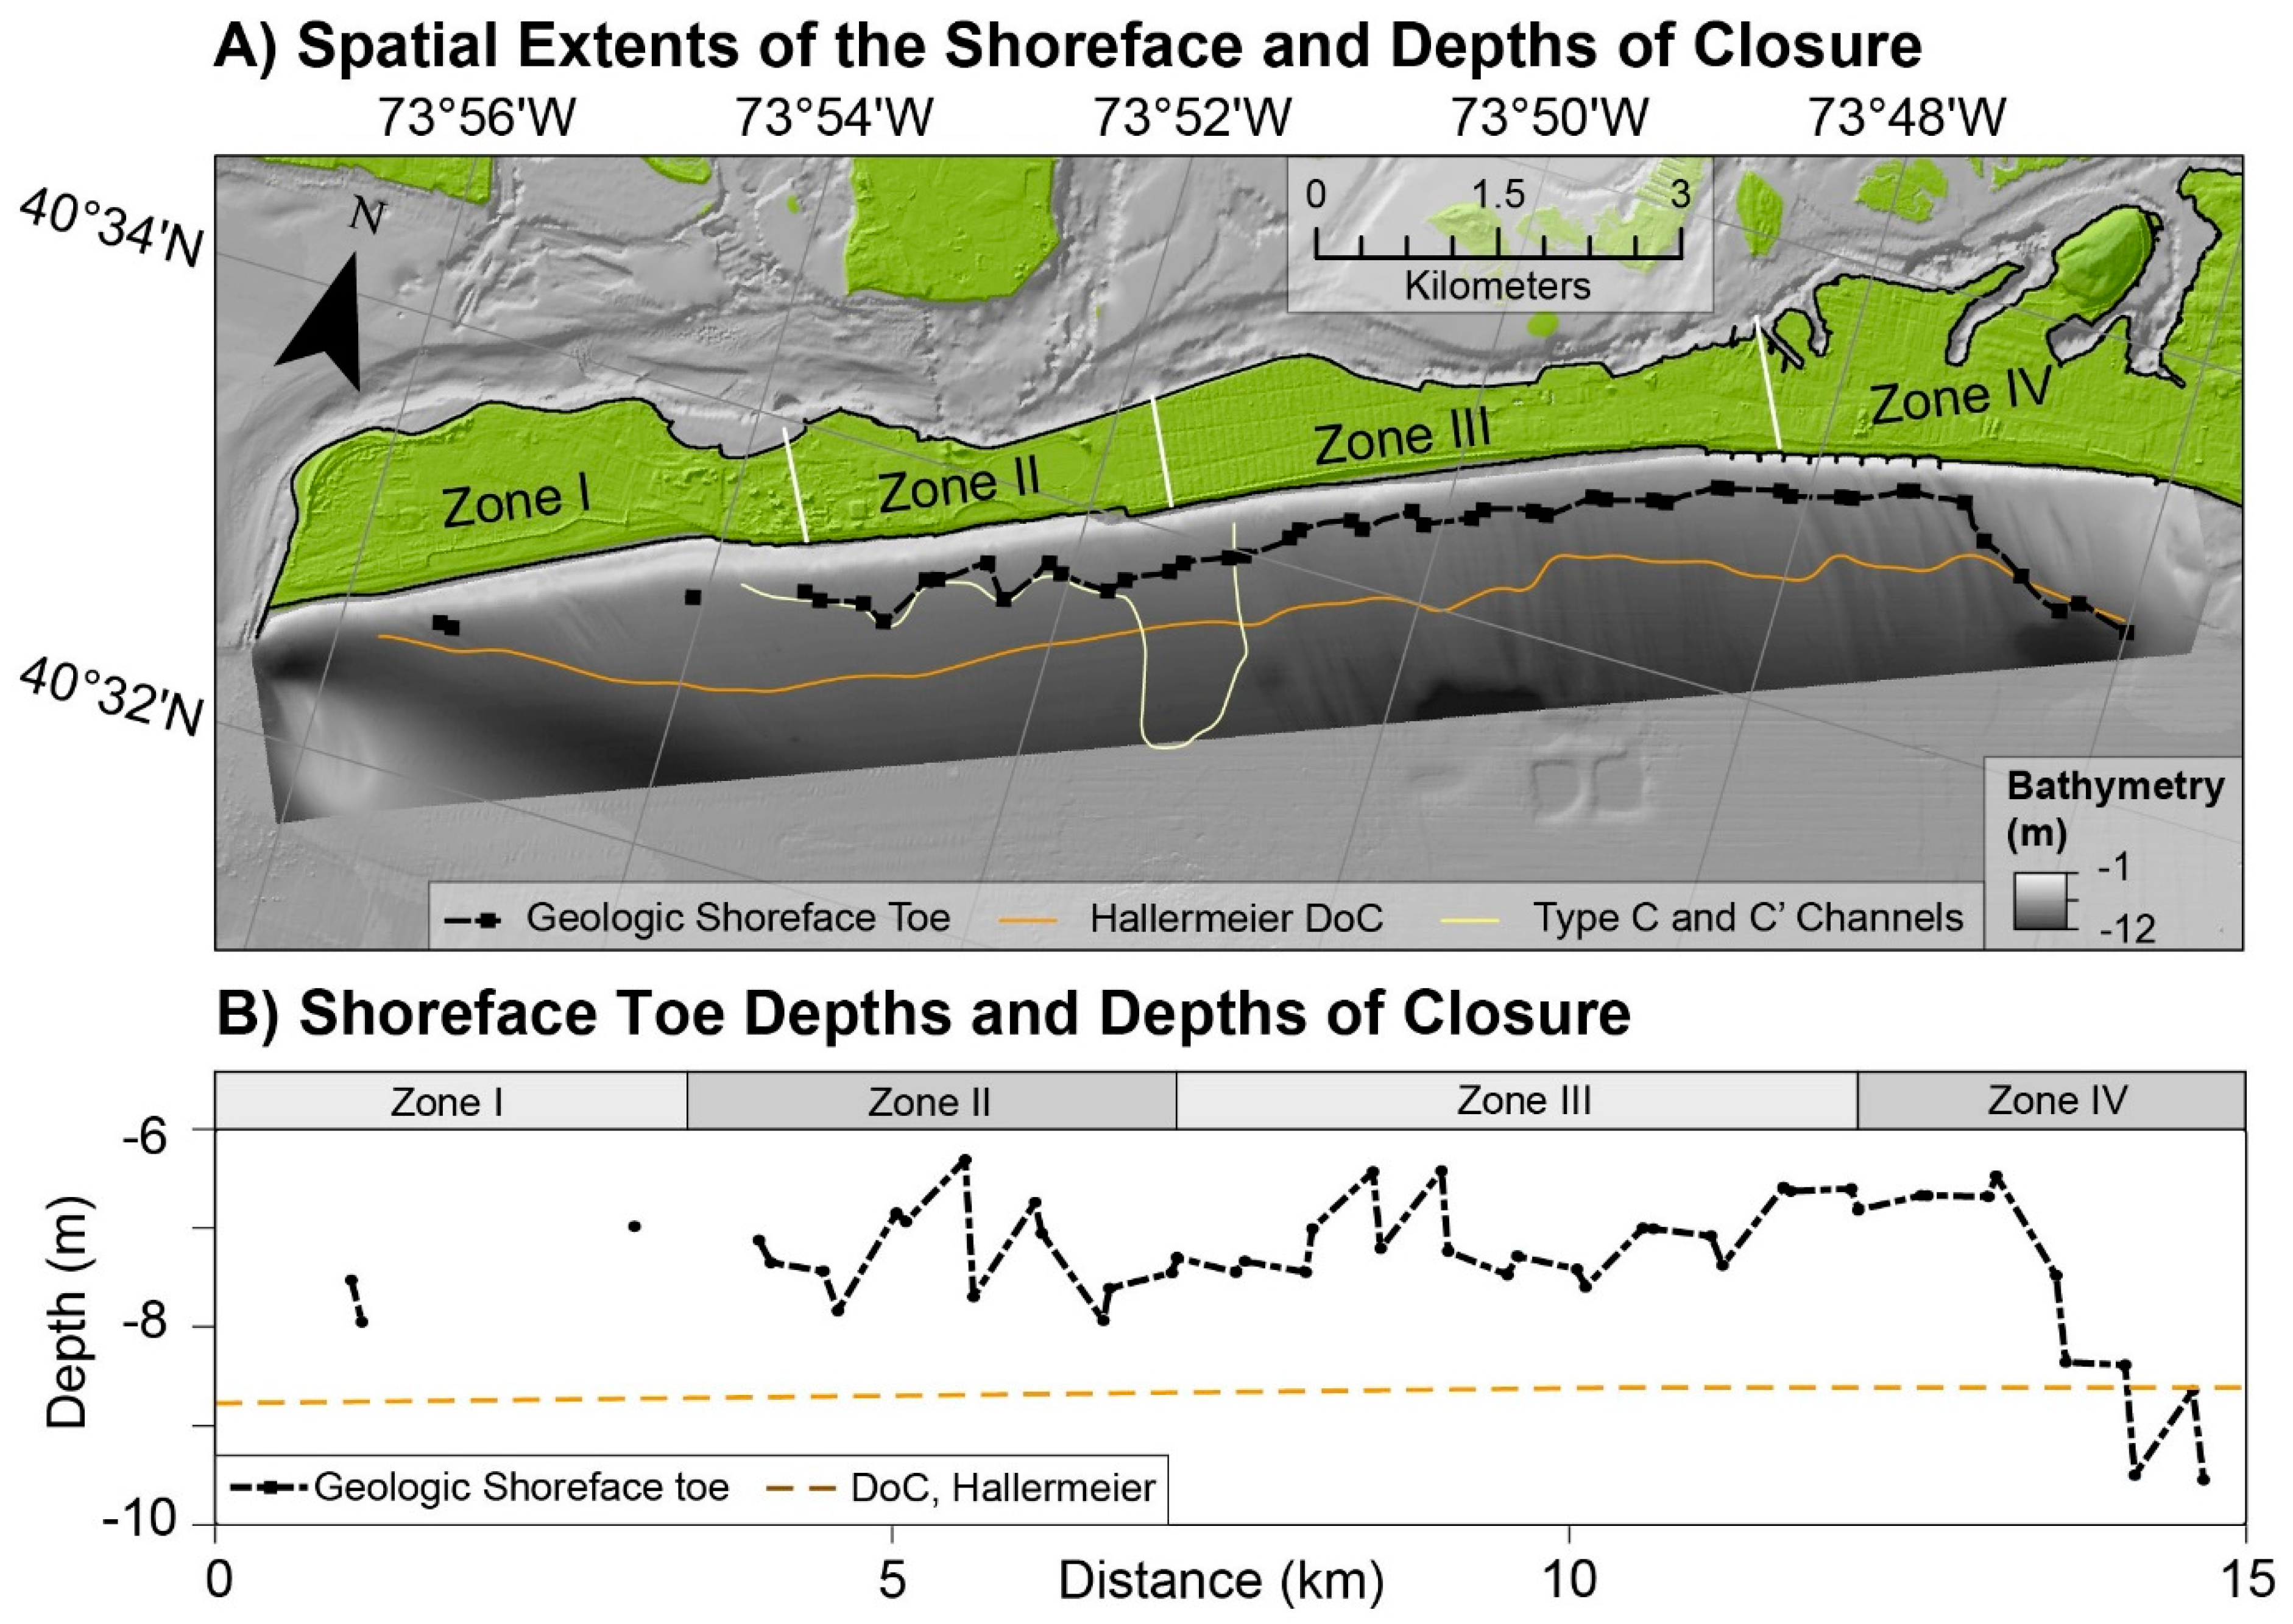
4.3. The Geologic Shoreface Toe and Comparisons to Other Estimates of Shoreface Extent
5. Discussion
5.1. Stratigraphic Interpretations
5.2. Shoreface Sediment Availability and Implications for Cross-Shore Sediment Fluxes
5.3. Geologic Shoreface Toe and Comparison to Depth of Closure
6. Conclusions
- Observed shoreface stratigraphy varies over small spatial scales (0.5–3 km). Accommodation, historical barrier island evolution, and natural and human morphologic features all affect shoreface sediment availability, with the relative influence of any one factor varying along margin.
- Variability in the Holocene-Pleistocene (H-P) boundary elevation limits the distribution of sediment across the shoreface, likely influencing sediment fluxes from the lower to upper shoreface and beach.
- Comparisons between the offshore limit of the shoreface as defined by the GST and the empirically derived depth of closure suggest that the geologically defined shoreface is actively being reworked over very short time scales (years to decades).
- The influence of human beach modifications extends seaward into the upper shoreface and may promote increased steepness of the upper shoreface and seaward-directed sediment fluxes.
Author Contributions
Funding
Institutional Review Board Statement
Informed Consent Statement
Data Availability Statement
Acknowledgments
Conflicts of Interest
References
- Timmons, E.A.; Rodriguez, A.B.; Mattheus, C.R.; DeWitt, R. Transition of a regressive to a transgressive barrier island due to back-barrier erosion, increased storminess, and low sediment supply: Bogue Banks, North Carolina, USA. Mar. Geol. 2010, 78, 100–114. [Google Scholar] [CrossRef]
- Psuty, N.P.; Silveira, T.M. Global climate change: An opportunity for coastal dunes?? J. Coast. Conserv. 2010, 14, 153–160. [Google Scholar] [CrossRef]
- Miselis, J.L.; McNinch, J.E. Calculating shoreline erosion potential using nearshore stratigraphy and sediment volume: Outer Banks, North Carolina. J. Geophys. Res. Earth Surface 2006, 111, 1–15. [Google Scholar] [CrossRef] [Green Version]
- McNinch, J.E.; Miselis, J.L. Geology metrics for predicting shoreline change using seabed and sub-bottom observations from the surf zone and nearshore. In Sediments, Morphology and Sedimentary Processes on Continental Shelves: Special Publication; Li, M.Z., Sherwood, C.R., Hill, P.R., Eds.; Wiley-Blackwell: West Sussex, UK, 2012; Volume 44, pp. 99–120. [Google Scholar]
- Schwab, W.C.; Baldwin, W.E.; Denny, J.F.; Hapke, C.J.; Gayes, P.T.; List, J.H.; Warner, J.C. Modification of the Quaternary stratigraphic framework of the inner-continental shelf by Holocene marine transgression: An example offshore of Fire Island, New York. Mar. Geol. 2014, 355, 346–360. [Google Scholar] [CrossRef] [Green Version]
- Valiente, N.G.; Masselink, G.; Scott, T.; Conley, D.; McCarroll, R.J. Role of waves and tides on depth of closure and potential for headland bypassing. Mar. Geol. 2019, 407, 60–75. [Google Scholar] [CrossRef]
- Cowell, P.J.; Stive, M.J.; Niedoroda, A.; Swift, D.J.P. The coastal-tract (part 2): Applications of aggregated modeling of lower-order coastal change. J. Coast. Res. 2003, 19, 828–848. [Google Scholar]
- Schwab, W.C.; Baldwin, W.E.; Hapke, C.J.; Lentz, E.E.; Gayes, P.T.; Denny, J.F.; List, J.H.; Warner, J.C. Geologic evidence for onshore sediment transport from the inner continental shelf: Fire Island, New York. J. Coast. Res. 2013, 29, 526–544. [Google Scholar] [CrossRef]
- Sallenger, A.H., Jr. Storm impact scale for barrier islands. J. Coast. Res. 2000, 16, 890–895. [Google Scholar]
- Cowell, P.J.; Kinsela, M.A. Shoreface controls on barrier evolution and shoreline change. In Barrier Dynamics and Response to Changing Climate; Moore, L.J., Murray, A.B., Eds.; Springer: Cham, Germany, 2018; pp. 243–275. [Google Scholar]
- Kinsela, M.A.; Hanslow, D.J.; Carvalho, R.C.; Linklater, M.; Ingleton, T.C.; Morris, B.D.; Allen, K.M.; Sutherland, M.D.; Woodroffe, C.D. Mapping the shoreface of coastal sediment compartments to improve shoreline change forecasts in New South Wales, Australia. Estuaries Coast. 2020, 45, 1143–1169. [Google Scholar] [CrossRef]
- Stockdon, H.F.; Holman, R.A.; Howd, P.A.; Sallenger, A.H., Jr. Empirical parameterization of setup, swash, and runup. Coast. Eng. 2006, 53, 573–588. [Google Scholar] [CrossRef]
- Brenner, O.T.; Moore, L.J.; Murray, A.B. The complex influences of back-barrier deposition, substrate slope and underlying stratigraphy in barrier island response to sea-level rise: Insights from the Virginia Barrier Islands, Mid-Atlantic Bight, USA. Geomorphology 2015, 246, 334–350. [Google Scholar] [CrossRef]
- Moore, L.J.; List, J.H.; Williams, S.J.; Stolper, D. Complexities in barrier island response to sea level rise: Insights from numerical model experiments, North Carolina Outer Banks. J. Geophys. Res. Earth Surf. 2010, 115, F03004. [Google Scholar] [CrossRef] [Green Version]
- Lorenzo-Trueba, J.; Ashton, A.D. Rollover, drowning, and discontinuous retreat: Distinct modes of barrier response to sea-level rise arising from a simple morphodynamic model. J. Geophys. Res. Earth Surf. 2014, 119, 779–801. [Google Scholar] [CrossRef] [Green Version]
- Ciarletta, D.J.; Miselis, J.L.; Shawler, J.L.; Hein, C.J. Quantifying thresholds of barrier geomorphic change in a cross-shore sediment-partitioning model. Earth Surf. Dynam. 2021, 9, 183–203. [Google Scholar] [CrossRef]
- Riggs, S.R.; Cleary, W.J.; Snyder, S.W. Influence of inherited geologic framework on barrier shoreface morphology and dynamics. Mar. Geol. 1995, 126, 213–234. [Google Scholar] [CrossRef]
- Ashton, A.D.; Lorenzo-Trueba, J. Morphodynamics of barrier response to sea-level rise. In Barrier Dynamics and Response to Changing Climate; Moore, L.J., Murray, A.B., Eds.; Springer: Cham, Germany, 2018; pp. 277–304. [Google Scholar]
- Shawler, J.L.; Ciarletta, D.J.; Connell, J.E.; Boggs, B.Q.; Lorenzo-Trueba, J.; Hein, C.J. Relative influence of antecedent topography and sea-level rise on barrier-island migration. Sedimentology 2021, 68, 639–669. [Google Scholar] [CrossRef]
- Ortiz, A.C.; Ashton, A.D. Exploring shoreface dynamics and a mechanistic explanation for a morphodynamic depth of closure. J. Geophys. Res. Earth Surf. 2016, 121, 442–464. [Google Scholar] [CrossRef]
- Rogers, L.J.; Moore, L.J.; Goldstein, E.B.; Hein, C.J.; Lorenzo-Trueba, J.; Ashton, A.D. Anthropogenic controls on overwash deposition: Evidence and consequences. J. Geophys. Res. Earth Surf. 2015, 120, 2609–2624. [Google Scholar] [CrossRef] [Green Version]
- Miselis, J.L.; Lorenzo-Trueba, J. Natural and human-induced variability in barrier-island response to sea level rise. Geophys. Res. Lett. 2017, 44, 11–922. [Google Scholar] [CrossRef] [Green Version]
- Thieler, E.; Brill, A.L.; Cleary, W.J.; Hobbs, C.H.; Gammisch, R.A. Geology of the Wrightsville Beach, North Carolina shoreface: Implications for the concept of shoreface profile of equilibrium. Mar. Geol. 1995, 126, 271–287. [Google Scholar] [CrossRef]
- Wallace, D.J.; Anderson, J.B.; Fernández, R.A. Transgressive ravinement versus depth of closure: A geological perspective from the upper Texas coast. J. Coast. Res. 2010, 26, 1057–1067. [Google Scholar] [CrossRef]
- Wernette, P.; Houser, C.; Weymer, B.A.; Everett, M.E.; Bishop, M.P.; Reece, B. Influence of a spatially complex framework geology on barrier island geomorphology. Mar. Geol. 2018, 398, 151–162. [Google Scholar] [CrossRef]
- Bitencourt, V.J.; Dillenburg, S.R. Application of multivariate statistical techniques in alongshore differentiation of coastal barriers. Mar. Geol. 2020, 419, 106077. [Google Scholar] [CrossRef]
- Demarest, J.M.; Leatherman, S.P. Mainland influence on coastal transgression: Delmarva Peninsula. Mar. Geol. 1985, 63, 19–33. [Google Scholar] [CrossRef]
- Browder, A.G.; McNinch, J.E. Linking framework geology and nearshore morphology: Correlation of paleo-channels with shore-oblique sandbars and gravel outcrops. Mar. Geol. 2006, 231, 141–162. [Google Scholar] [CrossRef] [Green Version]
- Honeycutt, M.G.; Krantz, D.E. Influence of the geologic framework on spatial variability in long-term shoreline change, Cape Henlopen to Rehoboth Beach, Delaware. J. Coast. Res. 2003, 147–167. Available online: https://www.jstor.org/stable/25736604 (accessed on 22 October 2020).
- Pilkey, O.H.; Young, R.S.; Riggs, S.R.; Smith, A.S.; Wu, H.; Pilkey, W.D. The concept of shoreface profile of equilibrium: A critical review. J. Coast. Res. 1993, 9, 255–278. [Google Scholar]
- Houser, C.; Hapke, C.; Hamilton, S. Controls on coastal dune morphology, shoreline erosion and barrier island response to extreme storms. Geomorphology 2008, 100, 223–240. [Google Scholar] [CrossRef]
- Taney, N.E. Geomorphology of the South Shore of Long Island, New York; US Beach Erosion Board: Washington, DC, USA, 1961; No. 128. [Google Scholar]
- Stone, B.D.; Borns, H.W., Jr. Pleistocene glacial and interglacial stratigraphy of New England, Long Island, and adjacent Georges Bank and Gulf of Maine. Quat. Sci. Rev. 1986, 5, 39–52. [Google Scholar] [CrossRef]
- Williams, S.J. Geomorphology, Shallow Subbottom Structure and Sediments of the Atlantic Inner-Continental Shelf off Long Island, New York; Technical Paper No. 76-2; U.S. Army Corps of Engineers, Ed.; CERC: Fort Belvoir, VA, USA, 1976; p. 123. [Google Scholar]
- Williams, S.J.; Duane, D.B. Geomorphology and Sediments of the Inner New York Bight Continental Shelf; TM-45; U.S Army Corps of Engineers, Coastal Engineering Research Center: Fort Belvoir, VA, USA, 1974; p. 74. [Google Scholar]
- Thompson, H.D. Hudson gorge in the Highlands. Geol. Soc. Am. Bull. 1936, 47, 1831–1848. [Google Scholar] [CrossRef]
- Soren, J. Results of Subsurface Exploration in the Mid-Island Area of Western Suffolk County, Long Island, New York; No. LIWR-1; Suffolk County Water Authority: Oakdale, NY, USA, 1971. [Google Scholar]
- Schwab, W.C.; Allison, M.A. Initial results of high-resolution seafloor mapping offshore of the New York–New Jersey metropolitan area using sidescan-sonar. Northeast. Geol. Environ. Sci. 1997, 19, 243–262. [Google Scholar]
- Foster, D.S.; Swift, B.A.; Schwab, W.C. Stratigraphic Framework Maps of the Nearshore Area of Southern Long Island from Fire Island to Montauk Point, New York; U.S. Geological Survey Open-File Report; USGS: Woods Hole, MA, USA, 1999; pp. 99–559. Available online: http://pubs.usgs.gov/of/1999/of99-559/ (accessed on 22 October 2020).
- Newman, W.S.; Thurber, D.H.; Zeiss, H.S.; Rokach, A.; Musich, L. Late Quaternary geology of the Hudson River estuary: A preliminary report. N. Y. Acad. Sci. Trans. 1969, 31, 548–570. [Google Scholar] [CrossRef]
- Uchupi, E.; Driscoll, N.; Ballard, R.; Bolmer, S. Drainage of late Wisconsin glacial lakes and the morphology and late quaternary stratigraphy of the New Jersey–southern New England continental shelf and slope. Mar. Geol. 2001, 172, 117–145. [Google Scholar] [CrossRef]
- Sanderson, E.W. Cartographic evidence for historical geomorphological change and wetland formation in Jamaica Bay, New York. Northeast. Nat. 2016, 23, 277–304. [Google Scholar] [CrossRef]
- USACE. Atlantic Coast of New York, East Rockaway Inlet to Rockaway Inlet and Jamaica Bay: Draft Integrated Hurricane Sandy General Reevaluation Report and Environmental Impact Statement; Final Report; USACE: Washington, DC, USA, 2016. [Google Scholar]
- USACE. Integrated Hurricane Sandy General Reevaluation Report and Environmental Impact Statement, Atlantic Coast of New York, East Rockaway Inlet to Rockaway Inlet and Jamaica Bay; Final Report; USACE: Washington, DC, USA, 2019. [Google Scholar]
- Hapke, C.J.; Lentz, E.E. A review of sediment budget imbalances along Fire Island, New York—Can nearshore geologic framework and patterns of shoreline change explain the deficit? J. Coast. Res. 2010, 26, 510–522. [Google Scholar] [CrossRef]
- USACE. Integrated Hurricane Sandy General Reevaluation Report and Environmental Impact Statement, Atlantic Coast of New York, East Rockaway Inlet to Rockaway Inlet and Jamaica Bay: Appendix A1 Shorefront Engineering and Design Appendix; USACE: Washington, DC, USA, 2018. [Google Scholar]
- Brutsché, K.E.; Rosati, J.; Pollock, C.E.; McFall, B.C. Calculating Depth of Closure Using WIS Hindcast Data; No. ERDC/CHL CHETN-VI-45; US Army Engineer Research and Development Center Vicksburg United States: Vicksburg, MI, USA, 2016. [Google Scholar]
- Stalk, C.A.; DeWitt, N. Coastal Bathymetry and Backscatter Data Collected in September and October 2019 from Rockaway Peninsula, New York; U.S. Geological Survey Data Release; USGS: St. Petersburg, FL, USA, 2020. [CrossRef]
- Forde, A.S.; Wei, E.A.; DeWitt, N.T.; Miselis, J.L. Archive of Chirp Subbottom Profile Data Collected in 2019 from Rockaway Peninsula, New York; U.S. Geological Survey Data Release; USGS: St. Petersburg, FL, USA, 2021. [CrossRef]
- Cohen, J.K.; Stockwell, J.W., Jr. CWP/SU–Seismic Un*x Release No. 44—An Open Source Software Package for Seismic Research and Processing: Golden, Colo., Center for Wave Phenomena, Colorado School of Mines Web Page. 2020. Available online: https://github.com/JohnWStockwellJr/SeisUnix (accessed on 30 November 2010).
- Mitchum, R.M., Jr.; Vail, P.R.; Sangree, J.B. Seismic Stratigraphy and Global Changes of Sea Level, Part 6: Stratigraphic Interpretation of Seismic Reflection Patterns in Depositional Sequences: Section 2. Application of Seismic Reflection Configuration to Stratigraphic Interpretation; AAPG: Tulsa, OK, USA, 1977. [Google Scholar]
- Christie-Blick, N.; Driscoll, N.W. Sequence stratigraphy. Annu. Rev. Earth Planet. Sci. 1995, 23, 451–478. [Google Scholar] [CrossRef]
- Locker, S.D.; Miselis, J.L.; Buster, N.L.; Hapke, C.J.; Wadman, H.M.; McNinch, J.E.; Forde, A.S.; Stalk, C.A. Nearshore Sediment Thickness, Fire Island, New York; US Geological Survey Open-File Report, No. 2017–1024; USGS: St. Petersburg, FL, USA, 2017; pp. 1–21. Available online: https://pubs.er.usgs.gov/publication/ofr20171024/ (accessed on 31 August 2020).
- Everhart, C.S.; Wei, E.A.; Miselis, J.L. Grain-Size Data from Seven Mile Island, New Jersey and Rockaway Peninsula, New York; U.S. Geological Survey Data Release; USGS: St. Petersburg, FL, USA, 2022. [CrossRef]
- Cacchione, D.A.; Drake, D.E.; Grant, W.D.; Tate, G.B. Rippled scour depressions on the inner continental shelf off central California. J. Sed. Res. 1984, 54, 1280–1291. [Google Scholar]
- Thieler, E.R.; Pilkey, O.H., Jr.; Cleary, W.J.; Schwab, W.C. Modern sedimentation on the shoreface and inner continental shelf at Wrightsville Beach, North Carolina, USA. J. Sed. Res. 2001, 71, 958–970. [Google Scholar] [CrossRef]
- Murray, A.B.; Thieler, E.R. A new hypothesis and exploratory model for the formation of large-scale inner-shelf sediment sorting and “rippled scour depressions”. Cont. Shelf Res. 2004, 24, 295–315. [Google Scholar] [CrossRef]
- Wei, E.A.; Miselis, J.L.; Forde, A.S. Shoreface and Holocene Sediment Thickness Offshore of Rockaway Peninsula, New York; U.S. Geological Survey Open-File Report 2021–1100; USGS: St. Petersburg, FL, USA, 2021. [CrossRef]
- Rodriguez, A.B.; Fassell, M.L.; Anderson, J.B. Variations in shoreface progradation and ravinement along the Texasx coast, Gulf of Mexico. Sedimentology 2001, 48, 837–853. [Google Scholar] [CrossRef]
- Hallermeier, R.J. A profile zonation for seasonal sand beaches from wave climate. Coast. Eng. 1981, 4, 253–277. [Google Scholar] [CrossRef]
- Schwab, W.C.; Thieler, E.R.; Allen, J.R.; Foster, D.S.; Swift, B.A.; Denny, J.F. Influence of inner-continental shelf geologic framework on the evolution and behavior of the barrier-island system between Fire Island Inlet and Shinnecock Inlet, Long Island, New York. J. Coast. Res. 2000, 16, 408–422. [Google Scholar]
- Thieler, E.R.; Foster, D.S.; Himmelstoss, E.A.; Mallinson, D.J. Geologic framework of the northern North Carolina, USA inner continental shelf and its influence on coastal evolution. Mar. Geol. 2014, 348, 113–130. [Google Scholar] [CrossRef]
- Mallinson, D.; Culver, S.; Leorri, E.; Mitra, S.; Mulligan, R.; Riggs, S. Barrier Island and estuary co-evolution in response to Holocene climate and sea-level change: Pamlico Sound and the Outer Banks Barrier Islands, North Carolina, USA. In Barrier Dynamics and Response to Changing Climate; Moore, L.J., Murray, A.B., Eds.; Springer: Cham, Germany, 2018; pp. 91–120. [Google Scholar]
- Raff, J.L.; Shawler, J.L.; Ciarletta, D.J.; Hein, E.A.; Lorenzo-Trueba, J.; Hein, C.J. Insights into barrier-island stability derived from transgressive/regressive state changes of Parramore Island, Virginia. Mar. Geol. 2018, 403, 1–19. [Google Scholar] [CrossRef]
- NOAA Office of Coast Survey. Historical Map and Chart Collection. 2020. Available online: https://historicalcharts.noaa.gov/ (accessed on 4 March 2020).
- Liu, S.; Goff, J.A. Lower shoreface seismic stratigraphy and morphology off Fire Island, New York: Evidence for lobate progradation and linear erosion. Cont. Shelf Res. 2018, 163, 23–34. [Google Scholar] [CrossRef]
- Coch, N.K. Forensic Analysis of the 1893 “New York City” Hurricane: Implications for the Future. J. Coast. Res. 2019, 35, 729–736. [Google Scholar] [CrossRef] [Green Version]
- Cattaneo, A.; Steel, R.J. Transgressive deposits: A review of their variability. Earth-Sci. Rev. 2003, 62, 187–228. [Google Scholar] [CrossRef]
- Backstrom, J.; Jackson, D.; Cooper, J. Shoreface morphodynamics of a high-energy, steep and geologically constrained shoreline segment in Northern Ireland. Mar. Geol. 2009, 257, 94–106. [Google Scholar] [CrossRef]
- Cooper, J.; Kelley, J.; Belknap, D.; Quinn, R.; McKenna, J. Inner shelf seismic stratigraphy off the north coast of Northern Ireland: New data on the depth of the Holocene lowstand. Mar. Geol. 2002, 186, 369–387. [Google Scholar] [CrossRef]
- Siringan, F.P.; Anderson, J.B. Modern shoreface and inner-shelf storm deposits off the east Texas coast, Gulf of Mexico. J. Sed. Res. 1994, 64, 99–110. [Google Scholar]
- Cooper, J.; Green, A.; Loureiro, C. Geological constraints on mesoscale coastal barrier behaviour. Glob. Planet Chang. 2018, 168, 15–34. [Google Scholar] [CrossRef] [Green Version]
- Anthony, E.J.; Aagaard, T. The lower shoreface: Morphodynamics and sediment connectivity with the upper shoreface and beach. Earth Sci. Rev. 2020, 210, 103334. [Google Scholar] [CrossRef]
- Goff, J.A. Seismic and core investigation off Panama city, Florida, reveals sand ridge influence on formation of the shoreface ravinement. Cont. Shelf Res. 2014, 88, 34–46. [Google Scholar] [CrossRef]
- Oakley, B.A.; Murphy, C.; Varney, M.; Hollis, R.J. Spatial extent and volume of the shoreface depositional platform on the upper shoreface of the glaciated Rhode Island south shore. Estuaries Coast. 2019, 45, 1123–1142. [Google Scholar] [CrossRef]
- Goff, J.A.; Flood, R.D.; Austin, J.J.A.; Schwab, W.C.; Christensen, B.; Browne, C.M.; Denny, J.F.; Baldwin, W.E. The impact of Hurricane Sandy on the shoreface and inner shelf of Fire Island, New York: Large bedform migration but limited erosion. Cont. Shelf Res. 2015, 98, 13–25. [Google Scholar] [CrossRef] [Green Version]
- Rodriguez, A.B.; Anderson, J.B.; Bradford, J. Holocene Tidal Deltas of the Trinity Incised Valley: Analogs for Exploration and Production. Gulf. Coast. Assoc. Geol. Soc. Trans. 1998, 48, 373–380. [Google Scholar]
- Driscoll, N.W.; Karner, G.D. Three dimensional quantitative modeling of clinoform development. Mar. Geol. 1999, 154, 383–398. [Google Scholar] [CrossRef]
- Hequette, A.; Desrosiers, M.; Hill, P.R.; Forbes, D.L. The influence of coastal morphology on shoreface sediment transport under storm-combined flows, Canadian Beaufort Sea. J. Coast. Res. 2001, 17, 507–516. [Google Scholar]
- Aagaard, T.; Hughes, M.G. Equilibrium shoreface profiles: A sediment transport approach. Mar. Geol. 2017, 390, 321–330. [Google Scholar] [CrossRef]
- Cowell, P.; Roy, P.; Jones, R. Simulation of large-scale coastal change using a morphological behaviour model. Mar. Geol. 1995, 126, 45–61. [Google Scholar] [CrossRef]
- Robertson, W.; Zhang, K.; Finkl, C.W.; Whitman, D. Hydrodynamic and geologic influence of event-dependent depth of closure along the South Florida Atlantic Coast. Mar. Geol. 2008, 252, 156–165. [Google Scholar] [CrossRef]
- Jackson, D.W.T.; Cooper, J.A.G. Geological control on beach form: Accommodation space and contemporary dynamics. J. Coast. Res. 2009, 56, 69–72. [Google Scholar]


| Zone | Average GST Depth (m) | Average Shoreface Volume (1 × 10³ m3/m) | R2, GST Depth vs. Shoreface Width | R2, GST Depth vs. Shoreface Volume |
|---|---|---|---|---|
| I | 7.39 | 0.62 | 0.29 | 0.0098 |
| II | 7.24 | 1.02 | 0.89 | 0.92 |
| III | 7.14 | 0.38 | 0.76 | 0.028 |
| IV | 7.65 | 1.13 | 0.92 | 0.83 |
| Entire peninsula | 7.45 | 0.73 | 0.83 | 0.63 |
Publisher’s Note: MDPI stays neutral with regard to jurisdictional claims in published maps and institutional affiliations. |
© 2022 by the authors. Licensee MDPI, Basel, Switzerland. This article is an open access article distributed under the terms and conditions of the Creative Commons Attribution (CC BY) license (https://creativecommons.org/licenses/by/4.0/).
Share and Cite
Wei, E.; Miselis, J. Geologic Framework, Anthropogenic Impacts, and Hydrodynamics Contribute to Variable Sediment Availability and Shoreface Morphology at the Rockaway Peninsula, NY. J. Mar. Sci. Eng. 2022, 10, 989. https://doi.org/10.3390/jmse10070989
Wei E, Miselis J. Geologic Framework, Anthropogenic Impacts, and Hydrodynamics Contribute to Variable Sediment Availability and Shoreface Morphology at the Rockaway Peninsula, NY. Journal of Marine Science and Engineering. 2022; 10(7):989. https://doi.org/10.3390/jmse10070989
Chicago/Turabian StyleWei, Emily, and Jennifer Miselis. 2022. "Geologic Framework, Anthropogenic Impacts, and Hydrodynamics Contribute to Variable Sediment Availability and Shoreface Morphology at the Rockaway Peninsula, NY" Journal of Marine Science and Engineering 10, no. 7: 989. https://doi.org/10.3390/jmse10070989