1. Introduction
The counter-wind current in the northeastern South China Sea occurs in the continental shelf and continental slope of the northeastern South China Sea in winter. This is because the direction of the current in winter is opposite to that of the northeast monsoon, the sea surface drifts in the southwest direction when the wind is strong in the northeast, but the current from below the surface to the bottom still flows to the northeast [
1]. A widely held view at present is that the winter counter-wind current in the northern South China Sea is an integral part of the South China Sea warm current, and that the current flows to the northeastern South China Sea all year round and flows to the northeastern South China Sea [
2,
3,
4]. The discovery of the South China Sea warm current shakes the conventional viewpoint that the current in the coastal waters of southeastern China flows southwest due to northeast wind in winter and flows northeast due to northeast wind in summer [
2].
Guan et al. (2006) pointed out that the winter current in the coastal waters of Guangdong is divided into two different current systems with 116° E as the boundary [
5]. They argued that there is a northeastward current in the sea area east of 116° in winter and raised several questions about the South China Sea warm current: (1) Both the barotropic model and the baroclinic model can be used to simulate the northeastward current [
6,
7]. Is the northeastward current primarily caused by barotropic effect or baroclinic effect? (2) Both the climatic monthly mean wind stress field and the climatic wind action can be used to simulate the northeastward current [
6,
8]. Is the northeastward current a climatological phenomenon or a synoptic phenomenon? (3) Is the downstream sea surface slope or the sea surface slope across the continental shelf the controlling factor of the northeastward current [
9,
10]? (4) What is the relationship between the northeastward current and the South China Sea branch of the Kuroshio [
10,
11]?
The dynamic process of winter counter-wind in the northeastern South China Sea has long been controversial. Guo et al. (1985) believed that the South China Sea warm current is an unstable current in time and space [
12]. Li et al. (2014) by analyzing the cross-sectional current observational data of the northern South China Sea collected for years, argued that there was no South China Sea warm current in the continental shelf of the northern South China Sea [
13]. At present, there are five major viewpoints on the causes of the northeastward current in the northeastern South China Sea in winter [
14]): the first viewpoint is that the northeastward current is driven by the pressure gradient force caused by the Kuroshio intrusion on the northern slope of the South China Sea [
15,
16]; the second viewpoint suggests that is that under the action of the northeast monsoon and topography, the sea water accumulation in the sea area east of Hainan Island leads to the difference between the sea level of the continental slope and sea level, resulting in the northeastward current [
6,
10]; the third viewpoint holds that the relaxation of the northeast monsoon is the primary cause of the northeast current [
8,
17]; the fourth viewpoint argues that the surface water convergence and subsidence zone is formed on the northeastern continental slope of the South China Sea in winter, resulting in northward currents in the Taiwan Strait and northeastward currents [
18]; the fifth viewpoint however believes that the pressure gradient across the continental shelf and the geostrophic adaptation of the northern South China Sea are the major causes of northeastward counter-wind current [
4].
At present, the observational studies on the winter counter-wind current in the coastal area of the northeastern South China Sea are mostly based on the observational results of multi-voyage ocean current obtained years ago, which are not rigorous enough in that the observation period is short, the observation data lacks continuity, and there is no long-period wind observation comparison. For the past few years, scholars carried out numerical simulation experiments on counter-wind current under different hypothetical conditions, and there are differences in numerical simulation results [
13,
19,
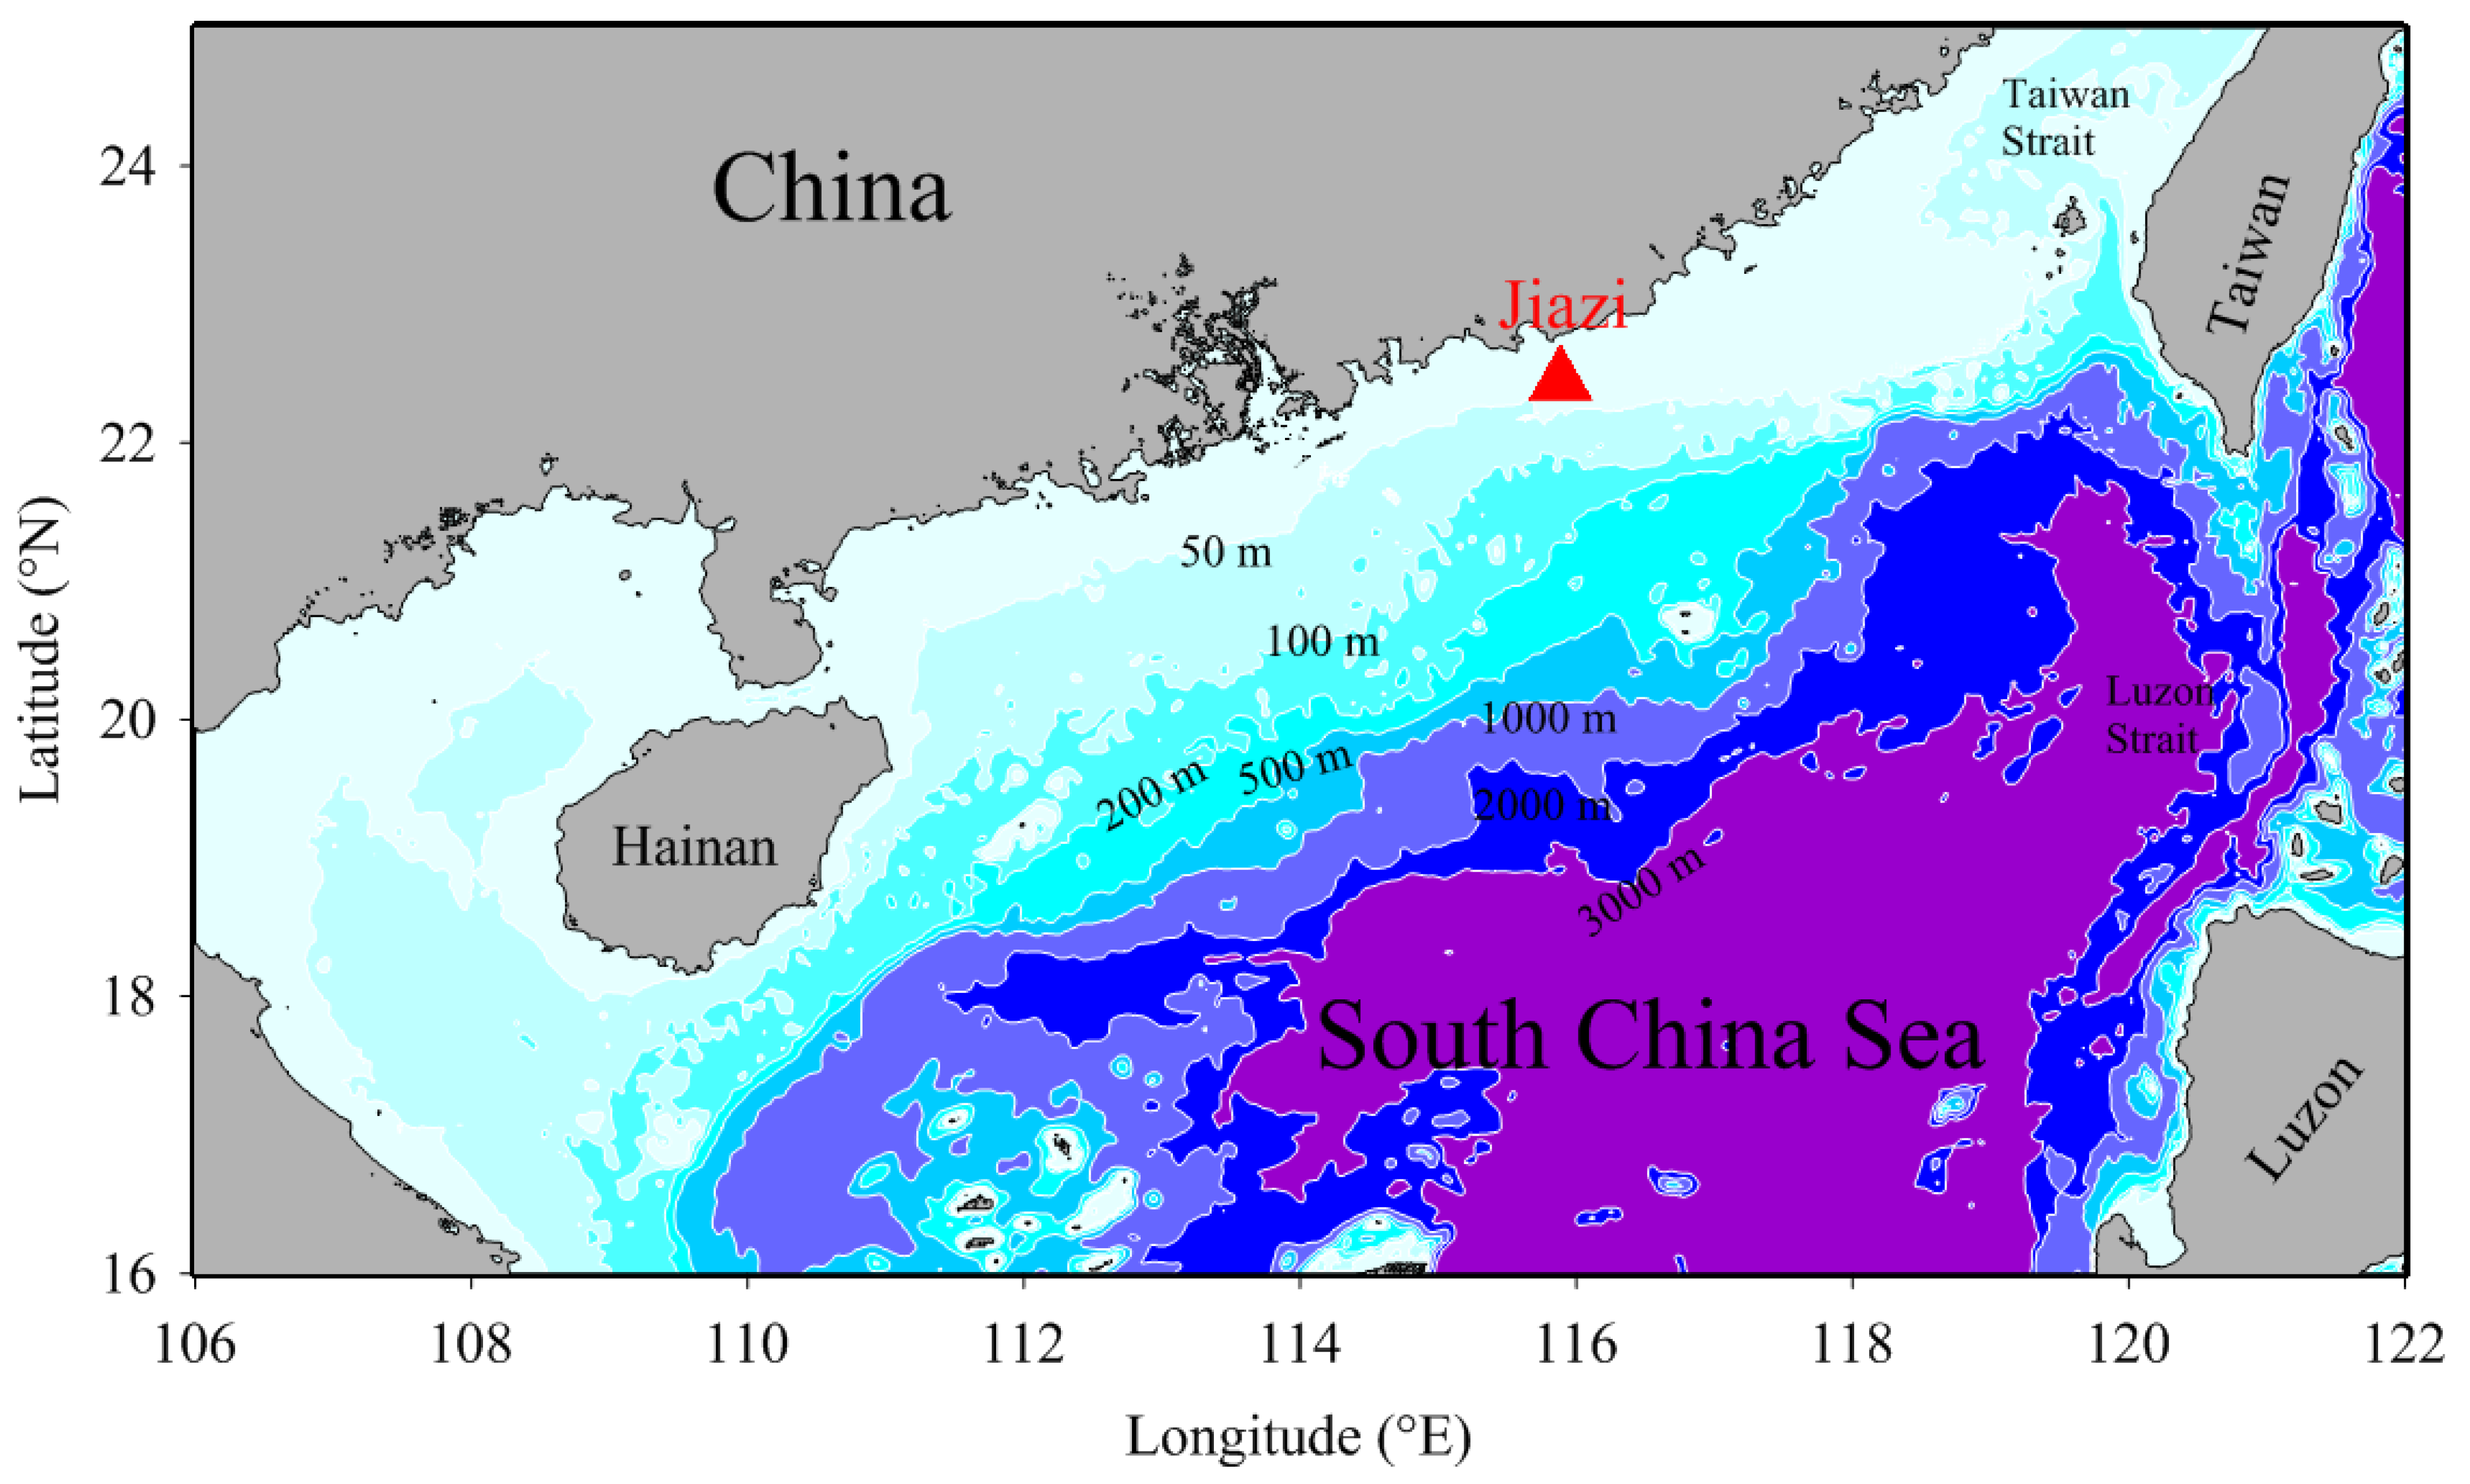
20]. Marine science is a discipline based on observation, and the acquisition of first-hand observational data of the sea is the major driving force for the original innovation of marine science, so there is an urgent need for measured data in this area to verify various research results. Located near 116° E in the northeastern South China Sea (
Figure 1), the Jiazi sea area is a key area for the formation of counter-wind current. Therefore, it is of vital importance to delve into the dynamic evolution process of ocean current in the Jiazi sea area in winter in order to reveal the dynamic process of winter counter-wind current in the northeastern South China Sea.
2. Data Sources of the Stugy Area
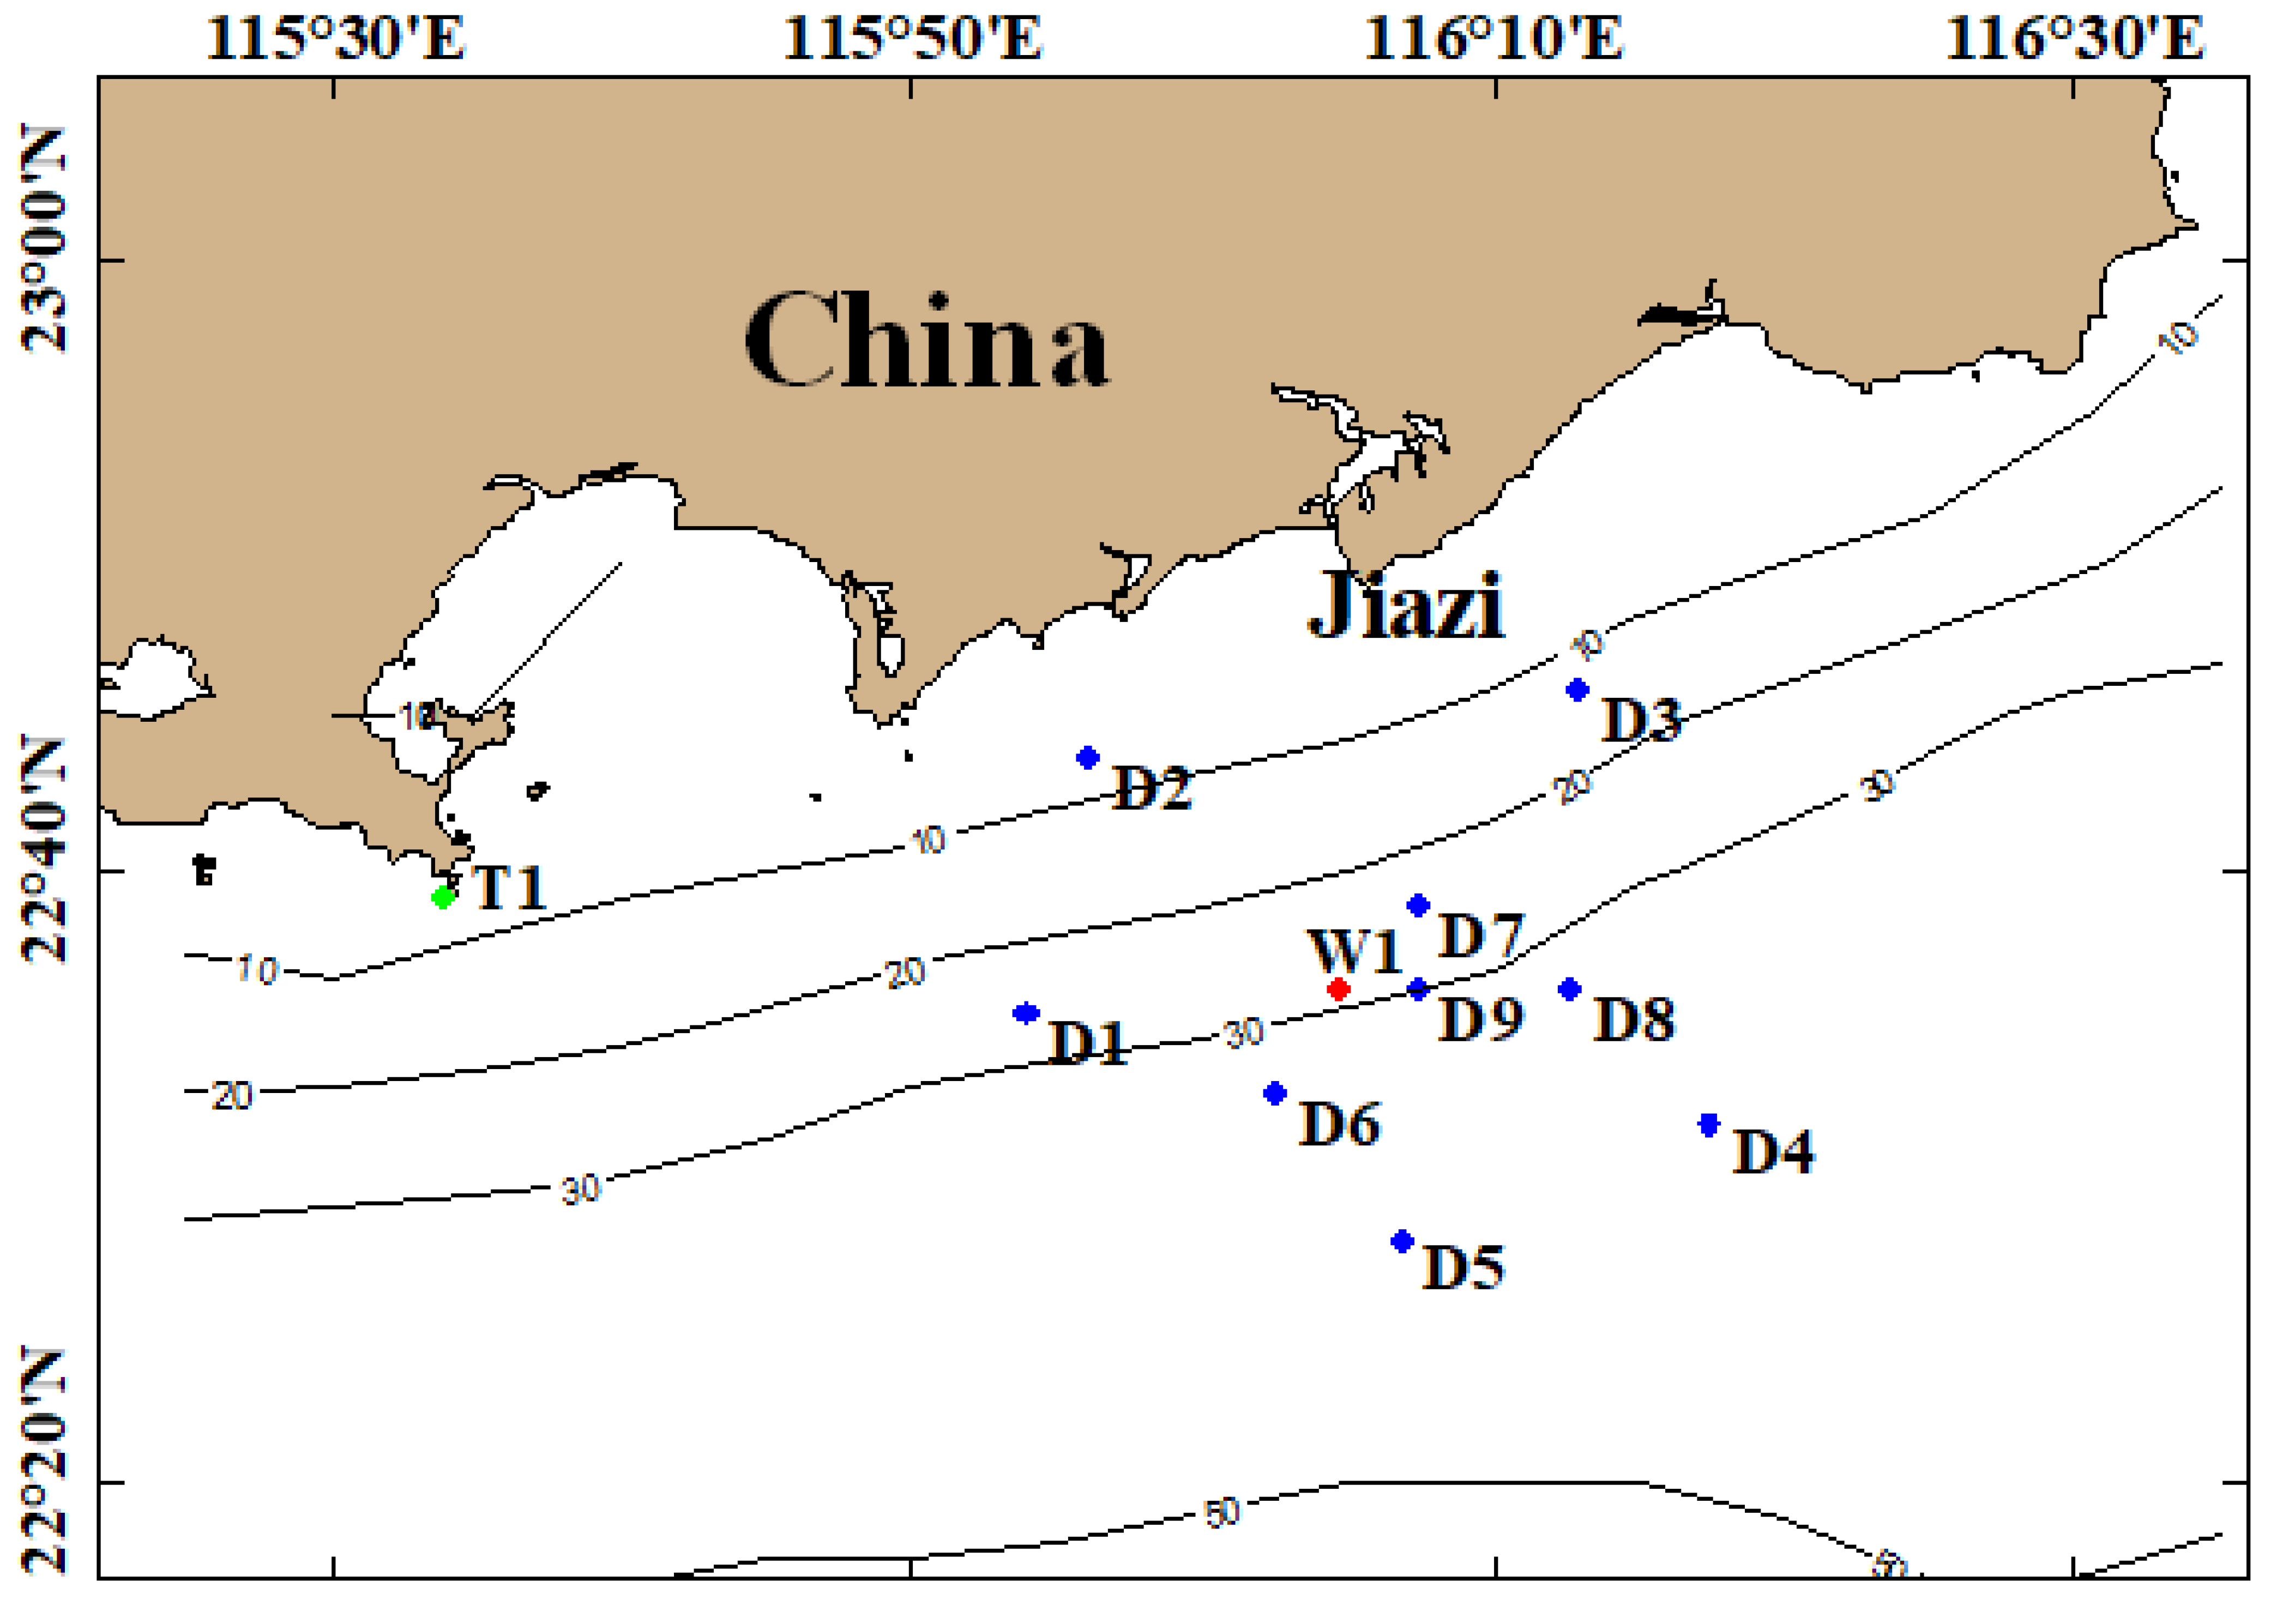
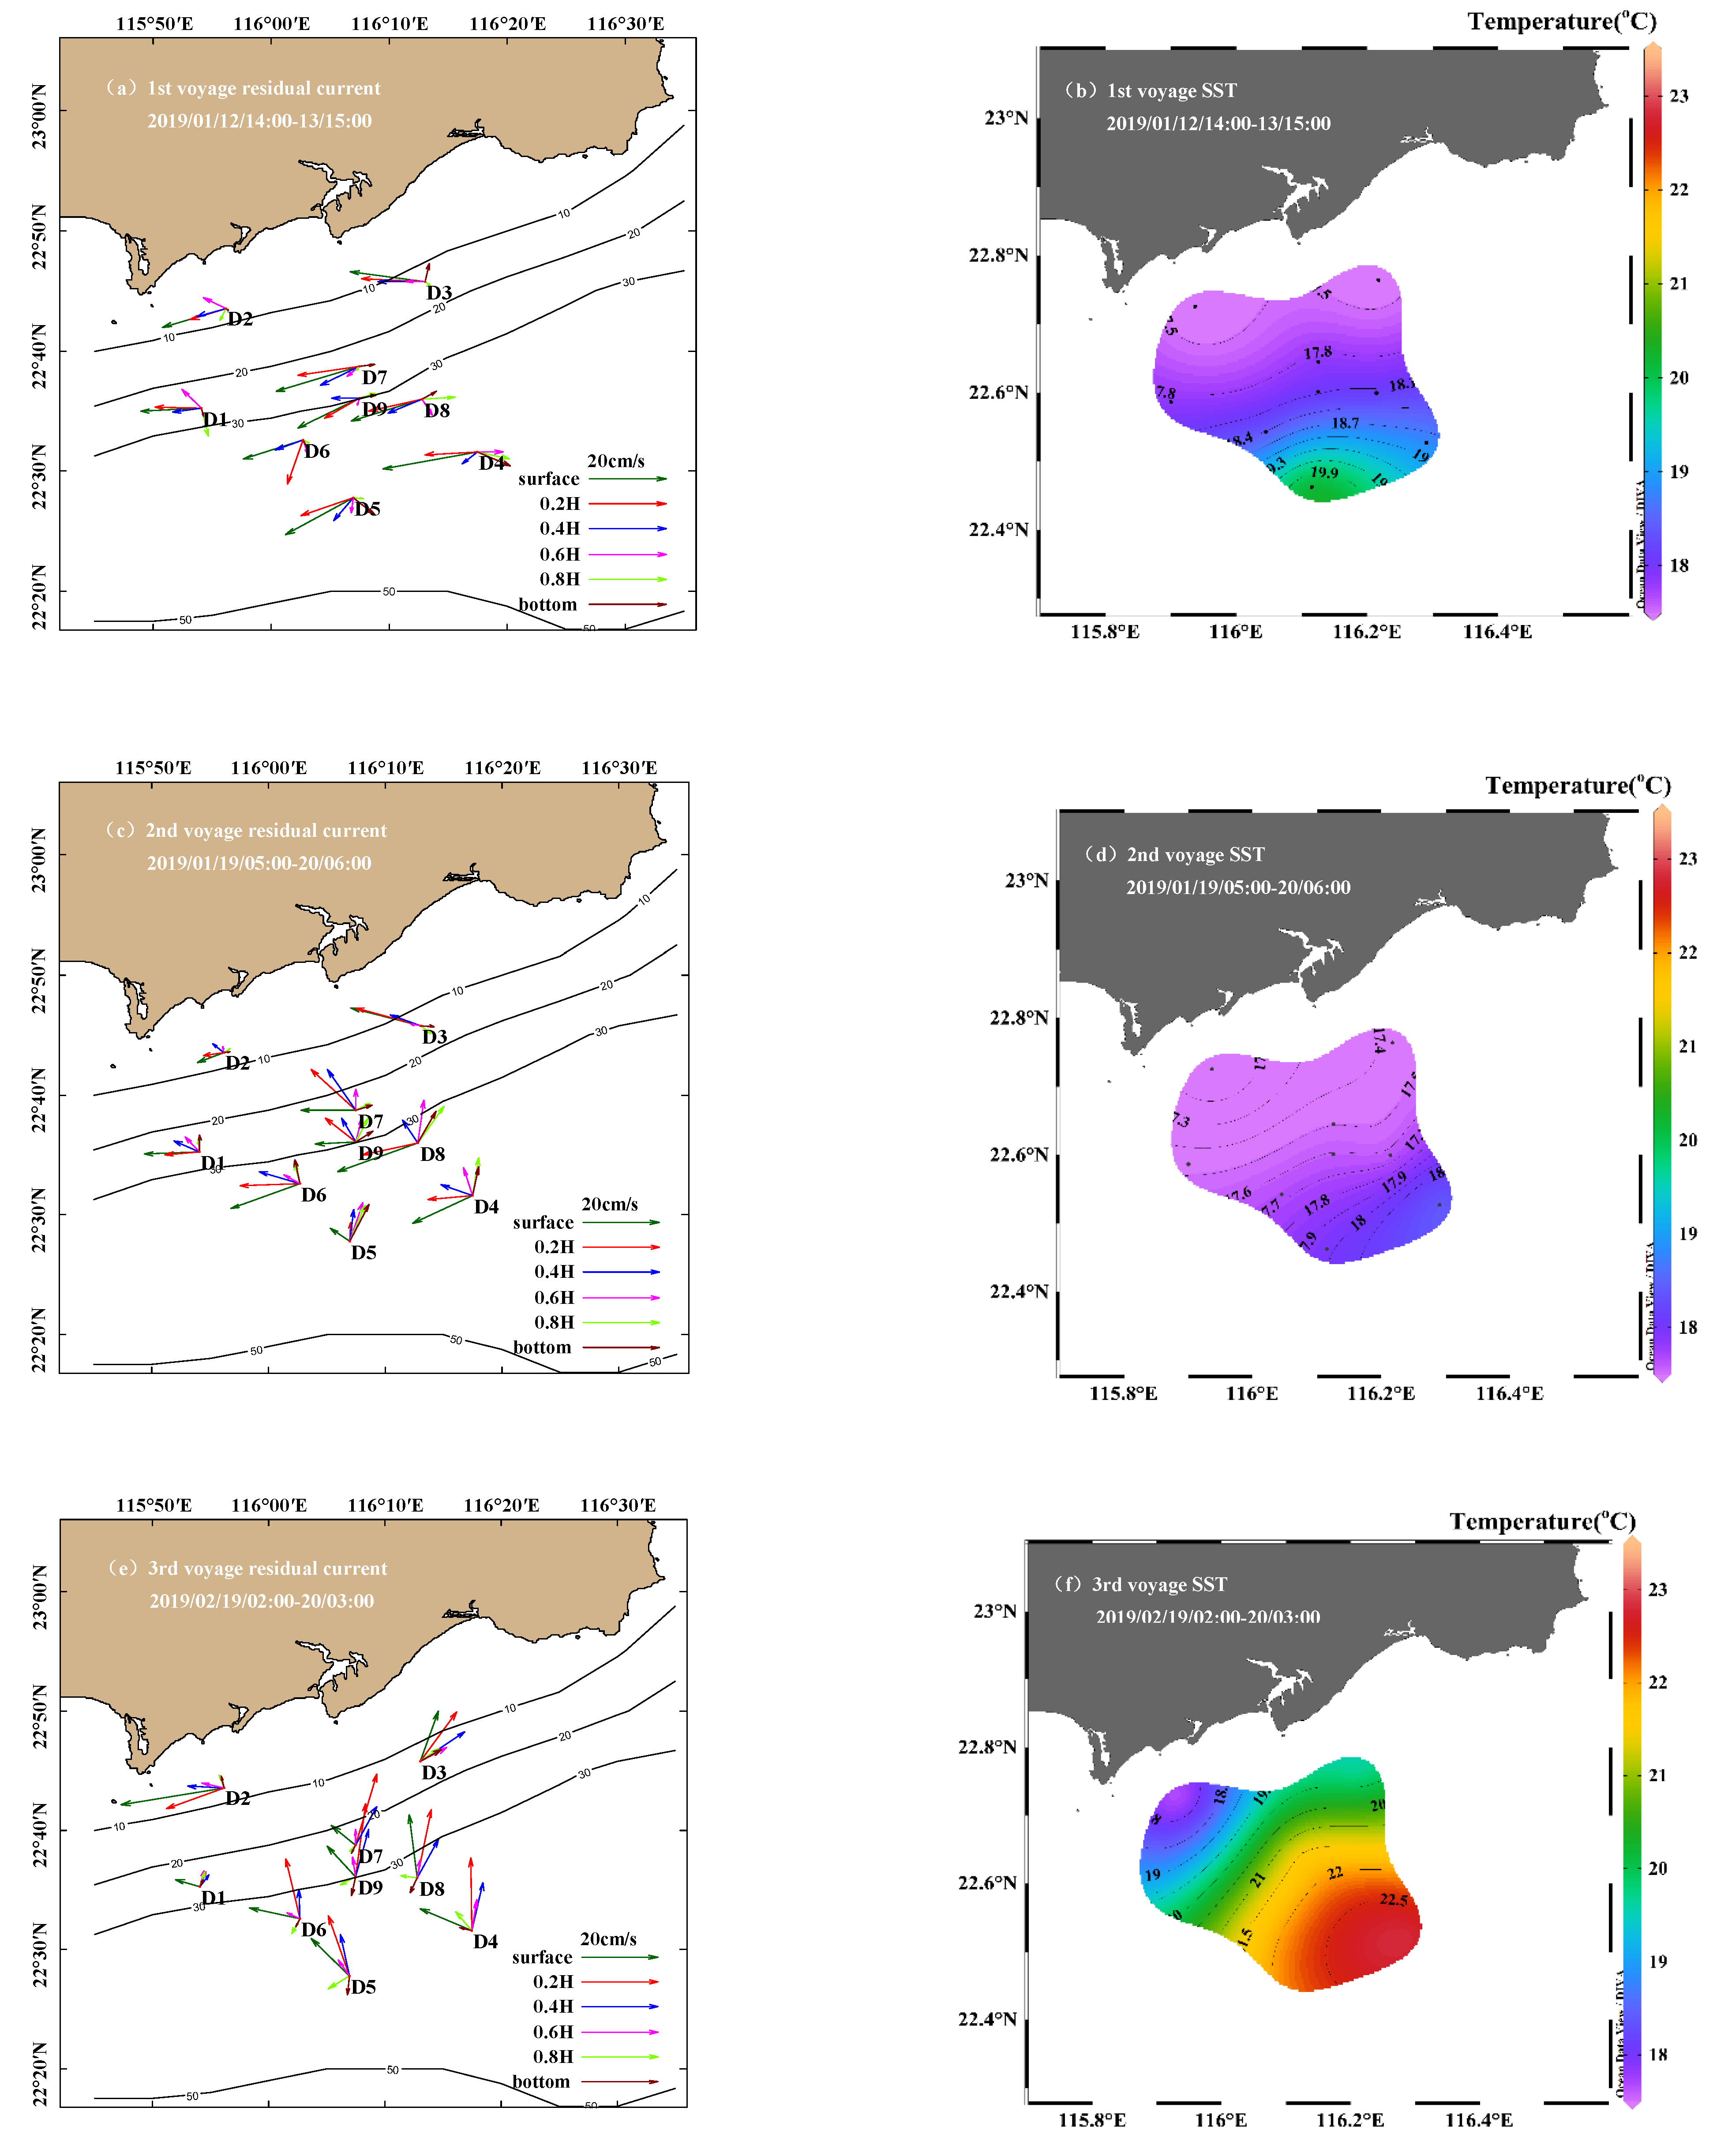
To reveal the horizontal distribution structure of ocean current and sea surface temperature in the Jiazi sea area in winter, we made the first voyage observation from 15:00 on 12 January 2019 to 16:00 on 13 January 2019, the second voyage from 5: 00 on 19 January 2019 to 6: 00 on 20 January 2019, and the third voyage from 2: 0 19 February 2019 to 3: 00 on 20 February 2019. There were nine observation stations (D1~D9) for each voyage, each of which has a different water depth and offshore distance, which reflects the differences of ocean currents in different positions and the overall characteristics of ocean currents in the observed area. The stratified observation of ocean current is carried out using Seaguard RCM current meter and the temperature is observed by Seabird 37 Conductivity Temperature Depth (CTD). Each station is vertically divided into six layers, which are surface layer, 0.2 H, 0.4 H, 0.6 H, 0.8 H, and the bottom layer (surface layer is 0.5 m below water surface, 0.2 H, 0.4 H, 0.6 H, 0.8 H layer is water depth H multiplied by 0.2, 0.4, 0.6, 0.8 depth, respectively, and the bottom layer is 0.5 m above the bottom of the sea).
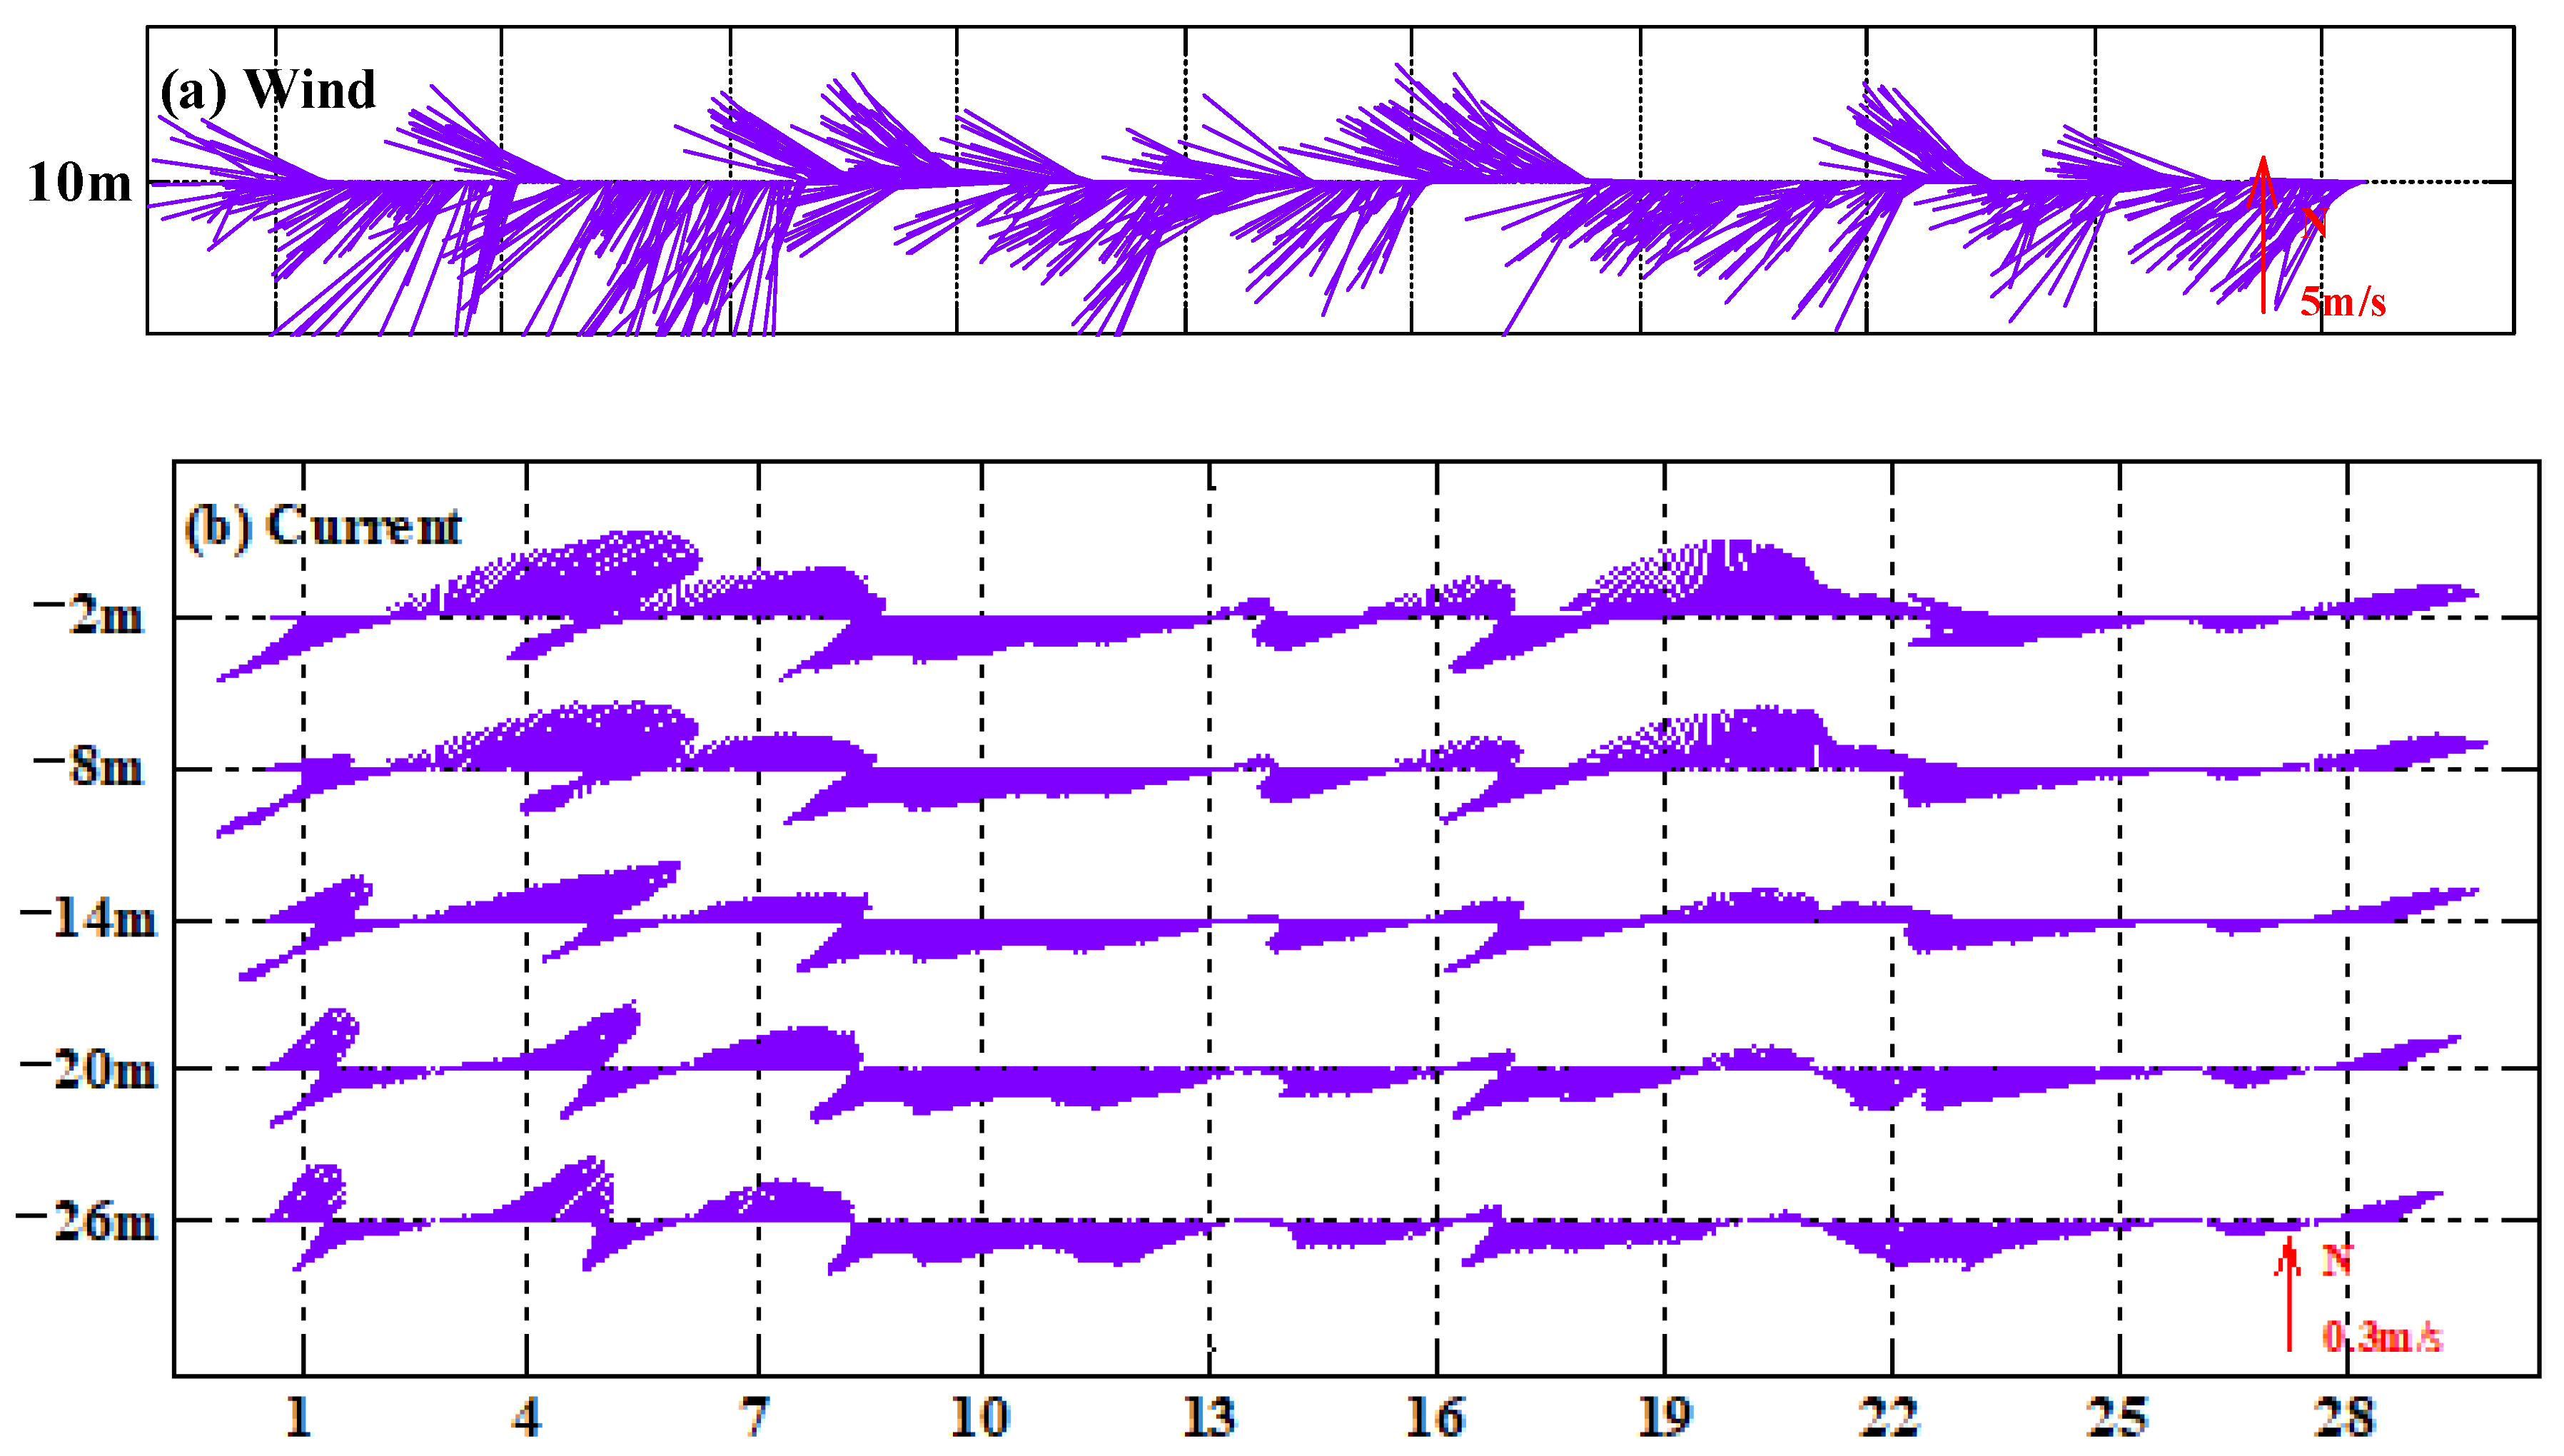
To study the time evolution of wind, current, and sea surface temperature in the Jiazi sea area in winter, we set up wind, sea surface temperature, and current observation stations in the Jiazi sea area from December 2018 to March 2019. The wind observation station T1 is set up on the shore of the sea area to observe the wind speed and direction at the height of 10 m at sea level. The ocean current observation station W1 is set up to observe the ocean current by placing Acoustic Doppler Current Profile (ADCP) on the seabed and pointing the probe upward, and the observed water depth is about 34.5 m. The sampling intervals of ocean current observation in the 1st, 2nd and 3rd voyages and Station W1 are all 1 h. The observation stations are arranged as shown in
Table 1 and
Figure 2.
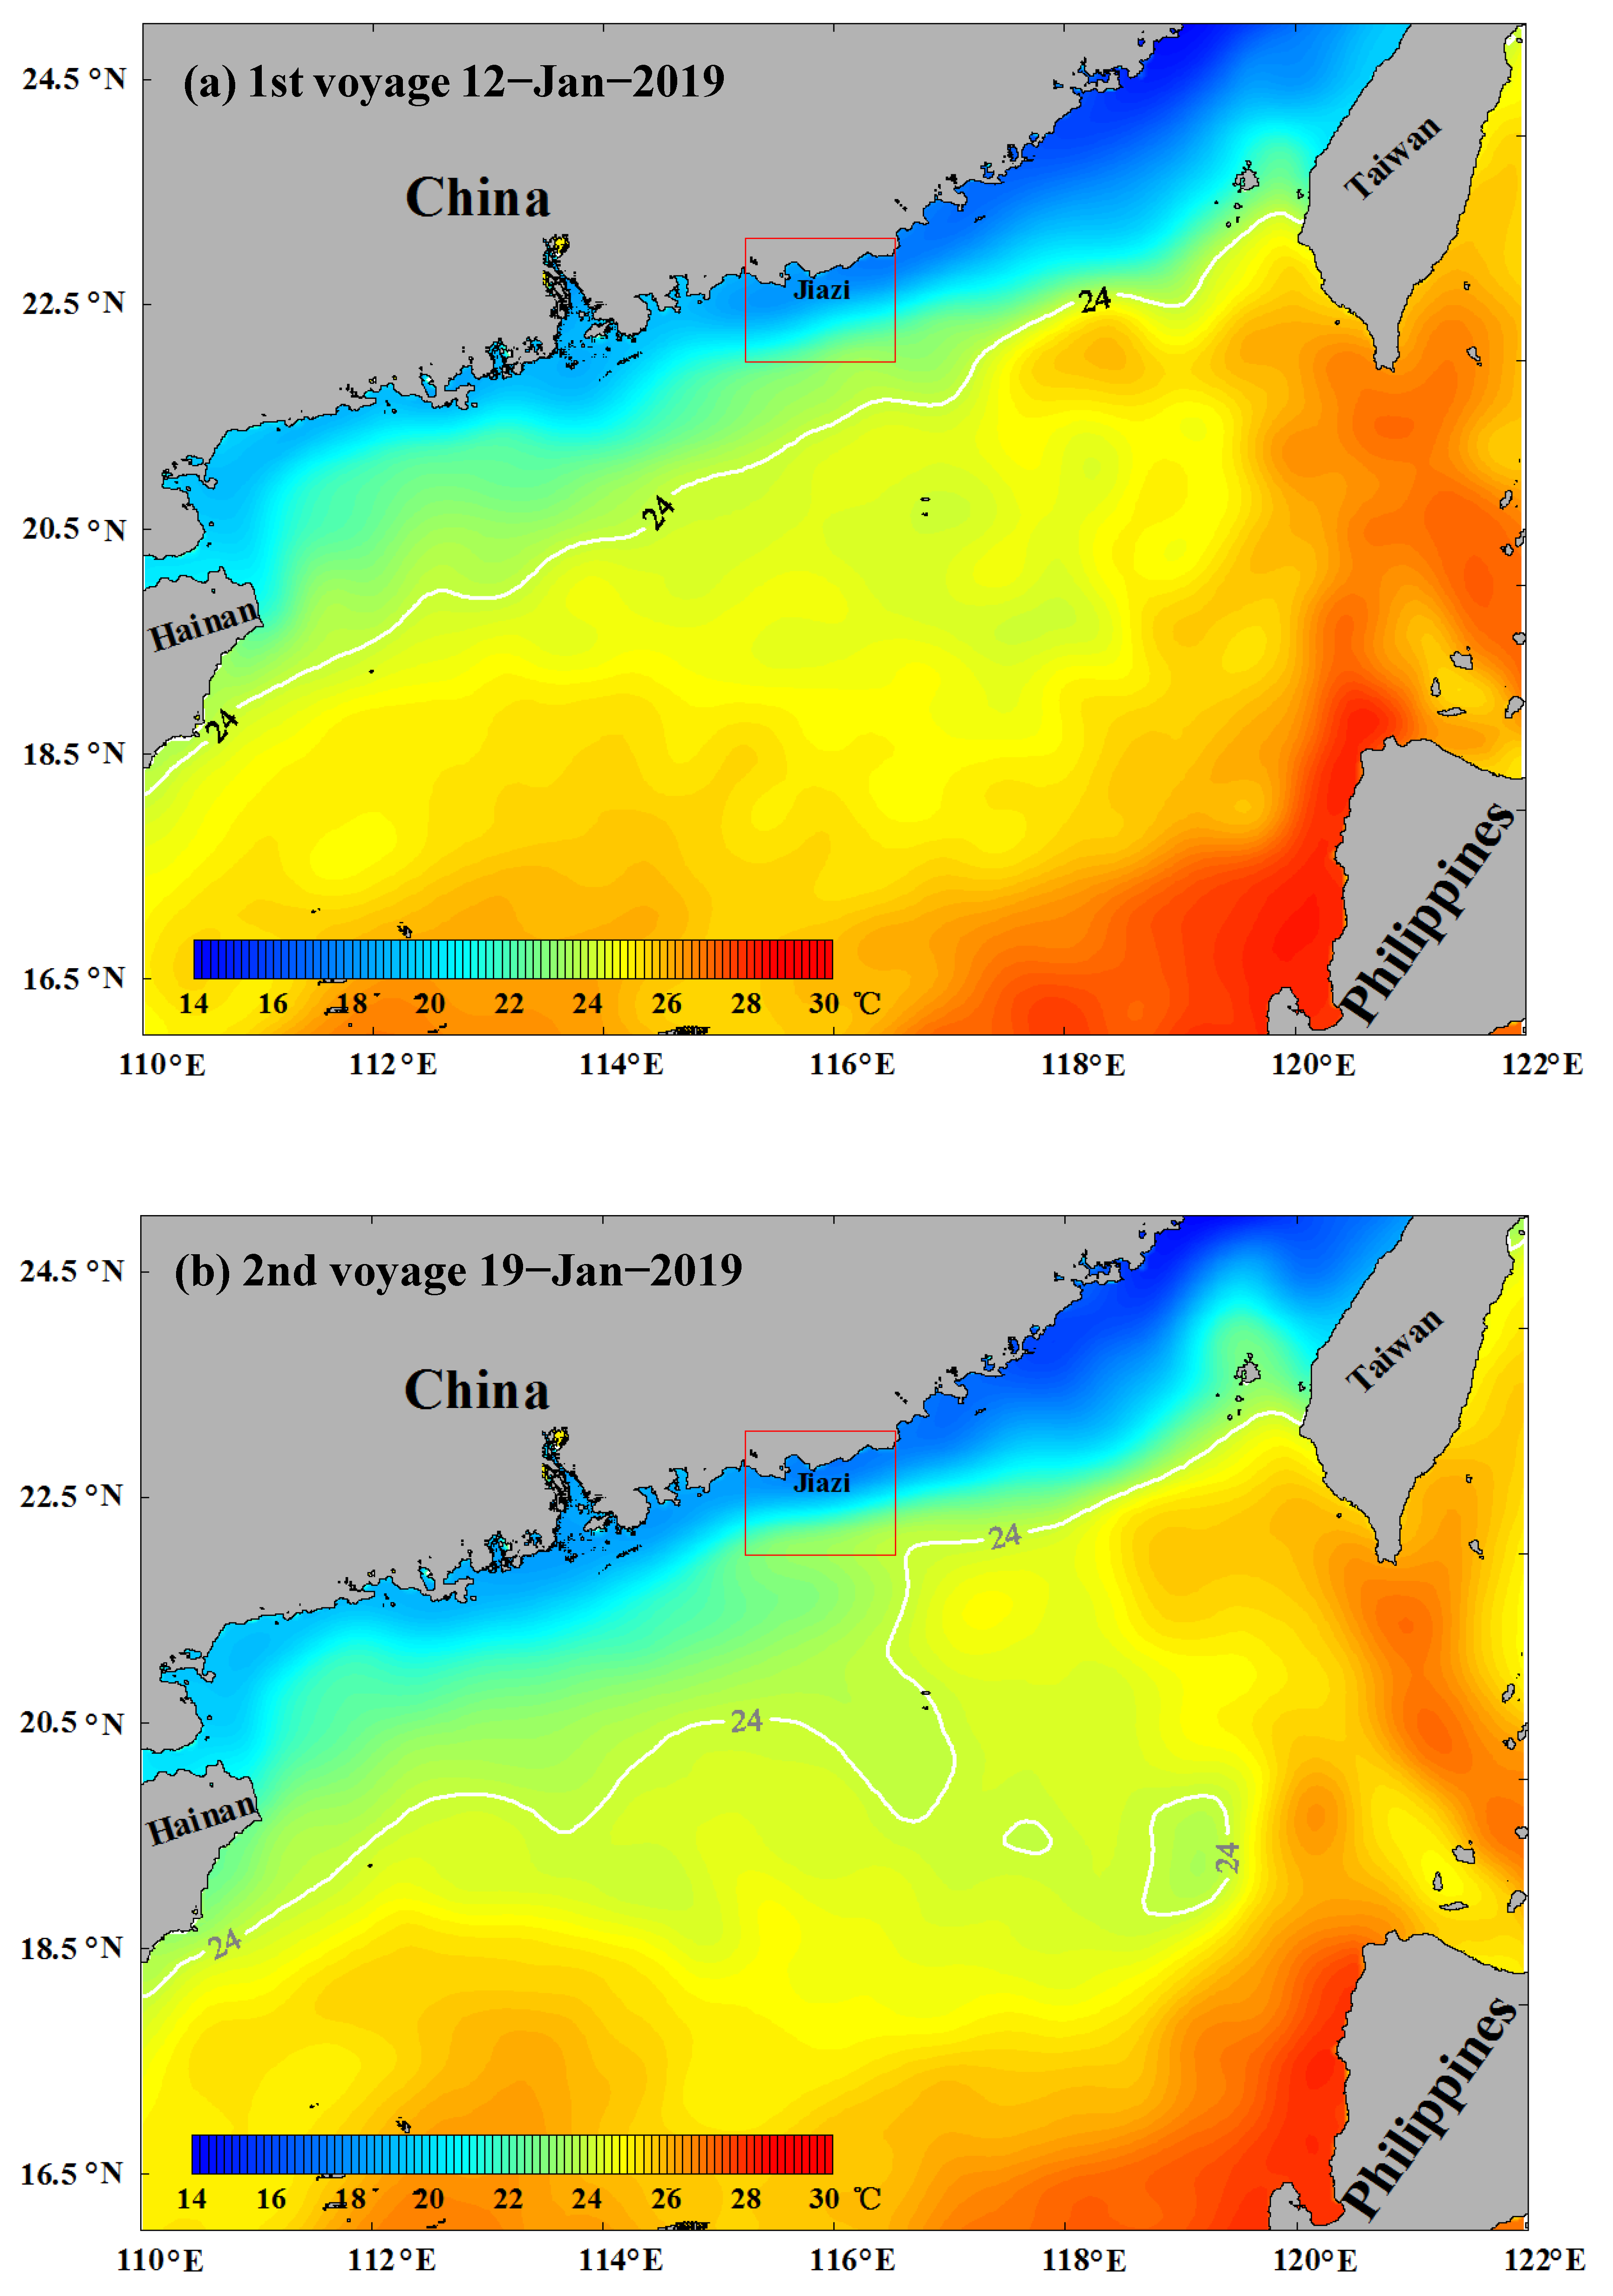
The satellite remote sensing data of GHRSST OSTIA (Operational Sea Surface Temperature and Sea Ice Analysis) sea surface temperature during the 1st, 2nd, and 3rd voyages were collected to study the sea surface temperature distribution in the northeastern South China Sea during each voyage. GHRSST OSTIA sea surface temperature satellite remote sensing data are made up of the daily mean sea surface temperature data provided by the Global Ocean Data Assimilation Experiment (GODAE) Group for High-resolution Sea Surface Temperature (GHRSST) project. The horizontal resolution of the data is 0.05° × 0.05°.
3. Statistics of Residual Current Flow Direction Frequency
Residual current refers to the flow of water excluding periodic flows (such as tidal currents, etc.) from the measured currents, including non-periodic flows such as tidal residual currents, wind currents and density currents. Although the amount of residual current is limited, it provides a clear indication of the flow of water.
The data of the residual current flow direction in each month were collected in 16 directions, and the formula is P = i/N × 100%, where P is the frequency of residual current in each direction, I is the number of residual currents in each direction, and N is the total amount of statistical data. The statistical results of the residual currents observed in the weekly and monthly ocean currents from December 2018 to March 2019 are shown in
Table 2,
Table 3,
Table 4 and
Table 5. Then, according to the distribution of the residual current flow frequency in each month, the residual current frequency in the NE direction (0°–90°) of each month is calculated (
Table 5). It is observed that the residual flow direction of each month is mostly SW and WSW, and the residual current frequency of WSW is the highest. The frequency of residual current in the surface layer of SW and WSW is higher than that in the middle and bottom. With the increase of water depth, the residual current frequency of SW and WSW decreases gradually. Therefore, the SW current in theJiazi sea area in winter is primarily the wind current generated by the northeast monsoon.
Table 5 shows the frequency distribution of the residual current to the northeast of each layer (0°–90°) in each month. The frequency of counter-wind flow in the Jiazi sea area from December 2018 to February 2019 is 9.95% and 31.09%. In March 2019, the frequency of the residual current in the northeast direction increased, and the frequency of the residual current in the northeast direction reached 46.11–52.03%. Therefore, the current in the Jiazi sea area is not northeastward throughout the year, and the current is mostly southwestward in winter and northeastward in certain time periods. In addition, through the frequency distribution of the northeasterly residual current in each month (
Table 5), it is found that the highest frequency of the northeasterly residual current in December and January occurs in the bottom layer, and the highest frequency in February and March occurs in the middle layer. This shows that the counter-wind current lasts longer in the middle and bottom layers of the Jiazi sea area.
4. Residual Current Flow Direction and Wind Direction
Wind current is the main form of the ocean current in the northern shelf of the South China Sea, and the flow direction of the surface current is mostly affected by wind. As shown in
Table 6, the winter wind direction in Jiazi sea area is primarily ENE–SE, which makes it easy to drive the sea water from the northern shelf of the South China Sea to the shore due to the Ekman effect.
According to
Table 5, the frequency of northeasterly counter-wind current in Jiazi sea area is the lowest in January, followed by December and February, and the frequency is the highest frequency in March.
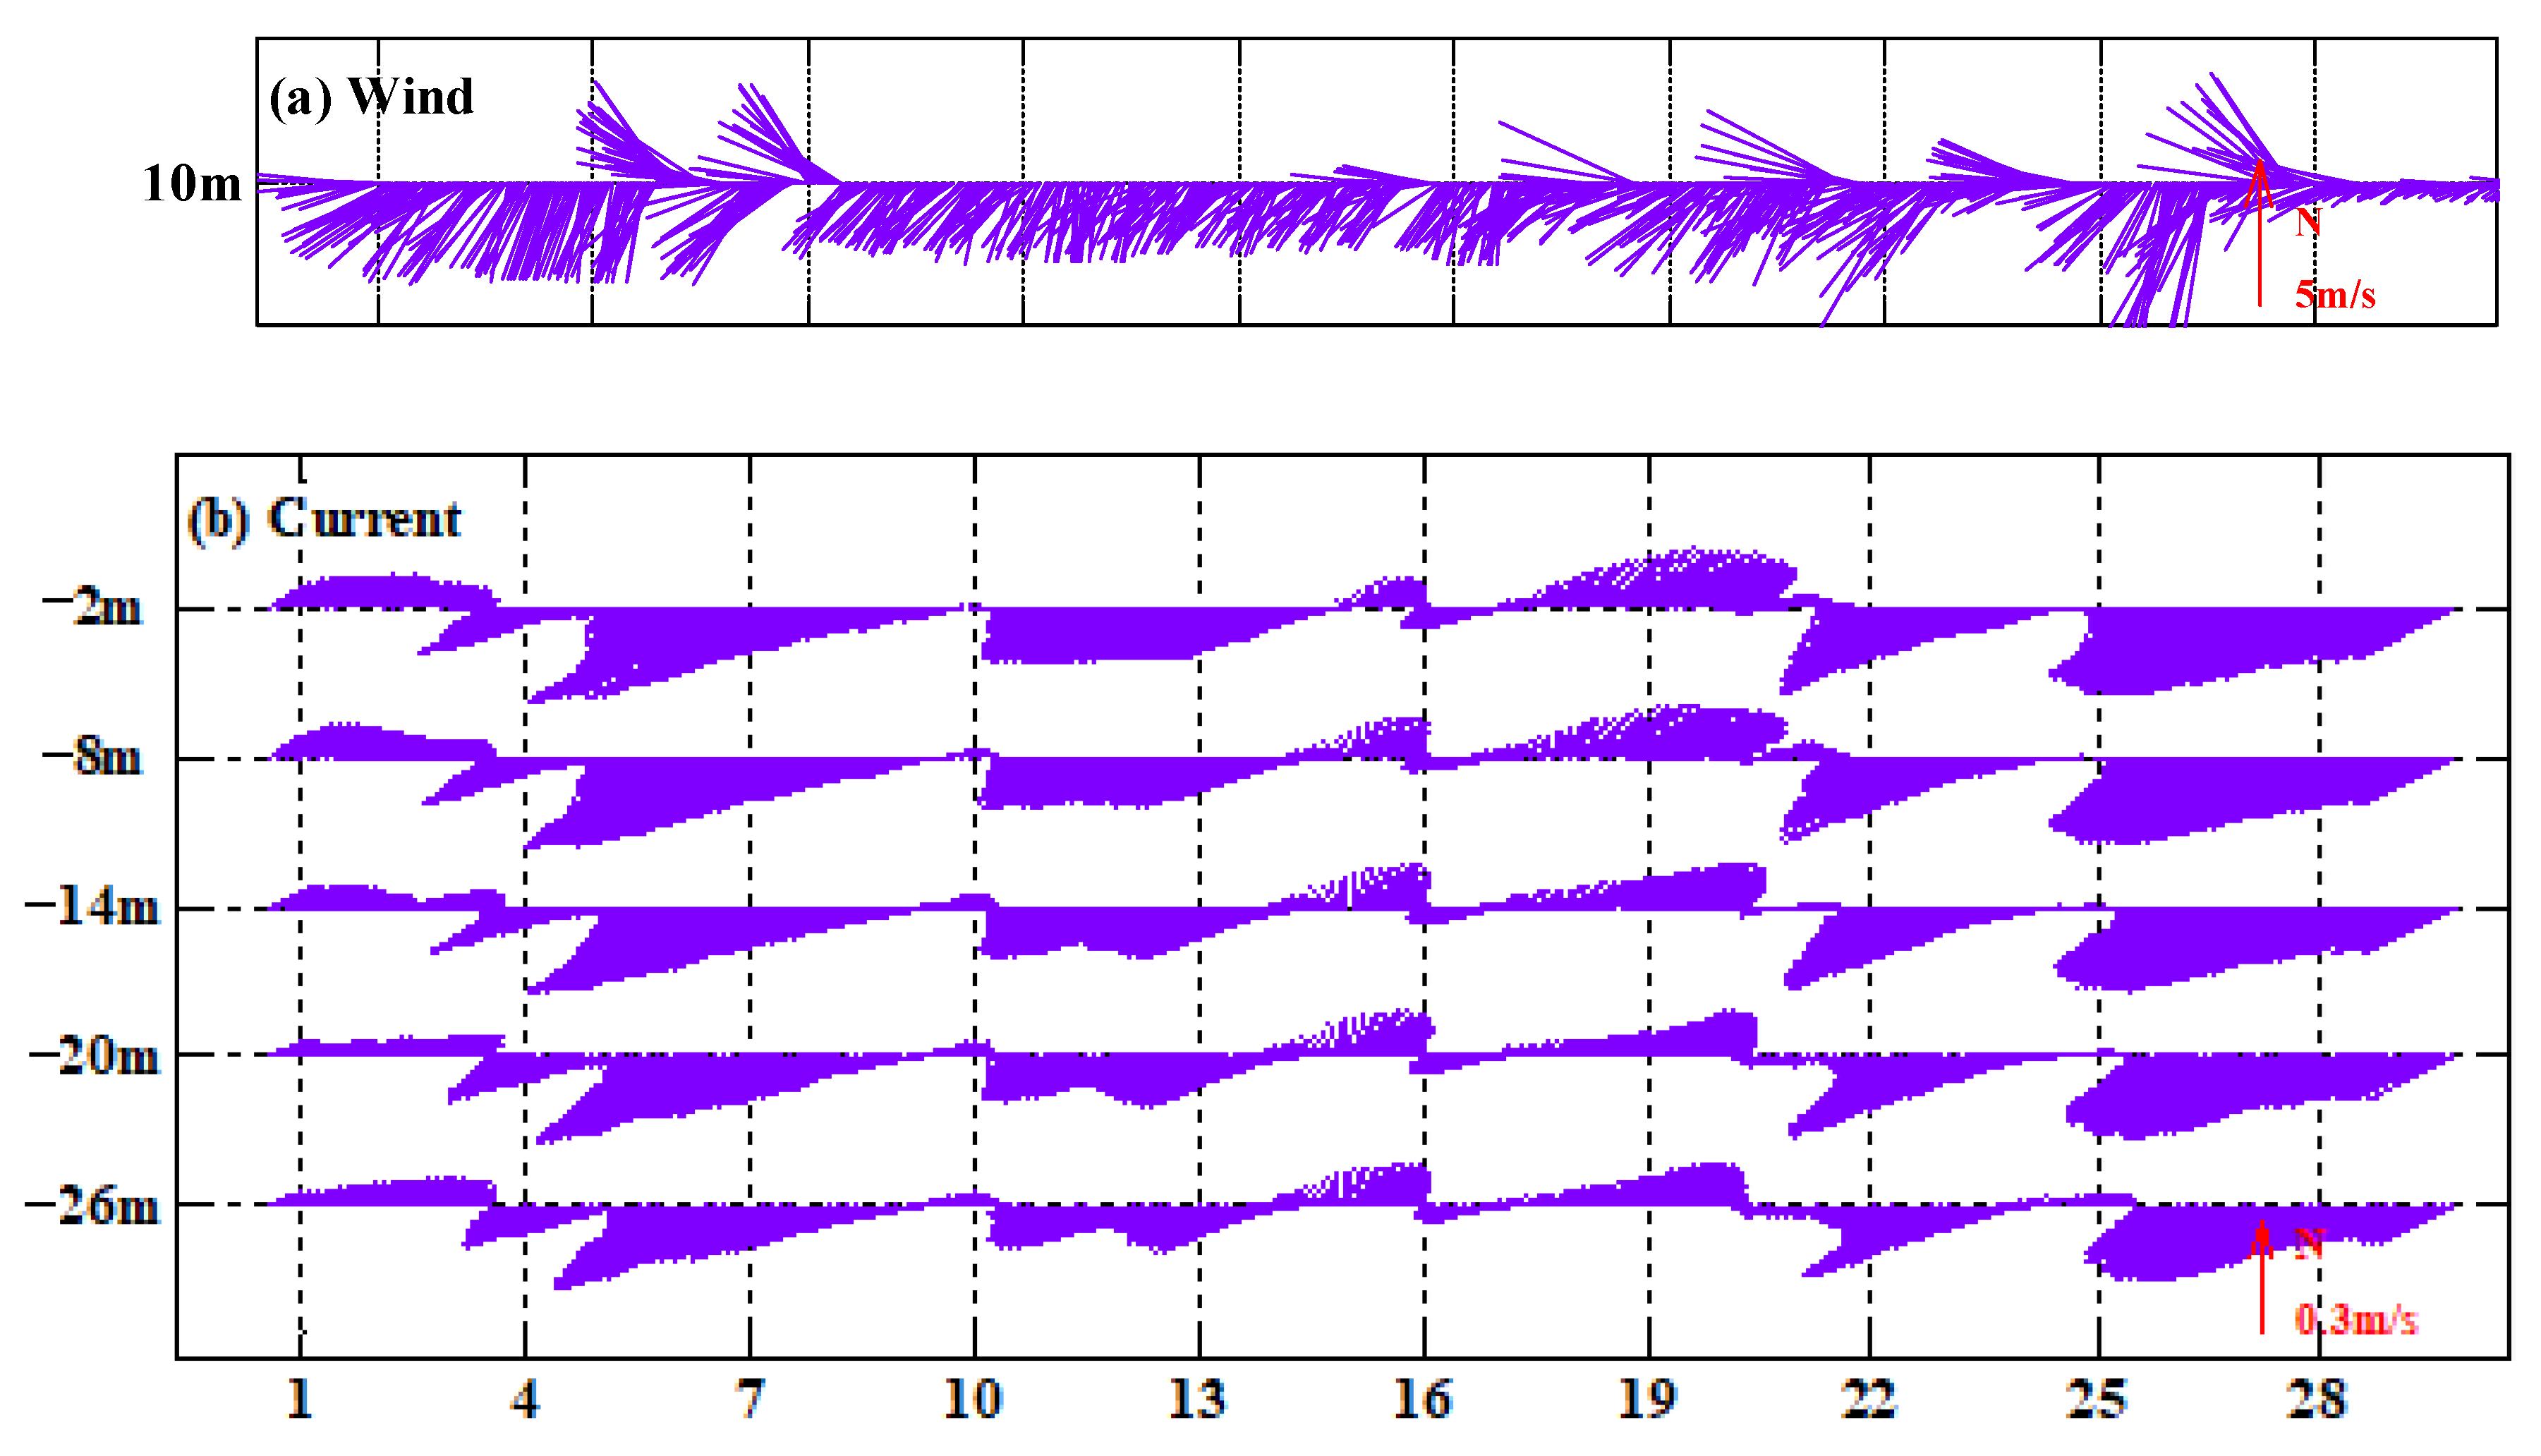
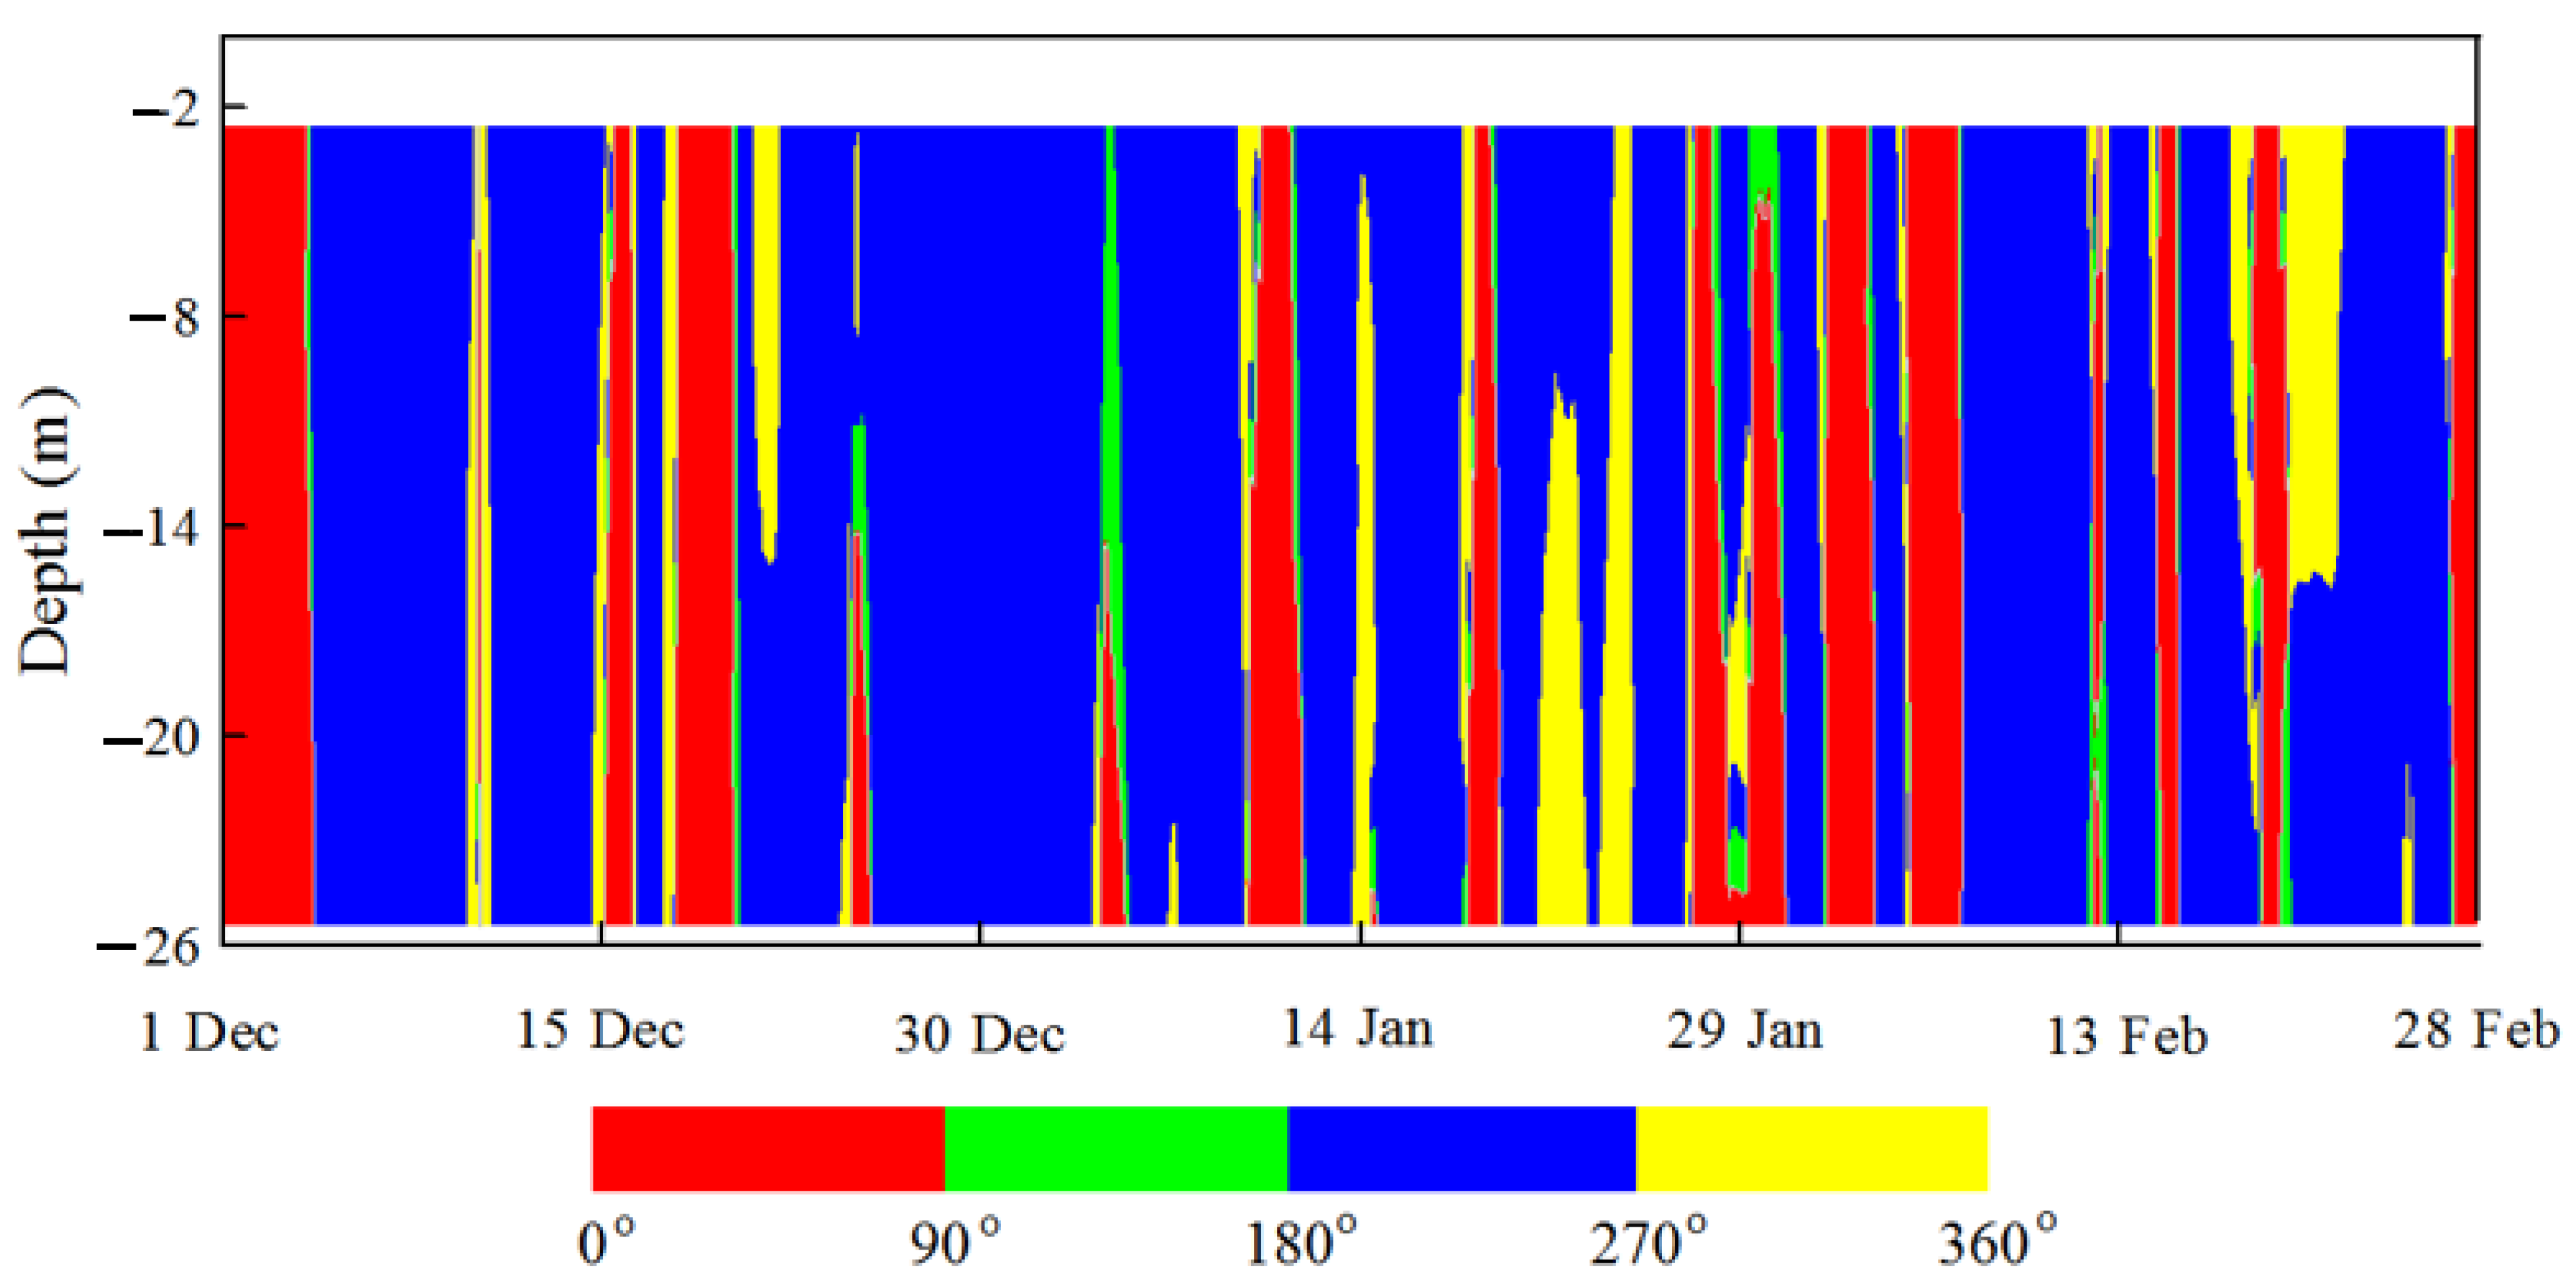
Table 6 shows the frequency of northeasterly wind in each month. The frequency of northeasterly wind in December 2018, January 2019 and February 2019 was 27.46%, 11.56% and 9.68%, respectively. The maximum frequency of counter-wind current in December 2018 was 26.92%, which occurred at the water depth of −26 m (
Figure 3); in January 2019, the maximum frequency of counter-wind current was 26.22%, which occurred at the water depth of −26 m (
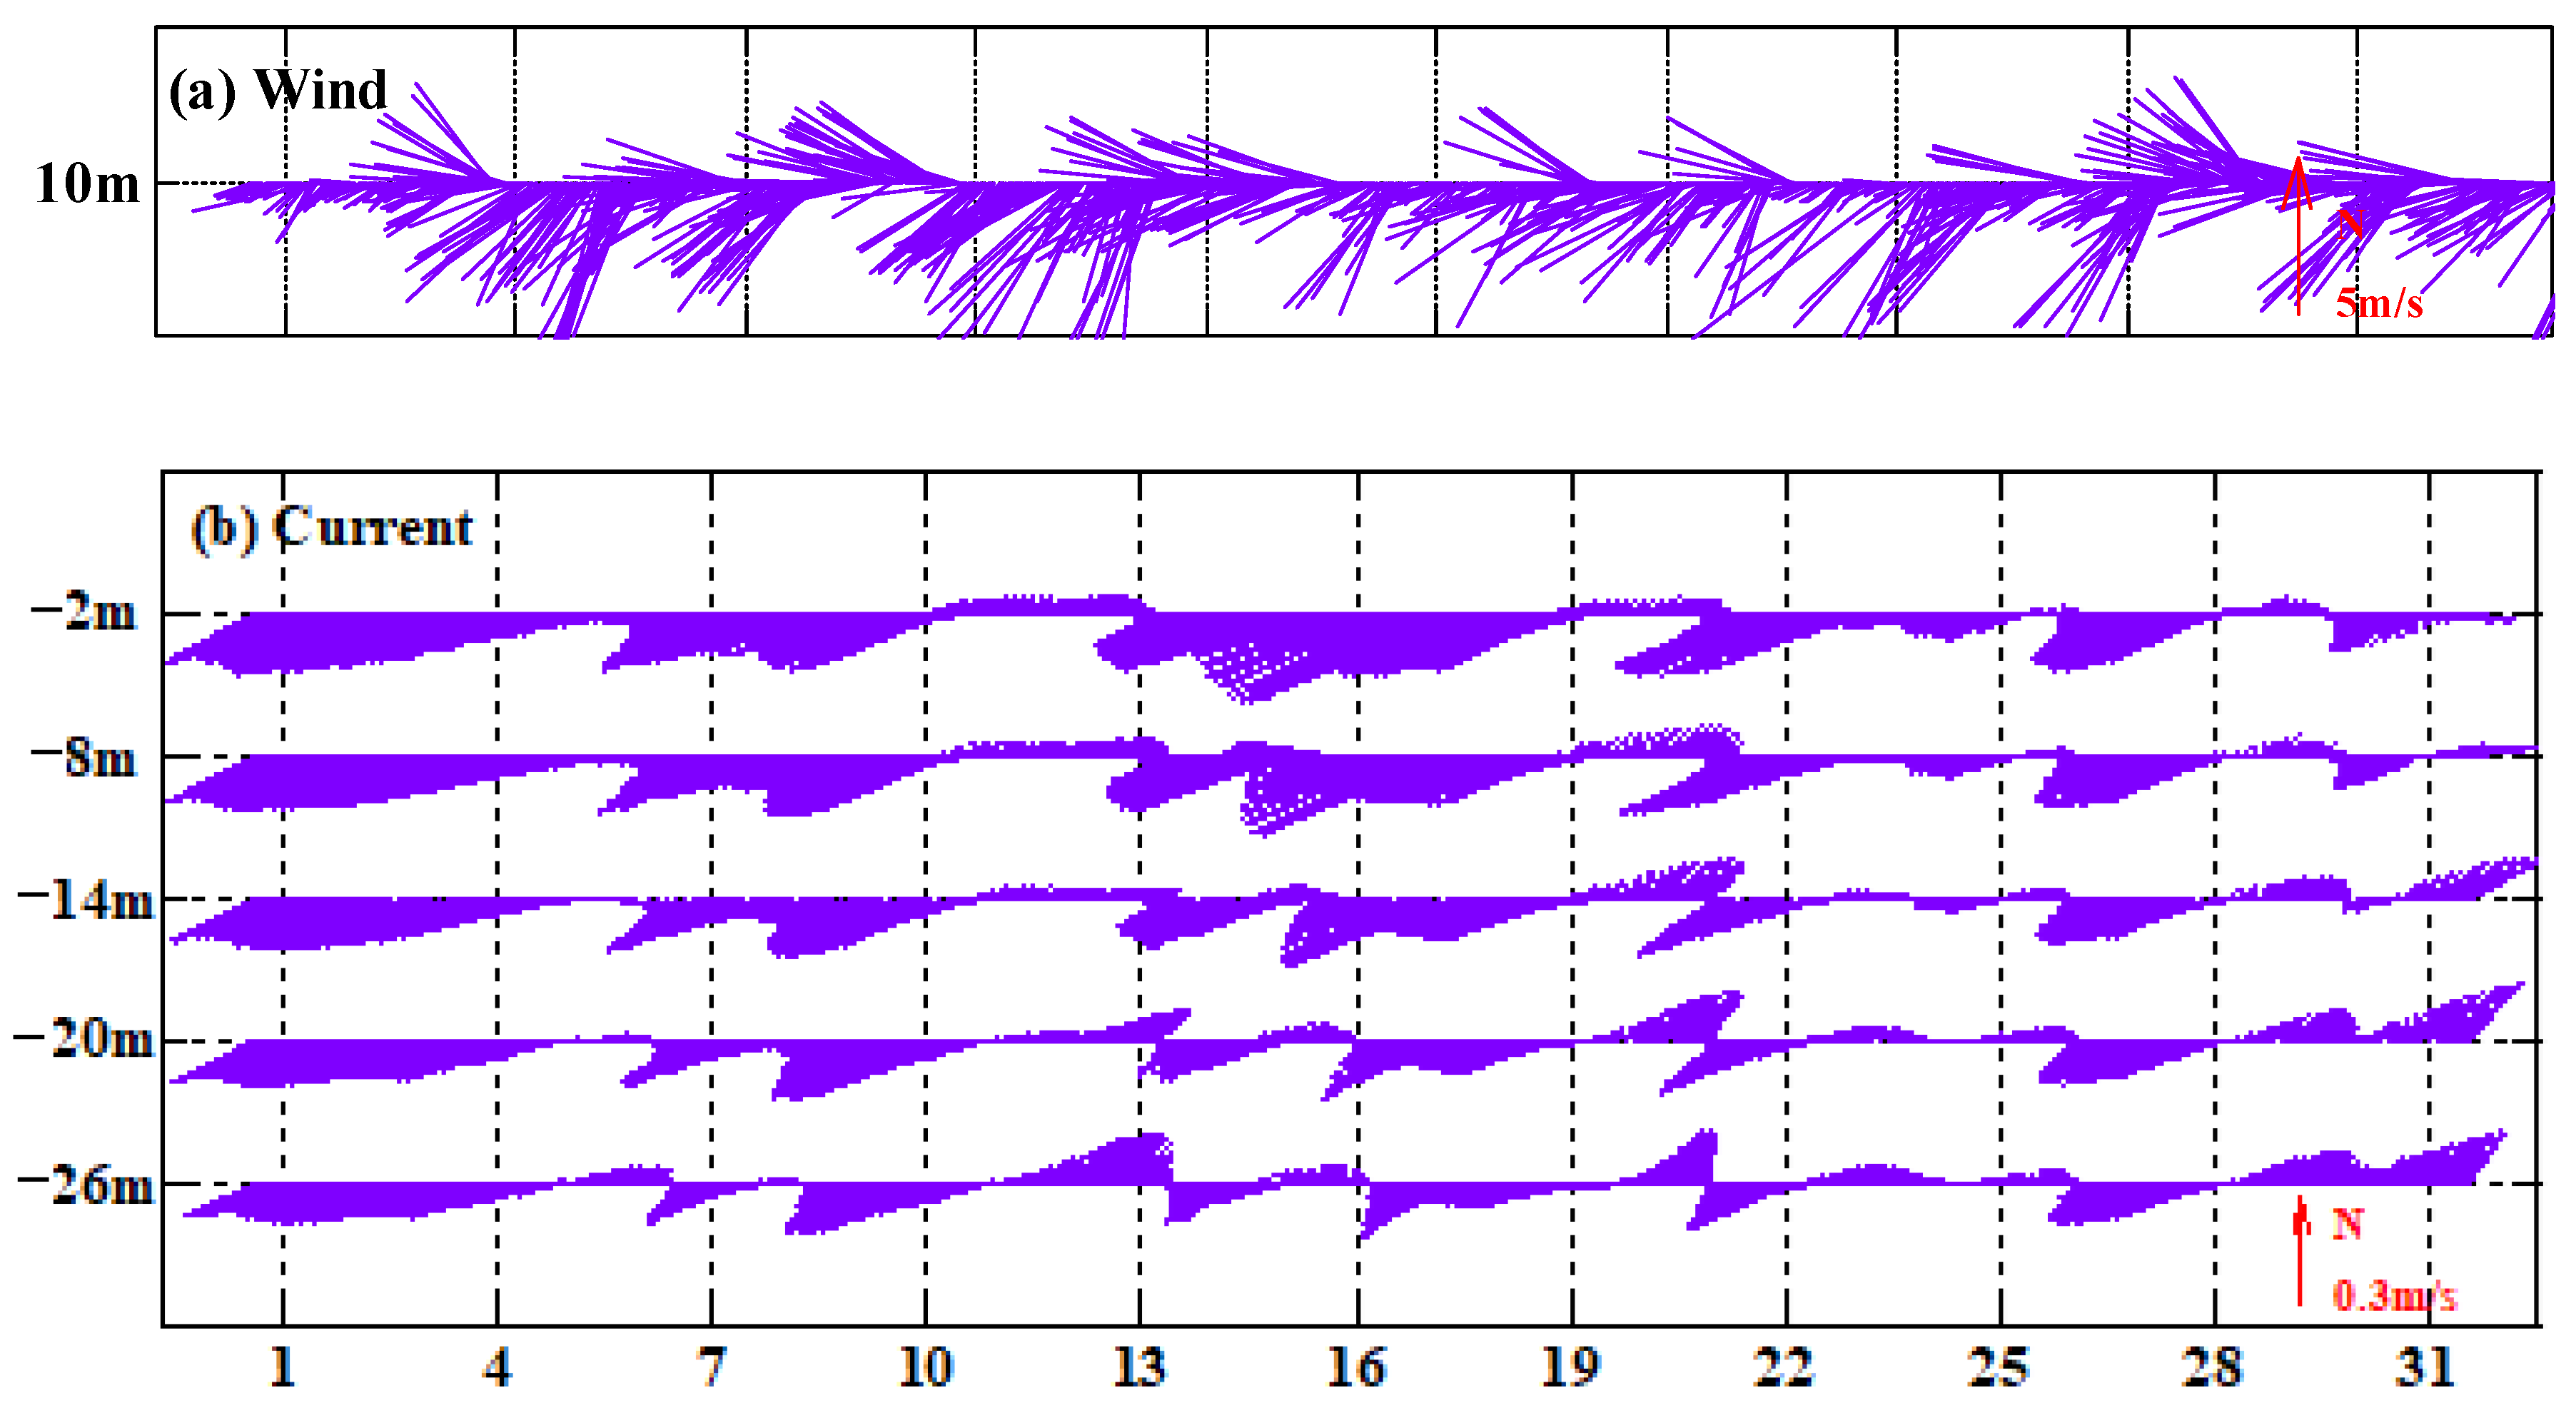
Figure 4); in February 2019, the maximum frequency of counter-wind current was 31.09%, which occurred at the water depth of −14 m (
Figure 5). The relaxation of the northeast monsoon is beneficial to the formation of the northeast current in the Jiazi sea area in winter. The frequency of northeasterly wind in January 2019 was lower than that in December 2018, but the frequency of northeasterly current in January 2019 was lower than that in December 2018, which indicates that the relaxation of northeast monsoon is not the only factor affecting the formation of counter-wind current in the Jiazi sea area.
Through the analysis of the frequency distribution of the northeasterly residual current in each layer in February and March 2019 in
Table 5, it is found that the residual current frequency in the 0.6 H layer is the highest, and the frequency decreased at both the sea surface and the sea floor; while in December 2018 and January 2019, the frequency of the northeasterly residual current of the bottom layer is the highest, and the frequency decreased from the sea floor to the sea surface.
Figure 6 shows the wind speed process line of T1 station and the residual current flow velocity process line of W1 station in February 2019. It can be seen that the basic trend of the formation of counter-wind current in Jiazi sea area is that southeast wind is produced on the sea area after the relaxation of northeast monsoon, and the wind current changes from southwest to northwest, and then the direction of ocean current changes from northwest to northeast, resulting in counter-wind current.
Under the hypothesis that the seawater movement in the offshore area maintains a balance between Coriolis force, pressure gradient force and friction force, the governing equation of flow velocity is established.
Through vertical integration of Formulas (1) and (2), the following equation is obtained:
In the equation, is sea water density; is pressure; , are the east component and north component of the sea water flow velocity; , is the east component and north component of the sea surface wind stress, respectively.; , is the east component and the north component of the sea floor friction stress, respectively.
From the analysis of Formulas (3) and (4), it is found that the greater the east component of pressure gradient and sea floor friction along the continental shelf direction, the smaller the east component of sea surface wind stress, the more favorable for the increase of the north component of flow velocity. In the northeast shelf area of the South China Sea in winter, the residual current on the bottom layer is primarily southwestward, the sea floor friction is eastward, the vertical mixing of water and the horizontal stratification of water temperature are evident, and the pressure gradient is conducive to the northward movement of sea water. When the east component of wind stress weakens, the east component of sea floor friction also weakens to some extent, which explains why a high-frequency northeasterly residual current occurred in the middle layer of the ocean in February 2019. This also shows that the formation of winter counter-wind current in the northeastern South China Sea is a result of the concerted action of wind stress, and baroclinic and geostrophic effects.
5. Relationship between Sea Water Temperature and Counter-Wind Current in Jiazi Sea Area in Winter
No counter-wind current occurred during the first voyage and the second voyage in Jiazi sea area, and the maximum temperature differences in the sea surface temperature were 2.4 °C and 1.2 °C, respectively. Counter-wind current occurred during the third voyage, and there were cold water masses in the observed northwestern sea area and warm water masses in the observed southeastern sea area. The distance between the centers of the two water masses was 45.28 km, and the maximum temperature difference of sea surface temperature was 6.8 °C (
Figure 6). By comparing the remote sensing sea surface temperature of the northeastern South China Sea during the three voyages (
Figure 7), it is found that the area of warm water masses in the northeastern South China Sea during the third voyage is significantly larger than that of the 1st and 2nd voyages. The water temperature in the coastal area of the northeastern South China Sea is relatively low under the action of tidal runoff. Therefore, during the 3rd voyage, there was an obvious northwest pressure gradient force on the sea surface of the Jiazi sea area, and the sea water moved ashore and converged in the sea area near 116° E.
The stress exerted by the wind on the sea surface causes the surface water to move, and each layer of moving sea water exerts a stress on its lower layer. Due to the large eddy viscosity coefficient of seawater, the stress effect is still quite significant even if the difference of flow velocity between the two adjacent water layers is very small [
21]. Ekman conducted a theoretical study on the wind current and concluded that in the northern hemisphere, the nearshore sea water movement is easily deflected from top to bottom to the right due to the geostrophic effect. With the increase of the depth, the angle between the wind and the current increases, while the flow velocity decreases. During the third voyage, the middle and bottom water of the sea area deflects to the right and flows to the northeast with the increase of depth, which is typically subject to the Ekman effect.
In addition, the water temperature in the northeastern South China Sea decreases gradually from south to north, and the northeastward currents are easily formed due to the baroclinic effect. This could explain why two different current systems are formed in the northeastern South China Sea with 116° E as the boundary in winter, the winter counter-wind current is formed in the sea area east of 116° E, and the southwest current is formed in the sea area west of 116° E in winter. The appearance of cold water masses in the northwest and warm water masses in the southeast of the Jiazi sea area in winter is the key to the formation of both the two different flow systems in the east-west direction with 116° E as the boundary and the counter-wind current in the Jiazi sea area in winter.
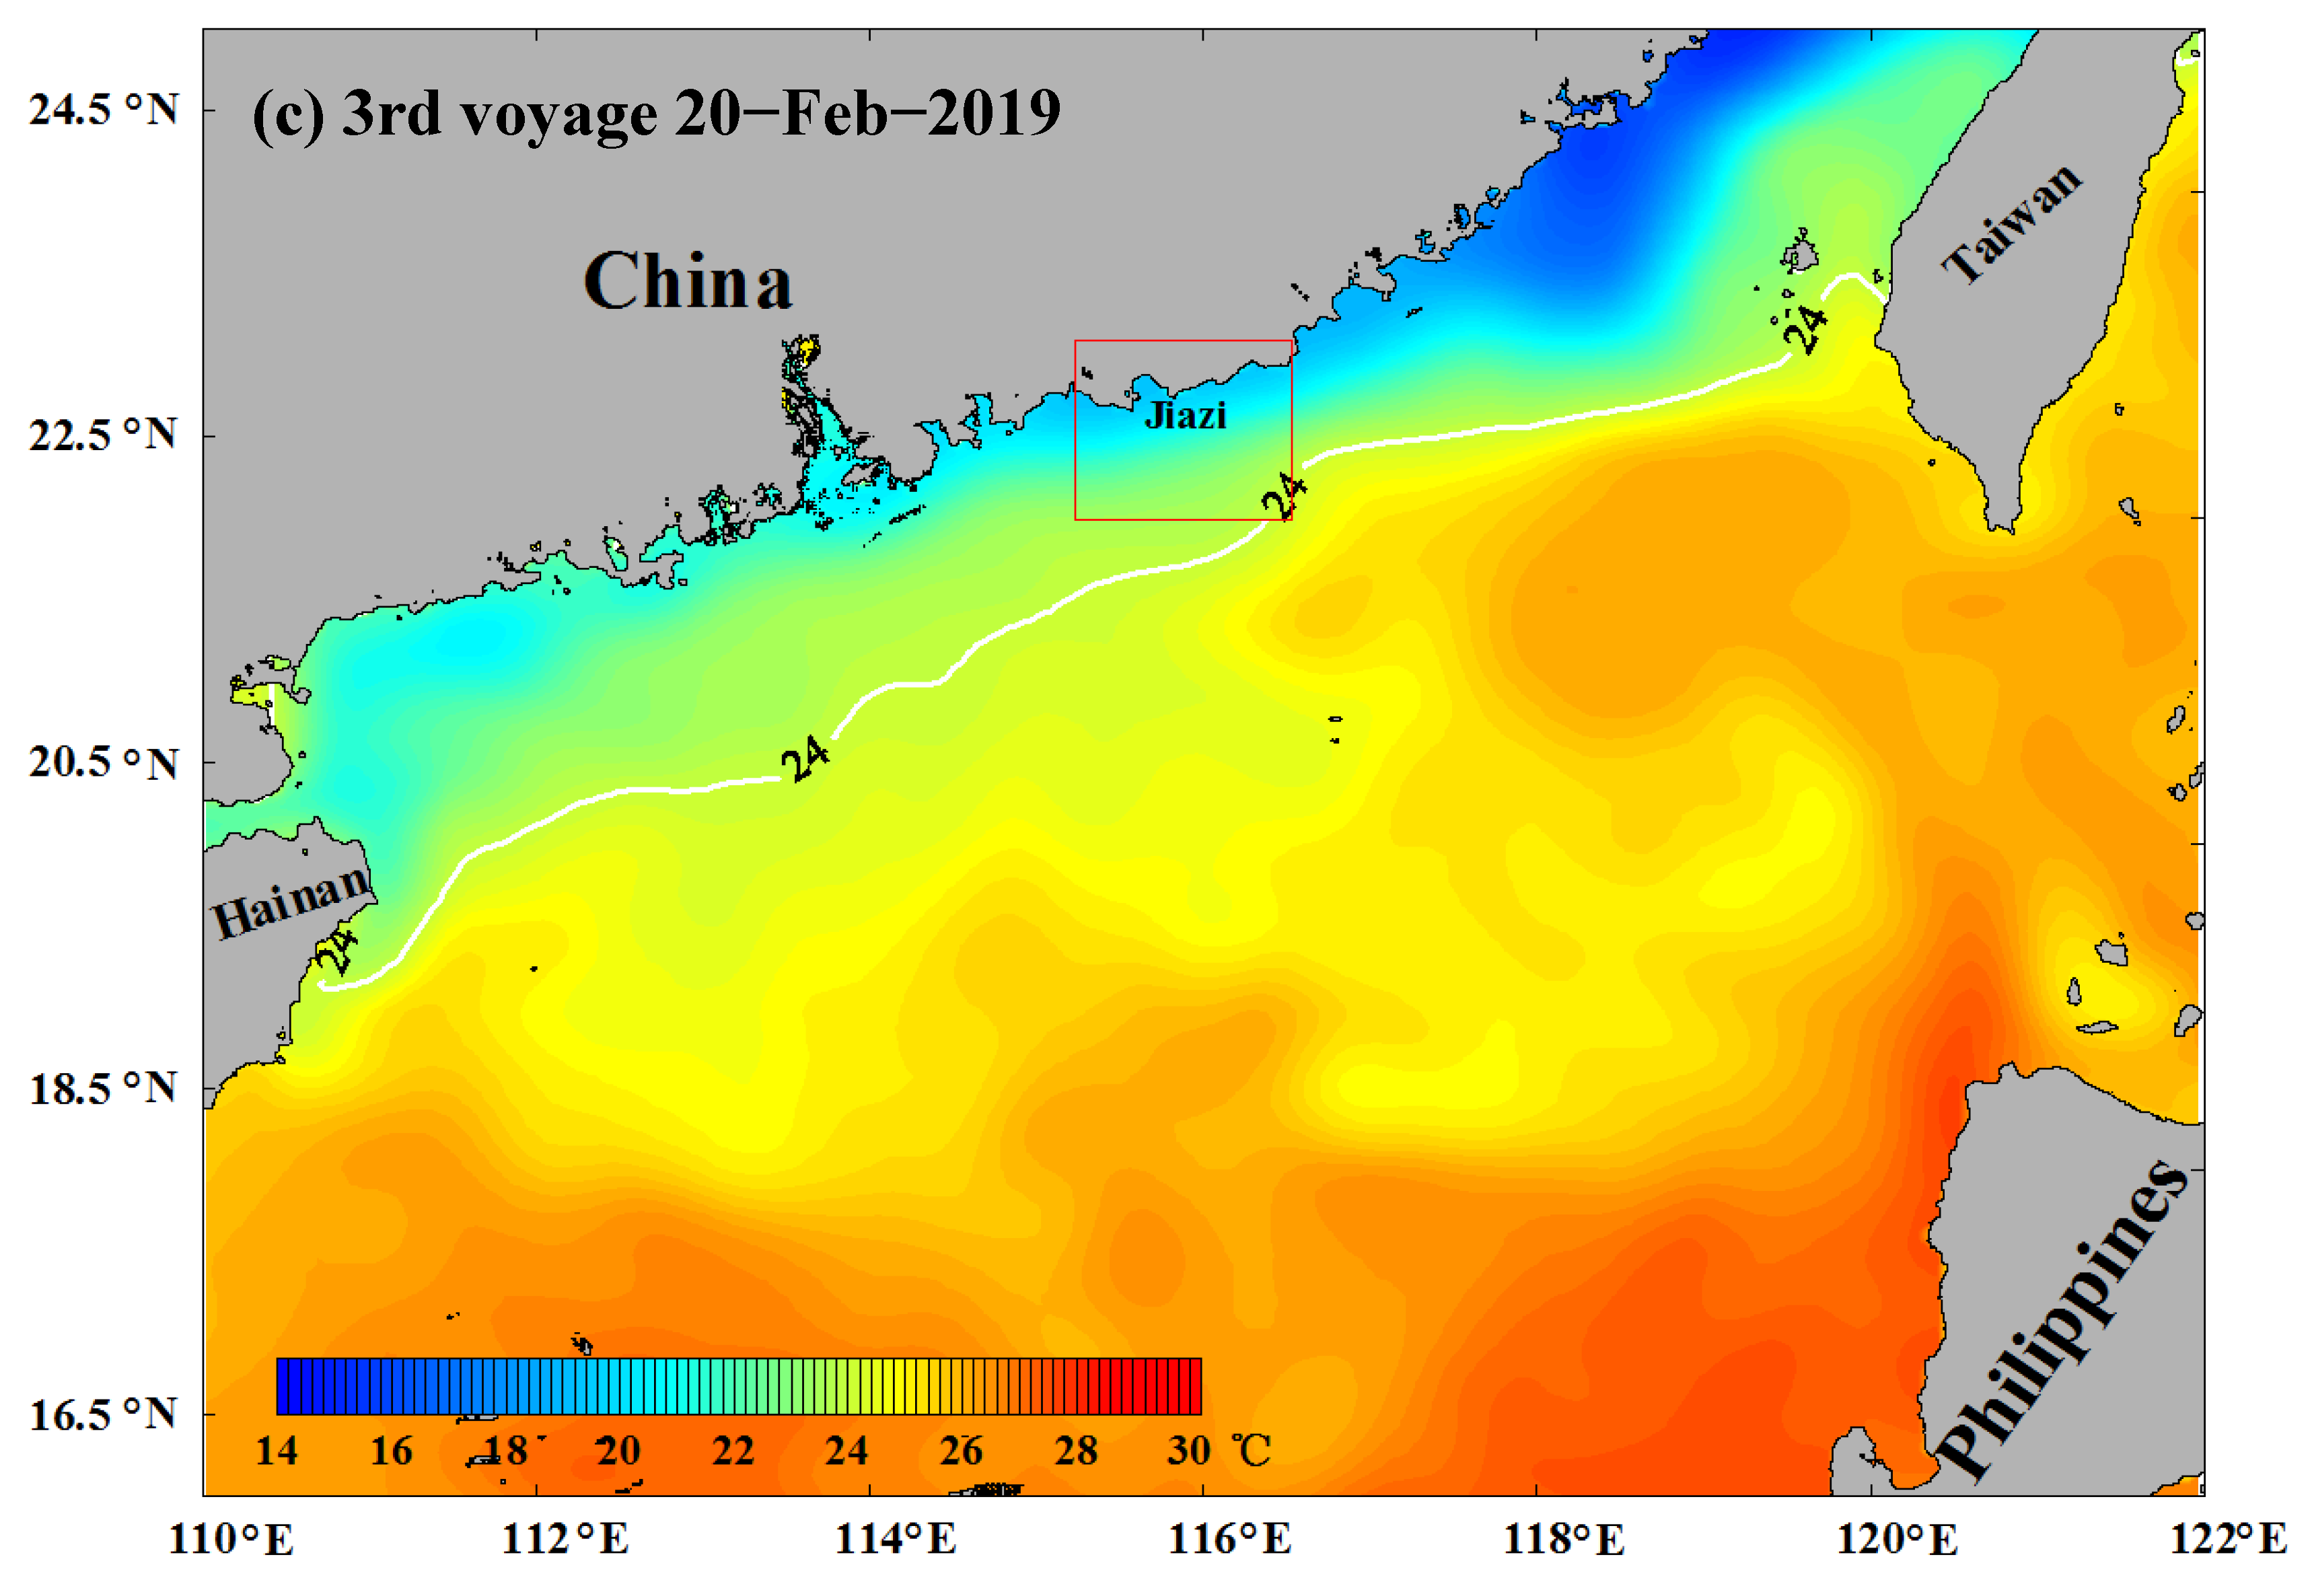
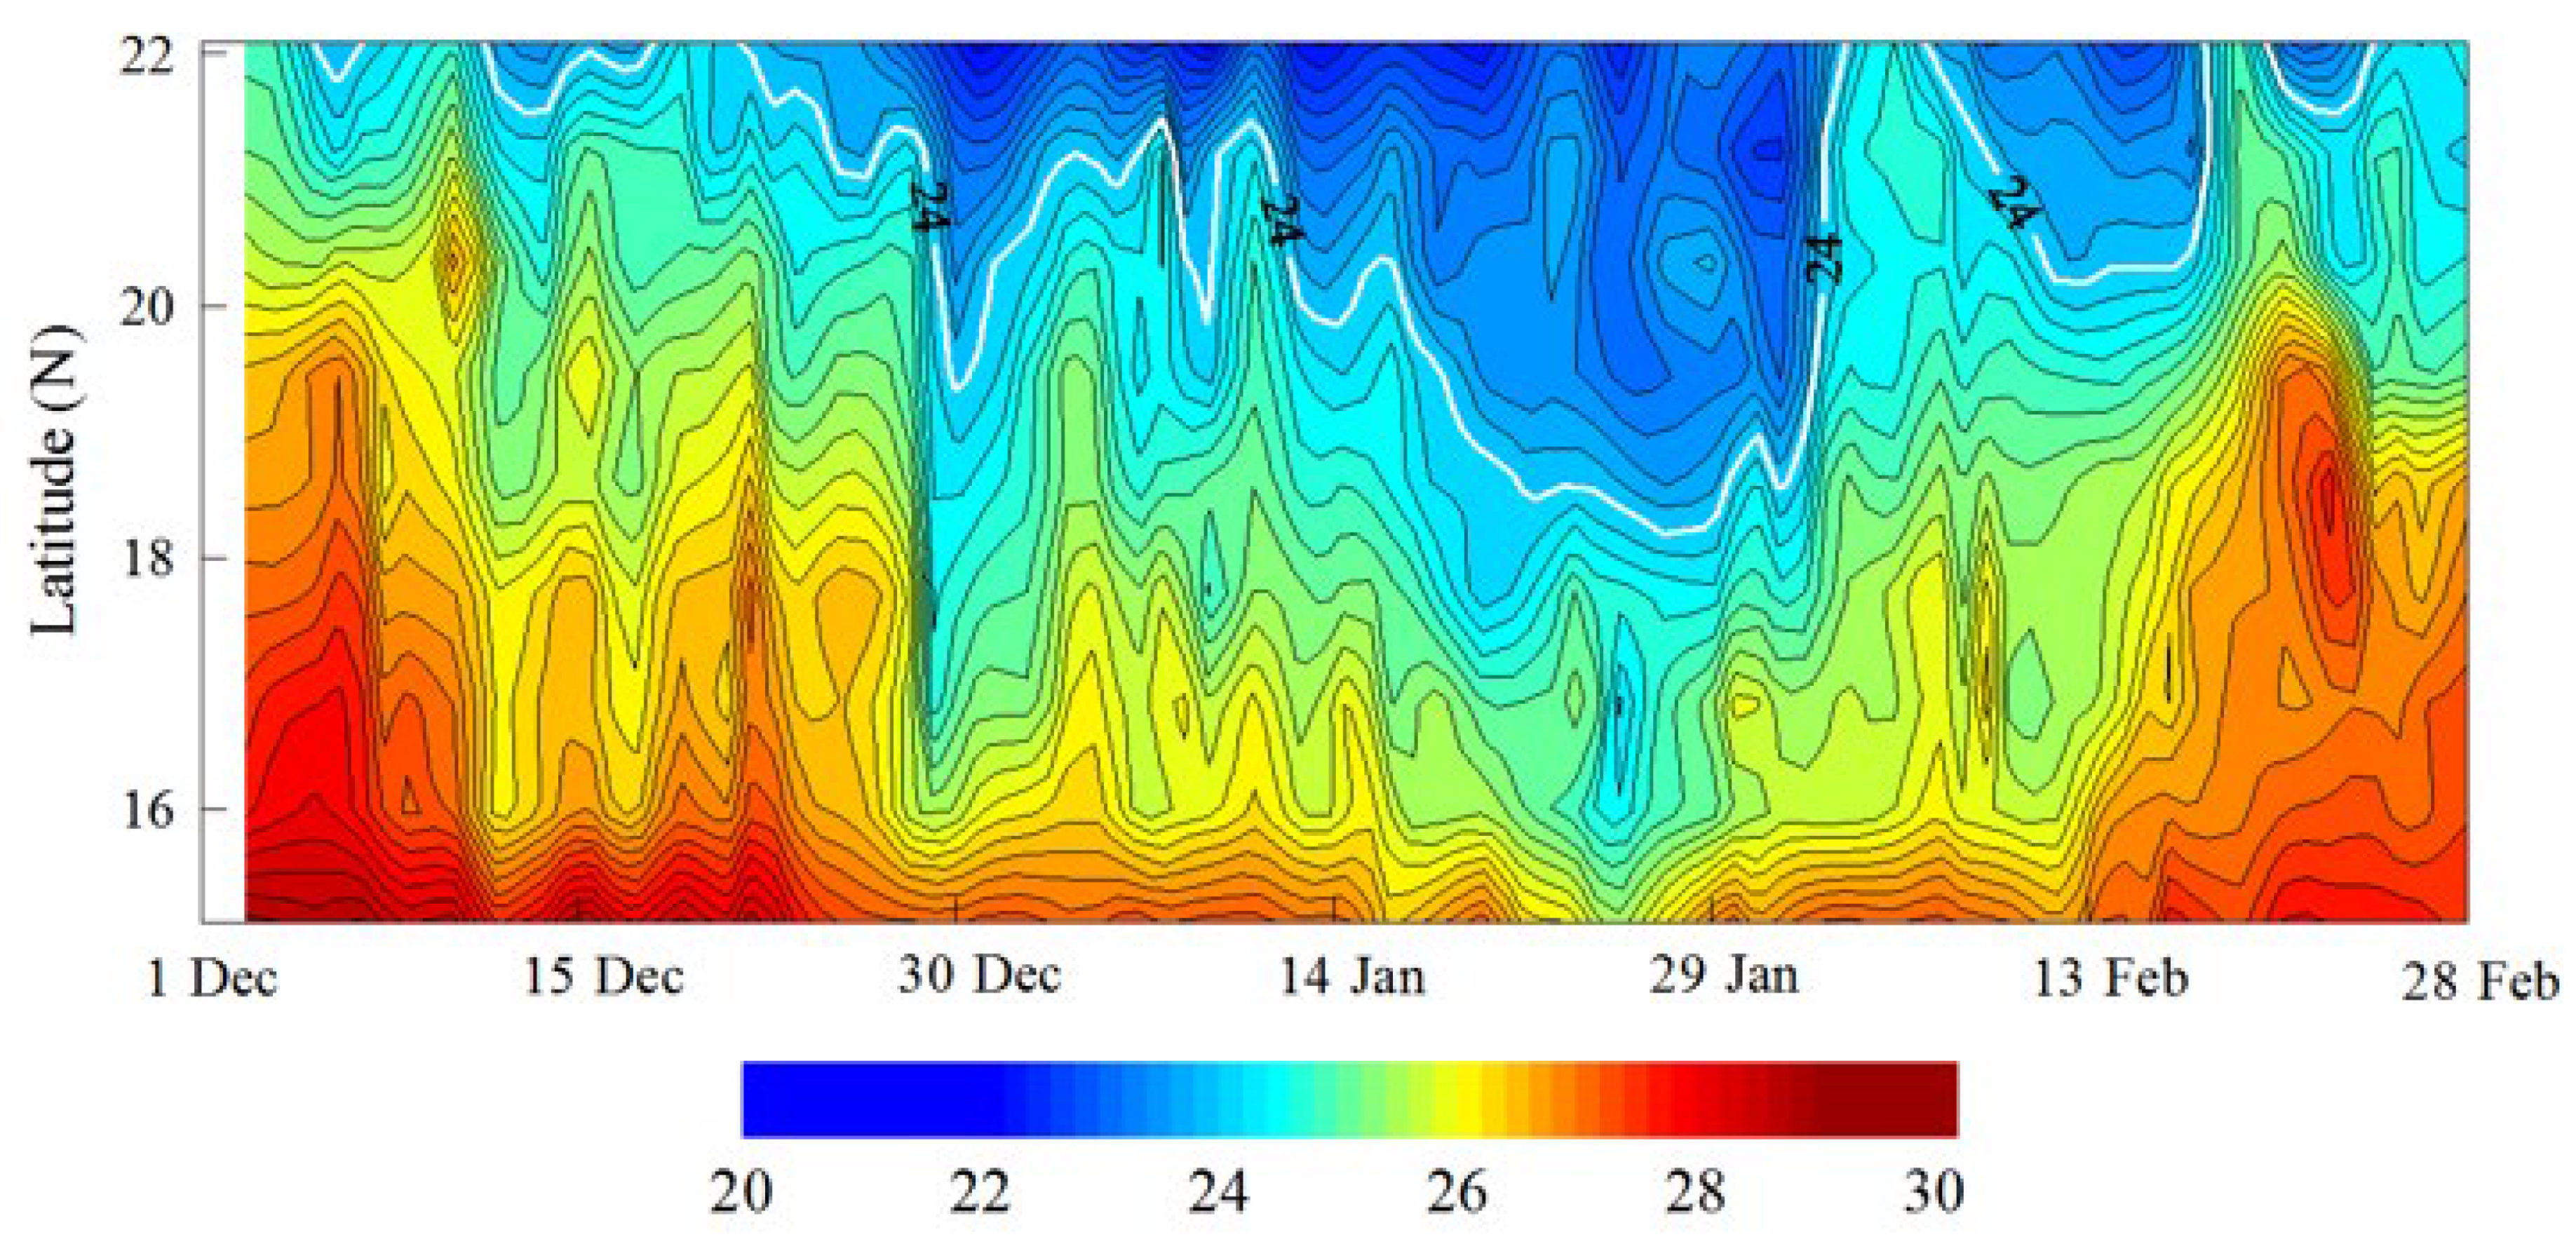
The remote sensing data of sea surface water temperature of 116° E latitude profile during three voyages are analyzed (
Figure 8). It can be seen that the intensity and range of high-temperature water masses in the northeastern South China Sea in the third voyage are obviously larger than those in the first and second voyages. On the third voyage, the sea surface water temperature in the coastal area of the northeastern South China Sea was 24.0 °C, and the observed sea water temperature in the coastal area was 17.3 °C, forming an obvious shore pressure gradient force. By the comparison of
Figure 8 and
Figure 9, it is revealed that counter-wind current occurs when the warm water mass in the northern South China Sea moves northward and the boundary of the warm water mass at 24.0 °C reaches 22° N north latitude. Therefore, the northward movement of the warm water mass in the northeastern South China Sea in winter is the key to the formation of counter-wind current in the northeastern South China Sea in winter.
6. Conclusions
Based on the analysis of the observed data of wind, current, and sea water temperature in the northeastern South China Sea, this paper reveals the formation reasons and evolution law of the counter-wind current in the Jiazi sea area in winter, and argues that the northward movement of the warm water masses in the northeastern South China Sea caused by the relaxation of the northeast monsoon is the key to the formation of the counter-wind current, and the baroclinic gradient force caused by the warm water masses and cold water masses offshore at 116° E is the reason for the formation of the counter-wind current in the sea area east of 116° E. Therefore, it concludes that the winter counter-wind current in the northeastern South China Sea does not occur throughout the winter. A high-frequency northeast current often occurs in the bottom layer of the sea area, it shows that wind stress is not the only influencing factor on the winter counter-wind current in the Jiazi sea area.
The study shows that the formation and disappearance of the counter-wind current in the Jiazi sea area can be divided into four stages: (1) The northeast monsoon gradually relaxes to become the southeast wind, forming the northwest current; (2) The warm water masses on the west side of the Luzon Strait flow to the coastal waters under the action of the ocean current, which generates a significant onshore pressure gradient force and promoting the onshore movement of the sea water; (3) A high-temperature seawater convergence zone is formed in the Jiazi sea area, part of the sea water moves southwest under the action of wind stress, and the other part of the sea water moves Northeast under Ekman and a geostrophic effect which generates the winter counter-wind; therefore, two flow systems with different directions are formed in the sea area near 116° E; (4) The northeast monsoon intensifies and the counter-wind current weakens gradually until it disappears, and the sea water flows to the southwest again.


