Article

3D Numerical Modeling and Quantification of Oblique Wave Forces on Coastal Bridge Superstructures

1
Shenzhen Urban Transport Planning Center Co., Ltd., Shenzhen 518000, China
2
Department of Civil and Environmental Engineering, The Hong Kong Polytechnic University, Hong Kong, China
3
Research Institute for Sustainable Urban Development, The Hong Kong Polytechnic University, Hong Kong, China
*
Author to whom correspondence should be addressed.
J. Mar. Sci. Eng. 2022, 10(7), 860; https://doi.org/10.3390/jmse10070860
Submission received: 4 May 2022 / Revised: 24 May 2022 / Accepted: 26 May 2022 / Published: 23 June 2022

Abstract

:
Simply supported bridges comprise the majority of bridge systems in coastal communities and are susceptible to severe damage from extreme waves induced by storms or tsunamis. However, the effects of oblique wave impacts have been less investigated due to the lack of appropriate numerical models. To address this issue, this study investigates the effects of wave incident angles on coastal bridge superstructures by developing an advanced computational fluid dynamics (CFD) model. Different wave scenarios, including wave height, relative clearance, incident angle, and wavelength are tested. It is found that the maximum wave forces in the horizontal and longitudinal directions could reach 1901 and 862 kN under extreme conditions, respectively, destroying bearing connections. Three surrogate models, i.e., the Gaussian Kriging surrogate model, the Artificial Neural Network (ANN), and the Polynomial Chaos Expansion (PCE), are established by correlating the wave parameters with the maximum wave forces. Through comparisons among the three surrogate models, it is found that the 3-order PCE model has better performance in predicting loads in vertical and horizontal directions, while the ANN model is more suitable for results in the longitudinal direction. This study contributes to the optimized design of coastal bridges and also offers an opportunity for future studies to investigate hazard damage-mitigation measures.

1. Introduction

The prosperous economy in the bay area triggers the construction of more coastal bridges, forming comprehensive transportation networks. The harsh environment, particularly extreme waves and surges induced by tropical cyclones or tsunamis, poses considerable challenges to the structural safety of these infrastructures. According to a post-hazard report, Hurricanes Ivan (2004) and Katrina (2005) led to a USD 2.5 billion loss for the damaged bridge networks [1]. More recently, the 2011 Great East Japan Tsunami destroyed more than 250 coastal bridges [2]. The bearing connections could be damaged by extreme waves, leading to the bridge superstructure being washed away [3,4,5,6]. However, although a design methodology for the tsunami design of skewed bridges is available [7,8], the estimation methods of storm-induced oblique wave load on coastal bridges are still not clear, and more investigations are necessary to improve existing design standards [9].
The wave incident angle is one of the critical issues affecting structural safety, which induces uneven load distributions and large overturning moments on the bridge superstructure. Previous studies on tsunami effects on coastal bridges have proven that large yaw and roll moments will be generated under extreme solitary wave impacts, but relevant studies on storm-induced wave effects are still limited. The hindcast analyses for Hurricane Katrina showed that most of the bridge damages were caused by oblique waves [10]. Among the few relevant studies [11] conducted experiments to measure the oblique wave loads on two typical bridge decks with slab-and-beam and box-culvert cross-sections, but only the wave with a period of 3.0 s was tested. In recent years [12] performed numerical simulations of tsunami-induced forces on skewed bridges using the OpenFOAM software and found that the angle between wave direction and bridge deck would significantly increase the horizontal force [13] conducted laboratory experiments to investigate the influences of wave incident angles. It was also highlighted that the limited observations in that study could not provide a comprehensive understanding of such a complex problem, and further studies on this issue are required [14,15].
Moreover, existing studies on skewed bridges [7,8,16] have proven that the angle of a bridge will lead to a much more complicated phenomenon, since it reduces the lateral force in the direction of the flow propagation (beneficial) but increases it in the other direction (detrimental) [14]. Another significant detrimental effect is the generation of yaw and roll moments, which result in an unequal distribution of both the horizontal and uplift forces in the two bent-caps and in the individual connections and bearings [15,16]. Although the terms “skew angle of a bridge” and “incident angle of a wave” are not exactly the same things, they both generate a complex three-dimensional (3D) wave-bridge interaction, sharing similar difficulties when calculating the maximum loads on the bridge. In the case of a skewed bridge, the bent-caps and abutments are generally designed to be aligned with the flow (so the abutments are skewed relative to the direction of the span length) [14], while in the case of an ‘oblique wave impact on a straight bridge’ the bent caps are not aligned with the flow. Due to the misalignment between the direction of the substructure (bent-caps or abutments) with the flow, the wave-bridge interaction is more complex causing larger impulsive loads and different trends in the steady-state loads than a respective skew bridge.
The oblique wave effects have not been thoroughly investigated, as appropriate numerical models have not been developed until recent years. There are some promising methods that have been used in the past to investigate the wave-bridge interaction such as the Arbitrary Lagrangian-Eulerian (ALE) method [17], the Smoothed Particle Hydrodynamics [18], the Particle Finite Element Method (PFEM) method [19], and the coupled SPH-FEM method [20]. However, the investigations on wave incident angles are still limited, which is mainly because of the fact that (i) it requires the development of sophisticated 3D models allowing waves from different angles; (ii) validation of these numerical models requires prior experimental data of such phenomena, which are very limited; and (iii) the computational fluid dynamics (CFD) process is computationally expensive requiring high performance computer systems. Nonetheless, in recent years, ref. [14] has demonstrated that an incompressible hydrodynamic solver based on the FEM can simulate accurately the solitary wave impacts on skewed bridges and capture all the 3D effects [21]. utilized a Finite Volume Method (FVM) to investigate the tsunami impact on skewed bridges. Moreover, during the wave-bridge interaction, there is an aleatory uncertainty in the wave breaking process [22]. A minor change in the initial water level or height of an unbroken wave can result in a major variability in the impact pressures and forces on a bridge [23], which adds complexity to these investigations. Inspired by these works, this study develops a 3D computational fluid dynamics (CFD) model to investigate oblique wave forces acting on coastal bridges. Different wave heights, wavelengths, relative clearances, and wave incident angles are tested. The maximum wave forces are quantified by using different surrogate models. These results can facilitate the following structural reliability analyses [24,25,26,27,28].
Overall, this study develops a 3D CFD model capable of computing oblique wave forces on coastal bridges. Time histories of wave loads in the x, y, and z directions under different wave heights, wavelengths, relative clearances, and incident angle conditions are computed. The maximum wave forces are quantified by different surrogate models. The remainder of this study is organized as follows: The 3D numerical modeling method is introduced in Section 2. A brief review of different surrogate models that are tested is given in Section 3. Oblique wave impacts and examinations of quantification metamodels are presented in Section 4. Finally, conclusions are drawn in Section 5.

2. 3D Numerical Modeling for Wave–Bridge Interactions

2.1. Model Setups and Boundary Conditions

In this study, the 3D CFD numerical domain was established in the ANSYS Fluent software, as shown in Figure 1a. After building the bridge superstructure model, subtract Boolean was generated with the fluid domain set as target bodies and structure domain set as tool bodies. Waves were generated in the velocity inlet plane ABCD and flowed toward the pressure outlet plane EFGH. Plane BCGF was also set as a pressure outlet with an atmosphere. Other planes were set as stationary walls. In the pressure outlet planes EFGH and BCGF, the free surface level model was utilized as the pressure specification and density interpolation method. The volume-of-fluid method was used as the multiphase model, and the open-channel flow model and open-channel wave boundary conditions were adopted. The SST k-omega model was used as the viscous model, and the turbulence damping factor was set as 10. The turbulence damping factor was set as 2%, and the turbulence viscosity ratio was set as 10%.
After performing mesh sensitivity analyses to satisfy the requirements of the Courant number [29], the tetrahedron meshes with a maximum size of 0.6 m and a minimum size of 0.07 m were utilized to form the whole numerical domain. Under this settlement, there are a total of 2,905,470 meshes in the numerical domain. The corresponding time step was set as 0.0025 s. The CFL number during the CFD process is around 0.25. The results of mesh sensitivity analysis are shown in Figure 1b. The numerical modeling method was validated by the authors’ previous studies [30]. Compared with previous studies [31], in this study, we aimed to improve the structural details of the CFD model by modeling the I-shaped girders, diaphragms, and overhangs of the bridge. To reach this purpose, the meshes in the CFD domain were refined by adding wall layers along the fluid–solid interfaces, producing a smooth distribution along all the structure surfaces. It should be noted that the air and water are assumed as incompressible flows in the established numerical model. The trapped air has a critical role and increases the uplift forces [32,33,34,35,36], as well as the overturning moment [34] on the bridges. Moreover, refs. [35] and [36] indicated the generation of three-dimensional effects even in the case of a normal wave impact on a straight bridge (without any obliqueness) due to the tendency of the air to move in the 3rd direction. The effects of trapped air may be mitigated by setting air venting holes. This study mainly focuses on a 3D numerical modeling method for investigating storm-induced oblique waves. Additional experimental and numerical studies are encouraged to explore the 3D effects of trapped air in future work.
The investigated bridge model in this paper is a typical simply supported bridge designed to carry two-lane traffic on the deck (as Figure 1a), which is commonly used to connect island communities and suffered from severe damage during previous hurricanes [37]. The bridge superstructure is 10.45 m in width, 0.3 m in depth, and 15.85 m in length. There are six I-shaped girders evenly distributed along the width of the deck, and the height of each girder component is 1.05 m. A total of three sets of diaphragms are settled at the two ends and the middle part of the deck, each with a thickness of 0.5 m. The overall density of the concrete and steel is taken as 2.6 × 10³ kg/m3. Hence, the total weight of the superstructure is around 3063 kN/span. The total wave loads on the bridge superstructure are calculated by accumulating the pressures on the structural surface of the bridge model. Detailed information on the bridge model could be found in ref. [14]. This study mainly focuses on the oblique wave impacts on the bridge superstructure and assumes that the substructure would not affect the forces on the superstructure. Effects of the substructures will be explored in future studies.

2.2. Tested Wave Cases

Different water and wave scenarios were tested in this study to explore the oblique wave impacts. Several definitions are given first for the ease of following discussions. As shown in Figure 2a, the distance from the bottom of the bridge girder to the seabed was set as 16.5 m. Different initial water depths before the wave arrived were tested, covering submerged (initial water level exceeds the bottom of girders, clearance Zc < 0 m) and unsubmerged (initial water level does not exceed the bottom of girders, clearance Zc ≥ 0 m) conditions. In the CFD simulations of wave–bridge interactions, linear waves were generated at the velocity inlet domain by setting multiphase open-channel wave boundary conditions. By rotating the bridge model in the computational domain, the wave incident angle θ can be adjusted, as shown in Figure 2b. The coordinate x0y0z0 is the original coordinate system of the cuboid fluid domain, and the coordinate xyz is set for the measurements of oblique wave-induced forces on the bridge model in the horizontal (x), vertical (y), and longitudinal (z) directions.
In addition, determining investigated wave cases is also an important step in quantification since it is rarely practical to study whole wave conditions. The tested water and wave cases should cover a wide range of scenarios that could occur in natural disasters, which is conducive to analyzing how the oblique wave impacts can be attributed to the influences of various input factors (water depth, wave height, etc.), as well as the effects of interactions between these inputs [38]. To serve this purpose well, a random sampling method that provides good coverage of the parameter space and avoids an unconscious bias reflected in the collected data is required [39]. A superior input group is also helpful to facilitate the metamodels to capture data characteristics, optimize the training speed, and improve the applicability of the trained model [40,41]. Recognizing these, the Sobol sequence method [42] was adopted to sample different wave parameters to form the input group, which is a high-efficient quasi-Monte Carlo sequence and has been proven effective in reducing model learning costs [43,44].
While the established numerical model can be used to calculate oblique wave impacts on coastal bridges, these structural demands are not deterministic quantities in real hazards because of aleatory and epistemic uncertainties in the modeling parameters [4]. Probability distributions are, therefore, applied for different parameters considered to be random variables. In this study, we used the simulated sea surface directional wave spectra under hurricane wind forcing [45], which was validated based on buoy observations and NASA Scanning Radar Altimeter (SRA) data obtained during the 1998 Hurricane Bonnie. Accordingly, uniform distributions were used to sample clearance Zc (−2.5~3.5 m), wave height H (4~10 m), and wavelength λ (100~250 m). In addition, because of the symmetry of the bridge structure, the incident angle θ was (0~90°). The sampled water and wave cases are listed in Table 1, and the distributions of each parameter are illustrated in Figure 2c.

3. Surrogate Models for Quantification of Oblique Wave Forces

This section provides an introduction to different surrogate models examined in this study for the prediction of oblique wave forces. The CFD computational results were used as data sources for the model training. These advanced mathematical models can help to approximate and extrapolate the hydrodynamic features during wave–bridge interactions.

3.1. Gaussian Kriging Surrogate Model

The Gaussian Kriging surrogate model is a stochastic process model furnished with features of uncertainty quantification. It has been widely applied in many engineering disciplines [46]. Supposing a function to be approximated has n sampled points and k variables, (as xi = (xi(1),…, xi(k)) for i = 1, …, n), and the associated observation value yi = y(xi), the predicted value Yi can be expressed as
Y i = l = 1 k β l f l ( x i ) + ε ( x i )
where each fl(xi) is a linear or nonlinear function of xi; βl is the coefficient corresponding to the lth variable; ε(xi) is randomly distributed with a mean zero and a variance equals σ.

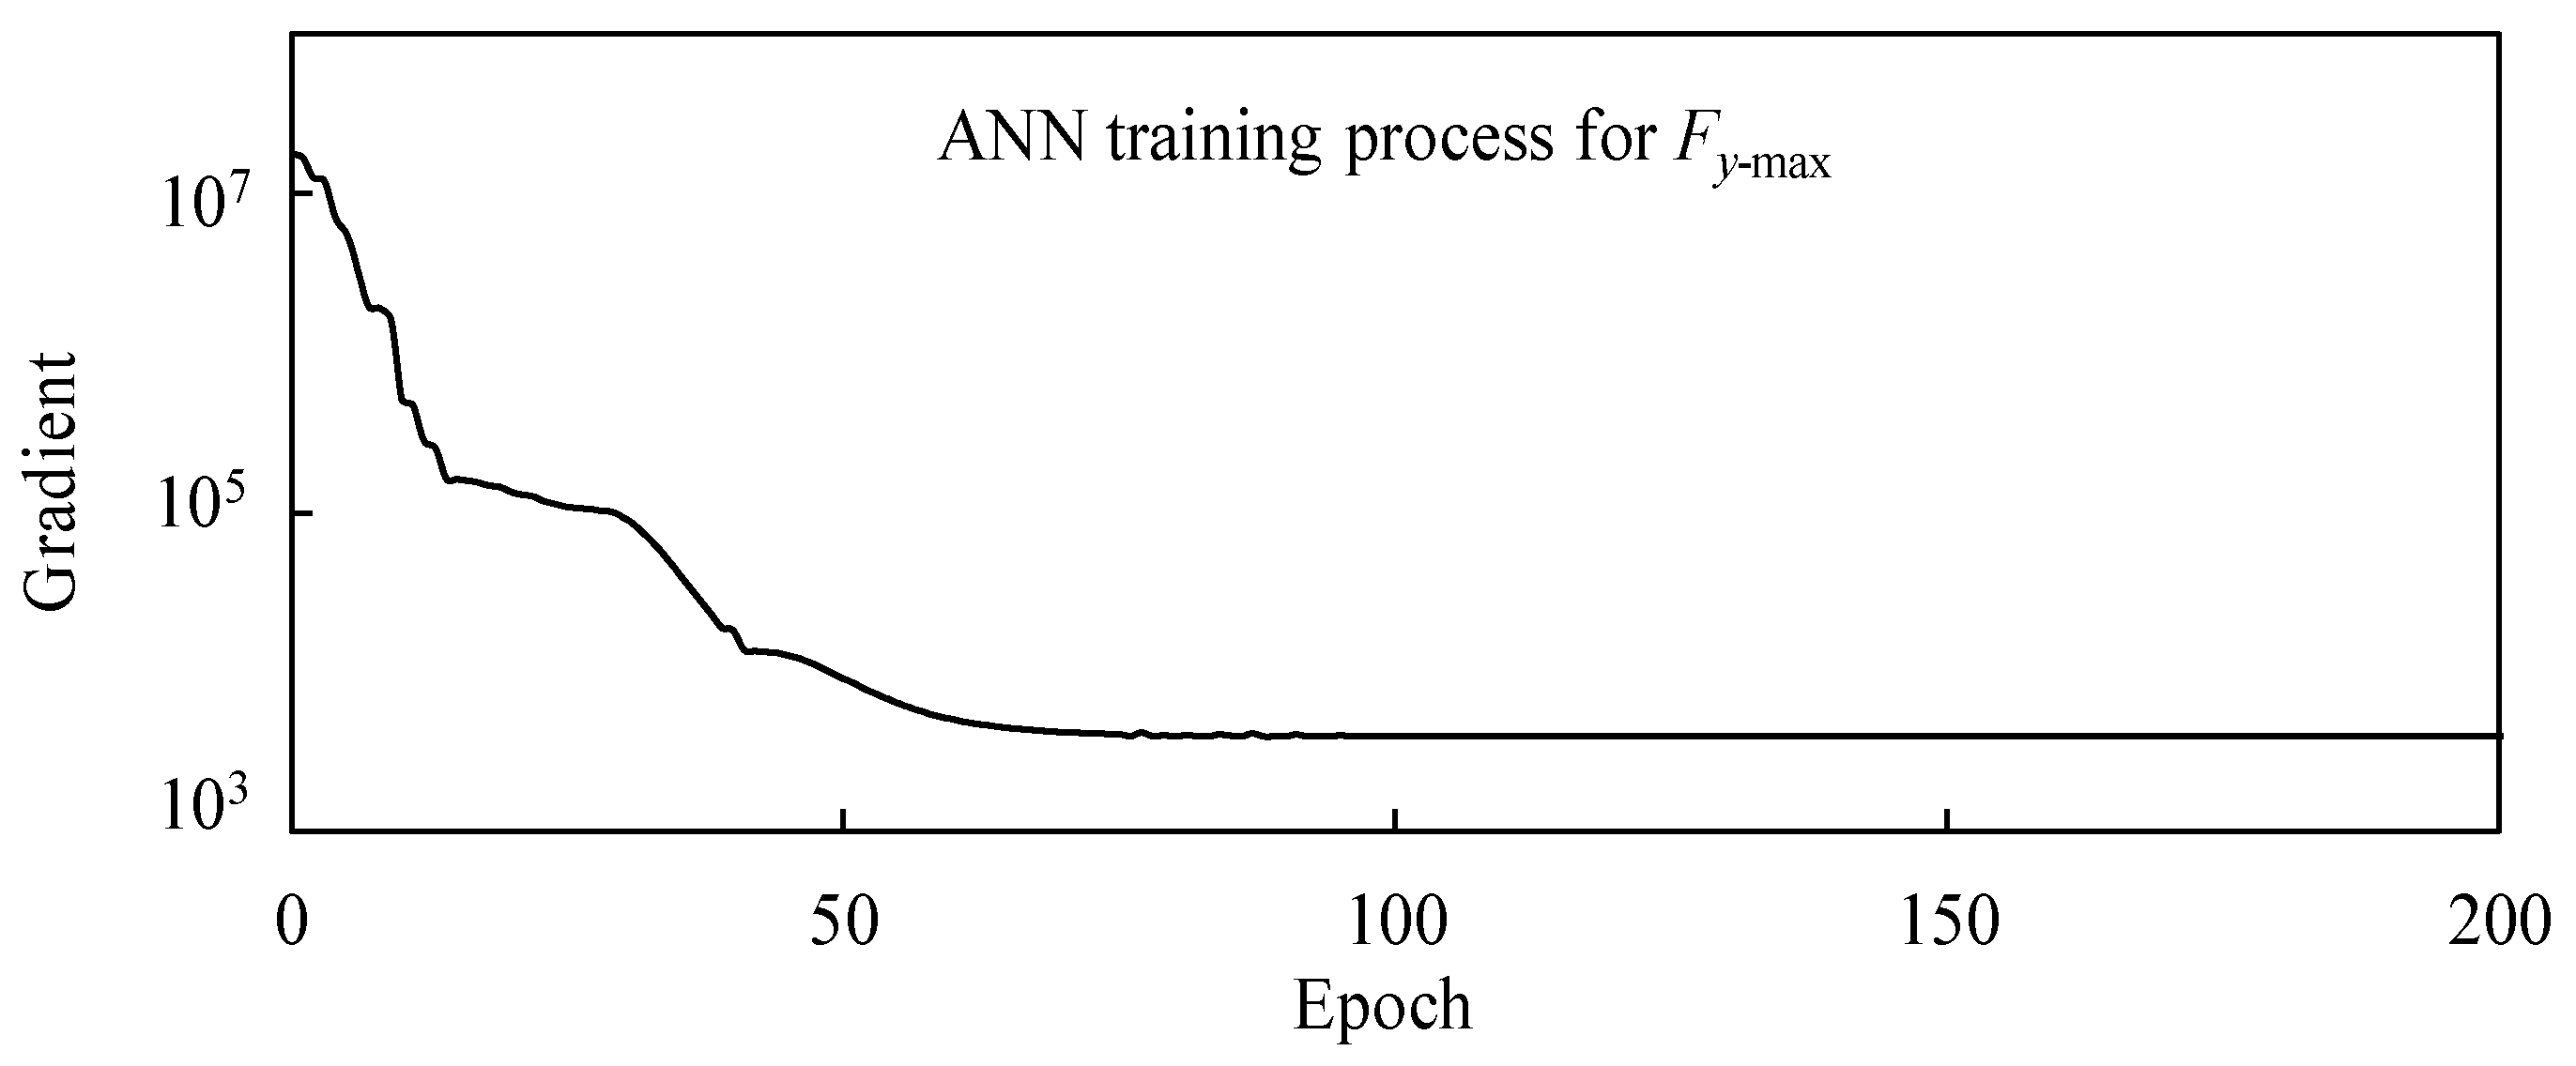
3.2. Artificial Neural Network (ANN)

The artificial neural network (ANN) model is a powerful computing system based on a collection of connected nodes, called artificial neurons, connecting the inputs X and outputs Y [47]. The general structure of an ANN comprises an input layer, an output layer, and several hidden layers formed by neurons. The nonlinear relations between X and Y are modeled through the connections between the neurons, forming a comprehensive network. The output of the jth neuron in the (I + 1)th layer aj(i+1) is a function of the linear combinations of the outputs from the neurons in the previous layer
a j ( i + 1 ) = h m w m ( i ) a m ( i ) + b ( i )
h ( r ) = 1 1 + e r
where h() is the activation function (the commonly used sigmoid function); am(i) is the output from the previous layer; wm(i) is the weight; b(i) is the bias term.

3.3. Polynomial Chaos Expansion (PCE)

The polynomial chaos expansion (PCE) is a widely used metamodel constructed based on the spectral representation of the performance function [48,49]. The key concept of PCE is that the outputs can be expanded to a basis composed of several multivariate polynomials [50]. A typical PCE model can be expressed as
Y = G X = α C α H α X
H α X = i = 1 M ϕ α i i x i
where α is a set of indices mapping to the components of Hα(X); Cα is coefficients; ϕαi(i) is the univariate orthogonal polynomial with respect to the ith variable in degree αi. For practical purposes, the original PCE is truncated to a finite sum by setting the total degree of all the polynomials associated with the input variables smaller than or equal to p as
Y = G A p , k X = α A p , k C α H α X
where Ap,k is the truncation set. In this study, a three-order PCE model (i.e., p = 3) was adopted after several calculations and comparisons, and the total number of coefficients in a PCE (P) could thus be calculated as
P = k + p ! k ! p !
The unknown coefficients Cα (or C) are commonly determined by the projection approach or by the regression approach. In this paper, the least-square minimization method (regression approach) was adopted to calculate the unknown coefficients C by minimizing the mean-square truncation error [50].

4. Oblique Wave-Induced Forces and Metamodeling

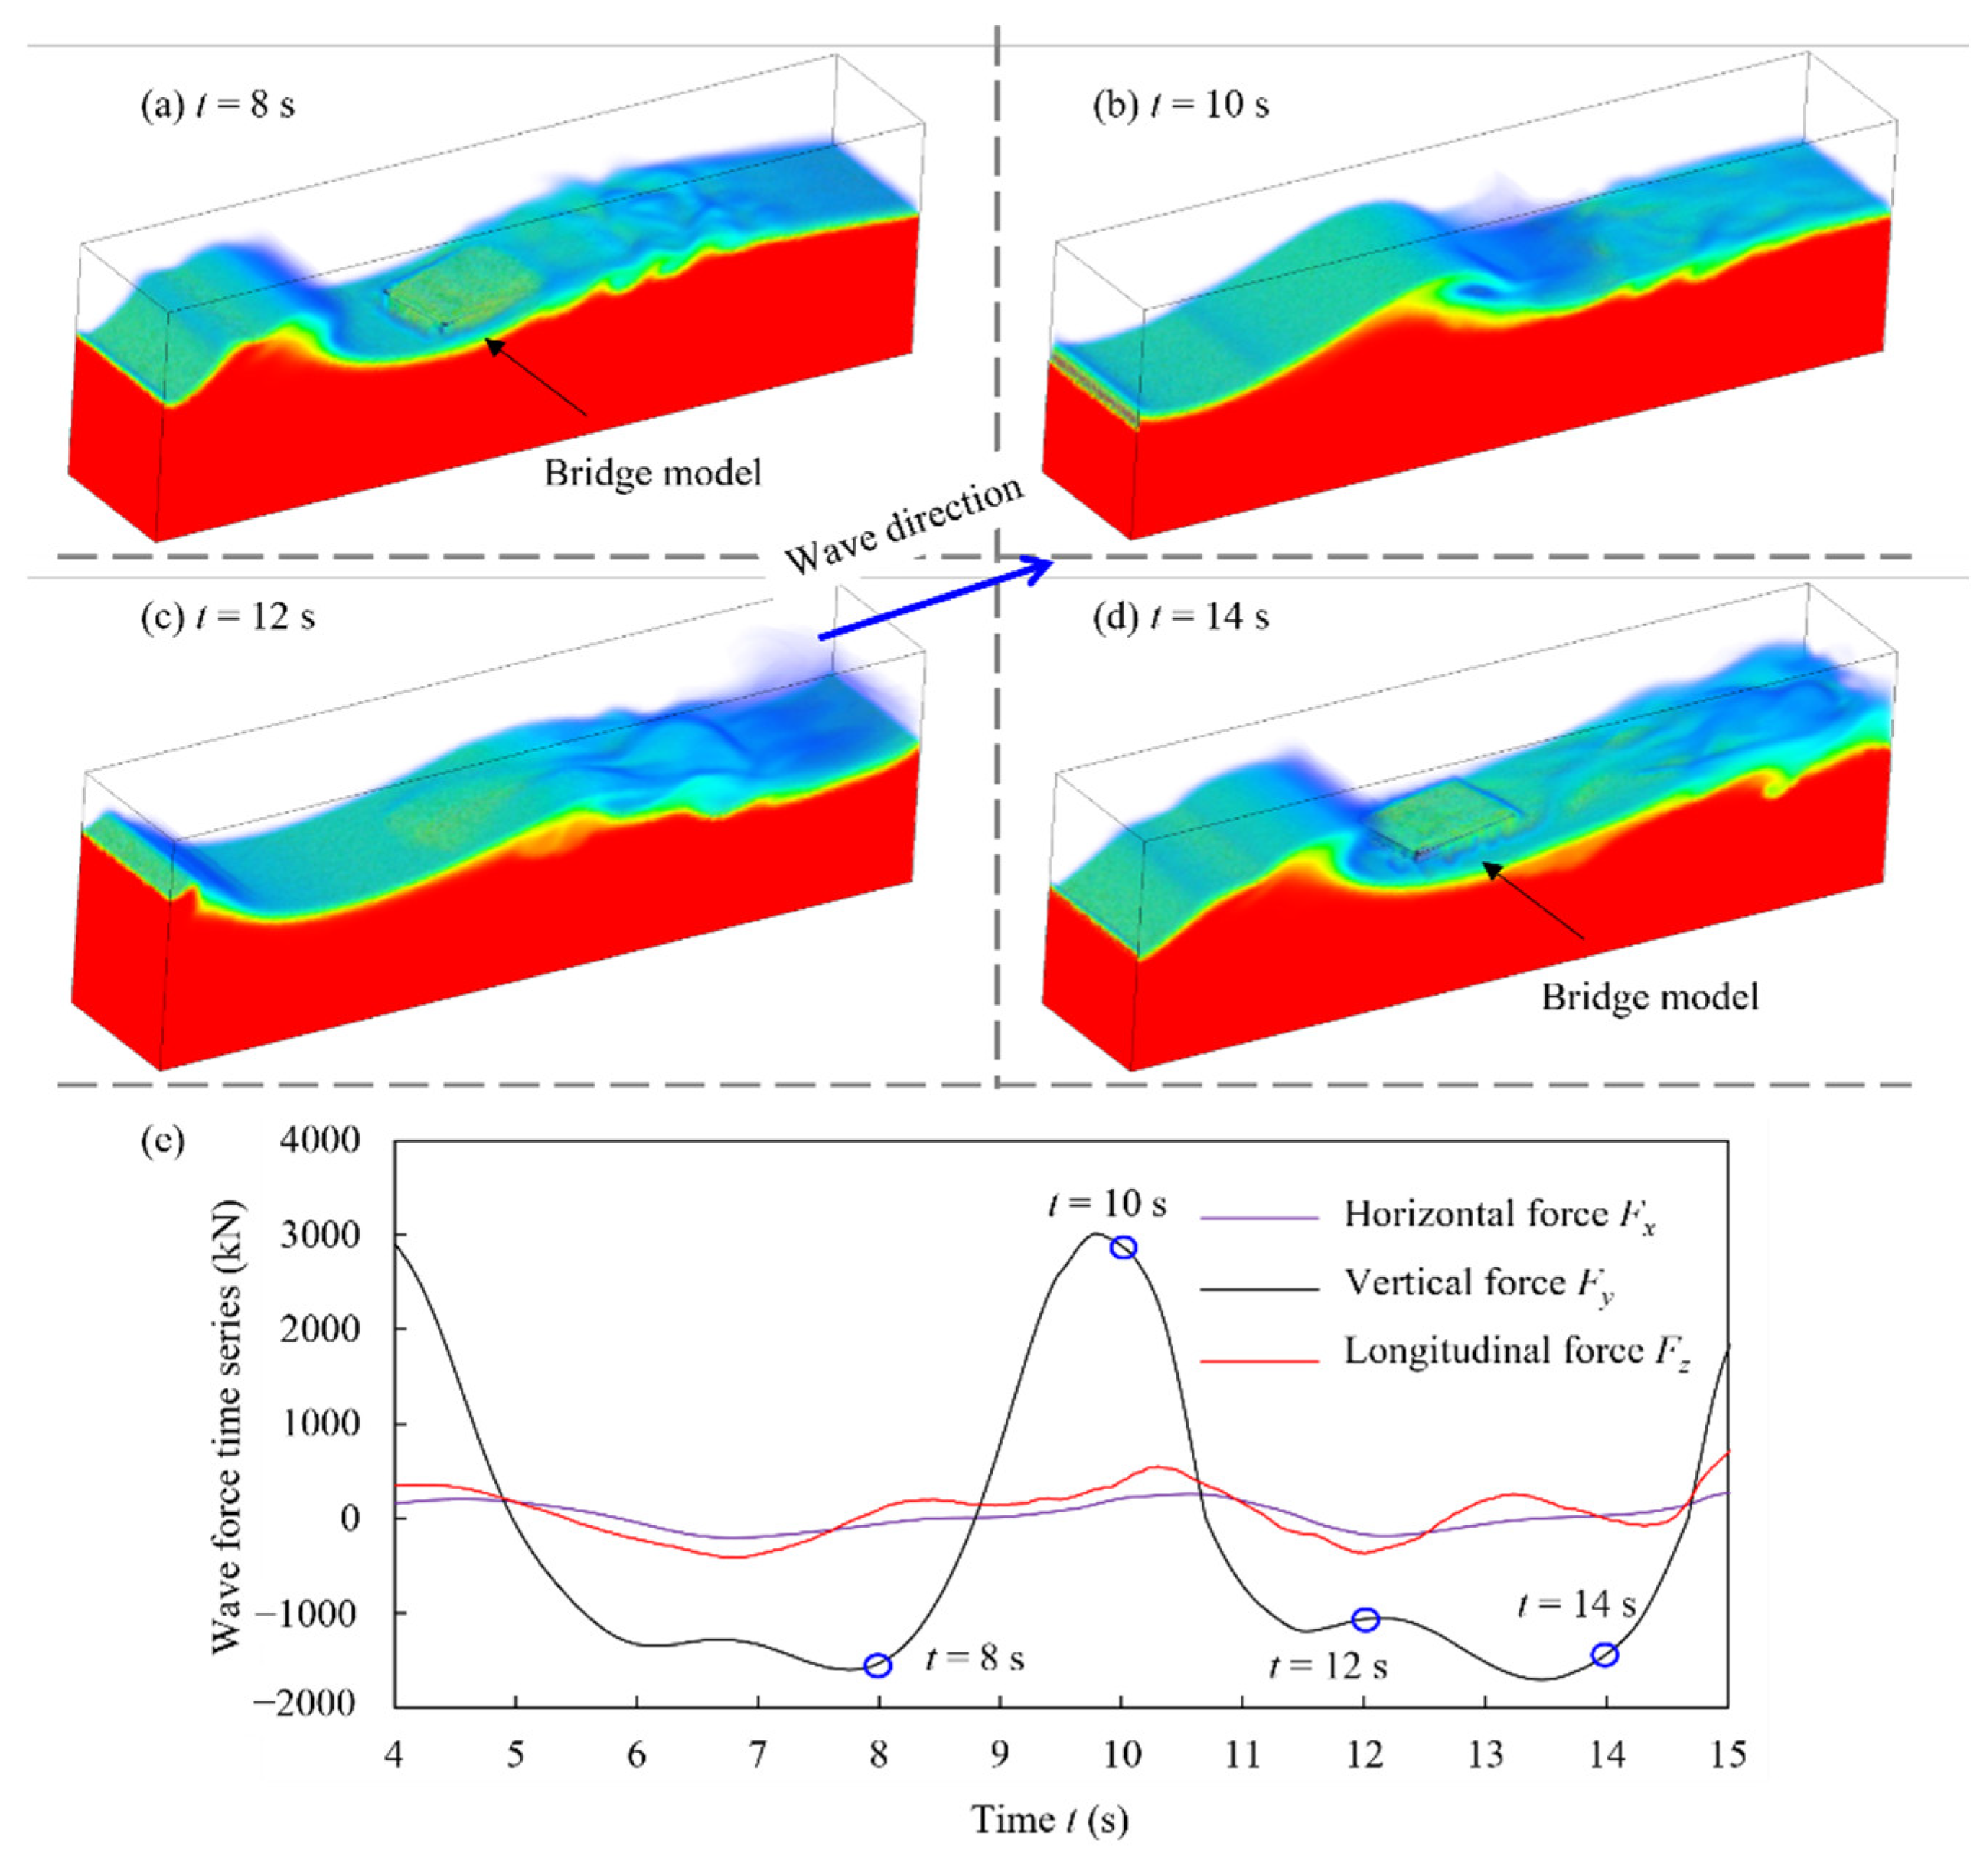
4.1. Time Histories of Oblique Wave Forces

Figure 3 shows one typical example of wave–bridge interaction result for the case of clearance Zc = −2.39 m, wave height H = 9.27 m, wavelength λ = 226 m, and incident angle θ = 77.31°. In this case, the bridge is already submerged beneath the initial water level by storm-induced surges, and massive waves continue to hit the bridge superstructure, generating periodically changing loads. Additionally, there is a large incident angle between the bridge model and the wave forwarding direction, so that it would generate changing wave forces in both horizontal and longitudinal directions. The wave–bridge interactions at representative moments with t = 8, 10, 12, and 14 s are illustrated in Figure 3a–d, and the changing wave forces are shown in Figure 3e.
From Figure 3, it is observed that as the water surface rises, the vertical wave force Fy gradually increases to 3192 kN, as shown in Figure 3e. Fy reaches its positive peak at around t = 10 s, while the maximum values of Fx and Fz occur a little later. Although the bridge is fully submerged at the initial stage and subjected to a large buoyance, Fy reduces to a negative value (around −1565 kN) as the water level drops to the trough (not the static weight of the structure). Such wave-induced downward load is relatively small, compared with normal traffic load, which means the bridge is less likely to be crushed by wave impacts. However, it is worth noting that the maximum longitudinal force Fz-max is larger than the maximum horizontal force Fx-max (288 kN and 506 kN, respectively). In the general design of such kinds of simply supported bridges, the constraints for the superstructure are mainly contributed by the bearing connections beneath the girders [51]. The connections are assumed as elastomeric bearings for the investigated bridge. The limit state is defined as the state where the failure of the bearing occurs. Once the bearing is damaged, it needs to be repaired immediately, otherwise, it will affect the normal traffic use. These bearings usually have a large capacity in the vertically downward direction (y) and horizontal direction (x), but the resistance in the longitudinal direction (z) is relatively small. This means the bearing connections could be damaged by the wave forces in the longitudinal direction (z), and once damaged, they will lose their constraints in the other directions (x and y), leading to the deck overturning or unseating failure [51]. Therefore, it is of vital importance to quantify the varying loads on coastal bridges subjected to oblique wave impacts and consider these effects in the design stage. The results of another representative unsubmerged case with clearance Zc = 0.21 m, wave height H = 7.06 m, wavelength λ = 178 m, and incident angle θ = 40.54° are shown in Figure 4. The maximum vertical, horizontal, and longitudinal forces can reach 533, 2413, and 250 kN, respectively.

4.2. Maximum Wave Forces under Different Scenarios

For an in-depth understanding of the oblique wave impacts, the maximum forces (Fx-max, Fy-max, and Fz-max) were obtained from the time histories of the wave forces and are plotted in Figure 5 and Figure 6. The computed results of the tested cases are listed in Table 2. The colors of the circular marks in the figures correspond to the wave incident angles, and the sizes are proportional to the values of wave forces. Several typical results are marked with arrows. Figure 5 shows the results under unsubmerged conditions. Generally, Fz-max has a much larger magnitude than Fx-max and Fy-max in most cases and could exceed the static weight of the bridge superstructure under extreme conditions, which is around 3063 kN per span [51]. The values of Fx-max and Fz-max highly depend on the wave incident angle. Fz-max is larger than Fx-max in most cases when θ > 60°, as marked by the yellow and orange circles in Figure 5c. Results under submerged conditions are presented in Figure 6. Similar characteristics are observed except that the peak values of Fy-max are much smaller than those under unsubmerged conditions, while the results of Fx-max and Fz-max are very close in these two scenarios. Although the bridge is affected by buoyancy when it is submerged, the smaller Fy-max indicates that the vertical uplift force is mainly contributed by the impulse impact under unsubmerged conditions. Conversely, the effects of Fz-max could be more critical to structural safety under oblique wave impacts considering the insufficient constraints in the longitudinal direction (z). Besides, the bridge is assumed as a rigid body in the established numerical model, which means the structural dynamics are not considered. The dynamic characteristics have been proven significant in previous studies on tsunami waves and breaking waves [52,53,54]. These dynamic structural characteristics should also be investigated for oblique wave impacts in future studies.

4.3. Quantifications of Maximum Wave Forces Using Different Surrogate Models

The established numerical model provides reliable results under different wave conditions but may lead to expensive or even prohibitive computational costs when it requires large-scale calculations, such as fragility and risk assessment. Thus, how to quantify the complex relationships between the maximum wave forces and these wave parameters to the greatest extent is also a critical step. Conventional methods estimated wave loads using empirical formulas summarized based on experimental or numerical data; however, this method cannot accurately measure the effects of each parameter and their interactions. Additionally, the introduction of the incident angle makes it more complicated. Recognizing this, this study used advanced stochastic techniques to predict the maximum wave forces under different wave scenarios. In this section, the performance of different surrogate models (the ANN model, Kriging model, and three-order PCE model) are examined and compared. The coefficient of determination (R2) and root-mean-square error (RMSE) were adopted as the goodness of prediction.
In this study, the ANN metamodel was trained using the stochastic gradient descent method, which uses randomness to find the optimal weights and bias from the inputs to the outputs. The network weights were first initialized randomly. To this end, 70% of the datasets were used to train the neural model, 15% were used as a validation set, and the remaining 15% were retained to test the trained data. After several calculations and comparisons, 3 hidden layers were adopted, and 10 neurons are used in each layer. The Bayesian Regularization algorithm was employed as the transfer function. A typical example of the gradient descent during the training process for Fy-max is shown in Figure 7. The gradient gradually converged after 100 epochs.
After several calculations and comparisons, the fitting results and prediction performance for Fx-max, Fy-max, and Fz-max by using different metamodels were determined, which are listed in Table 3. For most of the cases, the Kriging surrogate model has a smaller R2 than the other two models. The Kriging model fails to capture the characteristics of the sampling data well, which also means a larger volume of data is required for a better prediction performance, increasing the computational cost. On the other hand, the three-order PCE has the largest R2 in most cases, and the results of the ANN model are in between. The RMSE values from the three-order PCE and ANN models are close when predicting Fx-max and Fy-max. For Fz-max, the ANN model results in a much smaller RMSE, compared with the PCE model, indicating a smaller prediction bias and better performance. Thus, the ANN model is adopted for the prediction of maximum wave loads in the following fragility analyses. It should be noted that the trained surrogate models are only applicable to the investigated bridge model, which mainly considers the effects of different wave parameters. Previous studies have proven that the bridge dimensions also have significant effects on the wave-induced loads [4,32]. Thus, more investigations on different structural dimensions are recommended in future studies, to ultimately reach a flexible prediction model which could be applied for different bridge and hazard scenarios.

5. Conclusions

In this study, an elaborate 3D CFD numerical model was developed to investigate oblique wave impacts on coastal bridges. Time histories of wave-induced forces in the horizontal (x), vertical (y), and longitudinal (z) directions were computed, and the maximum values were quantified by using different surrogate models. The developed 3D CFD model has superior performance in calculating wave load distributions on coastal bridges for its spatial advantages and structural details. More relevant studies are required to study the responses of bearing constraints under changing loading distributions. The maximum oblique wave forces were quantified by using ANN surrogate models with different wave parameters, including wave height, relative clearance, wave incident angle, and wavelength.
Overall, this study provides a preliminary numerical investigation of oblique wave impacts on coastal bridges, providing data reference for future studies and design standards. More experimental and parameterizing studies on oblique wave impacts are encouraged to improve existing design specifications.

Author Contributions

Conceptualization, L.J. and D.Z.; methodology, L.J. and Y.Z.; writing—original draft preparation, L.J. and D.Z.; writing—review and editing, Y.Z.; supervision, Y.D.; funding acquisition, Y.D. All authors have read and agreed to the published version of the manuscript.

Funding

This research was funded by the National Key R&D Program of China (No. 2019YFB2102703).

Institutional Review Board Statement

Not applicable.

Informed Consent Statement

Not applicable.

Data Availability Statement

Not applicable.

Acknowledgments

The opinions and conclusions presented in this paper are those of the authors and do not necessarily reflect the views of the sponsoring organizations.

Conflicts of Interest

The authors declare no conflict of interest.

References

  1. Padgett, J.; DesRoches, R.; Nielson, B.; Yashinsky, M.; Kwon, O.S.; Burdette, N.; Tavera, E. Bridge damage and repair costs from Hurricane Katrina. J. Bridg Eng. 2008, 13, 6–14. [Google Scholar] [CrossRef] [Green Version]
  2. Salem, H.; Mohssen, S.; Kosa, K.; Hosoda, A. Collapse analysis of Utatsu Ohashi bridge damaged by Tohuku Tsunami using applied element method. J. Adv. Concr. Technol. 2014, 12, 388–402. [Google Scholar] [CrossRef] [Green Version]
  3. Salem, H.; Mohssen, S.; Nishikiori, Y.; Hosoda, A. Numerical collapse analysis of Tsuyagawa bridge damaged by tohoku tsunami. J. Perform. Constr Facil. 2016, 30, 04016065. [Google Scholar] [CrossRef]
  4. Ataei, N.; Padgett, J.E. Fragility assessment of coastal bridges under hurricane events using enhanced probabilistic capacity models. In Advances in Hurricane Engineering: Learning from Our Past—Proceedings of the 2012 ATC and SEI Conference on Advances in Hurricane Engineering, Miami, FL, USA, 24–26 October 2012; American Society of Civil Engineers (ASCE): Reston, VA, USA, 2012. [Google Scholar] [CrossRef]
  5. Istrati, D.; Buckle, I.; Lomonaco, P.; Yim, S. Deciphering the tsunami wave impact and associated connection forces in open-girder coastal bridges. J. Mar. Sci. Eng. 2018, 6, 148. [Google Scholar] [CrossRef] [Green Version]
  6. Xiang, T.; Istrati, D. Assessment of extreme wave impact on coastal decks with different geometries via the arbitrary lagrangian-eulerian method. J. Mar. Sci. Eng. 2021, 9, 1342. [Google Scholar] [CrossRef]
  7. Istrati, D.; Buckle, I.G. Tsunami Loads on Straight and Skewed Bridges–Part 2: Numerical Investigation and Design Recommendations (No. FHWA-OR-RD-21-13). 2021. Available online: https://rosap.ntl.bts.gov/view/dot/55947 (accessed on 3 May 2022).
  8. Istrati, D.; Buckle, I.G. Tsunami Loads on Straight and Skewed Bridges–part 1: Experimental Investigation and Design Recommendations (No. FHWA-OR-RD-21-12). 2021. Available online: https://rosap.ntl.bts.gov/view/dot/55988 (accessed on 3 May 2022).
  9. AASHTO. Guide Specifications for Bridges Vulnerable to Coastal Storms; American Association of State Highway and Transportation Officials: Washington, DC, USA, 2008. [Google Scholar]
  10. Hu, K.; Chen, Q. Directional spectra of hurricane-generated waves in the Gulf of Mexico. Geophys. Res. Lett. 2011, 38. [Google Scholar] [CrossRef]
  11. Denson, K.H. Wave Forces on Causeway-Type Coastal Bridges: Effects of Angle of Wave Incidence and Cross-Section Shape; Water Resources Research Institute, Mississippi State University: Mississippi State, MS, USA; Federal Highway Administration: Washington, DC, USA, 1980; Available online: https://www.engineeringvillage.com/share/document.url?mid=ntis_2c04e8f791371236M45df19817173108&database=nti (accessed on 3 May 2022).
  12. Motley, M.R.; Wong, H.K.; Qin, X.; Winter, A.O.; Eberhard, M.O. Tsunami-induced forces on skewed bridges. J. Waterw. Port. Coast. Ocean. Eng. 2016, 142, 04015025. [Google Scholar] [CrossRef]
  13. Fang, Q.; Hong, R.; Guo, A.; Li, H. Experimental investigation of wave forces on coastal bridge decks subjected to oblique wave attack. J. Bridg Eng. 2019, 24, 04019011. [Google Scholar] [CrossRef]
  14. Yuan, P.; Zhu, D.; Dong, Y.; Xu, G. Response-based bridge deck limit state considering component-level failure under extreme wave. Mar. Struct. 2022, 83, 103184. [Google Scholar] [CrossRef]
  15. Zhu, D.; Li, Y.; Dong, Y.; Yuan, P. Long-term loss assessment of coastal bridges from hurricanes incorporating overturning failure mode. Adv. Bridg Eng. 2021, 2, 1–15. [Google Scholar] [CrossRef]
  16. Lomonaco, P.; Istrati, D.; Maddux, T.; Buckle, I.; Yim, S.; Xiang, T. Large-scale testing of tsunami impact forces on bridges. In Proceedings of the Application of Physical Modelling in Coastal and Port Engineering and Science (COASTLAB16), Ottawa, Canada, 10–13 May 2016. [Google Scholar]
  17. Xiang, T.; Istrati, D.; Yim, S.C.; Buckle, I.G.; Lomonaco, P. Tsunami loads on a representative coastal bridge deck—Experimental study and validation of design equations. J. Waterw Port. Coast. Ocean. Eng. 2020, 146, 04020022. [Google Scholar] [CrossRef]
  18. Sarfaraz, M.; Pak, A. SPH numerical simulation of tsunami wave forces impinged on bridge superstructures. Coast. Eng. 2017, 121, 145–157. [Google Scholar] [CrossRef]
  19. Zhu, M.; Elkhetali, I.; Scott, M.H. Validation of open sees for tsunami loading on bridge superstructures. J. Bridge. Eng. 2018, 23, 04018015. [Google Scholar] [CrossRef]
  20. Hasanpour, A.; Istrati, D.; Buckle, I. Coupled SPH–FEM modeling of tsunami-borne large debris flow and impact on coastal structures. J. Mar. Sci. Eng. 2021, 9, 1068. [Google Scholar] [CrossRef]
  21. Motley, M.R.; Lemoine, G.I.; Livermore, S.N. Three-dimensional loading effects of tsunamis on bridge superstructures. In Proceedigns of the Structures Congress 2014, Boston, MA, USA, 3–5 April 2014; American Society of Civil Engineers (ASCE): Reston, VA, USA, 2014. [Google Scholar] [CrossRef]
  22. Ghosh, S.; Reins, G.; Koo, B.; Wang, Z.; Yang, J.; Stern, F. Plunging wave breaking: EFD and CFD. In Proceedings of the International Conference on Violent Flows, Kyushu University, Fukuoka, Japan, 20–22 November 2007; Research Institute for Applied Mechanics; Kyushu University: Fukuoka, Japan, 2007; Available online: http://user.engineering.uiowa.edu/~yng/papers/ghoshs_etal_vf4.pdf (accessed on 3 May 2022).
  23. Istrati, D. Large-scale experiments of tsunami inundation of bridges including fluid-structure-interaction. Ph.D. Dissertation, University of Nevada, Reno, NV, USA, 2017. Available online: https://scholarworks.unr.edu//handle/11714/2030 (accessed on 3 May 2022).
  24. Li, Y.; Dong, Y.; Zhu, D. Copula-based vulnerability analysis of civil infrastructure subjected to hurricanes. Front. Built Environ. 2020, 6, 571911. [Google Scholar] [CrossRef]
  25. Zhu, D.; Li, Y.; Dong, Y. Reliability-based retrofit assessment of coastal bridges subjected to wave forces using 3D CFD simulation and metamodeling. Civ. Eng. Environ. Syst. 2021, 38, 59–83. [Google Scholar] [CrossRef]
  26. Ataei, N.; Padgett, J.E. Probabilistic modeling of bridge deck unseating during hurricane events. J. Bridg Eng. 2013, 18, 275–286. [Google Scholar] [CrossRef]
  27. Saeidpour, A.; Chorzepa, M.G.; Christian, J.; Durham, S. Probabilistic hurricane risk analysis of coastal bridges incorporating extreme wave statistics. Eng. Struct. 2019, 182, 379–390. [Google Scholar] [CrossRef]
  28. Zhu, D.; Yuan, P.; Dong, Y. Probabilistic performance of coastal bridges under hurricane waves using experimental and 3D numerical investigations. Eng. Struct. 2021, 242, 112493. [Google Scholar] [CrossRef]
  29. Robertsson, O.A.; Blanch, J.O. Numerical methods, finite difference. In Encyclopedia of Solid Earth Geophysics; Springer: Cham, Switzertland, 2020; pp. 1–9. [Google Scholar] [CrossRef]
  30. Zhu, D.; Dong, Y.; Frangopol, D.M. Experimental and numerical investigation on wave impacts on box-girder bridges. Struct. Infrastruct. Eng. 2020, 1–19. [Google Scholar] [CrossRef]
  31. Zhu, D.; Dong, Y. Experimental and 3D numerical investigation of solitary wave forces on coastal bridges. Ocean. Eng. 2020, 209, 107499. [Google Scholar] [CrossRef]
  32. McPherson, R.L. Hurricane induced wave and surge forces on bridge decks. Ph.D. Thesis, Texas A&M University, College Station, TX, USA, 2008. Available online: https://oaktrust.library.tamu.edu/handle/1969.1/ETD-TAMU-2008-08-48 (accessed on 3 May 2022).
  33. Azadbakht, M. Tsunami and Hurricane Wave Loads on Bridge Superstructures. Ph.D. Thesis, Oregon State University, Corvallis, OR, USA, 2013. Available online: https://ir.library.oregonstate.edu/concern/graduate_thesis_or_dissertations/pg15bh86v (accessed on 3 May 2022).
  34. Istrati, D.; Buckle, I. Role of trapped air on the tsunami-induced transient loads and response of coastal bridges. Geosci. J. 2019, 9, 191. [Google Scholar] [CrossRef] [Green Version]
  35. Bozorgnia, M.; Lee, J.J.; Raichlen, F. Wave structure interaction: Role of entrapped air on wave impact and uplift forces. Coast. Eng. Proc. 2011, 1, 57. Available online: https://icce-ojs-tamu.tdl.org/icce/index.php/icce/article/view/1358 (accessed on 3 May 2022). [CrossRef]
  36. Istrati, D.; Buckle, I.G.; Lomonaco, P.; Yim, S.; Itani, A. Tsunami induced forces in bridges: Large-scale experiments and the role of air-entrapment. Coast. Eng. Proc. 2017, 35, 30. [Google Scholar] [CrossRef] [Green Version]
  37. Xu, G.; Cai, C.S.; Hu, P.; Dong, Z. Component level–based assessment of the solitary wave forces on a typical coastal bridge deck and the countermeasure of air venting holes. Pract. Period. Struc.t Des. Constr. 2016, 21, 04016012. [Google Scholar] [CrossRef]
  38. Kucherenko, S.; Feil, B.; Shah, N.; Mauntz, W. The identification of model effective dimensions using global sensitivity analysis. Reliab. Eng. Syst. Saf. 2011, 96, 440–449. [Google Scholar] [CrossRef]
  39. Marshall, M.N. Sampling for qualitative research. Fam. Pract. 1996, 13, 522–526. [Google Scholar] [CrossRef]
  40. Rai, R.; Sahu, C.K. Driven by data or derived through physics? A review of hybrid physics guided machine learning techniques with cyber-physical system (CPS) focus. IEEE Access. 2020, 8, 71050–71073. [Google Scholar] [CrossRef]
  41. Chen, Z.; Liu, Y.; Sun, H. Physics-informed learning of governing equations from scarce data. Nat. Commun. Vol. 2021, 12, 6136. [Google Scholar] [CrossRef]
  42. Burhenne, S.; Jacob, D.; Henze, G.P. Sampling based on sobol′ sequences for monte carlo techniques applied to building simulations. Proceedings of Building Simulation 2011: 12th Conference of International Building Performance Simulation Association, Sydney, Australia, 14–16 November 2011; IBPSA Australasia and AIRAH: Melbourne, Australia, 2011. Available online: https://www.researchgate.net/publication/257139589_Sampling_based_on_Sobol’_sequences_for_Monte_Carlo_techniques_applied_to_building_simulations (accessed on 3 May 2022).
  43. Sun, X.; Croke, B.; Roberts, S.; Jakeman, A. Comparing methods of randomizing Sobol′ sequences for improving uncertainty of metrics in variance-based global sensitivity estimation. Reliab. Eng. Syst. Saf. 2021, 210, 107499. [Google Scholar] [CrossRef]
  44. Navid, A.; Khalilarya, S.; Abbasi, M. Diesel engine optimization with multi-objective performance characteristics by non-evolutionary Nelder-Mead algorithm: Sobol sequence and Latin hypercube sampling methods comparison in DoE process. Fuel. 2018, 228, 349–367. [Google Scholar] [CrossRef]
  45. Moon, I.J.; Ginis, I.; Hara, T.; Tolman, H.L.; Wright, C.W.; Walsh, E.J. Numerical simulation of sea surface directional wave spectra under hurricane wind forcing. J. Phys. Oceanogr. 2003, 33, 1680–1706. [Google Scholar] [CrossRef] [Green Version]
  46. Sacks, J.; Welch, W.J.; Mitchell, T.J.; Wynn, H.P. Design and analysis of computer experiments. Stat. Sci. 1989, 4, 409–423. [Google Scholar] [CrossRef]
  47. Du, A.; Padgett, J.E. Investigation of multivariate seismic surrogate demand modeling for multi-response structural systems. Eng. Struct. 2020, 207, 110210. [Google Scholar] [CrossRef]
  48. Sudret, B. Global sensitivity analysis using polynomial chaos expansions. Reliab. Eng. Syst. 2008, 93, 964–979. [Google Scholar] [CrossRef]
  49. Blatman, G.; Sudret, B. An adaptive algorithm to build up sparse polynomial chaos expansions for stochastic finite element analysis. Probabilistic. Eng. Mech. 2010, 25, 183–197. [Google Scholar] [CrossRef]
  50. Zhang, Y.; Xu, J. Efficient reliability analysis with a CDA-based dimension-reduction model and polynomial chaos expansion. Comput. Methods. Appl. Mech. Eng. 2021, 373, 113467. [Google Scholar] [CrossRef]
  51. Yuan, P.; Zhu, D.; Dong, Y. Spatial failure mechanism of coastal bridges under extreme waves using high-efficient pseudo-fluid-structure interaction solution scheme. Ocean. Eng. 2021, 240, 109894. [Google Scholar] [CrossRef]
  52. Istrati, D.; Buckle, I.G. Effect of fluid-structure interaction on connection forces in bridges due to tsunami loads. In Proceedings of the 30th US-Japan Bridge Eng Workshop, Washington, DC, USA, 21–23 October 2014; Available online: https://www.pwri.go.jp/eng/ujnr/tc/g/pdf/30/30-10-2_Buckle.pdf (accessed on 3 May 2022).
  53. Istrati, D.; Buckle, I.; Lomonaco, P.; Yim, S.; Itani, A. Large-scale experiments of tsunami impact forces on bridges: The role of fluid-structure interaction and air-venting. In Proceedings of the 26th International Ocean and Polar Engineering Conference, Rhodes, Greece, 26 June–2 July 2016; The ISOPE: Mountain View, CA, USA, 2016. Available online: https://onepetro.org/ISOPEIOPEC/proceedings-abstract/ISOPE16/All-ISOPE16/ISOPE-I-16-456/16865 (accessed on 3 May 2022).
  54. Choi, S.J.; Lee, K.H.; Gudmestad, O.T. The effect of dynamic amplification due to a structure׳ s vibration on breaking wave impact. Ocean. Eng. 2015, 96, 8–20. [Google Scholar] [CrossRef]
Figure 1. (a) The 3D CFD numerical domain and boundary conditions and (b) mesh sensitivity analysis results for cases with mesh size = 0.65 m, 0.60 m, and 0.55 m, respectively.
Jmse 10 00860 g001
Figure 2. (a) schematic diagram of generated waves; (b) definition of the wave incident angle θ; (c) sampled wave cases using Sobol sequence method.
Jmse 10 00860 g002
Figure 3. The hydrodynamic wave–bridge interaction for the case with clearance Zc = −2.39 m, wave height H = 9.27 m, wavelength λ = 226 m, and incident angle θ = 77.31°: (a) t = 8 s; (b) t = 10 s; (c) t = 12 s; (d) t = 14 s; and (e) time histories of wave forces.
Jmse 10 00860 g003
Figure 4. The hydrodynamic wave–bridge interaction for the case with clearance Zc = 0.21 m, wave height H = 7.06 m, wavelength λ = 178 m, and incident angle θ = 40.54°: (a) t = 2 s; (b) t = 4 s; (c) t = 5 s; (d) t = 8 s; and (e) time histories of wave forces.
Jmse 10 00860 g004
Figure 5. Maximum wave forces under unsubmerged conditions (Zc > 0) for (a) maximum horizontal force Fx-max, (b) maximum vertical force Fy-max, and (c) maximum longitudinal force Fz-max.
Jmse 10 00860 g005
Figure 6. Maximum wave forces under submerged conditions (Zc ≤ 0) for (a) maximum horizontal force Fx-max, (b) maximum vertical force Fy-max, and (c) maximum longitudinal force Fz-max.
Jmse 10 00860 g006
Figure 7. A typical example of the ANN training process for Fy-max.
Jmse 10 00860 g007
Table 1. Tested wave cases.
No.Zc (m)H (m)λ (m)θ (°)No.Zc (m)H (m)λ (m)θ (°)
12.944.13222.9015.38363.186.17108.8854.06
2−0.678.98128.643.1237−0.446.50239.4765.71
31.699.01244.0755.5038−2.399.27225.9977.31
4−1.954.97216.248.92392.697.45161.2565.89
52.037.32215.0670.0940−0.019.44178.2475.38
60.324.56130.1032.48410.876.31138.8439.25
71.197.66243.3380.7342−1.344.94179.8559.64
8−1.509.22115.0148.03432.868.41139.4247.34
93.295.87148.1223.9544−0.939.90244.6033.80
10−0.604.28137.5782.31451.867.25138.5420.80
111.354.38162.7713.0546−1.757.17155.8713.26
12−2.417.51242.7931.53472.235.15154.6988.49
132.635.73196.5079.69480.244.02155.2871.97
140.114.01122.9619.05490.959.04200.6982.34
150.726.68168.6631.0050−1.604.75212.9980.58
162.297.97134.2431.79513.498.05219.0042.53
170.217.06178.1140.5452−0.409.96227.2075.57
181.034.95117.7683.08531.559.06241.859.13
19−1.739.60210.346.4454−2.249.24141.9589.81
203.348.00102.2340.36552.529.54233.9481.73
21−0.347.53227.0416.1156−0.255.44141.367.90
221.525.97124.0658.38570.645.92235.7786.25
23−2.166.49241.8387.5658−1.088.63109.8038.79
242.394.92189.1010.92593.015.74206.1887.48
25−0.134.81116.1571.5660−0.676.26164.5859.01
260.554.61103.8519.18611.636.76233.7256.90
27−1.094.12206.0029.5462−2.008.96158.5875.97
283.106.71174.9543.25631.204.21199.8826.22
29−0.798.29164.4074.8964−1.567.86104.9663.49
301.759.40216.2587.73653.279.53202.3719.00
31−2.075.27191.0669.0966−0.565.40242.793.88
322.186.95107.4272.17671.439.68128.2411.09
330.474.51247.4530.3368−2.477.88120.0462.42
341.087.85199.4119.79692.576.21168.673.71
35−1.448.76124.7083.24700.757.79156.2278.15
Table 2. Maximum wave forces of the tested cases.
No.Fx-max (kN)Fy-max (kN)Fz-max (kN)No.Fx-max (kN)Fy-max (kN)Fz-max (kN)
174.33118.8811.8536381.84236.57297.03
21900.793952.6646.0037357.082290.60393.53
3848.282680.82569.9638288.163192.11506.35
4579.702026.9249.0039447.60644.45438.13
5325.021559.30417.8940539.813353.63862.02
6320.77708.66107.7541635.92933.15230.84
7168.131764.98484.2142216.611417.98191.23
8502.521826.05243.77431237.72718.86564.73
9360.88164.8648.83441316.403752.72451.41
1048.84908.83170.35451181.321104.69204.05
11178.98427.5426.7646970.812642.00125.28
12755.853232.77260.52474.98418.91182.02
1380.60340.80186.424895.18821.20162.72
14186.33699.8751.6549213.542563.57788.73
15778.371611.61233.255057.521709.83213.47
161376.211063.41406.0151715.33831.02295.57
17749.231961.12323.2052446.953399.66840.53
1854.36336.82221.63531315.233034.26148.19
191430.873716.0581.635445.553360.03740.43
201389.921120.65477.5855229.581829.72711.40
21292.00951.00193.0056622.321841.3267.71
22413.38473.73286.935721.301646.42326.69
2346.682406.67310.5658936.882576.45259.62
24131.35225.8214.915914.68225.35147.93
25111.04790.88192.6060332.661470.05262.32
26429.13817.4774.7961448.491305.80300.98
27296.631090.6391.2062396.522913.42740.31
28499.00539.47181.8963156.04566.4042.33
29130.721206.10209.9164372.102219.16313.96
30101.102192.40839.84651514.301482.25264.18
31186.171802.30234.1066596.262679.9426.79
32368.53379.54645.1467670.143477.37225.47
33457.911727.20158.3968367.812151.41381.46
341069.102450.47234.2169588.66928.0031.33
35141.473448.73653.8670305.211731.20642.15
Table 3. Prediction performance of different metamodels.
3-Order PCEKrigingANN
Fx-maxR20.89240.82740.8567
RMSE142.7180.7134.1
Fy-maxR20.91610.87250.9044
RMSE308.3379.9323.4
Fz-maxR20.94760.83240.8979
RMSE52.393.516.5
Publisher’s Note: MDPI stays neutral with regard to jurisdictional claims in published maps and institutional affiliations.

