Article

Research on Optimization Design of Fully Parameterized Pump-Jet Propulsion

1
Naval Architecture and Ocean Engineering College, Dalian Maritime University, Dalian 116026, China
2
Department of Mechanics and Maritime Sciences, Chalmers University of Technology, SE-412 96 Gothenburg, Sweden
*
Author to whom correspondence should be addressed.
J. Mar. Sci. Eng. 2022, 10(6), 766; https://doi.org/10.3390/jmse10060766
Submission received: 19 April 2022 / Revised: 20 May 2022 / Accepted: 24 May 2022 / Published: 1 June 2022
(This article belongs to the Special Issue CFD Analysis in Ocean Engineering)

Abstract

:
A pump-jet propulsion system is composed of rotor, stator, and duct. The stator has the front stator type and the rear stator type; the conduit also has the acceleration conduit and the deceleration conduit two forms. It is difficult to design and evaluate the performance of a pump-jet propulsion system because of its complex structure and many changes in component parameters. Due to the limitation of time and cost in the design process of the pump-jet propulsion system, it is difficult to find the optimal scheme in the design space. However, under the guidance of an optimization algorithm, the automatic optimization method can fill the design space with a large number of design schemes. In this paper, the geometry reconstruction technique, hydraulic performance evaluation technique and optimization technique of the pump-jet propulsion system are combined to realize the automation of the whole design process. Firstly, the geometric modeling of the pump-jet propulsion system is completed by a full parametric modeling method, and then the hydrodynamic performance of the pump-jet propulsion system is calculated based on the numerical simulation technique. The radial parameters in the fully parametric configuration of the pump-jet propulsion system were selected as the optimization design variables, and the hydro-dynamic performance was optimized as the objective function. Finally, the pump-jet propulsion system optimization design system was constructed by using the global intelligent optimization algorithm. This study provides a theoretical basis and technical guidance for numerical calculation and configuration optimization design of pump-jet propulsion system.

1. Introduction

A pump-jet propulsion system has the following advantages: good noise performance and high preset speed. The good noise concealment of a pump-jet propulsion system is because the rotor of the pump-jet propulsion system is surrounded by the duct, and the generated internal noise can be shielded and absorbed by the duct. The front-mounted stator blades can uniform the inflow of the rotor, reducing both the unsteady pulsating load on the rotor blades and the low-frequency line spectrum noise of propulsion. Compared with the blade diameter of the traditional pump-jet propulsion system, the diameter of the rotor of the pump-jet propulsion system is smaller. At the same rotational speed, a lower rotational linear speed leads to reduced low-frequency noise sound pressure level of the propeller. At low speed, compared with ordinary propellers, the pump-jet propulsion system has a lower low-frequency line spectrum noise; at high speed, the noise performance of the pump-jet propulsion system is even more outstanding. The preset speed means the maximum propeller speed without generating cavitation when the water depth is constant. At the same time, the installation and application of a pump-jet propulsion system ducts and stator blades can adjust the inflow, so that the distribution of the flow field where the rotor blades are located is more uniform. In turn, the generation of rotor blade tip vortex cavitation and sheet cavitation is delayed. Based on the advantages brought by the structure of the pump-jet propulsion system, its advantages are of great significance and research value to submarines and underwater vehicles.
Hughes and Kinnas [1] calculated and analyzed the hydrodynamic performance of the ducted propeller with the front stator. Kinnas, et al. [2] analyzed the influence of the stator on the pump-jet propulsion system. Kawakita and Hoshino [3] used the panel method to calculate the hydrodynamic performance of the pump-jet propulsion system (rear stator) under the condition of uniform inflow. Park and Jang [4] analyzed and studied the flow field characteristics of a pump-jet propulsion system based on the incompressible three-dimensional RANS (Reynolds-averaged Navier–Stokes) equations. Park et al. [5] used the CFD method to carry out a numerical simulation of the water jet propulsion, and the simulation results captured and explained the details of the complex three-dimensional viscous flow field of the propulsion very well. In terms of performance prediction of a pump-jet propulsion system, Suryanarayana’s team [6,7,8,9,10,11] has conducted a lot of research work and experiments and made a wind tunnel for the hydrodynamic performance of the revolving body of a light underwater vehicle equipped with a pump-jet propulsion system. Experimental studies have verified the advantages of the rear-stator pump-jet propulsion system, indicating that the rear-stator can absorb the rotational energy of the rotor and reduce the radial component in the wake, thereby improving the propulsion efficiency. Das et al. [12] used the theory of axial flow rotating machinery to design the pump-jet propulsion system, and based on the RANS equation, the finite-volume method and k-ε turbulence model were used to carry out the numerical simulation of the pump-jet propulsion system, and the numerical calculation results and experiments were carried out. The results were consistent. Ahn and Kwon [13,14] carried out a numerical simulation of a pump-jet propulsion system with a rotor top ring based on incompressible RANS equations using the unstructured grid. The calculation results show that although the additional ring at the top of the rotor reduces the reasoning and torque of the rotor, the efficiency of the propulsion remains unchanged, and it can effectively reduce the strength of the headgap vortex and improve the internal flow field of the propulsion. Ivanell [15] tried to use the computational fluid dynamics (CFD) method to numerically calculate the hydrodynamic performance of torpedoes equipped with a pump-jet propulsion system and verified the rationality of the method by comparing it with the experimental results. Yamada et al. [16] used the lattice Boltzmann method to conduct a preliminary study on the ducted propeller. Baltazar et al. [17] used the low-order surface element method to simulate the open water performance of the Ka4-70 ducted propeller and analyzed the influence of factors such as the wake model and the head gap circulation velocity on the calculation results. Liu et al. [18] based on the CFD method, used high-quality structured grids and applied the slip grid technique to numerically calculate the hydrodynamic performance of a pump-jet propulsion system; the numerical results were in good agreement with the experimental results. This method provides a reliable and practical approach for the design and hydrodynamic performance prediction of a pump-jet propulsion system. Pan et al. [19,20] established an integrated numerical calculation model of the internal and external flow fields for a certain type of underwater vehicle equipped with a pump-jet propulsion system. A high-quality structured grid is generated based on the coupling of the block grid technique, and the numerical calculation of the steady hydrodynamic performance is carried out. The calculation results show that the pump-jet propulsion system has high efficiency and ideal balance performance. Hu and Liu [21,22] expounded on the structural characteristics and advantages of the pump-jet propulsion system and used the software FLUENT to calculate the internal flow field of the integrated motor pump-jet propulsion system. It lays the foundation for the design and optimization of the pump-jet propulsion system. Ni [23,24] summarized the research and progress of the pump-jet propulsion system and put forward suggestions for analysis and design improvement.
In the design of a propeller, many conflicting optimization objectives need to be weighed during the iterative design process. At the same time, many design constraints also need to be considered in the design to ensure that the final design scheme is available. In recent years, many scholars have used computers to realize the automatic optimal design of propellers in combination with optimization algorithms. Gaafary et al. [25] performed single-objective optimization using the graph method for B-series propellers using the cavitation, material strength and required thrust of the propeller as constraints. Xie [26] proposed a multi-objective optimization method for the preliminary design of the propeller by using the genetic algorithm with the efficiency ratio and the thrust coefficient as the optimization objectives for the matching problem of the ship engine and propeller. Gaggero et al. [27,28] proposed an optimization design method for propellers, and used the boundary element method to predict the propeller performance to complete the optimization of the propeller cavitation performance. Afterwards, the CFD method and genetic algorithm were used to carry out a multi-objective optimization design of the nozzle of the ducted propeller under different working conditions, and the optimization goal was to reduce cavitation and increase thrust. Mizzial et al. [29] used the SOBOL algorithm and the T-Search algorithm, and used the CFD method to optimize the hydrodynamic performance of the small fins on the propeller hub. The propulsion efficiency of the propeller is thus improved. Nouri et al. [30] used a combination of the CFD method, genetic algorithm and kriging method to optimize the hydrodynamic performance of the contra-rotating propeller. Yang et al. [31] used the RNSGA-II-SBJG algorithm to optimize the design of a container ship propeller in the case of propeller matching. Han et al. [32] studied the application of optimization theory in propeller hydrodynamic performance design. Mian et al. [33] optimized the propeller using a physics-based surrogate modeling strategy and a spatial mapping method, which optimizes the coarse model and fine model classification, where the coarse model uses the surface element method, and the precise model uses the CFD method.
To sum up, how to design a pump-jet propulsion system design scheme that meets various requirements and has the best performance in a short period of time is still an important topic of current pump-jet propulsion system research. Therefore, it is necessary to comprehensively optimize the pump-jet propulsion system design and develop a new design method. In this paper, the geometric reconstruction technique of the pump-jet propulsion system, the hydrodynamic performance evaluation technique of the pump-jet propulsion system, and the optimization technique are combined to realize the automation of the whole design process. It provides a certain theoretical basis and technical guidance for the numerical calculation of the propulsion performance and the configuration optimization design of the pump-jet propulsion system.

2. Hydrodynamic Performance Optimization Design Methodology of Pump-Jet Propulsion System

2.1. Establishment of a Fully Parameterized Pump-Jet Propulsion System Model

The geometric reconstruction technique of the pump-jet propulsion system will be the bottleneck technique for constructing the optimal design system. Because it is the link between the optimization technique and the hydrodynamic performance evaluation of the pump-jet propulsion system. A contemporary pump-jet propulsion system is already a three-dimensional geometric entity with the variable pitch in the radial direction, side slope in the circumferential direction, and trim in the axial direction. The traditional atlas expression is faced with the problems of numerous parameters and not clear enough expression, especially in the case that the contemporary underwater submersible needs to be specially equipped with a pump-jet propulsion system, resulting in a heavy workload of pump-jet propulsion system design. Therefore, it is necessary to express the geometric characteristics of the pump-jet propulsion system in a relatively simple way, to establish the relationship between the geometric parameters of the pump-jet propulsion system and its performance.

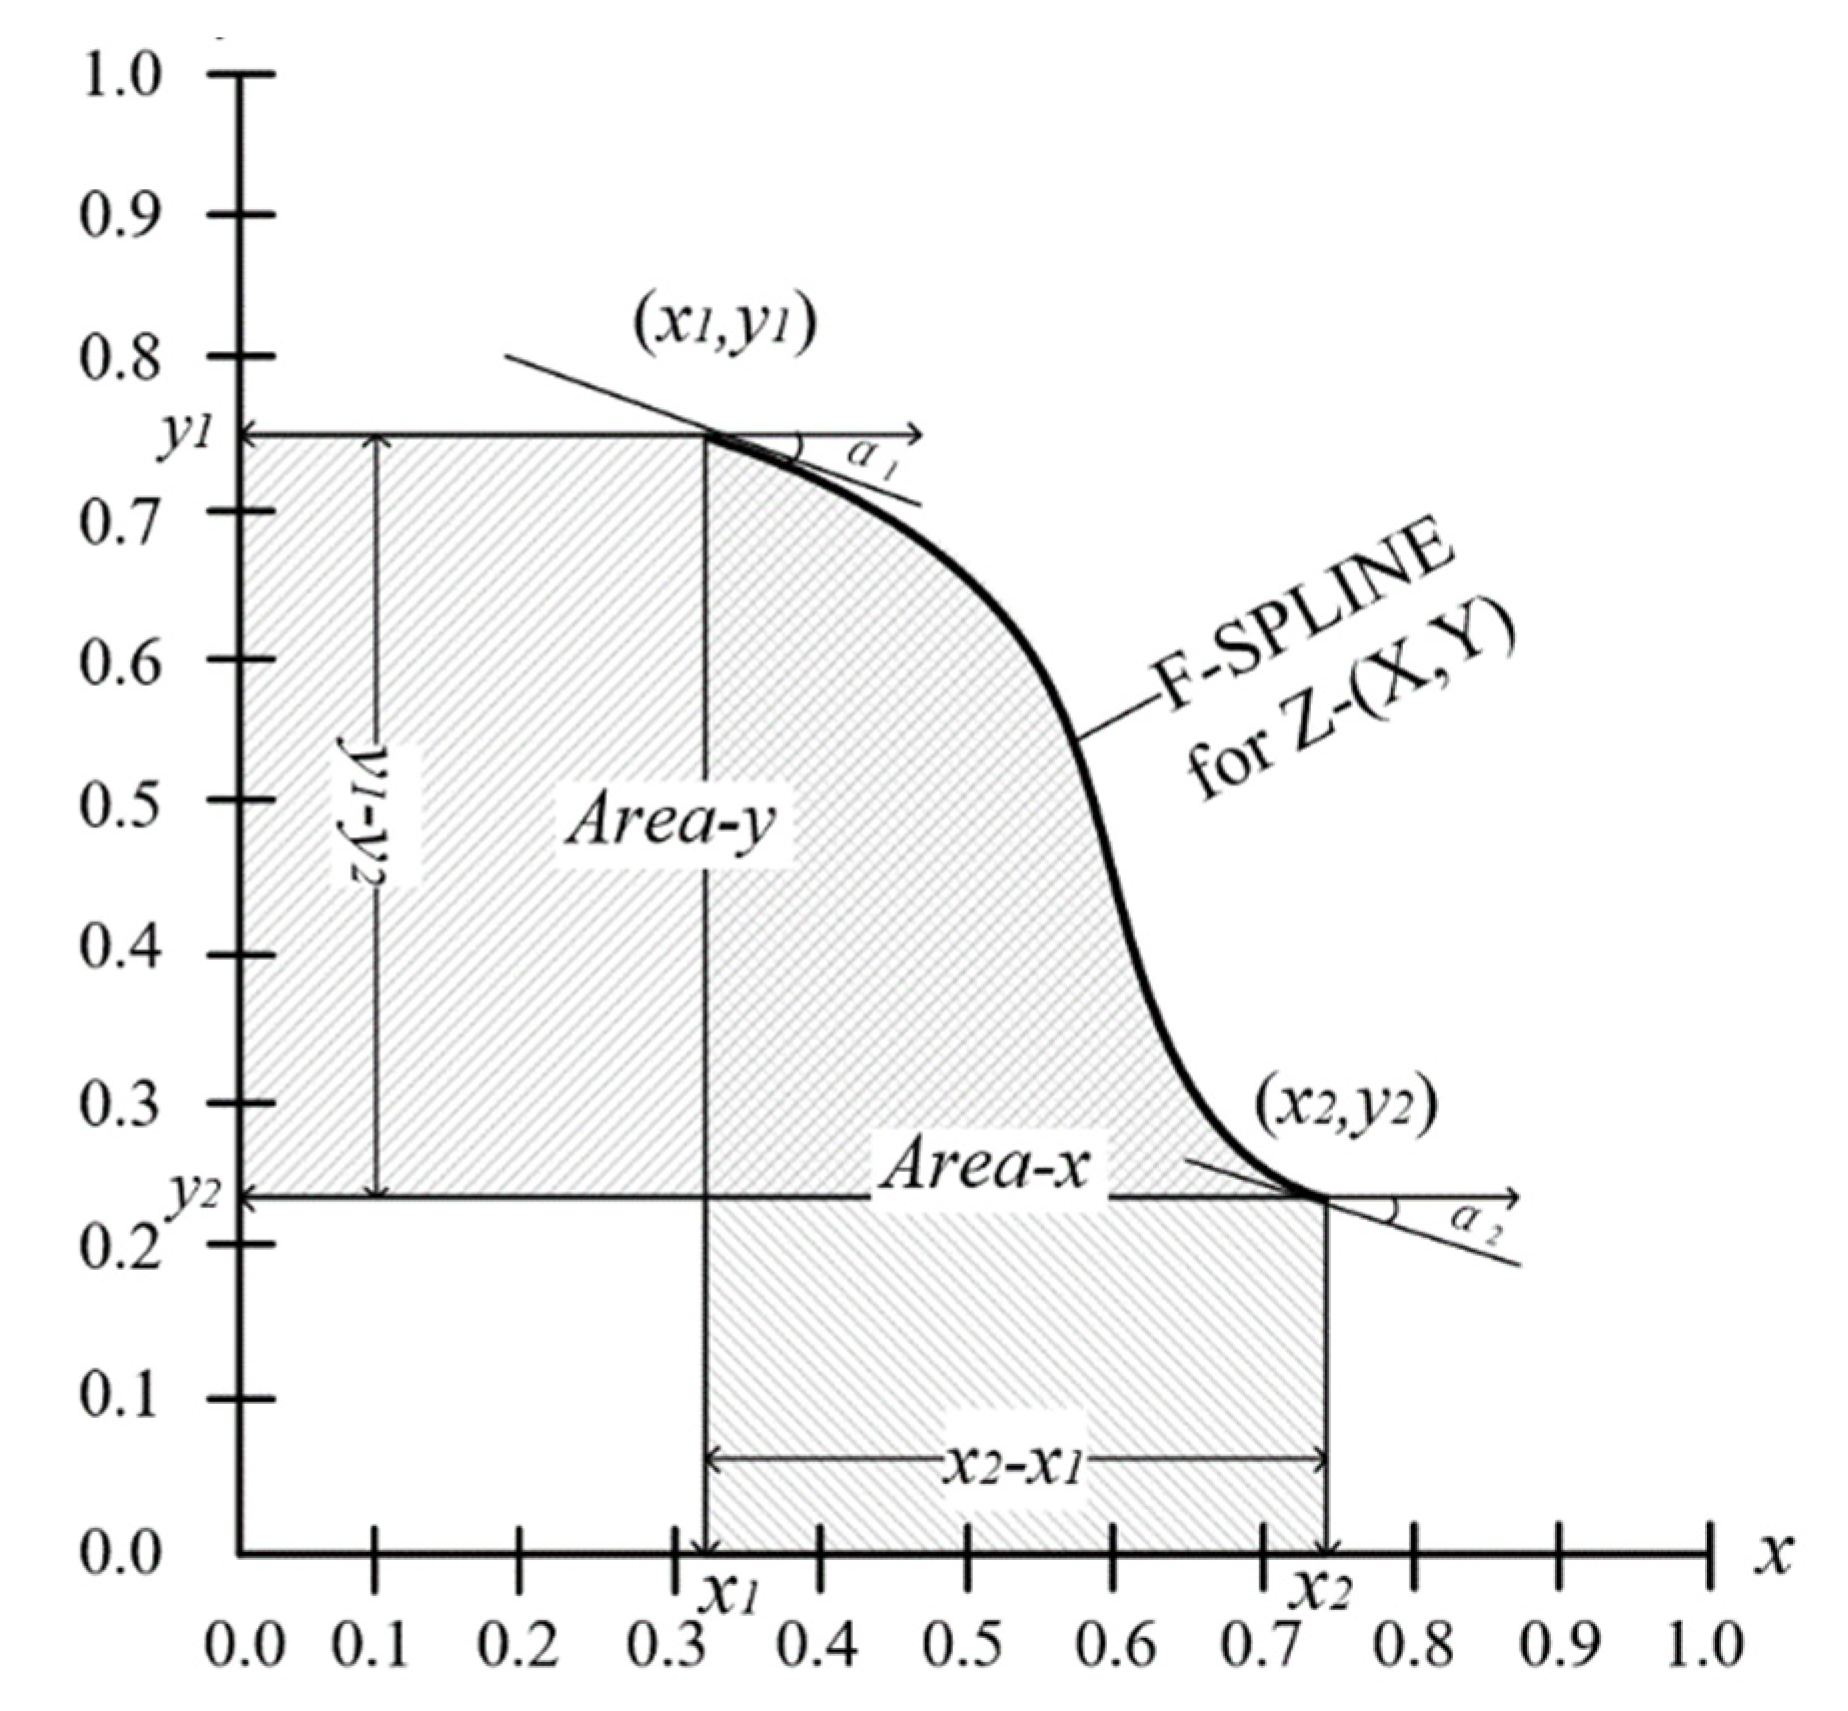
2.1.1. F-Spline Curve

The F-spline curve is controlled by 7 variables [34], and its specific form is as shown in Equations (1) and (2).
F ( n ) = ( x 1 n , 1 n , y 2 n , 2 n , z 3 n , 3 n , σ 1 n , 2 n , S n )
S n = ( ( x 2 n x 1 n ) ( y 1 n + ( y 2 n y 1 n ) f n ) )   ,   0 f n 1
where α1n,2n is the specified vector angle of the first point, S n ( x , y , z ) is the area enclosed by the curve, f n is the fullness coefficient. The start and endpoints are used to define the specific position of the curve, the chamfer at the start and endpoints can be used to control the smoothness of the connection points when multiple characteristic curves are connected in parametric modeling, and the area enclosed by the curve and the coordinate axis is mainly used to adjust the local convexity and fatness of the curved surface formed by the curve, and can also be used for the subsequent optimization of the blade type of the pump-jet propulsion system, as shown in Figure 1.

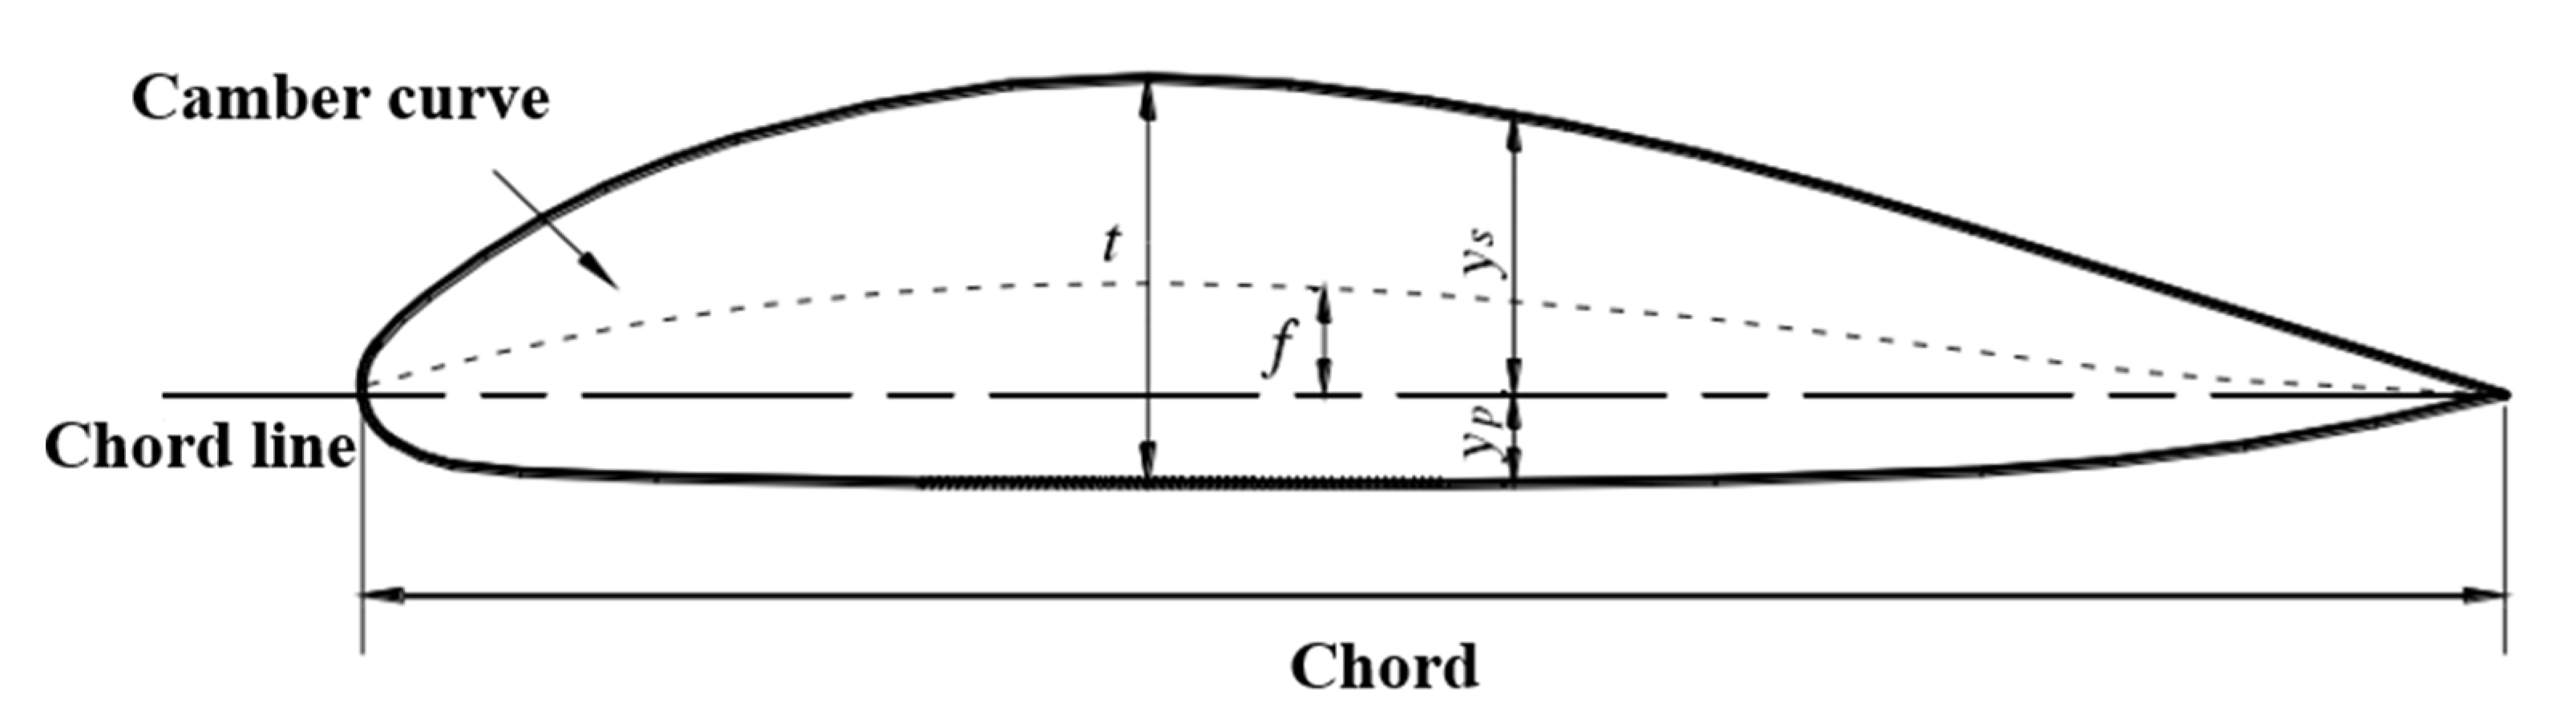
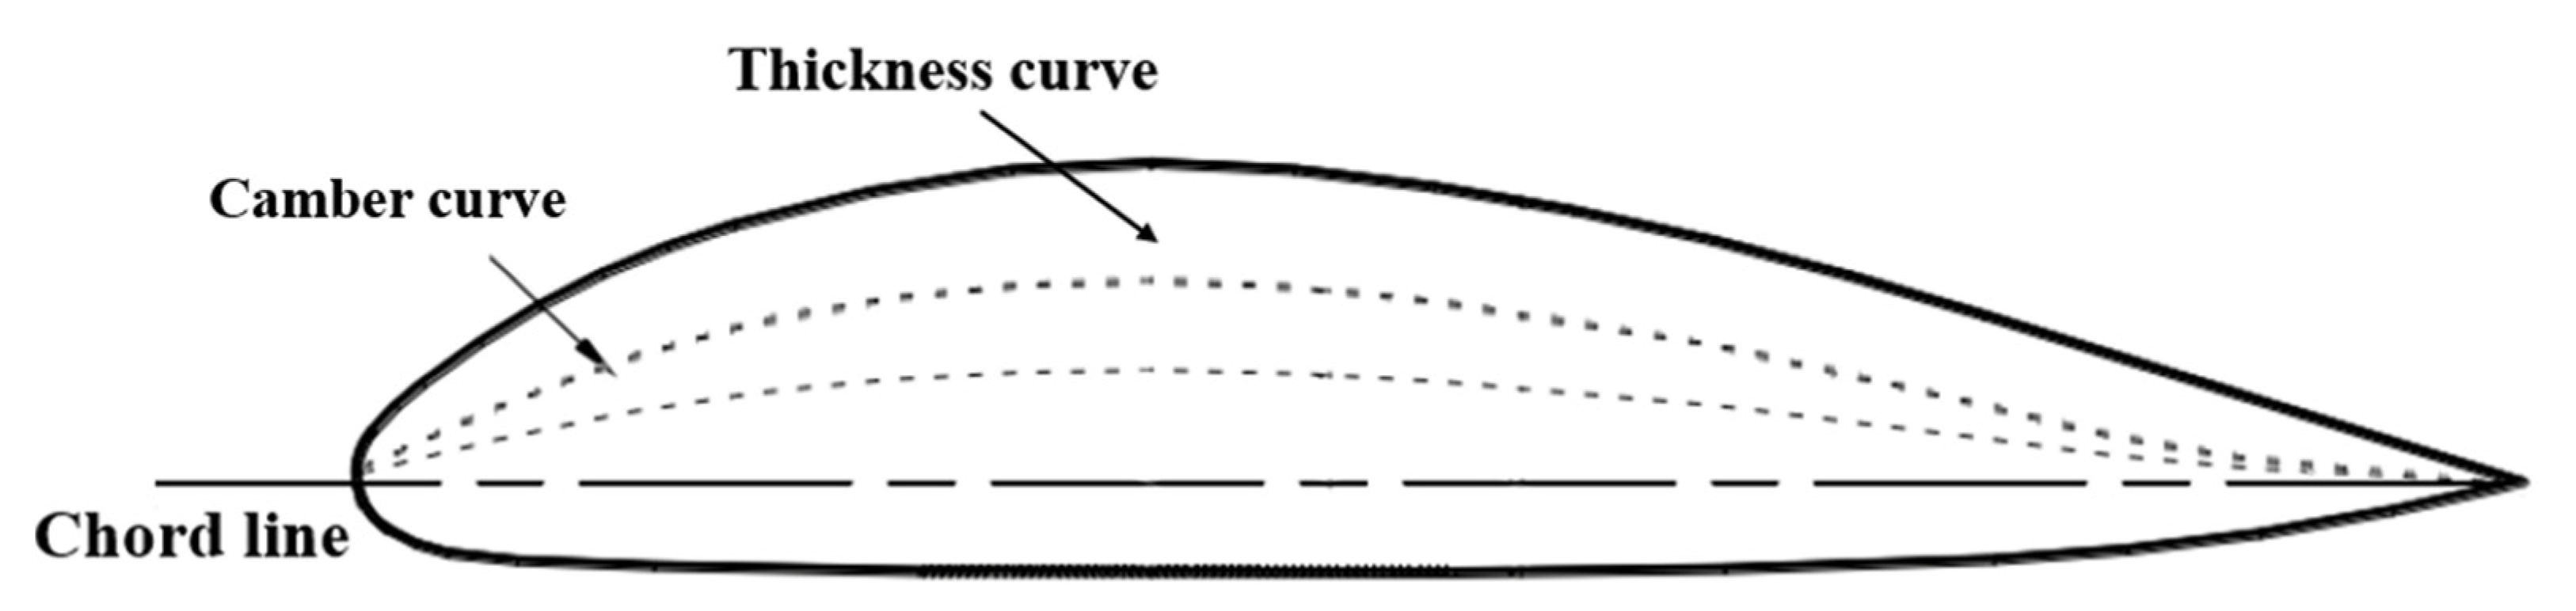
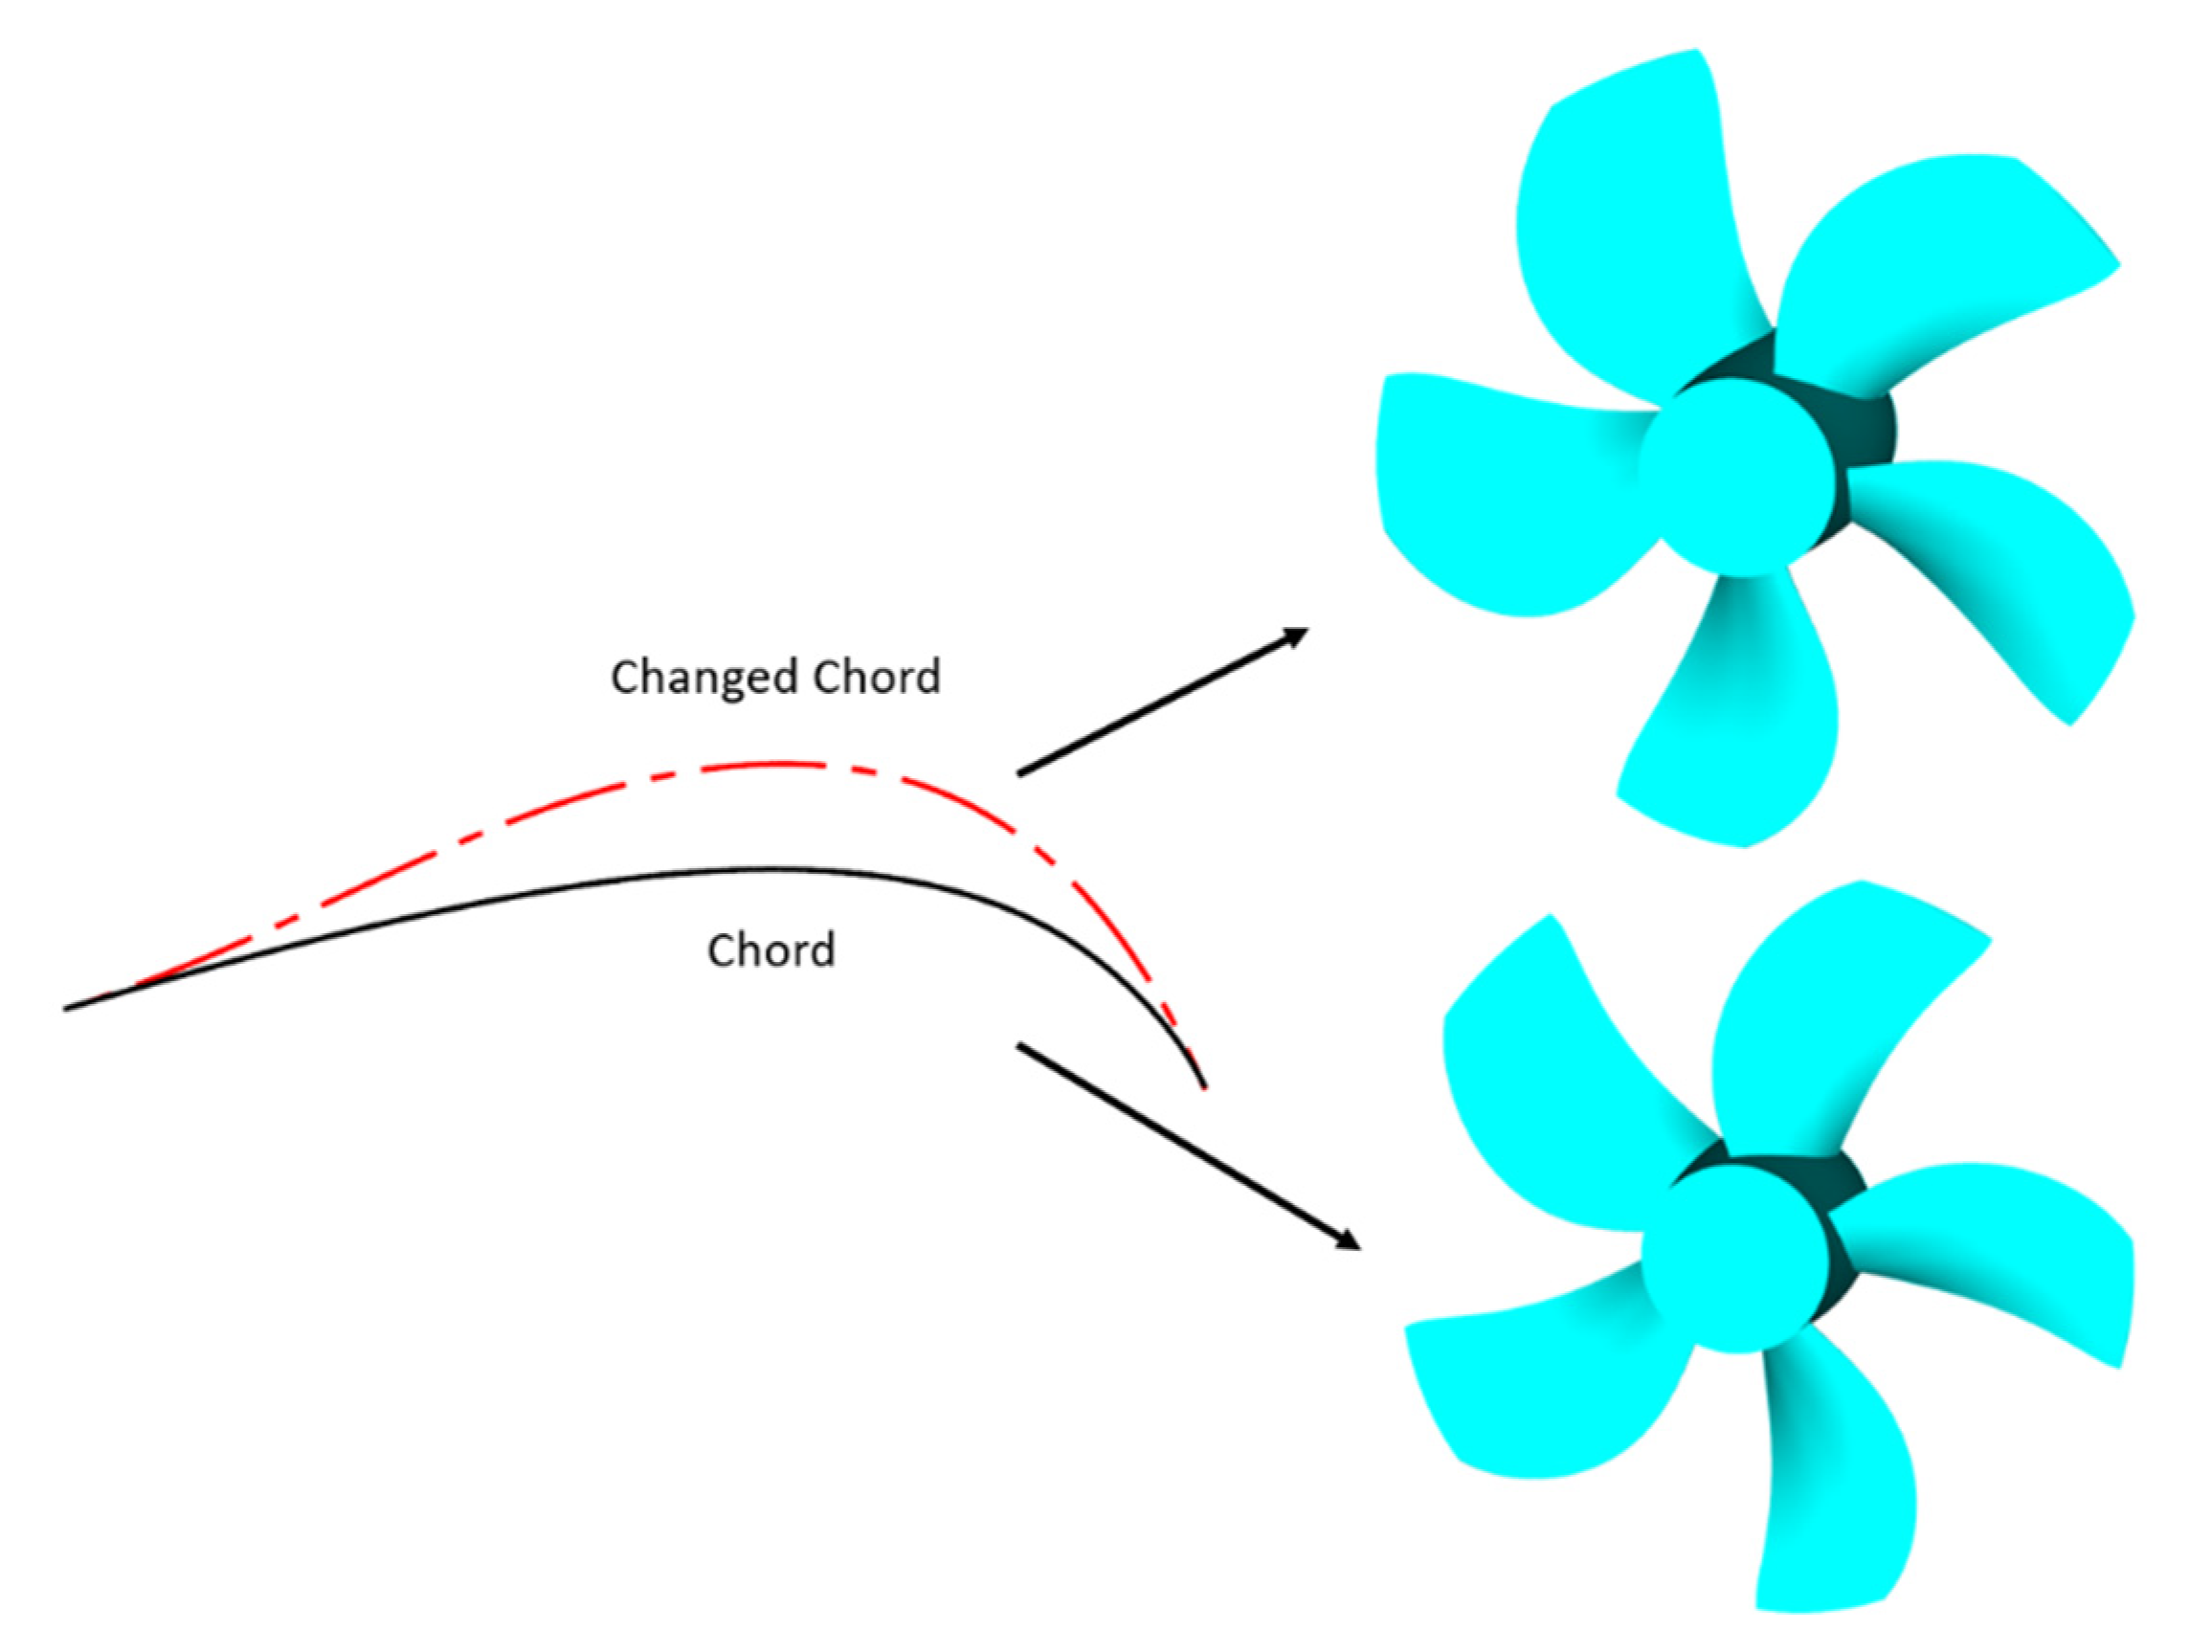
2.1.2. Modeling of the Rotor Airfoil Section of a Pump-Jet Propulsion System

The airfoil profile is the basis for the generation of the pump-jet propulsion system, and the quality established by the airfoil profile directly affects the quality of the pump-jet propulsion system. The establishment of the airfoil profile of the pump-jet propulsion system in a parametric way is also helpful for the establishment of the subsequent pump-jet propulsion system model, which enables the pump-jet propulsion system to realize the shape change driven by the characteristic parameters. For the airfoil section, in order to express the shape of the airfoil section, the chord line is selected as the reference line. On both sides of the reference line are the camber distribution curve and the thickness distribution curve, which express the shape of the profile of the pump-jet propulsion system blade in this way.
As shown in Figure 2 [35], the airfoil profile is drawn with the chord line starting from the following edge and ending at the leading edge. The length of the chord is called the chord length C. The chord length is divided into 100 equal parts and the distance from the airfoil to the chord at each position is marked. The thickness t and camber f at this part of the chord length are related to ys and yp as in Equation (3).
{ f = | y s y p | 2 t = y s + y p
From the ys and yp of each point of the blade profile, the thickness t and camber f of the profile at each chord position can be determined, so that the values of the maximum thickness t0 and the maximum camber f0 and the relative position in the chord direction can be calculated. The corresponding ratios are t/t0 and f/f0. Reverse the above process, that is, given the thickness distribution t/t0 and camber distribution f/f0 of the airfoil, a complete airfoil can be obtained. The camber line and the thickness line are first defined with the F-spline curve. The thickness line is used to create offset curves on both sides of the camber line, where the maximum thickness of the thickness line and the maximum camber of the camber line are specified, to realize the parameterization of the airfoil profile. Figure 3 [35] shows the parameterized profile airfoil of the pump-jet propulsion system.

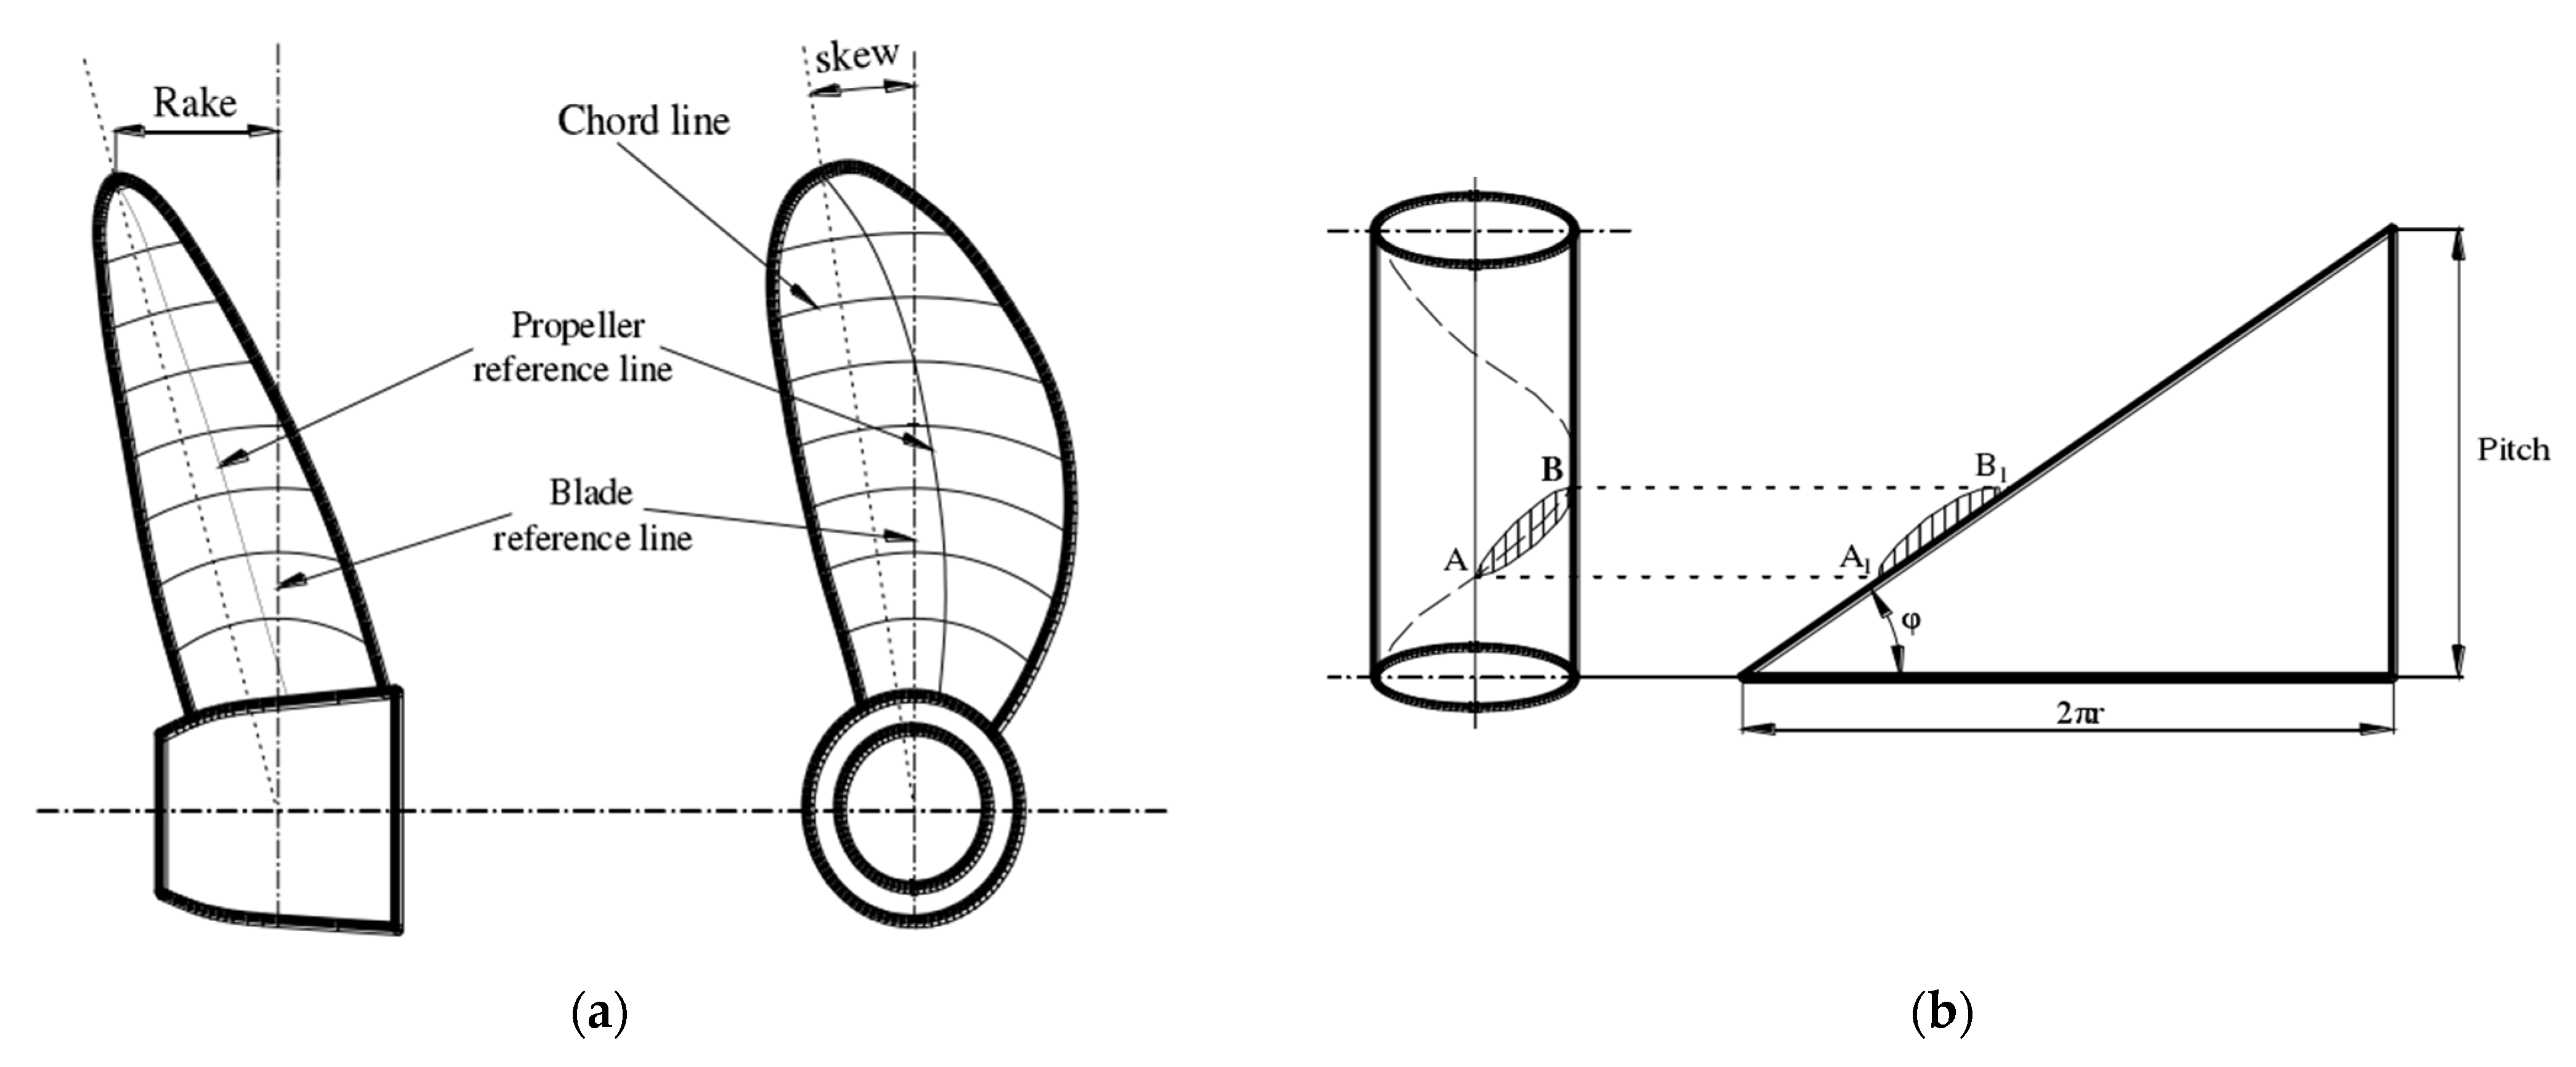
2.1.3. Parametric Modeling of Pump-Jet Propulsion System Rotor

The straight line connecting the center points of the chord lines of the airfoil section without skew and trim is called the blade reference line. The straight line connecting the center points of the chord line of the actual pump-jet rotor airfoil profile is called the pump-jet rotor reference line. As shown in Figure 4a [36], the longitudinal distance between the blade reference line and the pump-jet rotor reference line is called the rake. As shown in Figure 4a, the angle formed by the blade reference line and the pump-jet rotor reference line in the frontal direction is called the skew. As shown in Figure 4b, take a blade section, extend the chord line of the blade section, and circle around the axis. The axial distance between the two ends of the formed helix is the pitch of the blade on the radial section. The shaft cylinder and the airfoil section are unfolded together, and the angle between the section chord line and the bottom line is called the pitch angle. There exists where r is the radius of the section.
The pump-jet rotor is a three-dimensional entity obtained by stretching and rotating the airfoil section in space. Usually, the radial distribution of the parameters of the pump-jet rotor in each section is given to represent the entire pump-jet rotor. It is used to establish the relationship between the geometric parameters of the pump jet and the performance of the pump-jet. The model parameters of the pump-jet propulsion system are shown in Table 1 [37].
The chord curve, the maximum thickness curve and the maximum camber curve can express the shape of the airfoil section in different radial directions. The pitch curve, side slope curve and pitch curve can accurately describe the distribution of each blade section of the pump-jet propulsion system rotor in the circumferential, axial and radial directions. In this paper, the method of fitting different radial parameter curves by F-spline curve is used to model a certain type of pump-jet propulsion system fully parametric, and the idea of adopting the method of F-spline curve fitting is to use fewer control variables to accurately describe the pump-jet propulsion system., reducing optimization design variables and speeding up the search for optimization targets. The main radial parameters of the pump-jet rotor are shown in Table 2.
When fitting the parametric curve, the idea of the minimum variance between the F-spline curve fitting and the original parametric curve is added. In this paper, the chord length curve is selected for fitting description, and the chord length parameter curve is first drawn from discrete points in different radial directions. Then, two radial points at the head and tail are selected as the reference points of the fitting curve, the head point represents the starting point of the first F-spline curve, and the tail point represents the endpoint of the second F-spline curve. 50 points are intercepted from the start point to the endpoint on the chord length curve to fit the curve, and each point in the 50 points represents the endpoint of the first curve and the start point of the second curve. In this way, each fitting curve is composed of 3 points, and the purpose of accurately fitting the parameter curve is achieved by setting the chamfering angle and Y value of each point, as shown in Figure 5. The idea of the minimum variance is mainly reflected in: a new curve will be fitted for each point taken from the 50 points, and then 50 points will be intercepted from the fitted curve and the 50 points intercepted by the original parameter curve to calculate the variance, so that Loop 50 times, fit 50 curves and calculate the variance of the 50 curves, and take the fitting curve with the smallest variance as the final chord curve. The variance formula is as Formula (4).
s 2 = [ ( x 1 x ) 2 + ( x n x ) 2 ] / n
Figure 5, Figure 6 and Figure 7 show the comparison of the fitted chord length curve, pitch curve and thickness curve, respectively, the horizontal coordinates indicate the radial distribution, the vertical coordinates are the chord length, pitch and thickness values (when the rotor radius is 1), and the relative error values. It is found that the error of the F-spline curve fitted by adding the idea of minimum variance is small, all within 1%, and the smoothness of the fit is good, which can fully meet the needs of engineering calculations. It is also very beneficial to the later optimization of the pump-jet propulsion system.
After the characteristic curve fitting of the pump-jet rotor is completed, the generation of the blade surface of the pump-jet rotor is continued. This paper uses 3D modeling software to carry out secondary development programming to define the characteristic points and characteristic curves required in the modeling process. At the same time, the function of generating a series of curves can be realized by giving a certain characteristic parameter curve the corresponding generation path and curve change law. Finally, the corresponding surface is generated by integrating the series of characteristic parameter curves, so as to achieve the control of the pump-jet propulsion system model. Figure 8 shows the mapping relationship between the characteristic parameter curve and the pump-jet rotor, and Figure 9 shows that by changing the characteristic parameter curve, the model of the pump-jet propulsion system rotor is also changed. In this paper, the chord length distribution curve, the thickness distribution line and the camber distribution line are selected as control variables to achieve the effect of controlling the profile airfoil of the pump-jet propulsion system in different radial directions. The pitch distribution line, the side slope distribution line and the pitch distribution line are selected as control variables to control the distribution of the circumferential, axial and radial blade profiles of the pump-jet propulsion system. The stator and duct in this study are formed by rotating and stretching an airfoil in space, so they will not be described here. The purpose of establishing the fully parameterized pump-jet model is to express the geometric characteristics of the pump-jet in a relatively simple way, so as to establish the relationship between the geometric parameters of the pump-jet and the performance of the pump-jet.

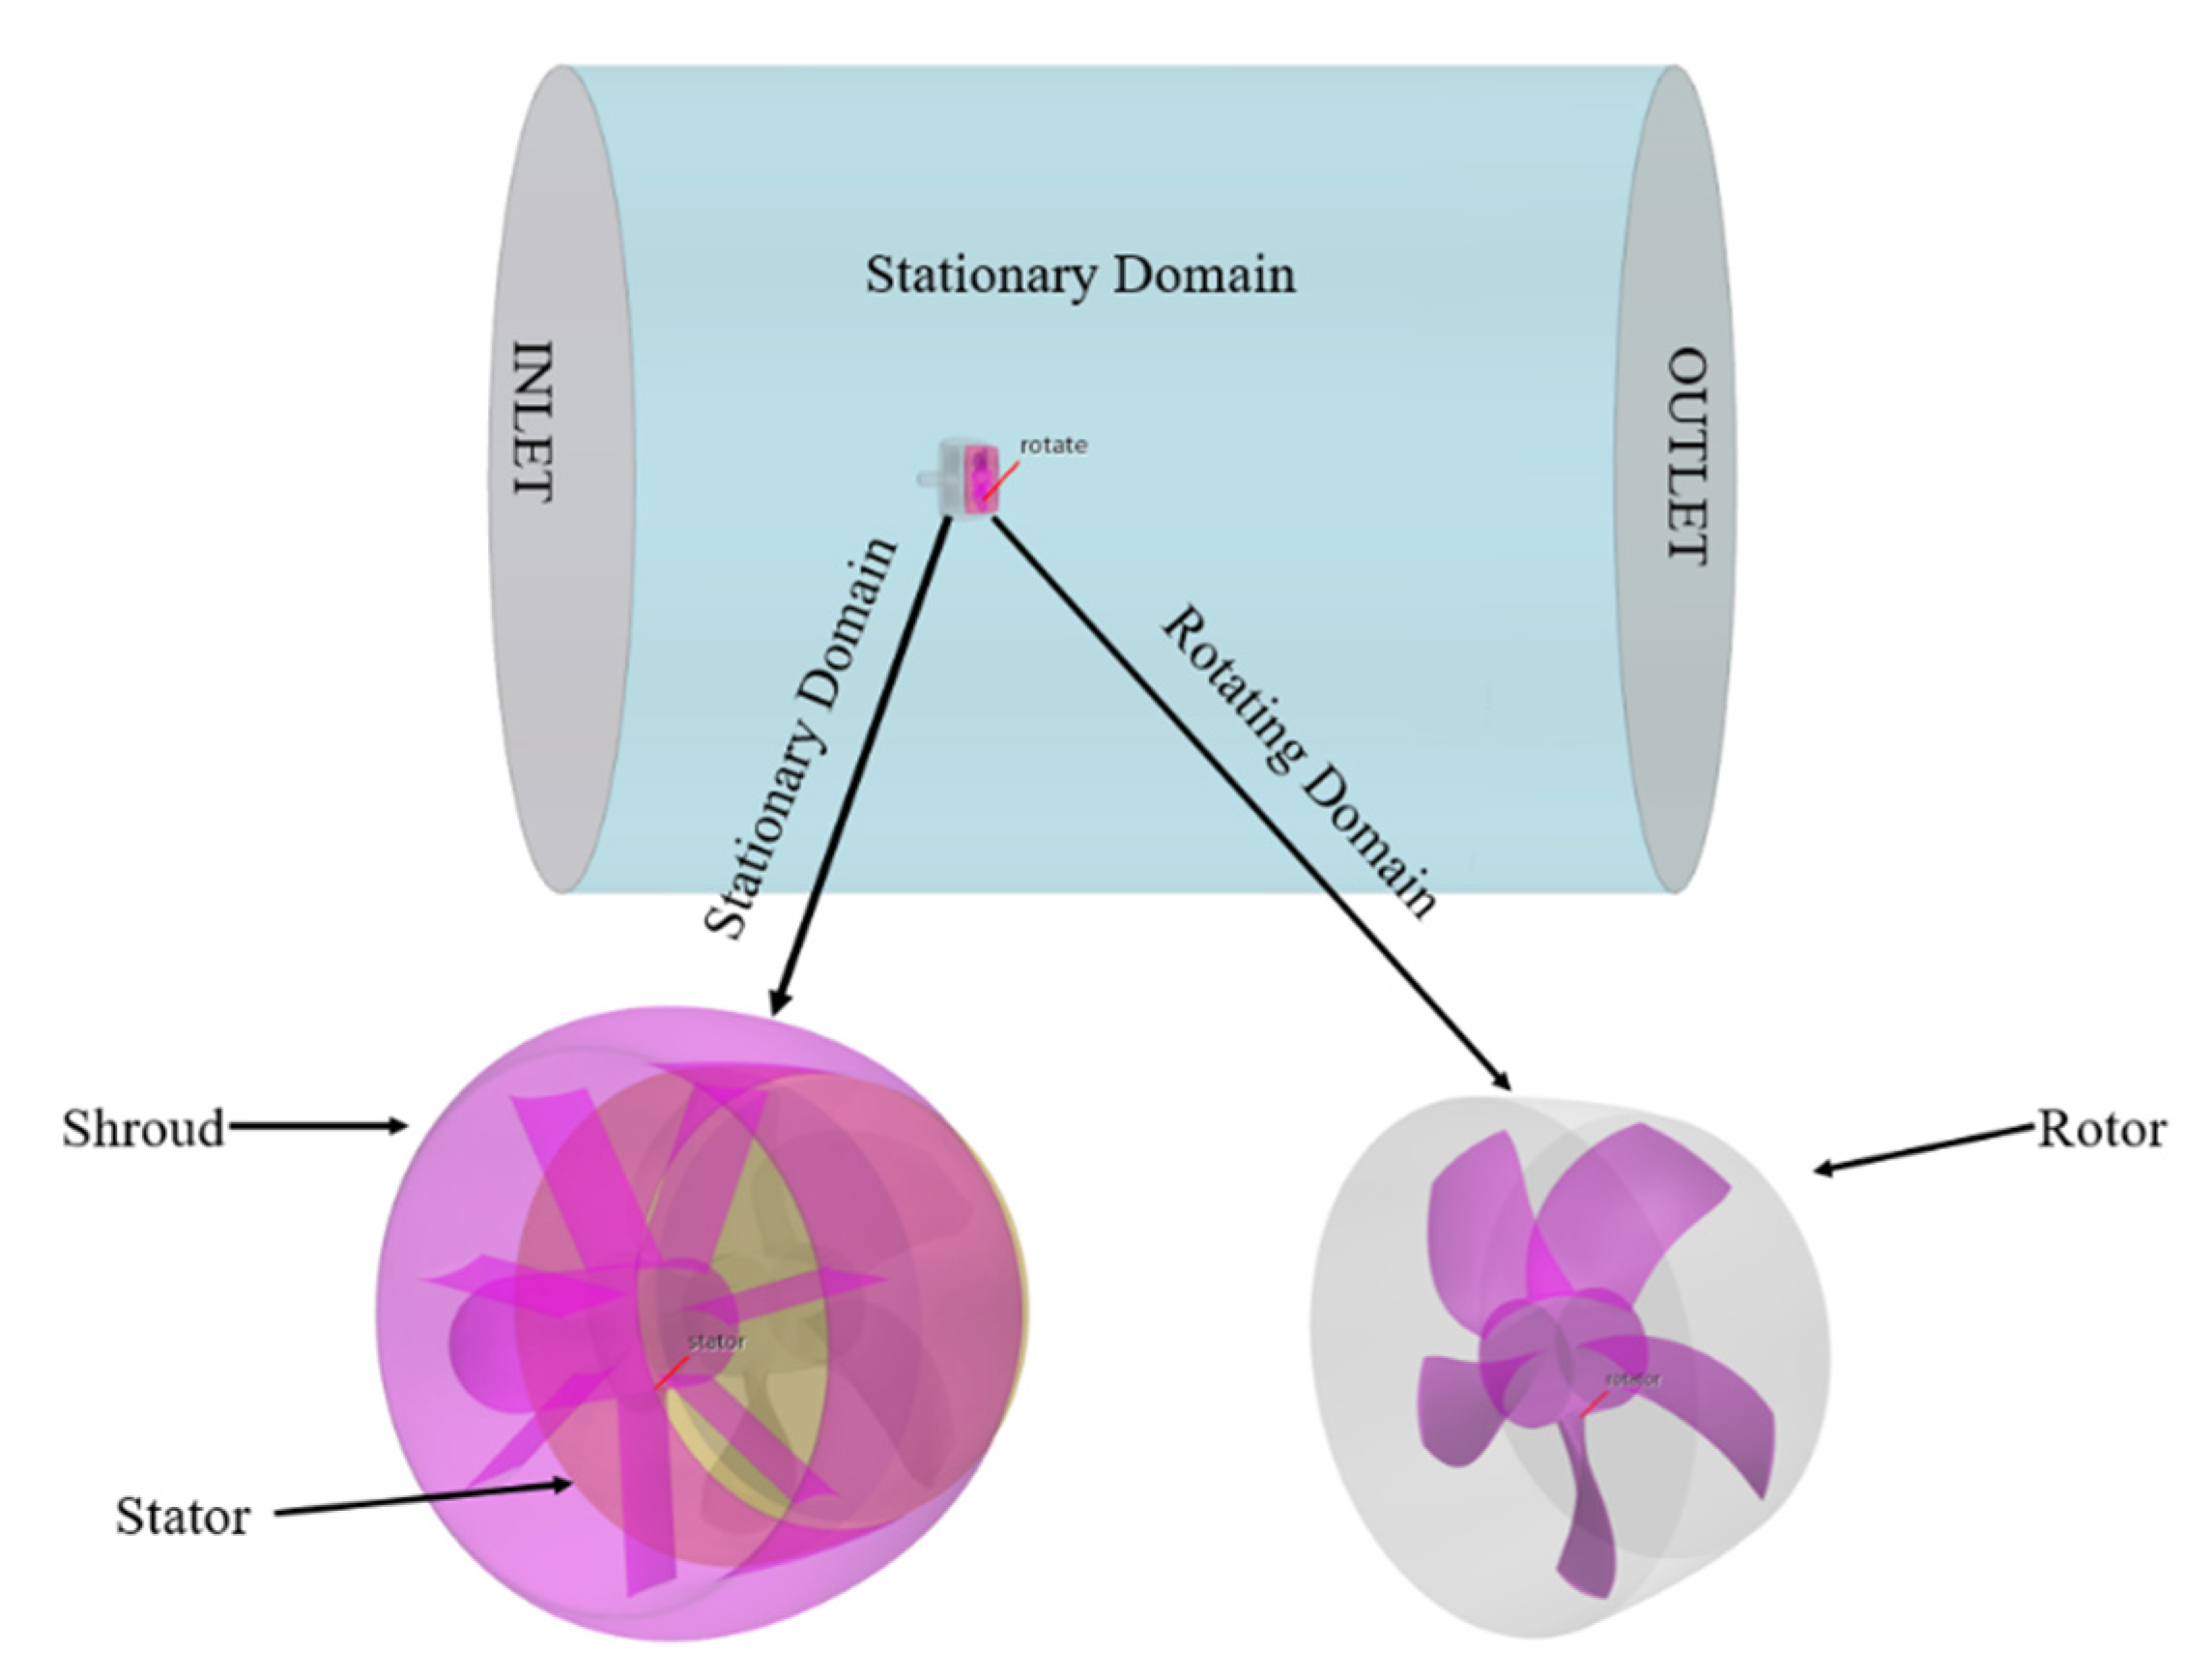
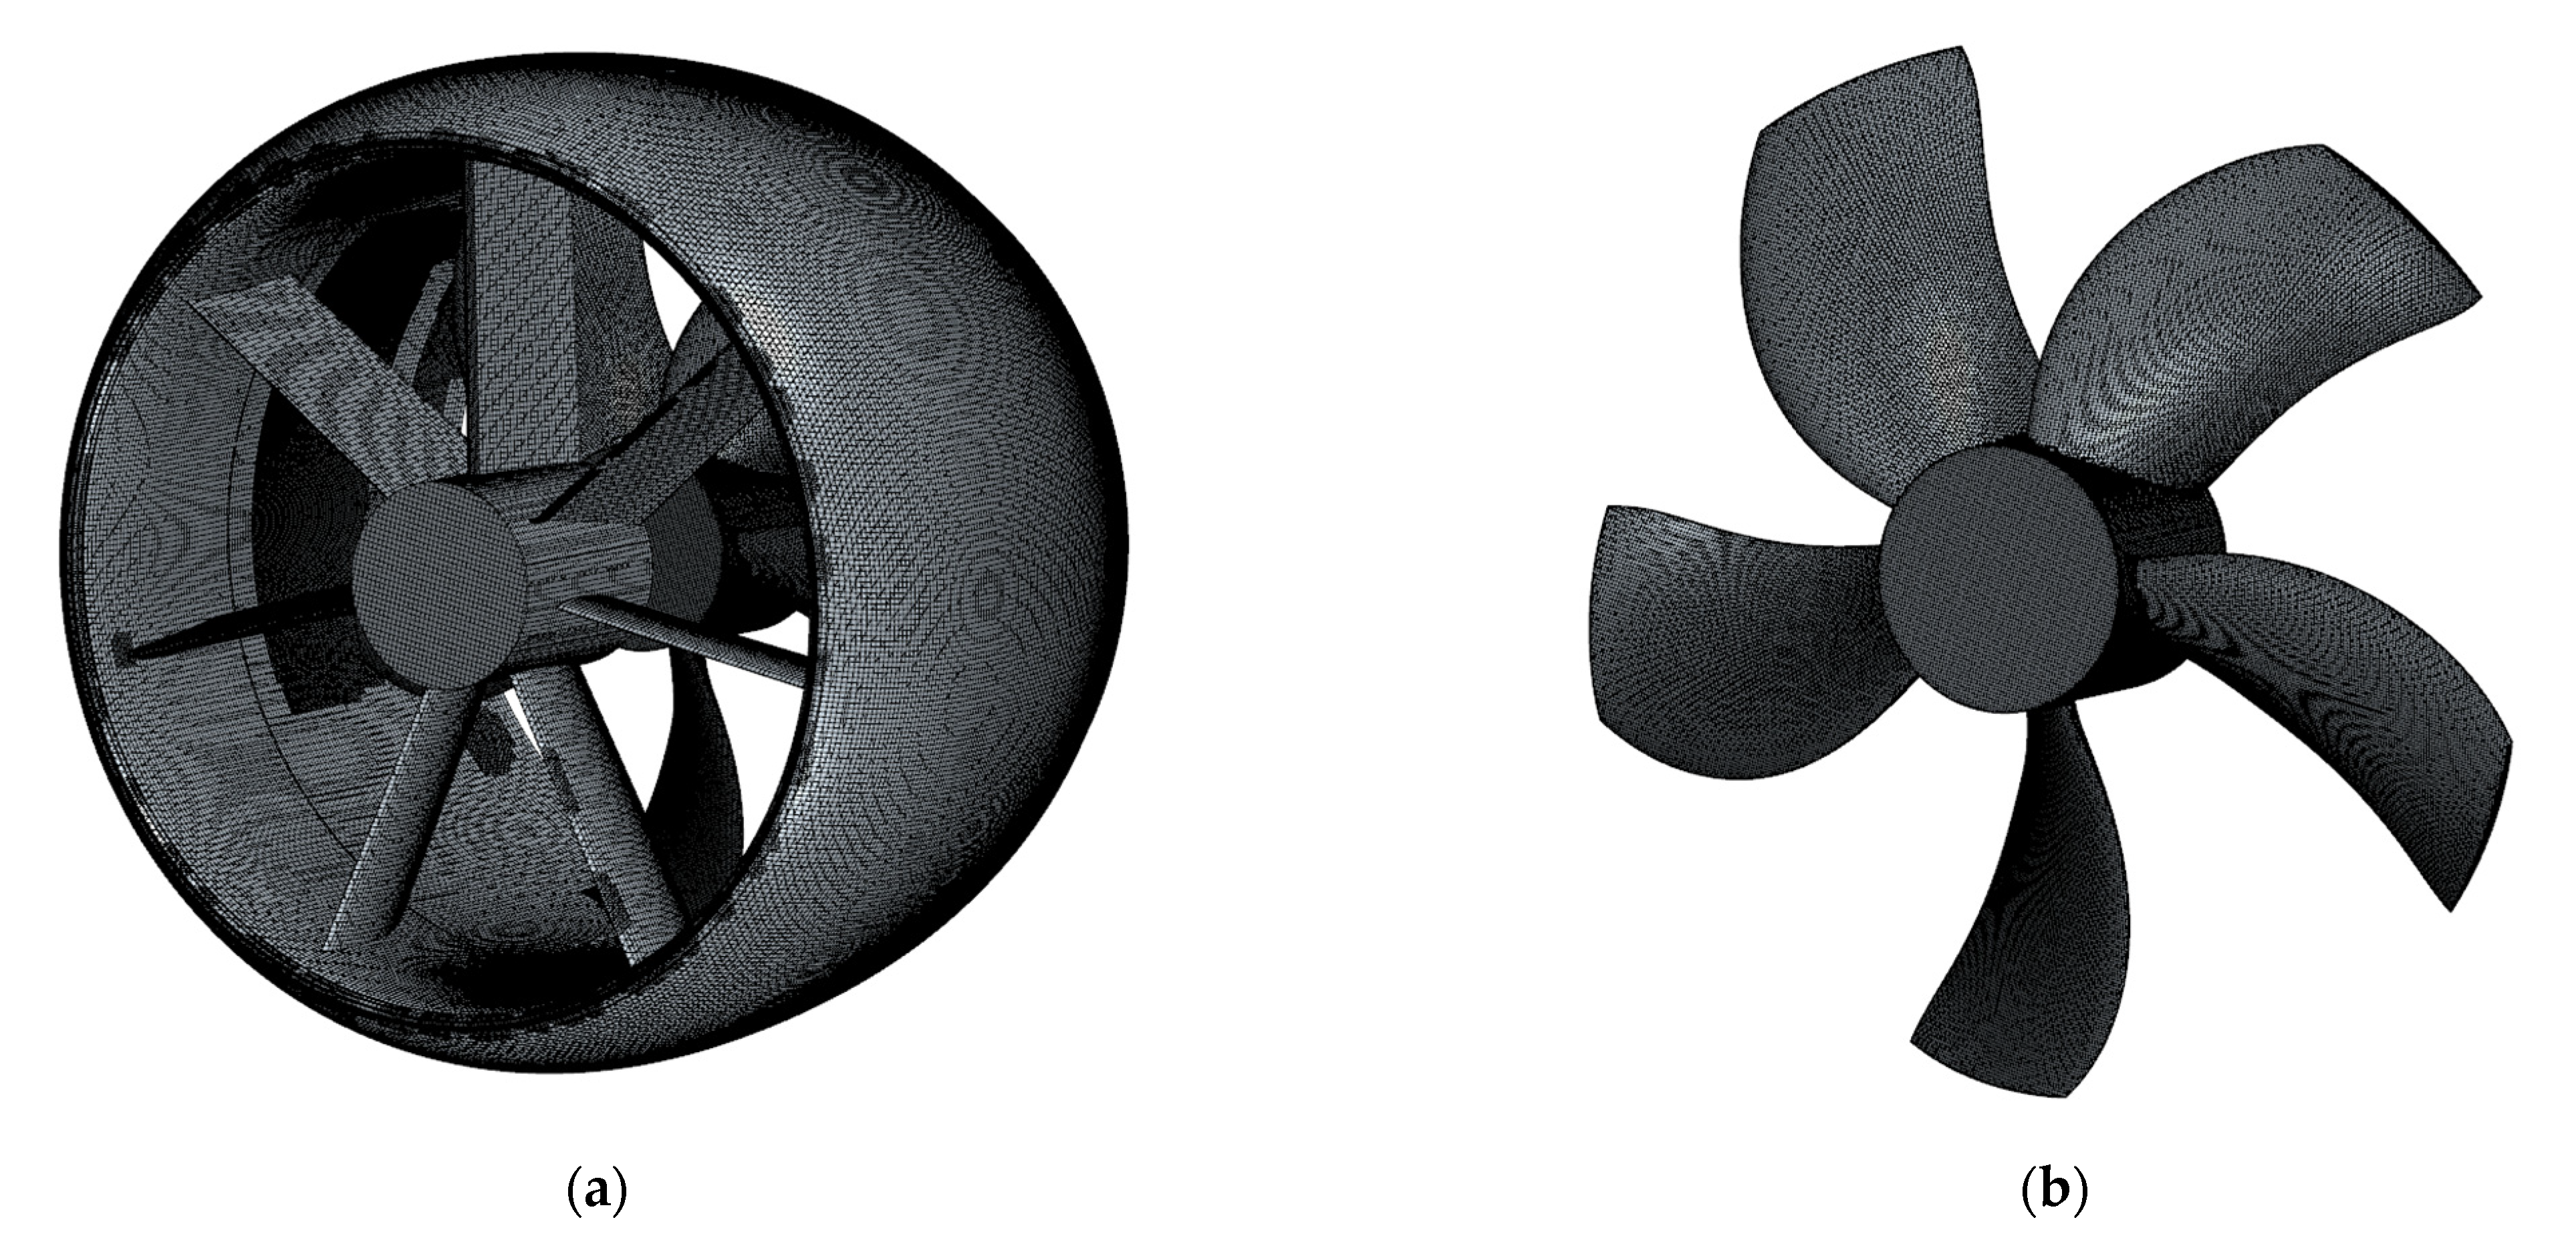
2.2. Numerical Simulation

2.2.1. Numerical Calculation Method

For the prediction of the hydrodynamic performance of the pump-jet propulsion system, the SST k–ω turbulence model and the multi-reference frame (MRF) model are selected for steady-state numerical simulation. The SST k–ω turbulence model uses the k–ω equation inside the boundary layer, and the model can be directly The SST k–ω model can be used in low Reynolds number turbulence without any additional damping effect by using the viscous sublayer all the way to the wall. Most importantly, the SST k–ω model performs well in the simulation of large adverse pressure gradients and separation flows, which is also in line with the working environment of the pump-jet propulsion system. The MRF model can complete the numerical simulation of the flow field including the relative rotation domain and the static domain. The MRF model belongs to the approximate algorithm, and the grid cells are assumed to move at a uniform speed in the model. The MRF model is suitable for most time-homogeneous flows, especially suitable for It is suitable for computing situations where the interaction between the motion computing domain and the stationary computing domain is small.
In this paper, a cylinder whose centerline is collinear with the central axis of the propulsion is used as the outer computational domain. The specific calculation domain size is set as: the calculation domain length is 9D (D is the maximum diameter of the rotor blade), the diameter is 4D, and the distance between the front end surface of the cylinder and the front end of the propulsion duct is 3D, which is the velocity inlet boundary; the rear end surface of the cylinder is away from the propulsion The distance from the front end of the conduit is 6D, which is the pressure outlet boundary; the side of the cylinder outside the computational domain is a symmetry plane, as shown in Figure 10. When the pump-jet propulsion system is working, the rotor rotates at high speed in the conduit, whereas other parts of the propulsion such as the stator and conduit are stationary, and there is severe mutual interference between the rotor and the stator, so the computational domain of the pump-jet propulsion system needs to be divided into two categories: rotating domain and stationary domain. The rotor blade and rotor hub form the rotating domain, whereas the static domain is composed of the front stator and the duct, as shown in Figure 10. In summary, this paper divides the computational domain of the pump-jet flow field into three parts: the rotor rotating domain, the stator duct static domain, and the outer duct flow domain.
The division and generation of computational grids is a very critical step in CFD calculations, and the quality of computational grids directly affects the correctness and reliability of numerical calculation results. Reasonable mesh division can not only improve the feasibility of calculation but also improve the accuracy and efficiency of numerical calculation. Therefore, in this paper, the boundary layer mesh is used for the prismatic layer mesh, and the hexahedral mesh generated by the cutting volume mesh generator is used in the rotating domain and the static domain, as shown in Figure 11 and Figure 12.

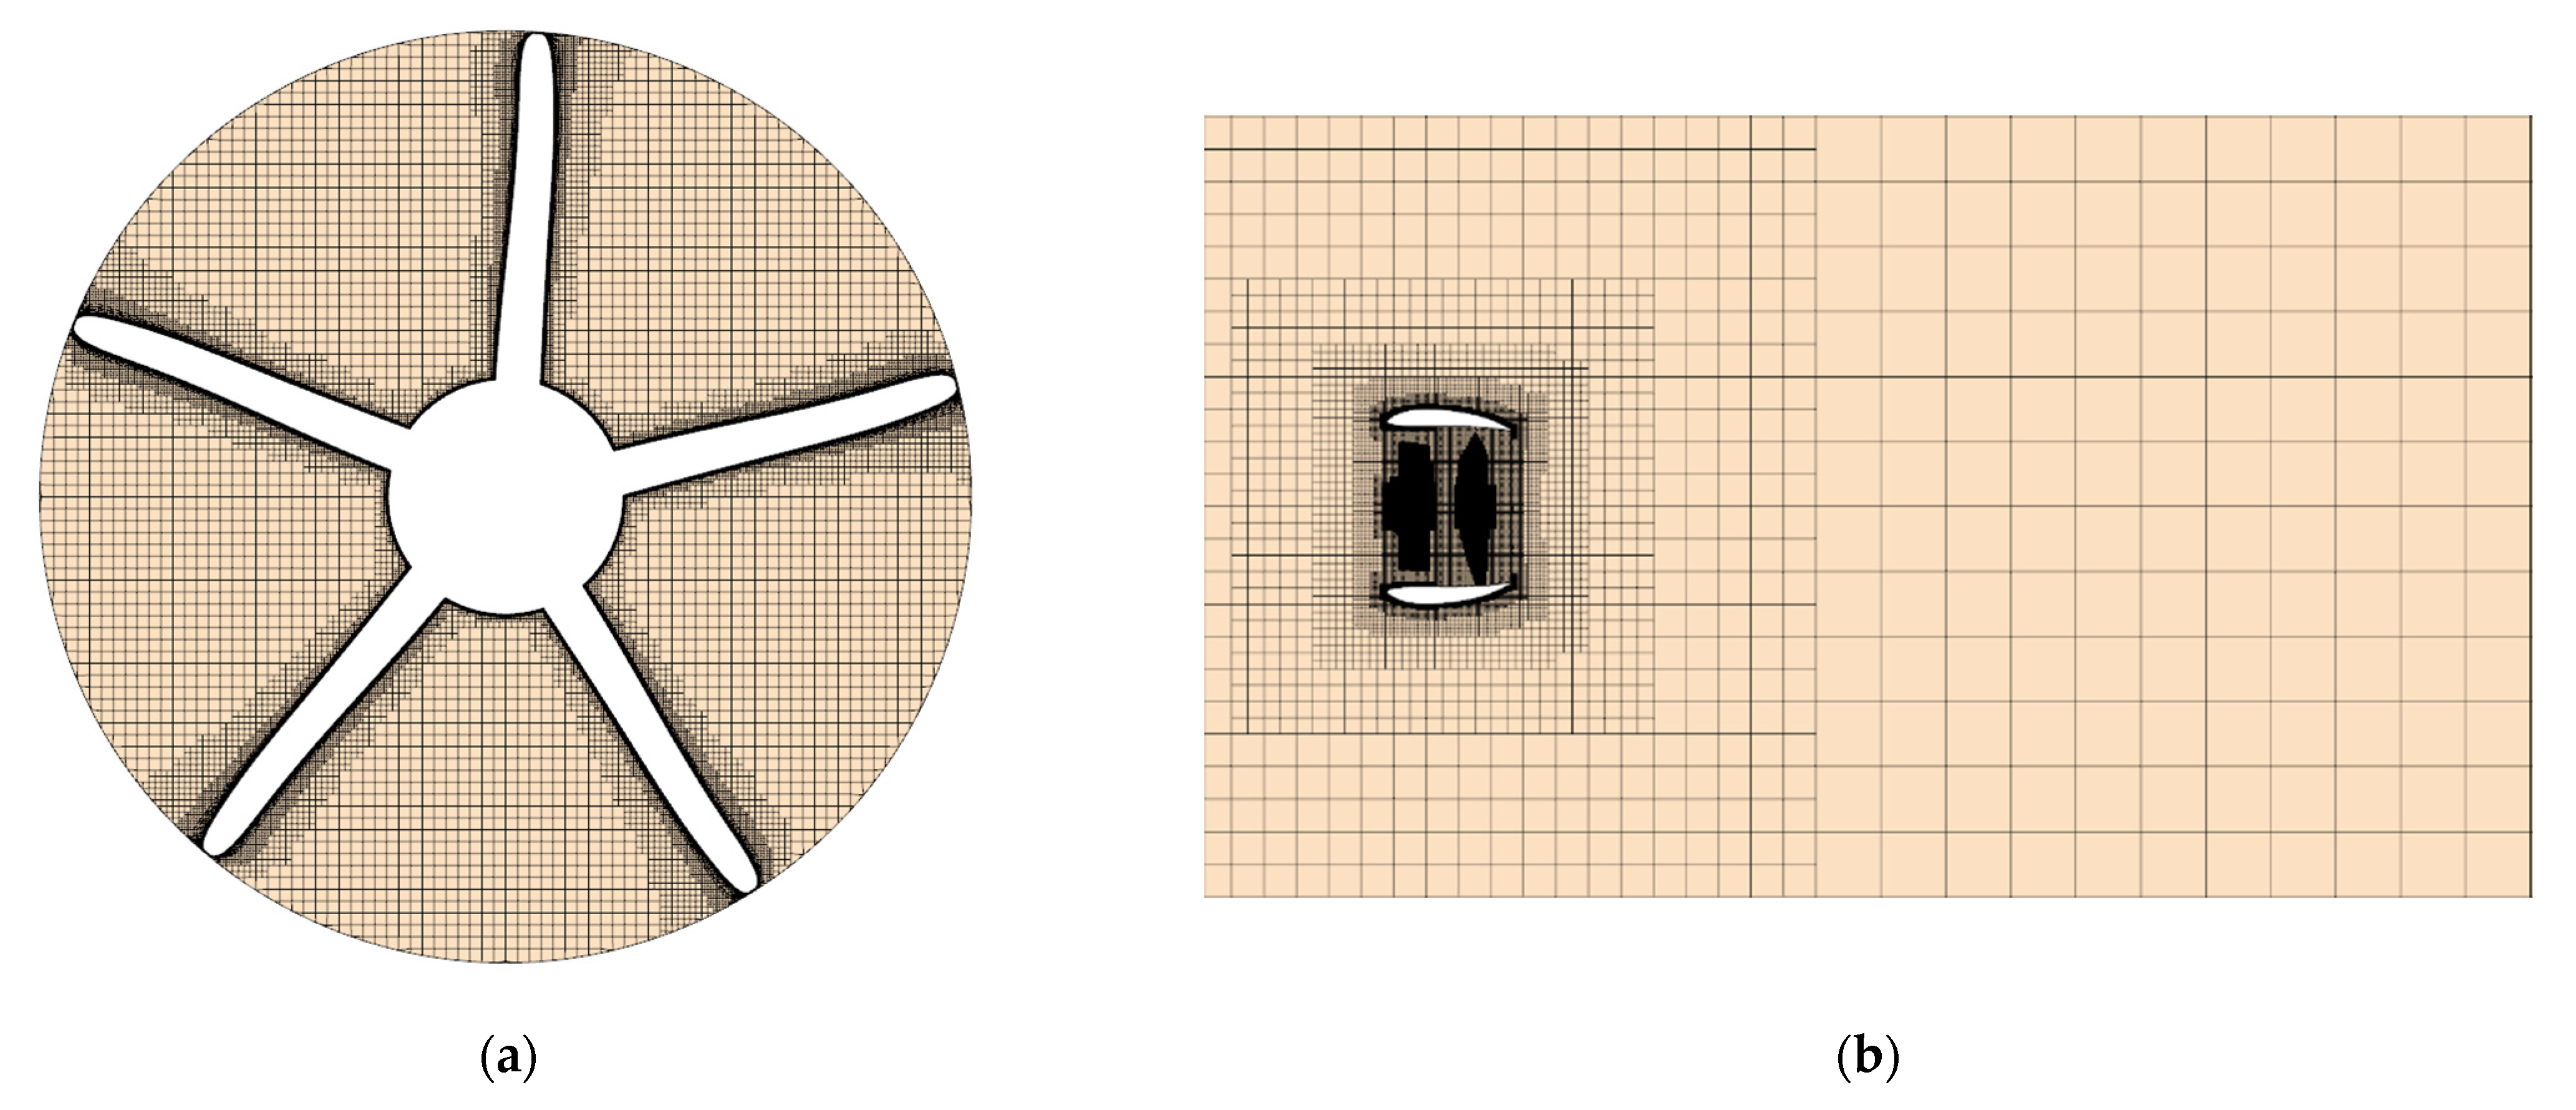
2.2.2. Grid Independence Analysis

The quality of the mesh directly affects the stability and accuracy of the numerical calculation. The increase in the number of meshes requires higher computing performance and longer computing cycles. Therefore, choosing an appropriate grid number is very important to improve the accuracy of numerical calculation and shorten the calculation cycle. In this paper, three sets of grids are selected for grid independence verification, which are 1.77 million, 2.67 million and 3.70 million, respectively. The calculation condition is that the advance coefficient J = 0.75 and the speed n = 10 rps. It can be seen from Table 3 that when the grid size is 2.67 million, the calculation error of KT and 10KQ is small and the grid size is more suitable. Therefore, 2.67 million grids were selected for numerical verification and subsequent hydrodynamic performance optimization of the pump-jet propulsion system.

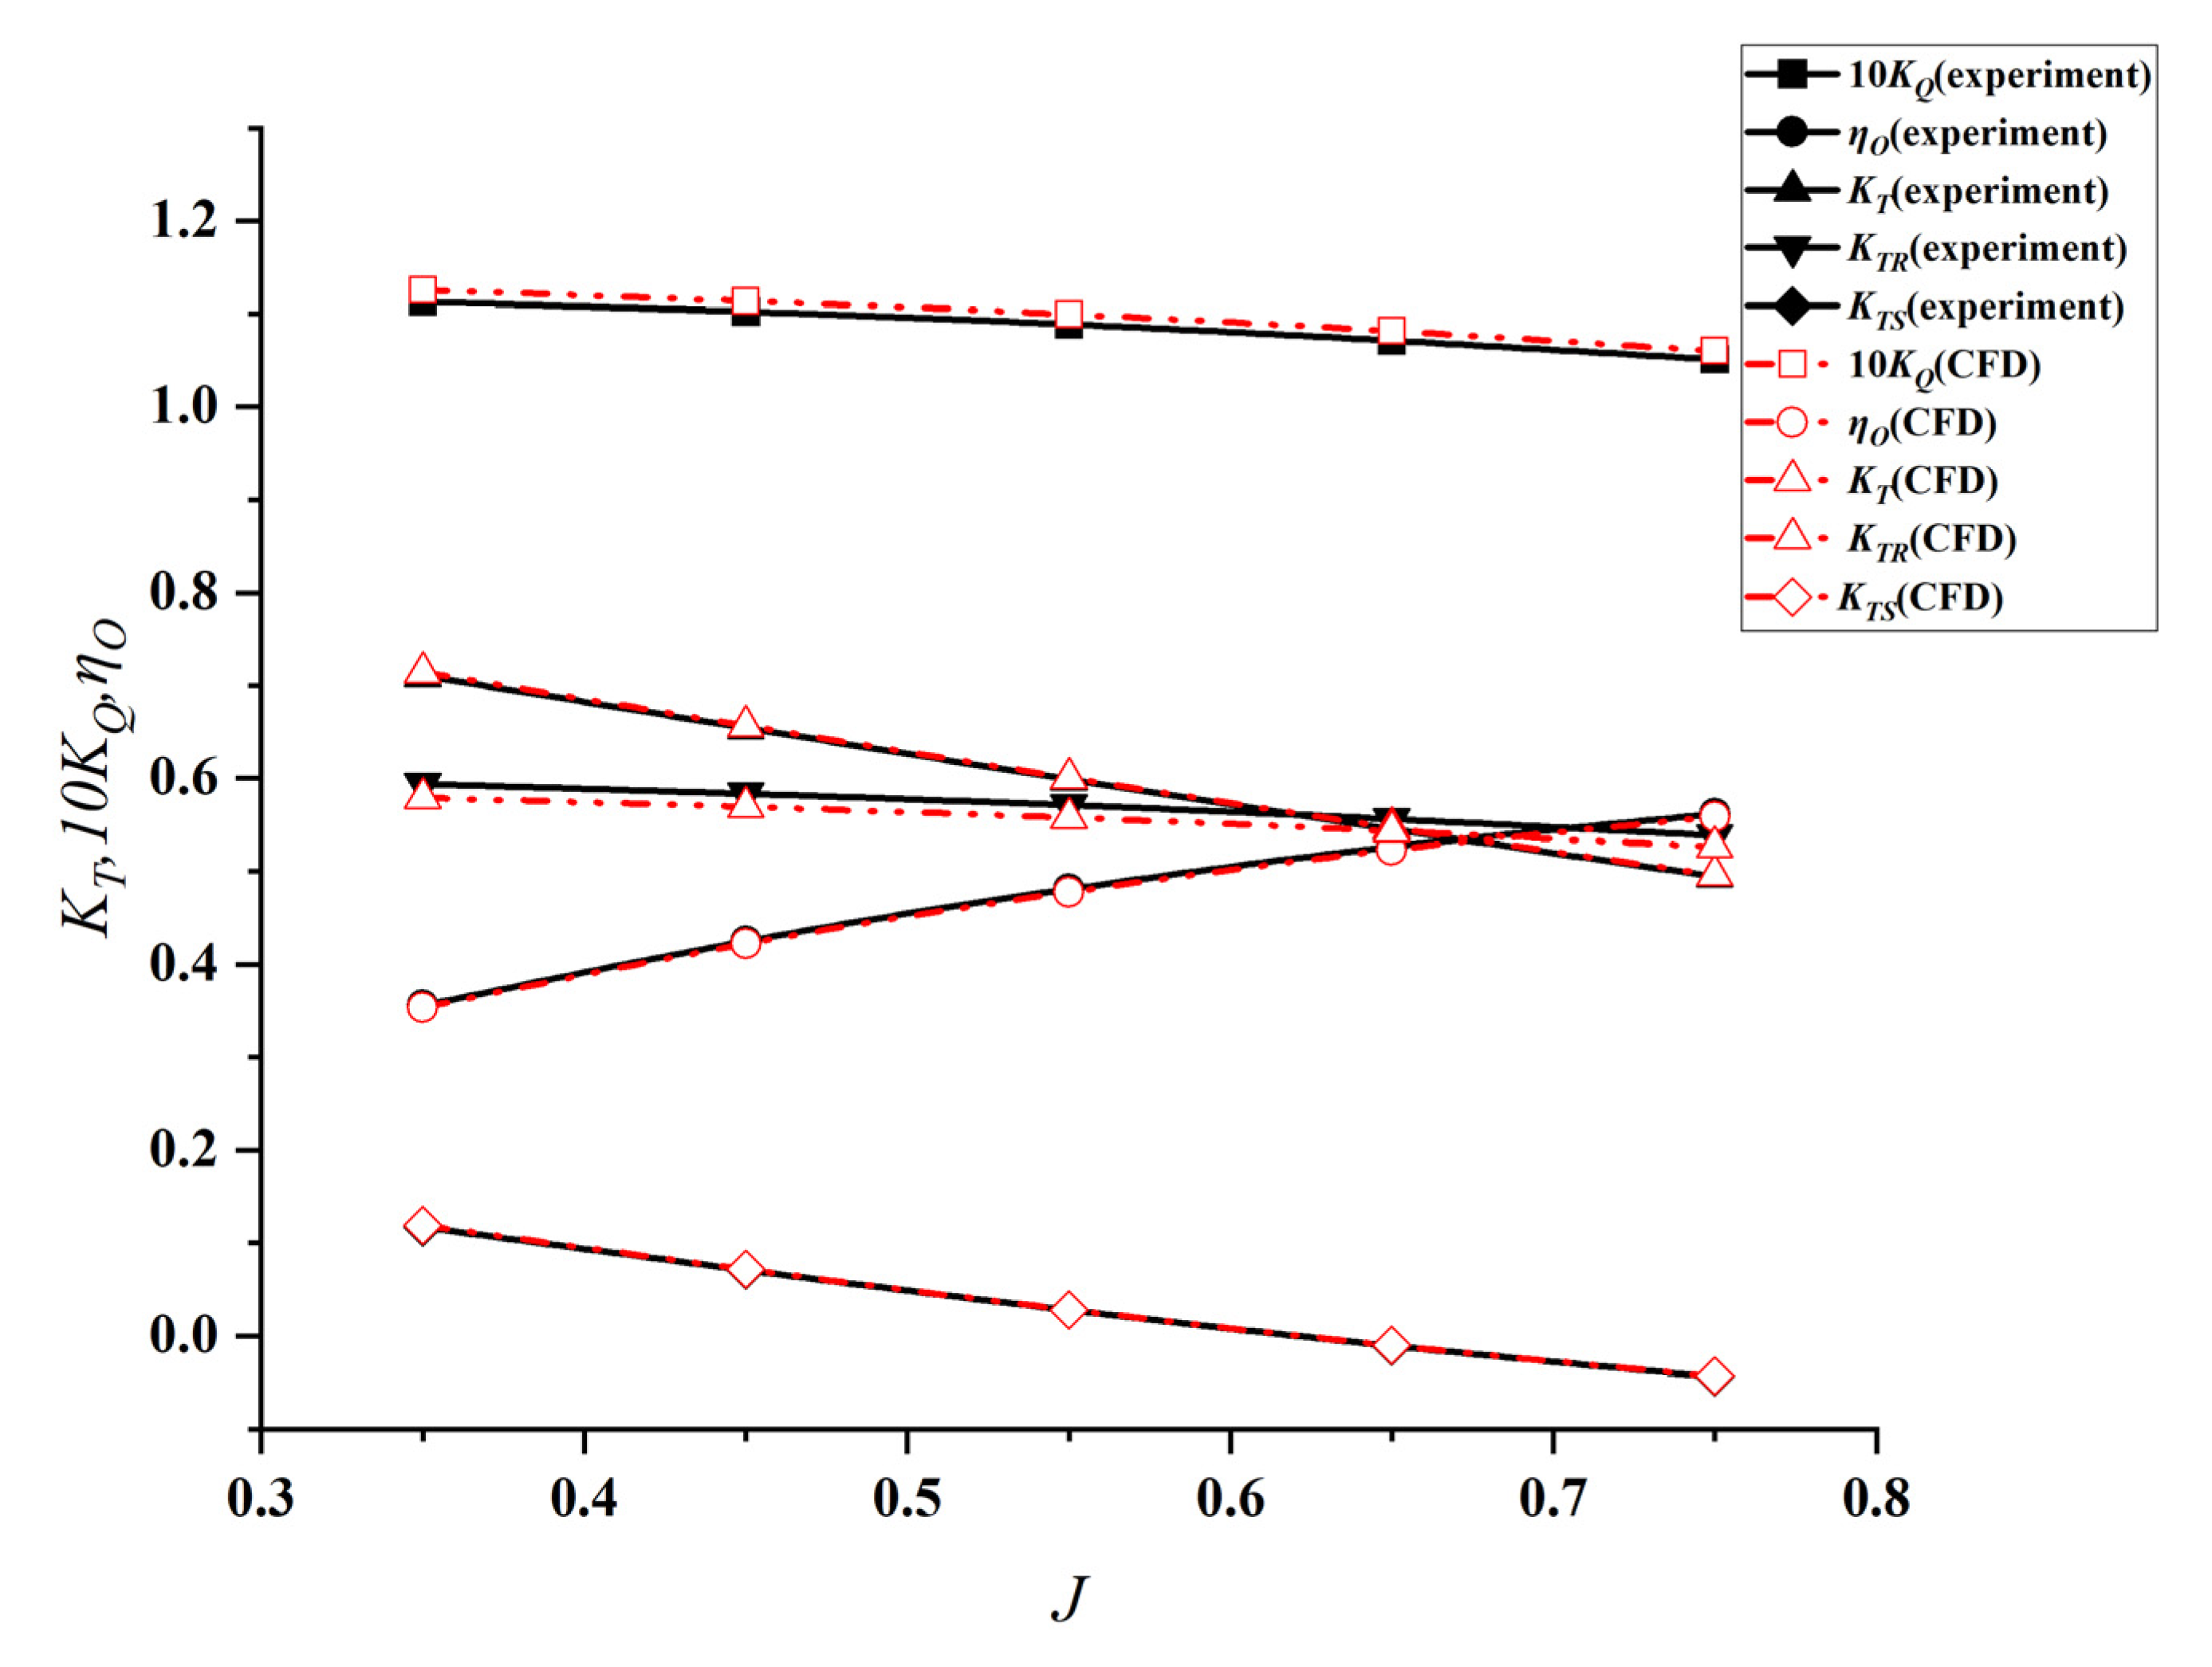
2.2.3. Numerical Verification

A numerical verification of the pump-jet propulsion system was carried out according to the design conditions given in [37]. The thrust coefficient, torque coefficient and open water efficiency are defined.
K T R = T R ρ n 2 D 4 K T S = T S ρ n 2 D 4 K T = T R + T S ρ n 2 D 4 = K T R + K T S
10 K Q = 10 Q R ρ n 2 D 5 η 0 = ( T R + T S ) V A 2 π n Q = J 2 π K T K Q
where TR is the thrust of the rotor; TS is the thrust of shroud and stator; QR is the rotor toque; ρ , n and D represent the fluid density, the revolution speed and the rotor diameter, respectively. J = V A / n D is the advance ratio, and VA is the inlet velocity.
By comparing the calculated results of thrust coefficient, torque coefficient and open water efficiency in this study with the experimental results of Yu et al. [37]. It is found that the two are in good agreement, as shown in Figure 13, and the errors are within 5%, which meets the requirements of engineering calculation.

2.3. Multi-Objective Optimization Design of Pump-Jet Propulsion System

2.3.1. Definition of Multi-Objective Optimization Problem

In the process of optimization design, it is no longer satisfactory to solve the single-objective problem, and there is a problem that multiple optimization objectives need to be solved at the same time, and there may be mutual constraints. The traditional solution often first evaluates the influence of each target on the whole, and then obtains the weight coefficient and applies it to each target, transforming it into a direct single-target problem. This conversion method has fixed requirements for weights, relies on artificial references, has poor flexibility and operability, and can only obtain a unique local optimal solution in one target direction. This solution method is a compromise of hard dimensionality reduction, and the obtained optimal solution cannot match the complete optimal solution. Due to the wide range of practical applications, multi-objective problems have rapidly developed into a research discipline and have produced many reasonable solutions. In general, the definition of this problem is that for multiple goals that may conflict, one goal may lead to the situation where the evaluation degree of other goals is not optimal. Therefore, trade-offs are carried out in the design process to achieve the optimal solution to the maximum extent for multiple goals at the same time [38].
According to the multi-objective optimization problem described above, mathematical expressions 7, and 8, can be expressed as follows [39] by forming groups of multiple objective functions proposed and adding relevant constraints:
min X = Ω F ( X ) = ( f 1 ( X ) , f 2 ( X ) , , f m ( X ) )
X Ω R n s . t g i ( X ) 0 i = 1 , 2 , 3 , , p
where is an n-dimensional vector in R n space, the space D is called the solution range of the optimization problem containing the vector X. f i ( X ) , i = 1 , 2 , 3 , , m , is the problem sub-objective function, which expresses the relationship between the vectors. The composition of multiple objective functions is called the problem objective space, g i ( X ) 0 i = 1 , 2 , 3 , , p , which is the constraint function. It follows from this that one cannot find X Ω R n that minimizes the target problem everywhere simultaneously.
Through the development of the multi-objective problem, the idea of the Pareto solution set was born. The main idea is to obtain a statistical solution set according to the characteristics of influence between multiple objectives, which can better express the results of a multi-objective optimization design. It uses different optimization criteria to trade-off conflicting and contradictory objectives and obtains a set of Pareto optimal solutions that coordinate each optimization objective [40]. In practical applications, one or more solutions can be selected from the Pareto solution set as the optimal solution of the multi-objective optimization problem according to the degree of understanding of the design problem and the judgment tendency of decision-makers.

2.3.2. Optimization Algorithm

The optimization technique is the guide in the automatic optimization design process of the pump-jet propulsion system, which will guide the design search direction scientifically in the whole process. The main optimization algorithms used in the optimization design process in this paper are the SOBOL (Sobol quasi-random sequence) algorithm and the NSGA-II algorithm. The SOBOL sequence is a kind of quasi-random sequence. The principle of the SOBOL sequence algorithm is to calculate each variable, and then obtain the correct result, which can be diffused to the entire feasible region in a standard form to achieve a comprehensive and uniform diffusion. A more evenly divided result is obtained, so a more complete description of the random variable can be achieved based on a relatively small number of points. The SOBOL l search algorithm is to calculate the variance of the target result to obtain the derivatives of the design variables, and to determine the sensitivity of the design variables to the analysis of the model, so as to obtain the influence rate of each design variable on the optimization target. The main equation of the algorithm is constructed as Equation (9) [41].
f ( x 1 , , x n ) = f 0 + i = 1 n f i ( x i ) + 1 i j n f i j ( x i , x j ) + + f 12 n ( x 1 , x 2 , , x n )
where f0 is a constant and the integral over each subterm variable is zero: as in Equation (10).
0 1 f i 1 , i s ( x i ˙ 1 , , x i s ) d x i k = 0 ,   1 k s
The total variance of f(x) can be written as D = K f 2 ( x ˉ ) d x ˉ     f 0 2
D i 1 i s = 0 1 0 1 f i 1 i s 2 ( x i 1 , , x i s )   d x i 1 d x i s
D = i = 1 n D i + 1 i j n D i j + + D 12 n
The optimal design variable sequence generated by the SOBOL algorithm is not only uniformly distributed but also has a fast convergence speed. Therefore, this study uses the SOBOL algorithm to generate the optimal design variable matrix to study the correlation of the optimal design variables.
NSGA-II is one of the most popular multi-objective genetic algorithms at present [42]. It reduces the complexity of the non-inferior sorting genetic algorithm, has the advantages of fast running speed and good convergence of the solution set, and becomes the benchmark for the performance of other multi-objective optimization algorithms. NSGA-II is improved on the basis of the first-generation non-dominated sorting genetic algorithm, and its improvement is mainly aimed at the three aspects mentioned above: a fast non-dominated sorting algorithm is proposed, on the one hand, it reduces the computational complexity, On the other hand, it merges the parent population with the child population, so that the next generation of the population is selected from the double space, so as to retain all the best individuals; the introduction of an elite strategy ensures that some excellent population individuals are in the It will not be discarded in the evolution process, thus improving the accuracy of the optimization results; the use of crowding degree and crowding degree comparison operator not only overcomes the defect of needing to specify shared parameters manually in NSGA, but also uses it as the comparison standard between individuals in the population, so that the individuals in the quasi-Pareto domain can evenly expand to the entire Pareto domain, ensuring the diversity of the population.

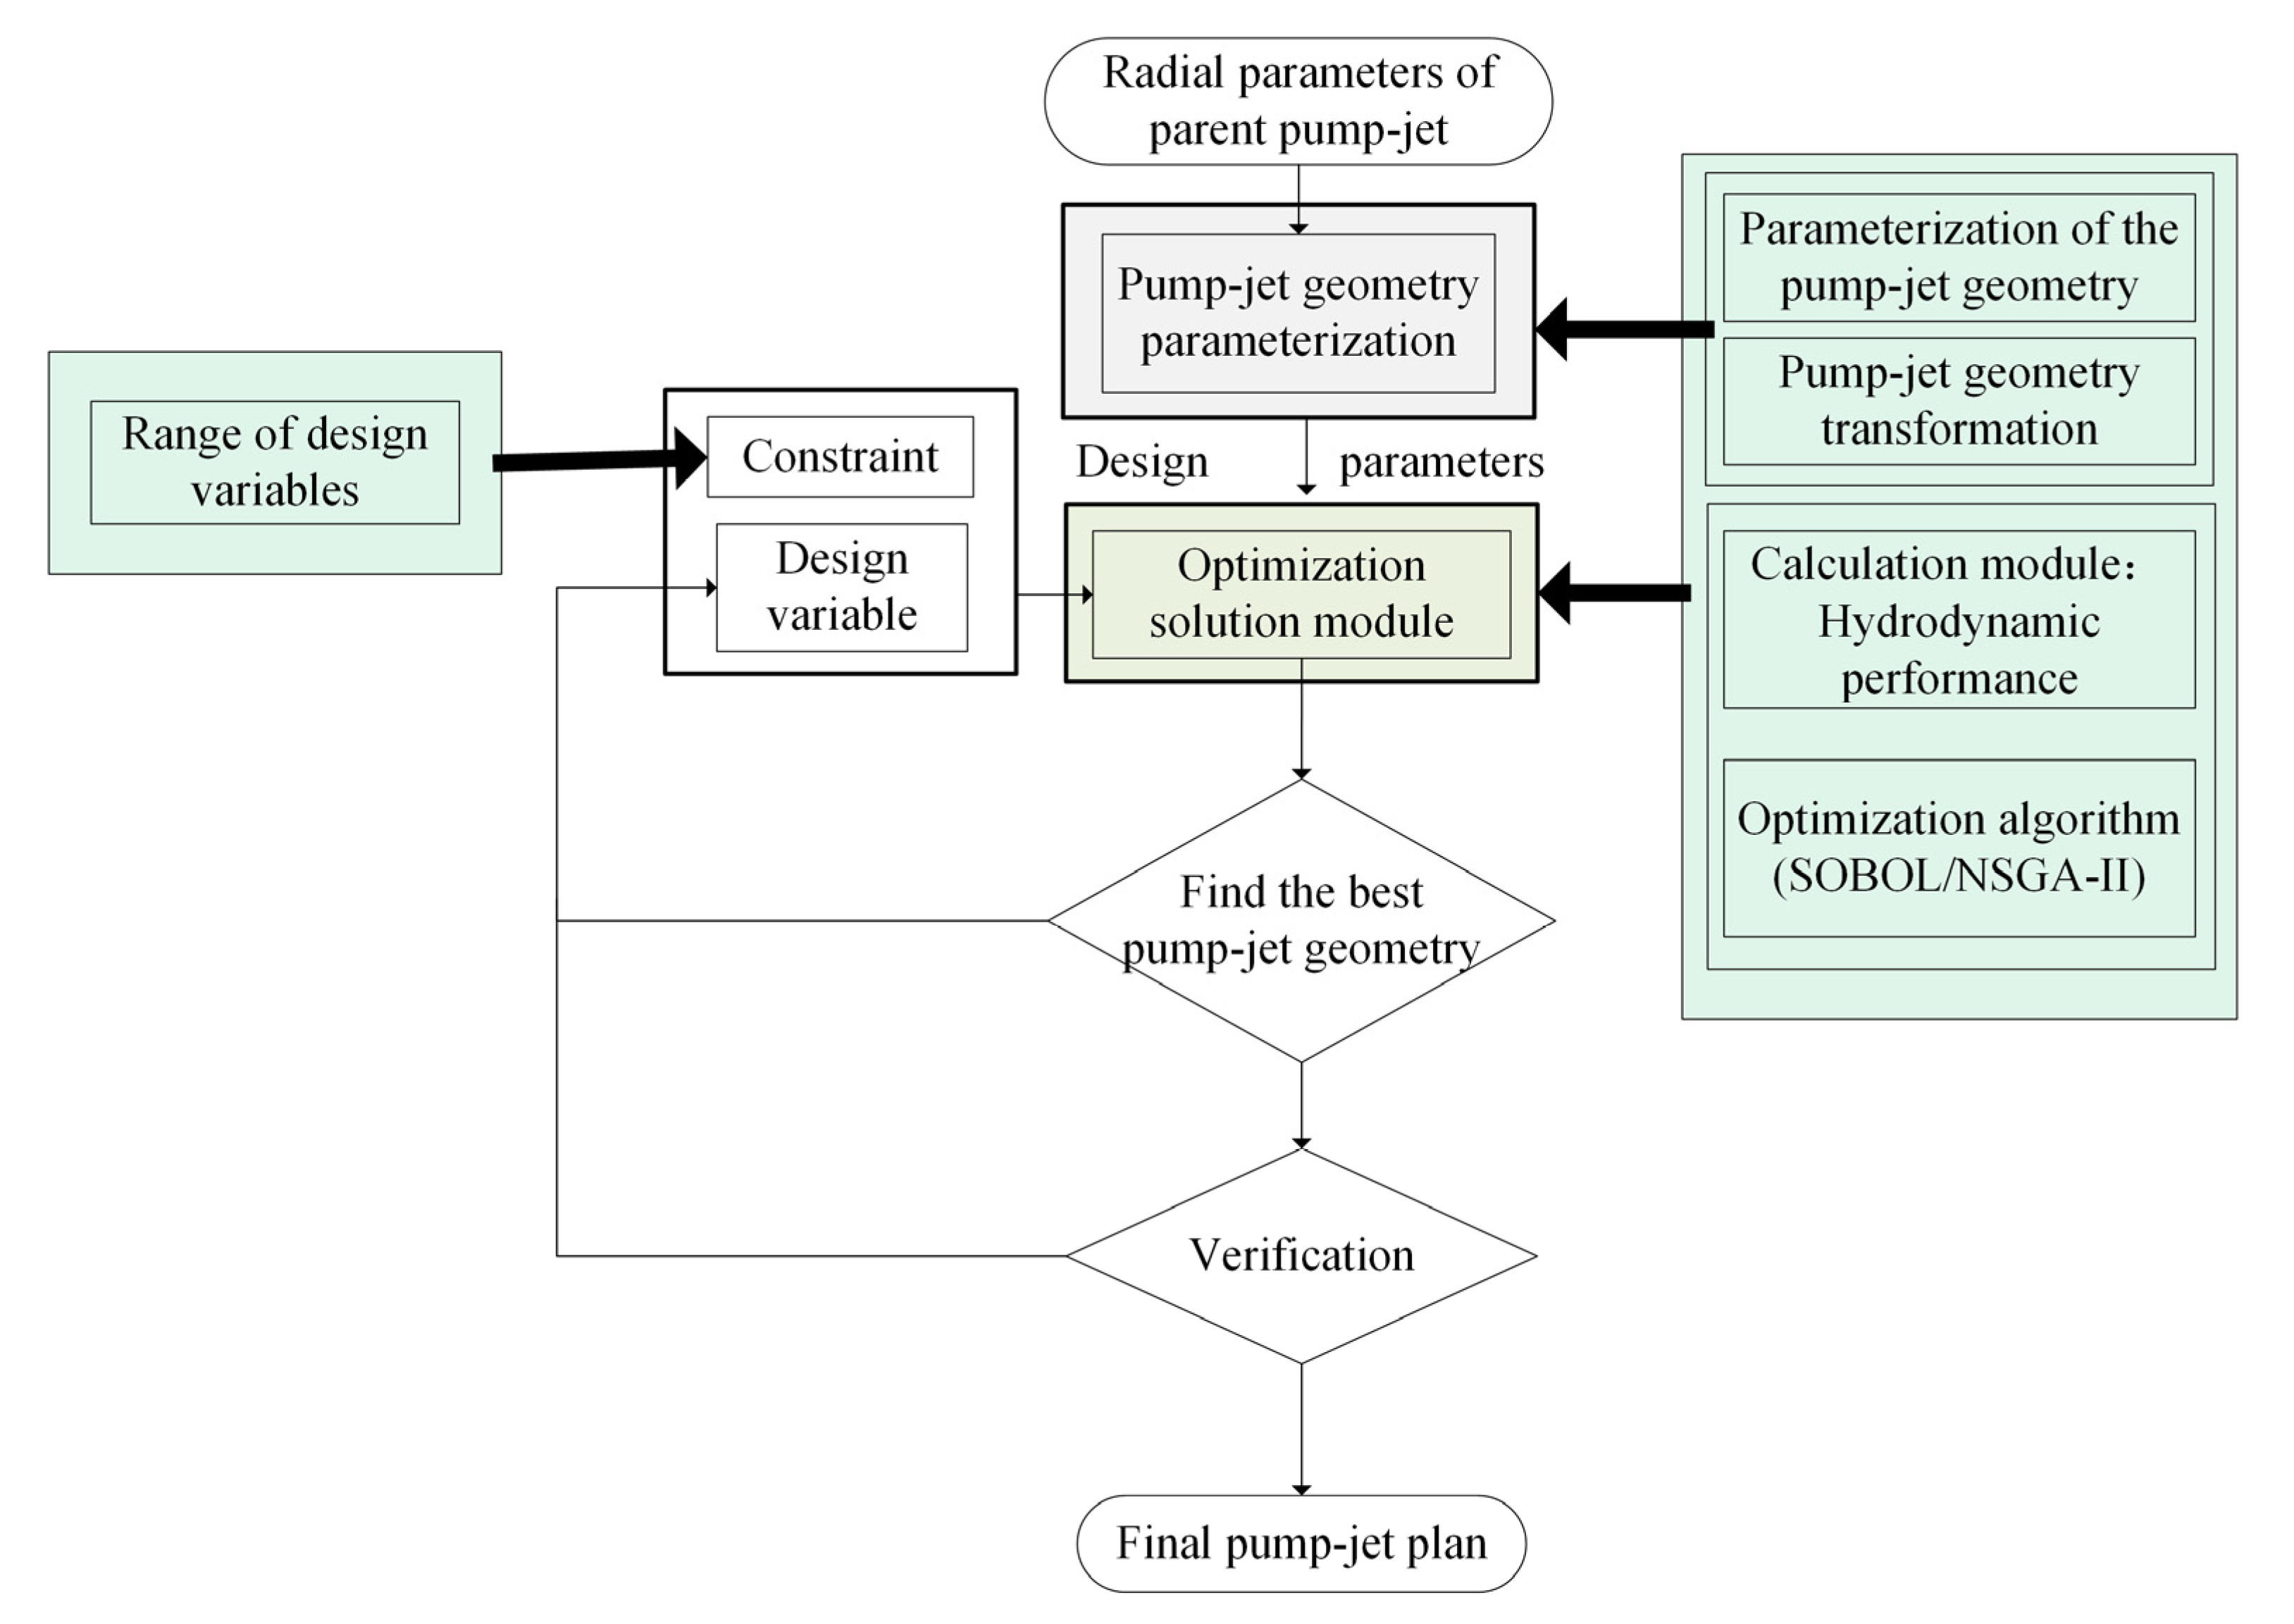
2.3.3. Optimization Design Procedure

For the optimization design of the pump-jet propulsion system, the optimization objective mainly considers the open-water efficiency and the thrust coefficient; the open-water efficiency and the thrust coefficient reflect the hydrodynamic performance of the pump-jet propulsion system. The constraint condition is the variation range of the optimization design variable. The optimization design variables can express the geometrical shape of the pump-jet propulsion system rotor, including chord, camber, thickness, pitch, rake, and skew under different radial direction. Unsteady force is one of the important sources of low frequency vibration and noise, which is produced by pump-jet propulsion system operation caused by inflow turbulence. Therefore, in this paper, the amplitude of unsteady force is considered as a factor in the optimization calculation, and the amplitude of unsteady force is compared and checked for the optimized pump-jet propulsion system. The objective function and design variables in the optimization design problem of pump-jet propulsion system are not simple mathematical relationships. It is necessary to build a bridge between the two with the help of pump-jet propulsion system performance evaluation tools, and then use the optimization algorithm to solve (Figure 14). Its essence is to find the corresponding pump-jet propulsion system design scheme when the target performance is optimal under the condition of satisfying the relevant constraints.

3. Result and Analysis

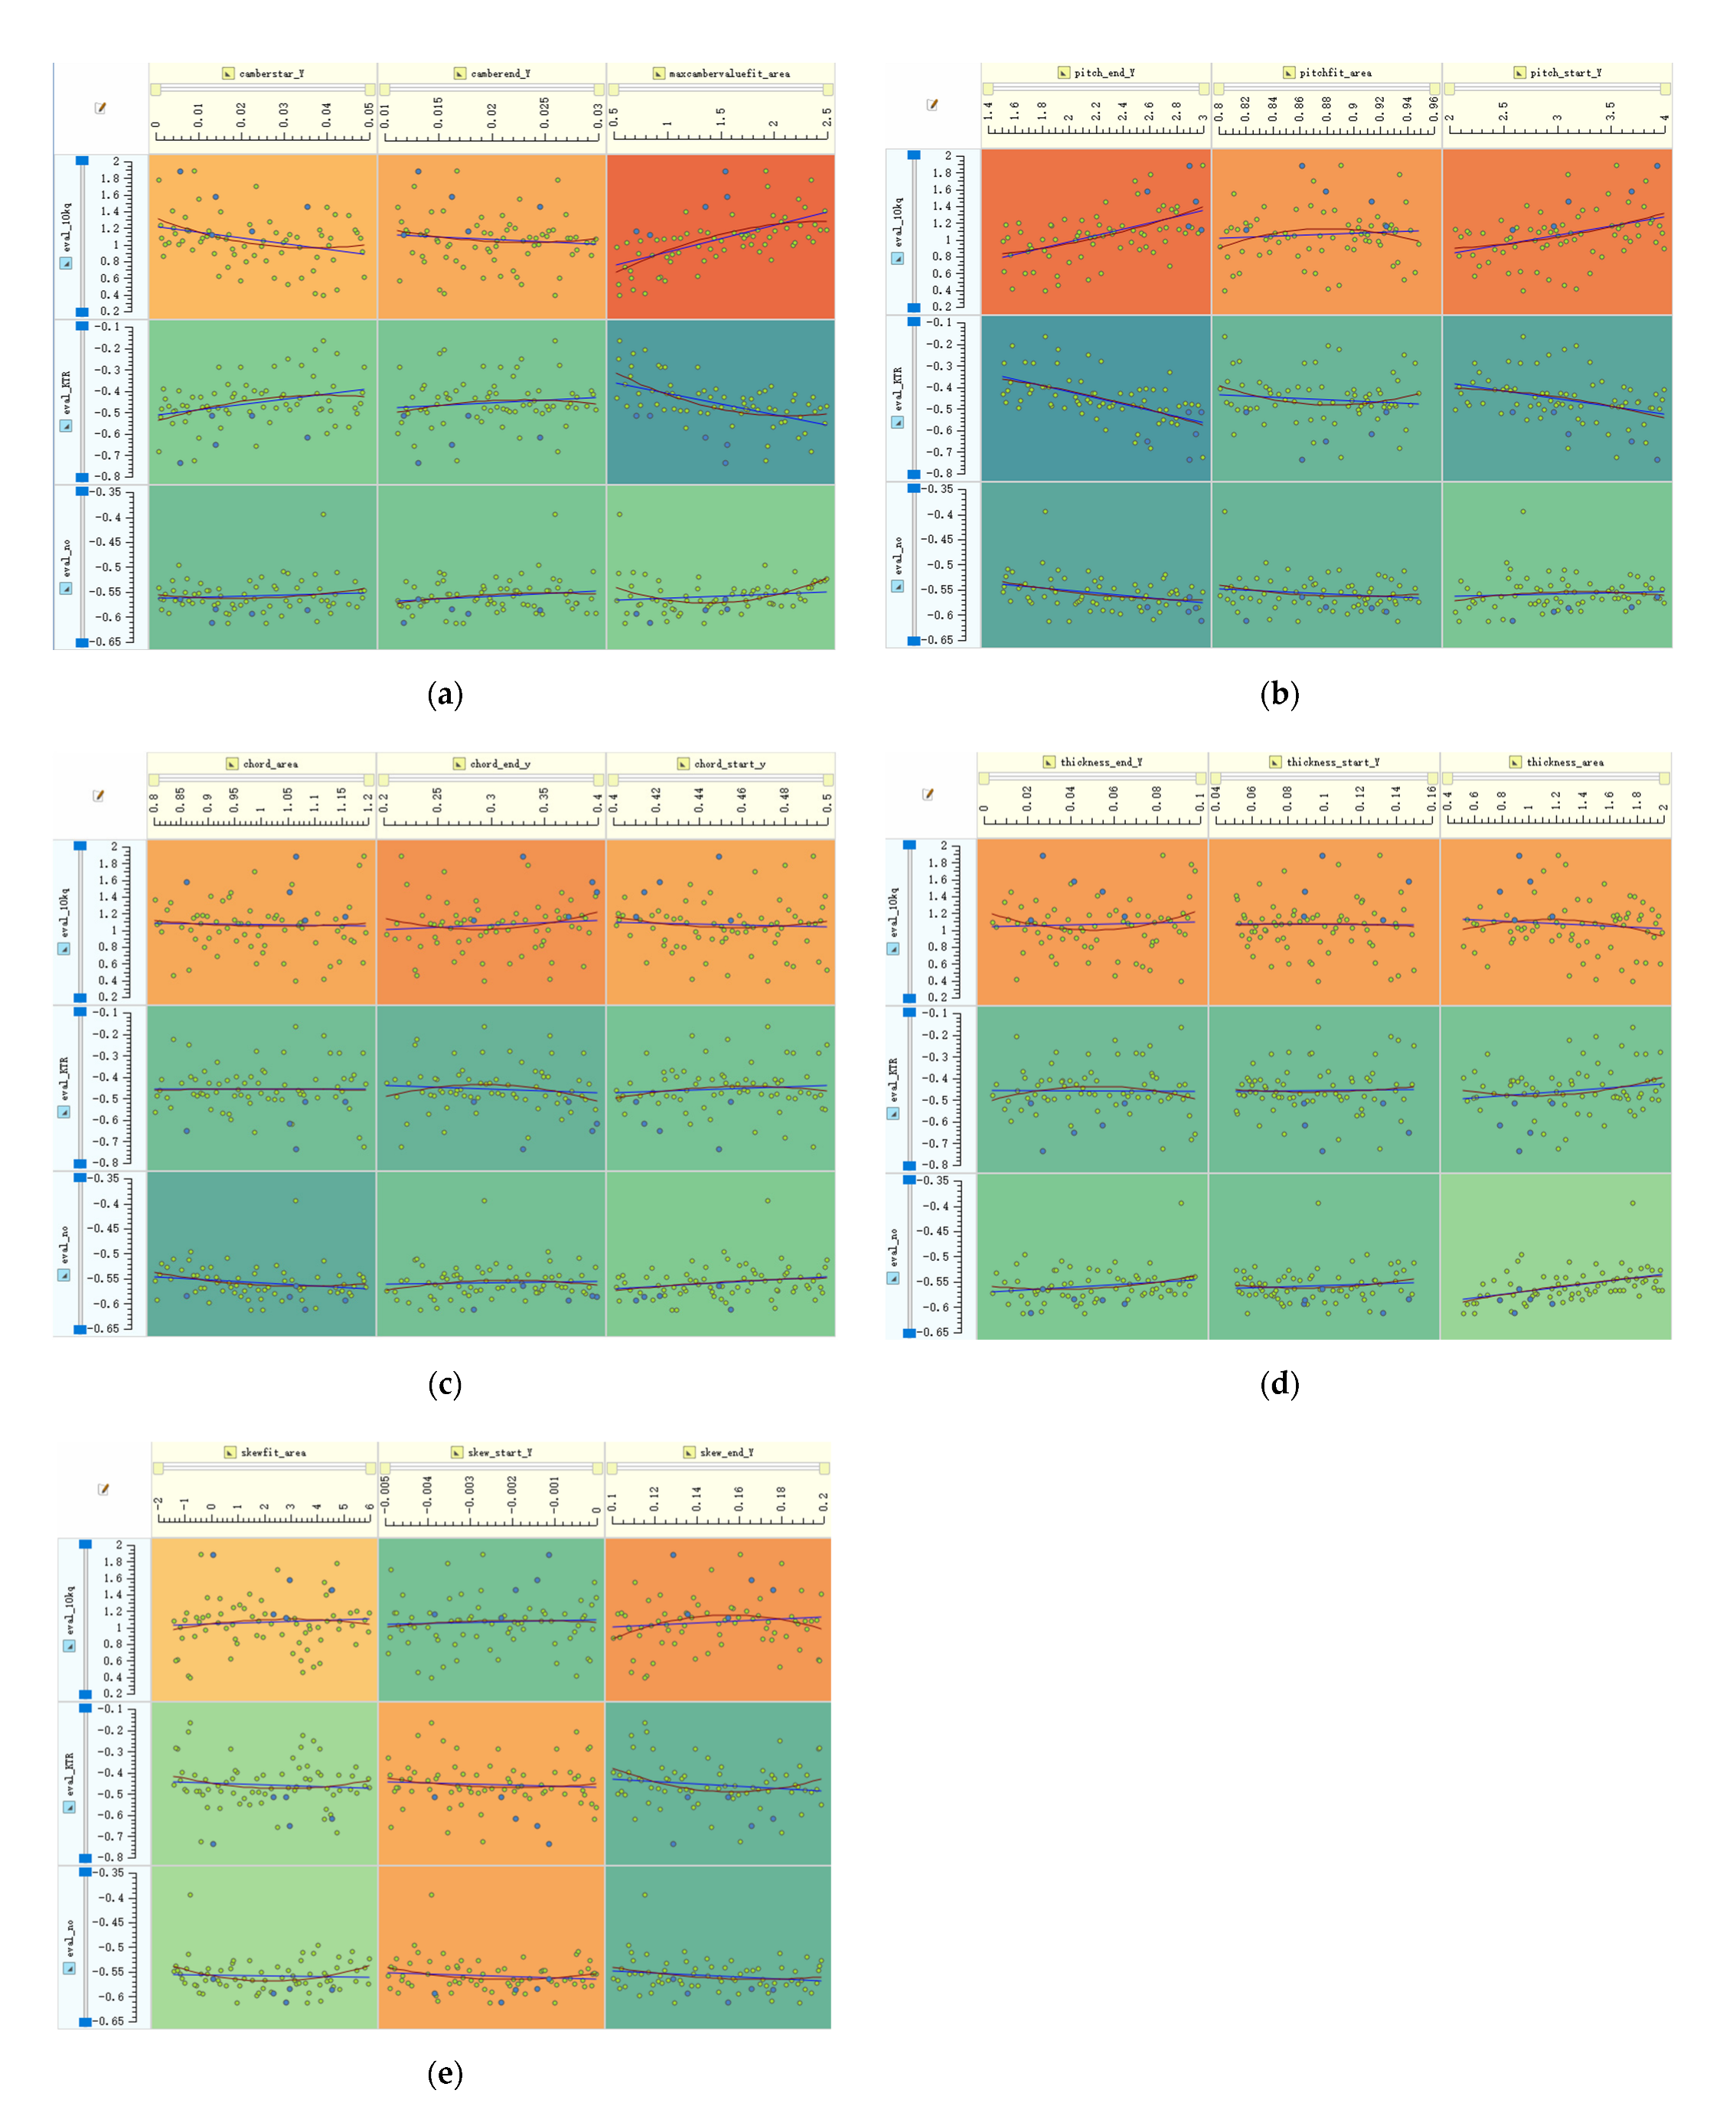
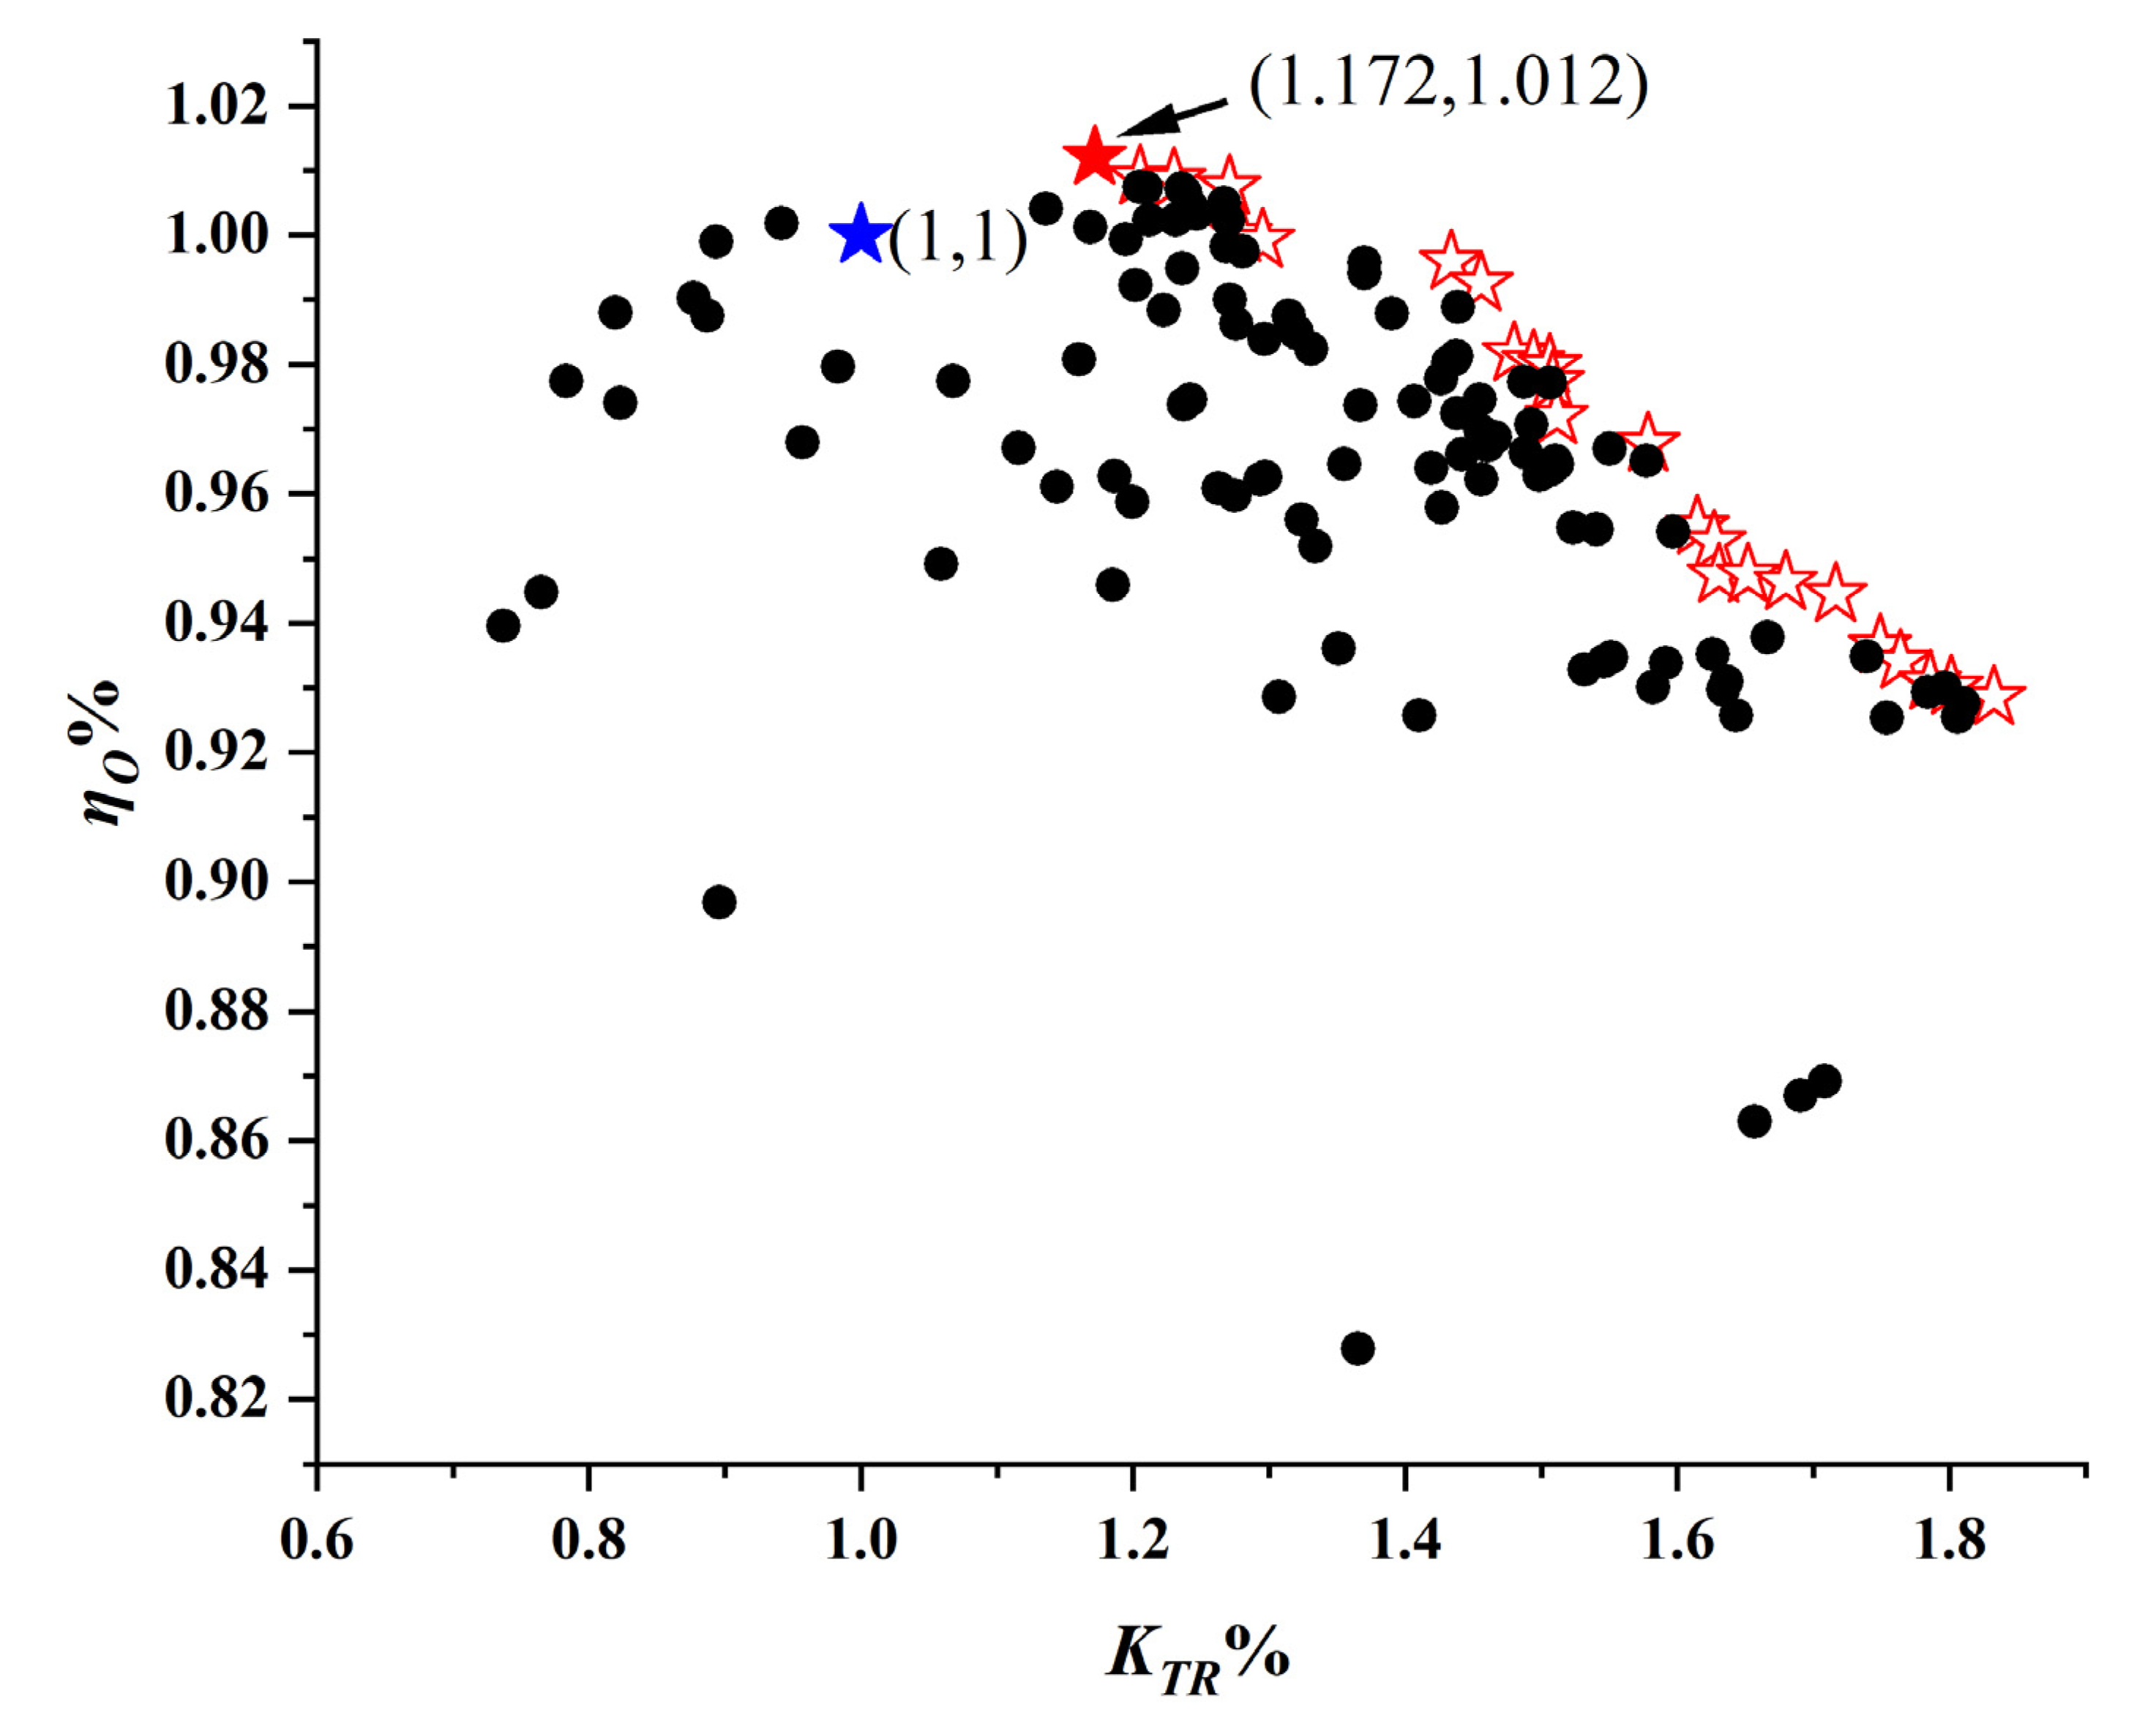
3.1. Sensitivity Analysis and the Selection of Optimal Solution

In this paper, the main parameter curves that can accurately describe the shape of the pump-jet propulsion system rotor are taken as the optimization design variables. Each curve takes three design variables (refer to as the F-spline curve), the Y value of the starting point of the curve, the curve and the coordinate axis. Area and the Y value of the endpoint of the curve, a total of 15 design variables. The optimization objectives are the open water efficiency and the rotor thrust coefficient of the pump-jet propulsion system. The optimization process is to first use the SOBOL algorithm to perform a global uniform search on it, find the better individuals, and perform sensitivity analysis on the optimization design variables to find out the design variables that have a greater impact on the optimization goal. Then, based on this, the NSGA-II algorithm is used for multi-objective optimization, which is repeated in order to obtain the optimal pump-jet propulsion system scheme. SOBOL searched for 100 individual, 15 optimal design variables for the correlation of the open water efficiency ηO, the thrust coefficient KT and the torque coefficient 10KQ. The blue line represents the primary fit, and the red line represents the quadratic fit. It is found that the camber and pitch have a great influence on the open water efficiency ηO, the thrust coefficient KT and the torque coefficient 10KQ, as shown in Figure 15a,b. The change of the chord length and the thickness has little effect on the open water efficiency ηO, the thrust coefficient KT and the torque coefficient 10KQ. As shown in Figure 15c,d, the change of side slope has little effect on the open water efficiency ηO, the thrust coefficient KT and the torque coefficient 10KQ. In Figure 15e, it can be seen from the global optimization of SOBOL that the camber, the pitch open water efficiency ηO, the thrust coefficient KT and the torque coefficient 10KQ have significant effects, which can be considered in the next optimization using the NSGA-II optimization algorithm.
When using the NSGA-II optimization algorithm for multi-objective optimization of the pump-jet propulsion system, the population size was selected as 12, and 144 individuals were generated after 12 iterations. Figure 16 shows the normalized distribution of open water efficiency and thrust coefficient at the sample point on the plane. The blue point is the parent pump-jet propulsion system, the red solution set is the Pareto optimal solution set, and the black solution set is the non-inferior solution. The results pursued in these two optimization objectives are the maximum open water efficiency and the maximum thrust coefficient, so the optimal solutions of these two objectives should also appear in the upper right corner of the figure. In this paper, the sample points with the largest open water efficiency are selected for analysis.

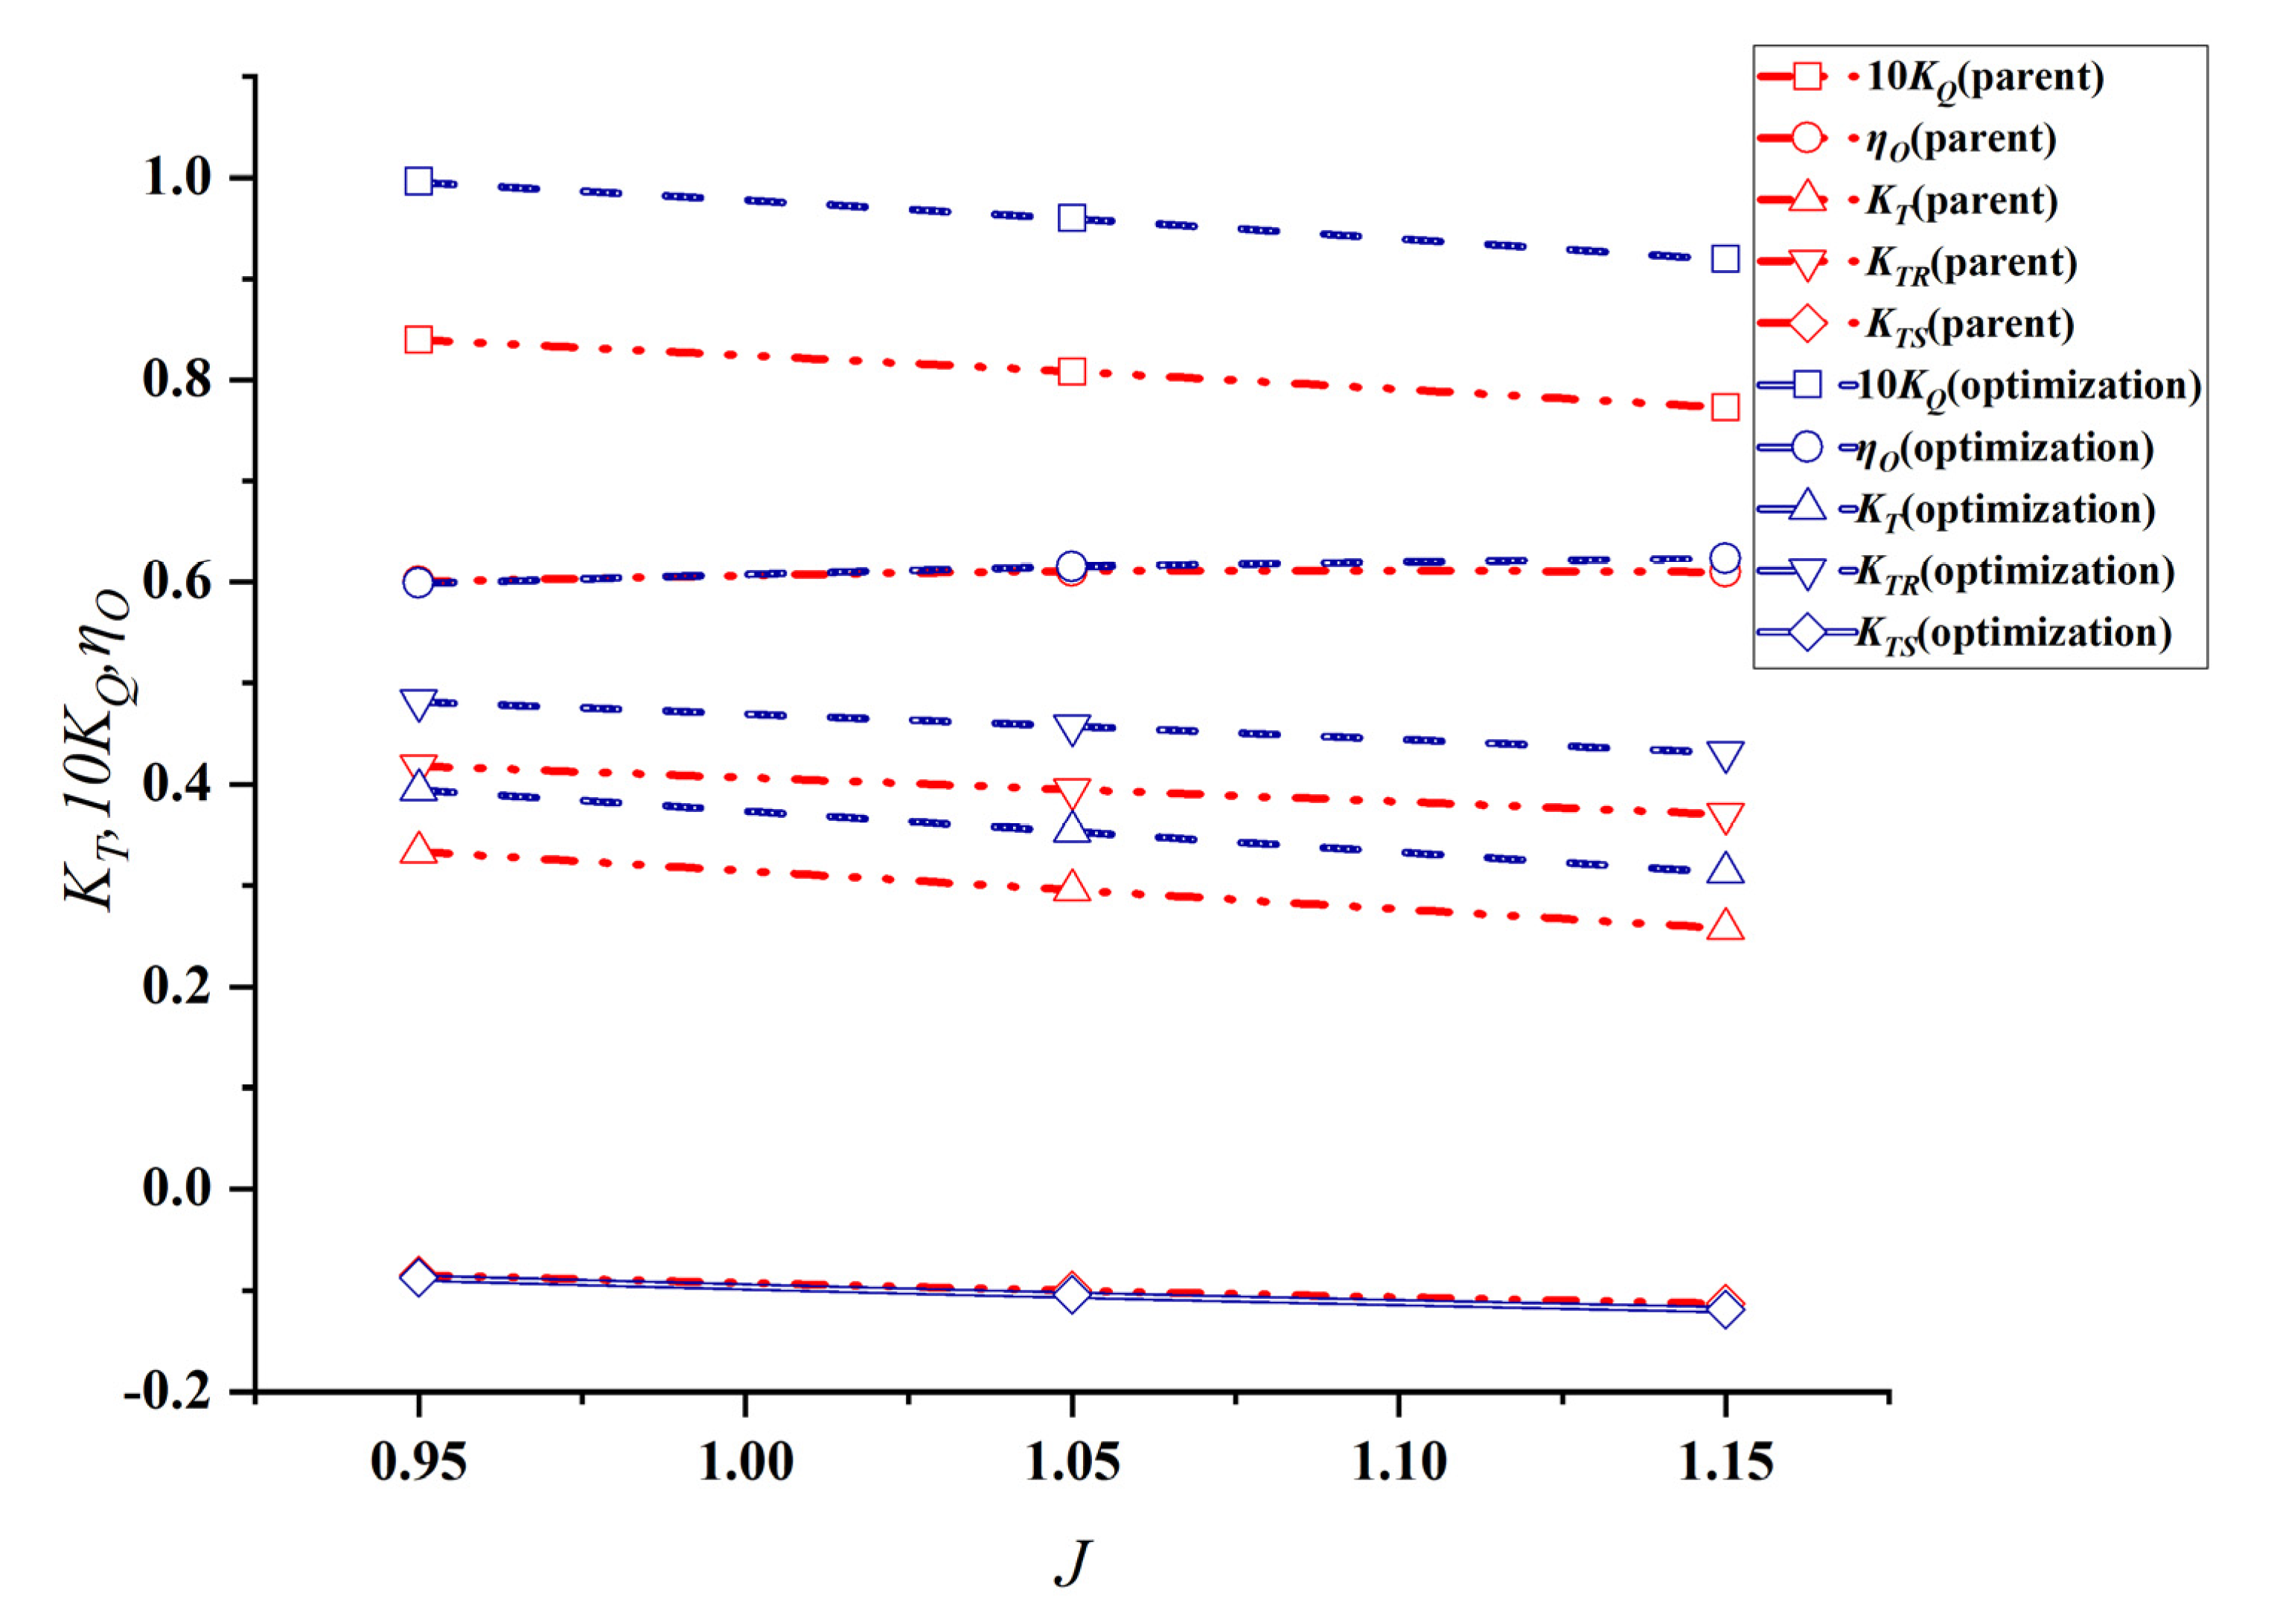
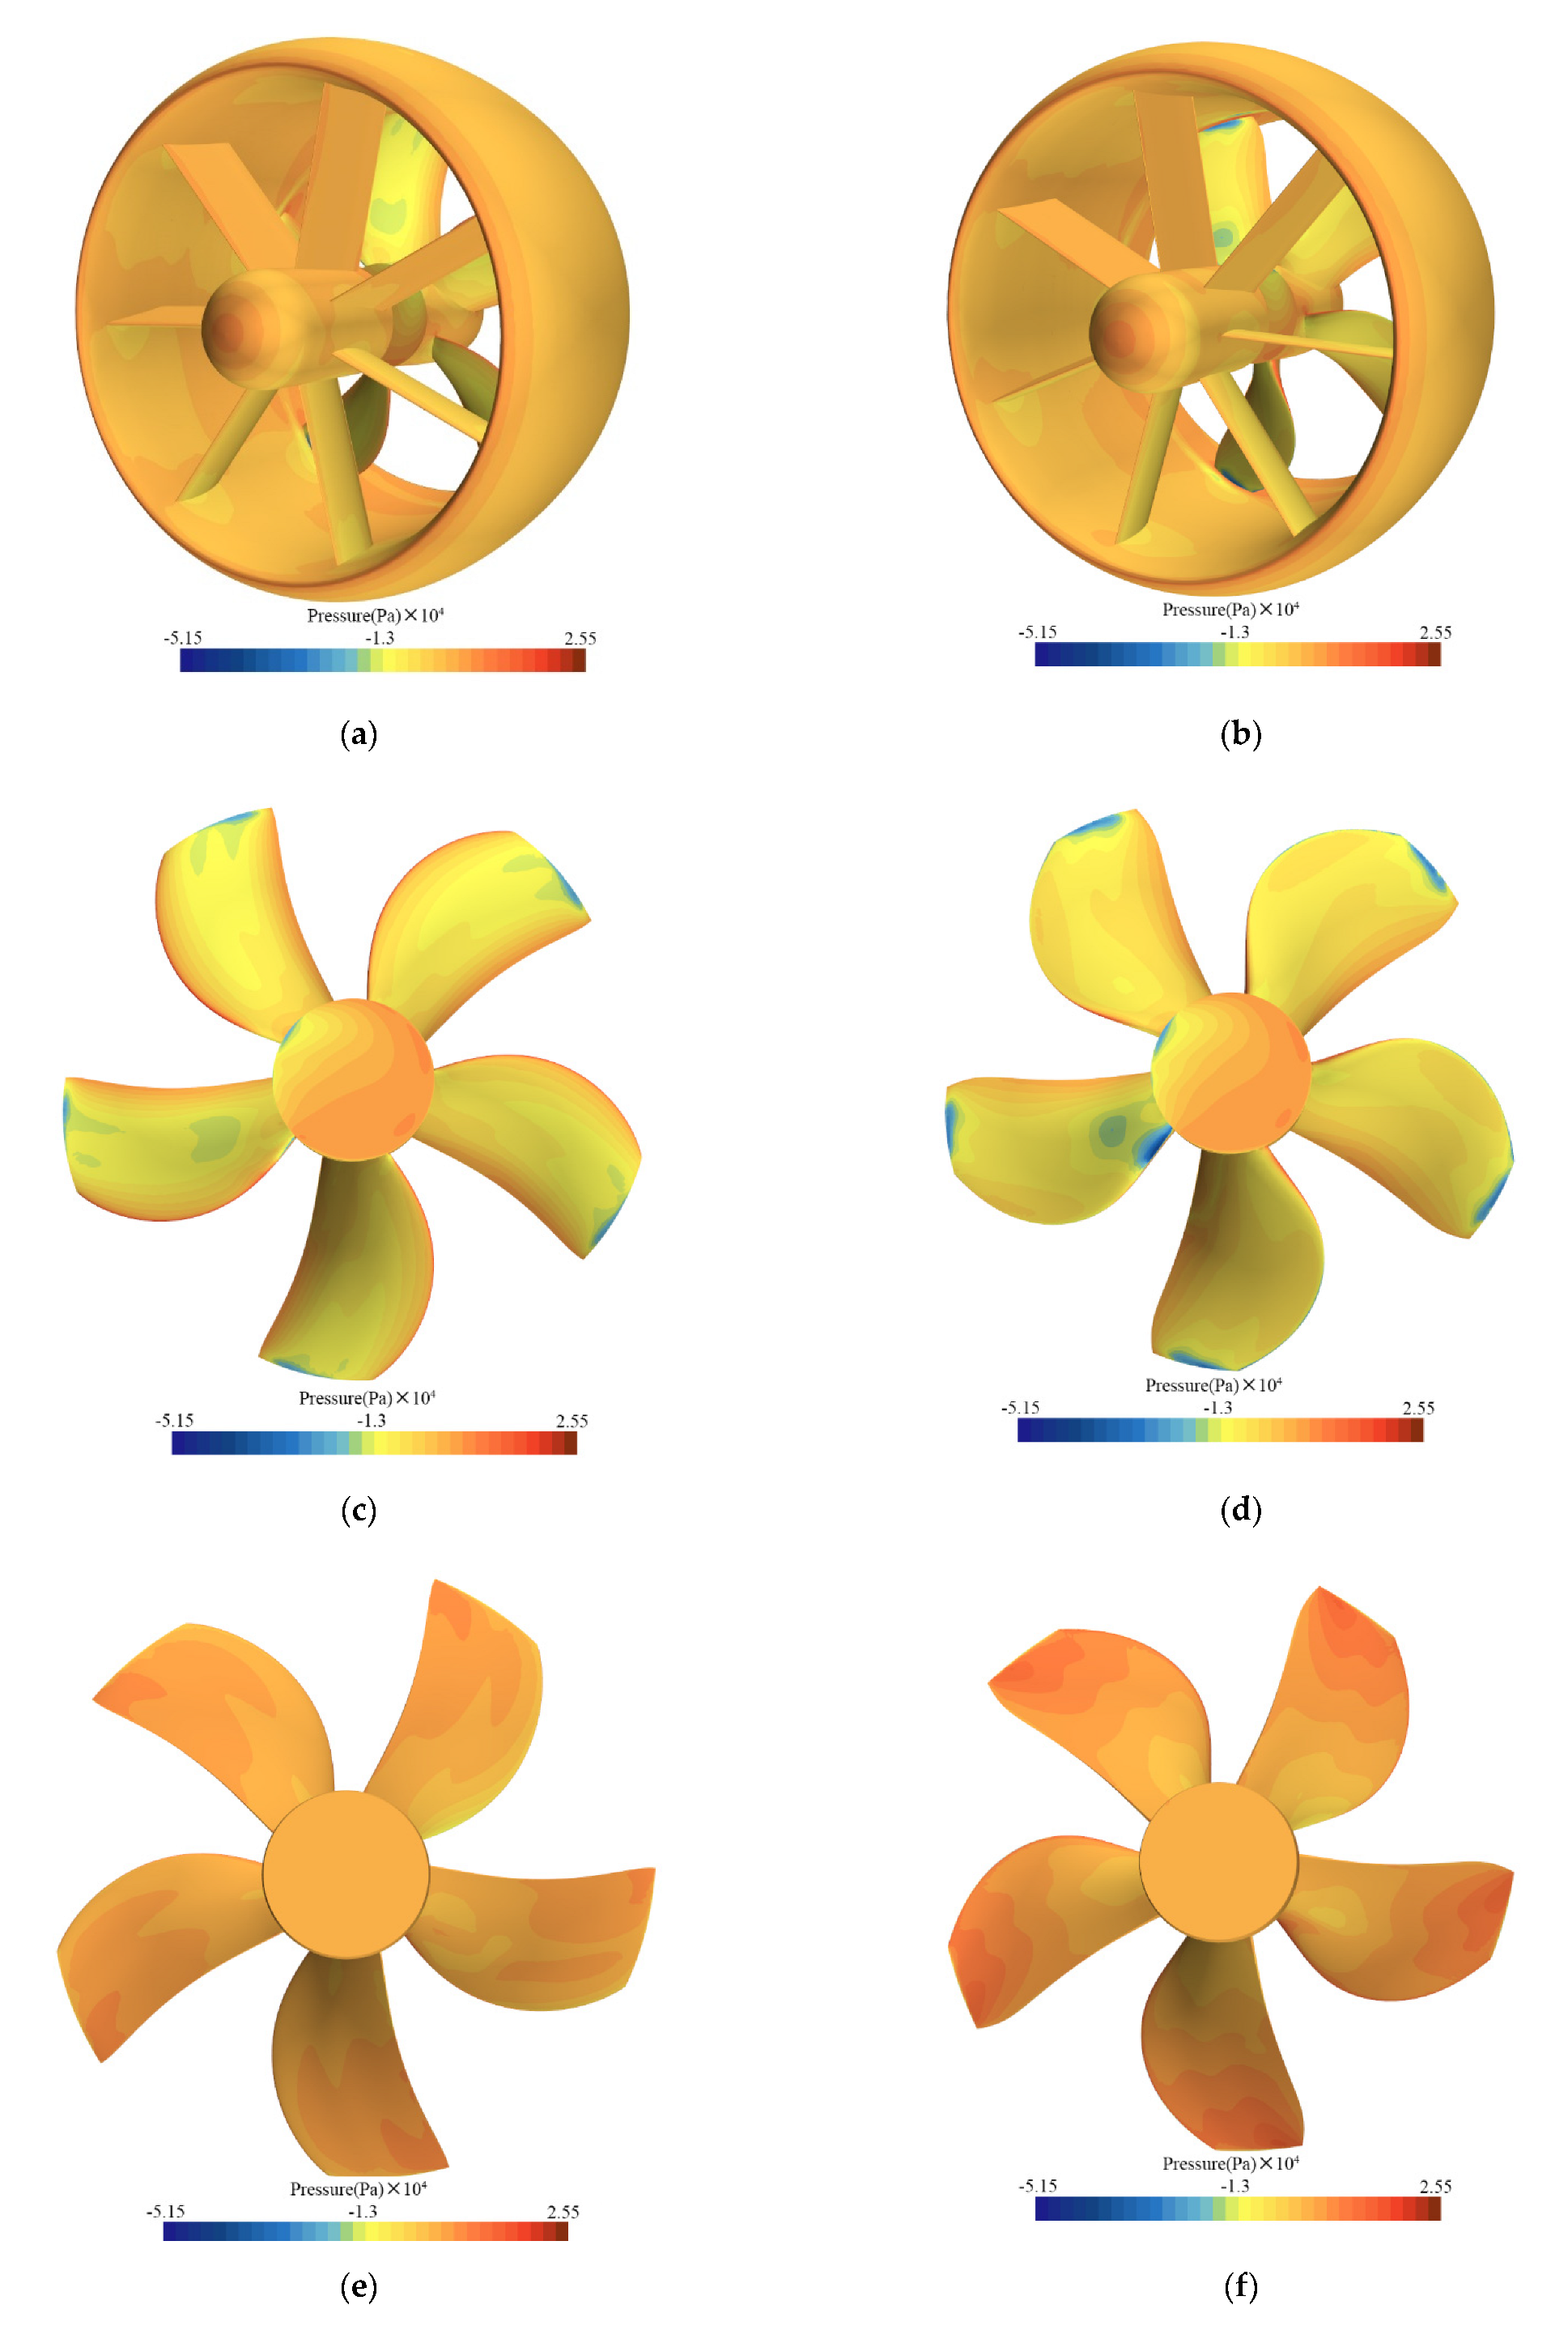
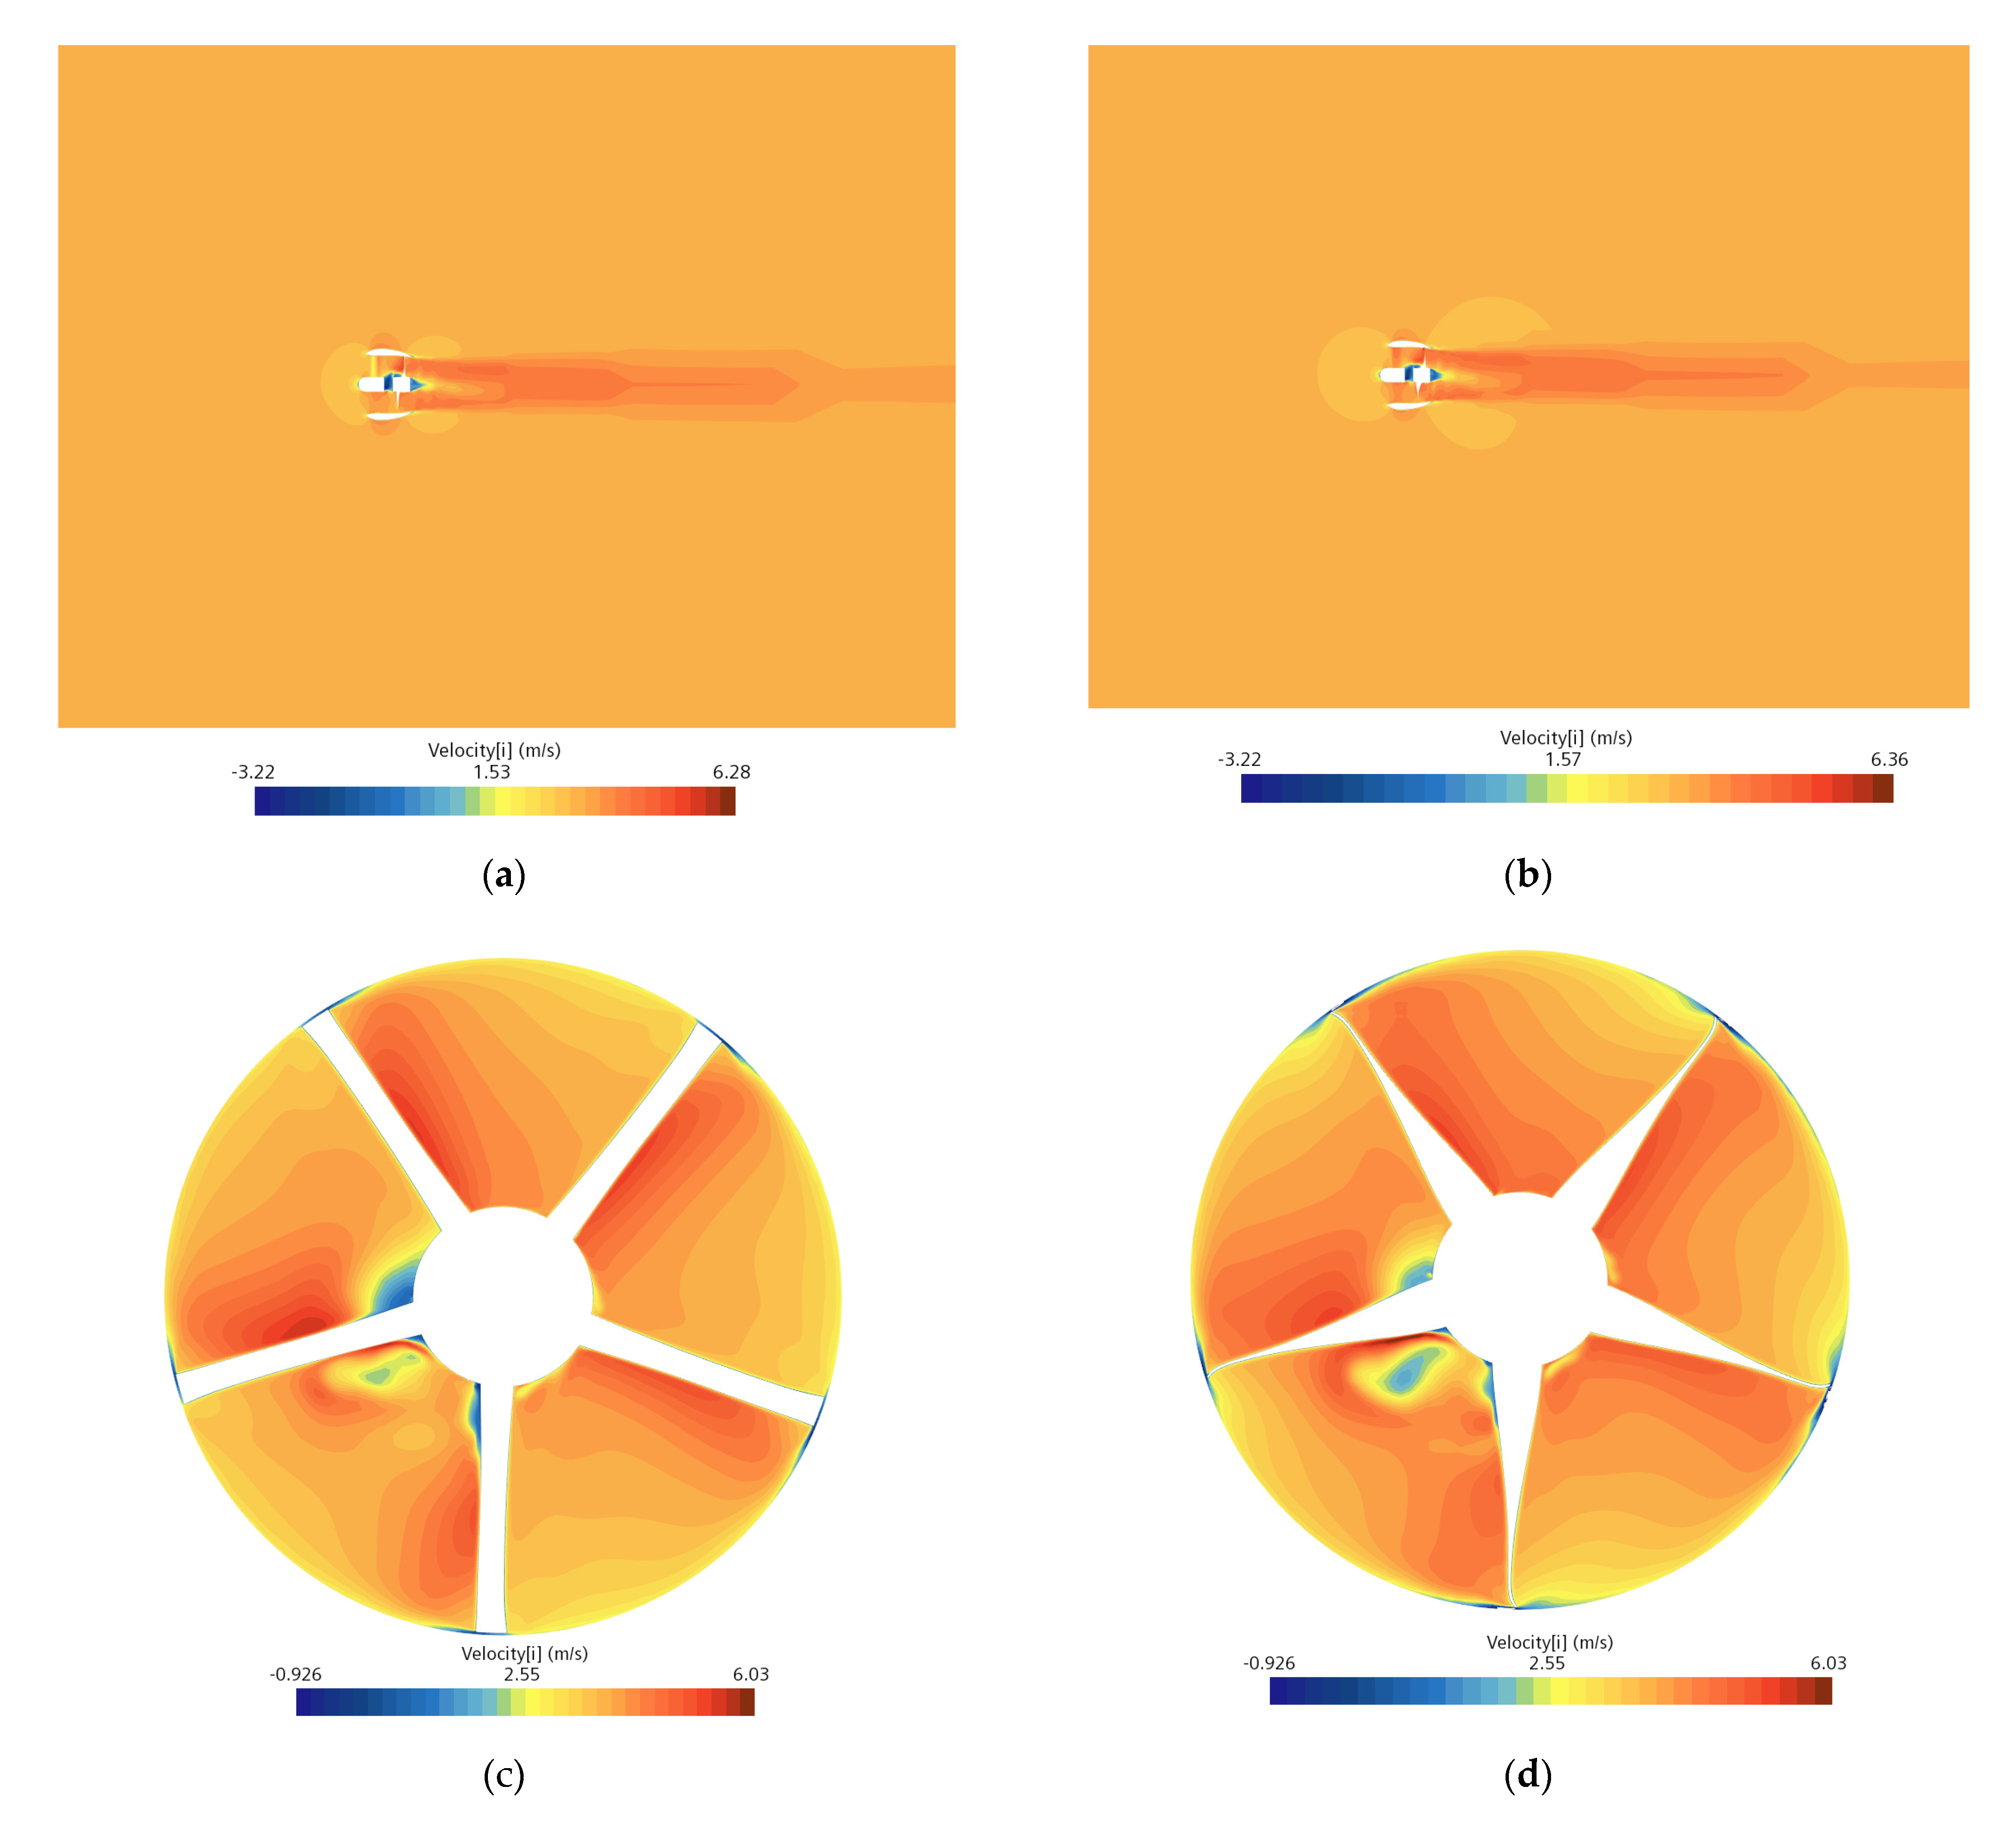
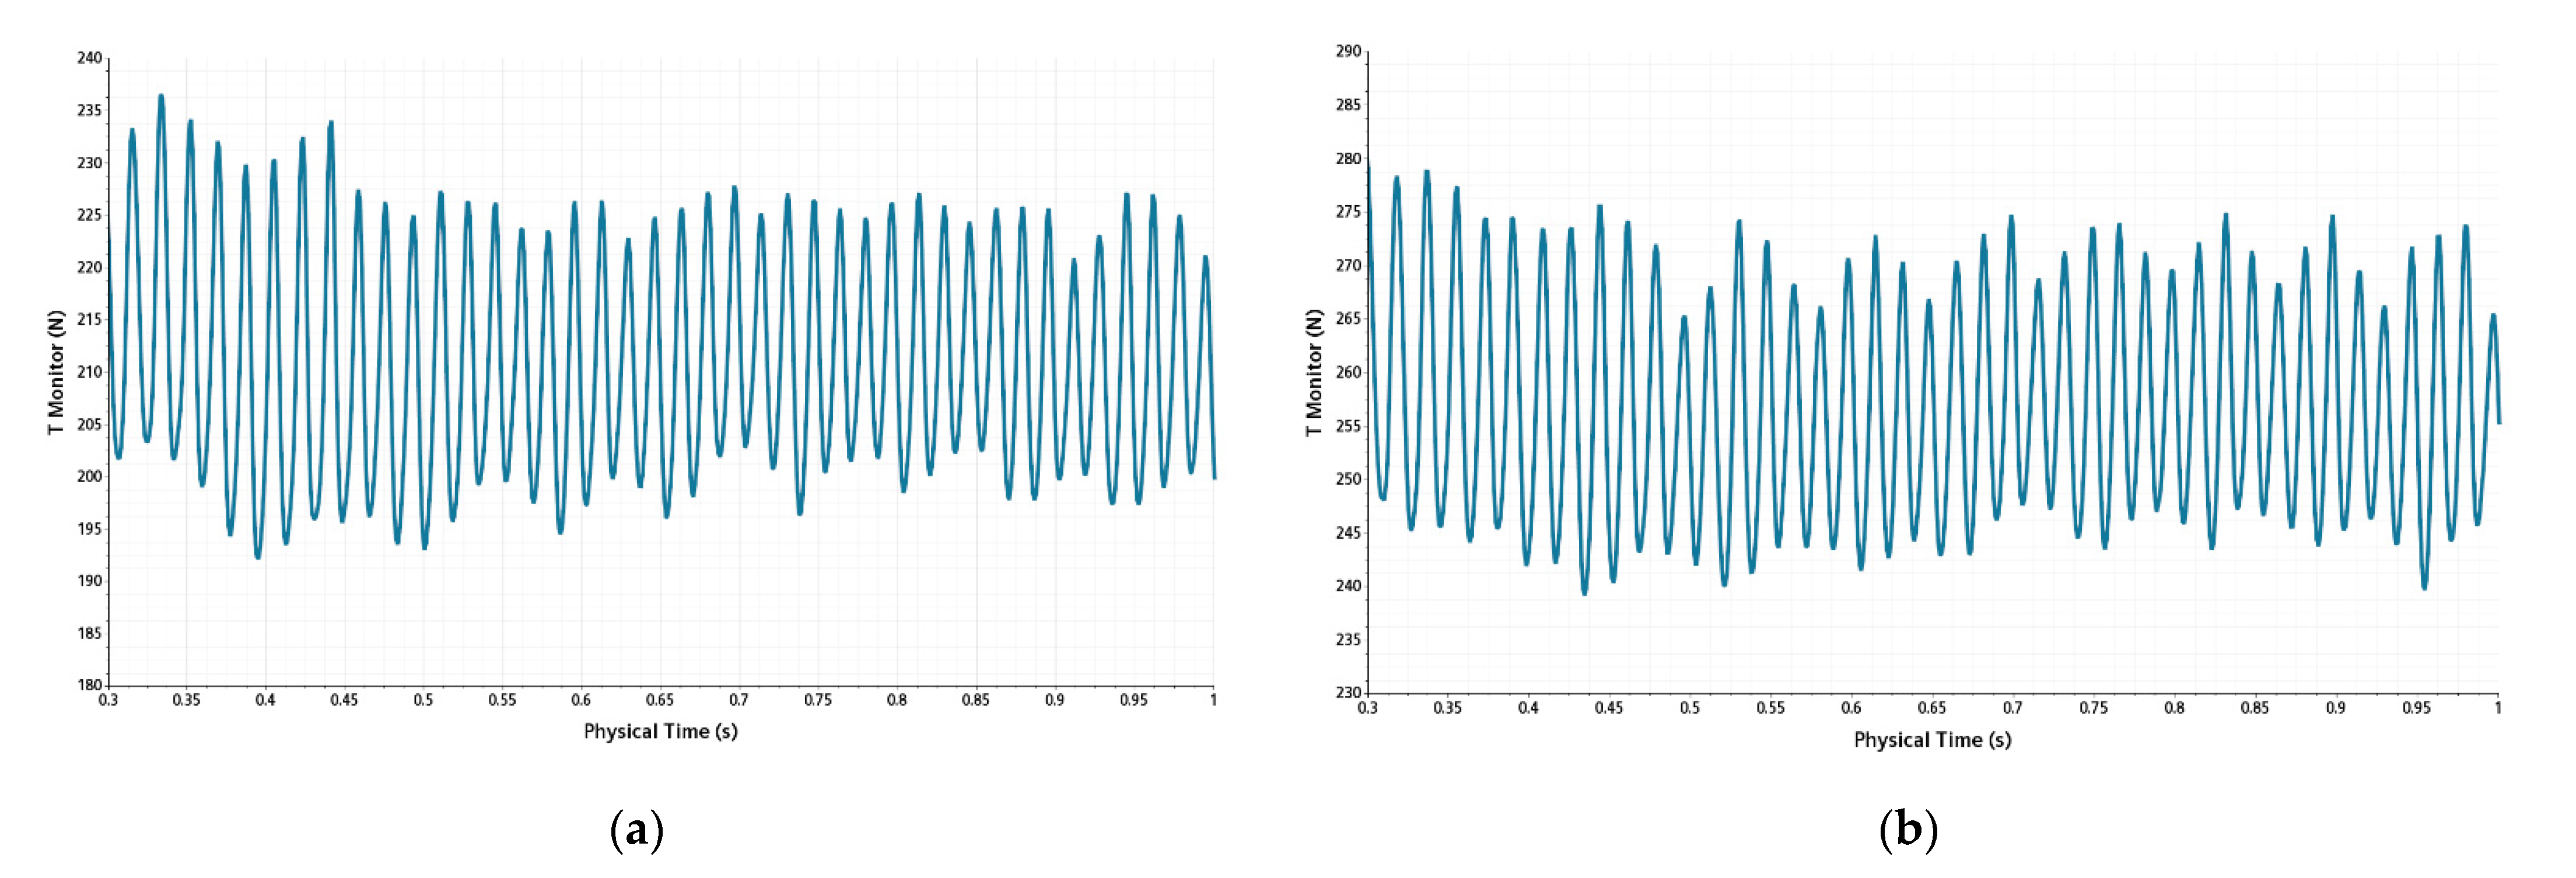
3.2. Performance Comparison of Pump-Jet Propulsion System

Analyzing the open water performance of the optimized pump-jet propulsion system at other feed rates, the open water performance of the pump-jet propulsion system before and after optimization is shown in Figure 17. The open water performance at most feed rates is better than that of the parent pump-jet propulsion system, and the open water efficiency and thrust coefficient do not decrease compared with the parent pump-jet propulsion system, and in many cases are improved. Thus, the combined hydrodynamic performance of the optimized pump-jet propulsion system is better than that of the parent pump-jet propulsion system.
Further, compare the geometry and surface pressure distribution of the pump-jet propulsion system. Figure 18 shows the surface pressure of the parent pump-jet propulsion system and the optimized pump-jet propulsion system when the rate of advance coefficient J = 1.05. The blade surface of the pump-jet propulsion system is the thrust surface, and the back of the blade is the suction surface. The leading-edge pressure is generally greater than the trailing edge pressure, and the pressure difference near the leading edge and blade tip is large, which is easy to cause cavitation and high pulsating pressure. Under the same rate coefficient, the negative pressure area at the blade tip and blade root of the optimized pump-jet propulsion system is slightly larger than that of the parent pump-jet propulsion system, and the cavitation performance may be slightly lower than that of the parent pump-jet propulsion system. The rotor blade pressure of the optimized pump-jet propulsion system is obviously higher than that of the parent pump-jet propulsion system, and the blade pressure distribution is more uniform. The pressure on the back of the blade decreased, the pressure difference between the blade and the back of the blade was large, and the thrust increased gradually. The hydrodynamic performance of the optimized pump-jet propulsion system is better.
Figure 19 shows the comparison of flow field velocity between the parent type pump-jet propulsion system and the optimized pump-jet propulsion system. According to Figure 19a,b, as the thrust of the optimized pump-jet propulsion system increases, the fluid energy passing through the pump-jet propulsion system increases, so the velocity of the flow field of the optimized pump-jet propulsion system increases slightly, and the area of the higher velocity of the flow field increases slightly. Figure 19c,d Shows that the low-speed zone of the rotor of the optimized pump-jet propulsion system is significantly reduced and the flow field transition is more uniform. The hydrodynamic performance of optimized pump-jet propulsion system is better.
The unsteady pulse dynamic spectrum of the pump-jet propulsion system consists of a low-frequency line spectrum and wideband random spectrum which reflect the spatial inhomogeneity and time unsteadiness of the pump-jet propulsion system flow field, respectively. The unsteady pulsation data are taken for analysis, and the pulsation data is converted from the time domain to the frequency domain by Fast Fourier Transform (FFT), and the amplitude T (N) is converted to T (dB), according to Equation (13). Figure 20 shows the unsteady force curve of the pump-jet propulsion system. The thrust of the optimized pump-jet propulsion system is significantly larger than that of the parent pump-jet propulsion system. The unsteady force pulsation of the optimized pump-jet propulsion system is slightly lower than that of the parent pump-jet propulsion system.
T ( dB ) = 20   log 10 ( T ( N ) )
In order to obtain a continuous spectrum, frequencies with lower amplitude in the original spectrum are filtered out to avoid underestimating the actual pulsation amplitude. In this paper, a two-step method [43] is used to extract the continuous broadband spectrum. Firstly, the upper envelope of the original spectrum was calculated according to the average thrust spectrum, and the local maximum amplitude of the wave was obtained. Then, the adjacent average weighting method is used to process the maximum value according to Equation (14). The algorithm can reflect the amplitude of unsteady force correctly, smooth the envelope curve and eliminate the random component.
g i = ( j = 1 N w j f j + i     [ N / 2 ] ) / N w j = 1     ( ( j     i     1 ) ( N + 1 ) / 2 ) 2
where fi and gi are input and output data points i, respectively; N represents the number of points in the window, and wj is a quadratic weight factor.
Figure 21 shows the wide band spectrum (DB) of the unsteady force of the pump-jet propulsion system. The black line is the unsteady force spectrum, the red line is the upper envelope of the unsteady force spectrum, and the blue line is the broadband spectrum. The axial frequency is the fundamental frequency of the uniform incoming thrust spectrum, and the peak appears at the blade frequency. It is found from the broadband spectrum of unsteady force that the energy of unsteady force mainly concentrates in the low-frequency region and attenuates to the high-frequency region. The peak values of the first and second wave peaks of the optimized pump-jet propulsion system are both smaller than those of the mother pump-jet propulsion system. It shows that the pulsation amplitude of the optimized pump-jet propulsion system is slightly smaller than that of the parent pump-jet propulsion system.
Figure 22 shows the von Mises stress comparison diagram of the pump-jet propulsion system rotor. Material properties of the pump-jet propulsion system are shown in Table 4. Von Mises stress was found to be significant at the blade root of the pump-jet propulsion system. The results showed that the von Mises stress at the blade tip increased and that at the blade root decreased due to the decrease in blade tip thickness of the optimized pump-jet propulsion system. Optimize the pump-jet propulsion system to meet the allowable stress requirements.
By comparing the open water performance curves of the parent pump-jet propulsion system and the optimized pump-jet propulsion system, the open water performance of the optimized pump-jet propulsion system is slightly higher than that of the parent pump-jet propulsion system at multiple rates. Compared with the surface pressure of the parent pump-jet propulsion system and the optimized pump-jet propulsion system, it was found that the back-cotyledon pressure of the optimized pump-jet propulsion system was significantly greater than that of the parent pump-jet propulsion system. The back-blade to blade differential pressure ratio increased, the thrust increased, and the back-blade pressure distribution was more uniform. By comparing the unsteady force spectrum and the wideband spectrum of unsteady force between the parent pump-jet propulsion system and the optimized pump-jet propulsion system, it is found that the amplitude of unsteady force of the optimized pump-jet propulsion system is slightly smaller than that of the parent pump-jet propulsion system, and the noise performance may be better. It was found that the stress of the optimized pump-jet propulsion system decreased significantly at the blade root, and the stress at the blade tip decreased. In conclusion, the performance of the optimized pump-jet propulsion system is better than that of the parent pump-jet propulsion system.

4. Conclusions

In this paper, the relationship between the geometrical parameters of a pump-jet propulsion system and the performance of the pump-jet propulsion system is established by full parametric modeling. Then, the hydrodynamic performance of the pump-jet propulsion system is calculated based on the numerical simulation technique. The radial parameters in the fully parametric configuration of the pump-jet propulsion system were selected as the optimization design variables, the hydrodynamic performance optimization objective function. Finally, the optimization design system of the pump-jet propulsion system is constructed with the help of a global intelligent optimization algorithm. The whole design process is automated by combining the geometry reconstruction technique, hydrodynamic performance evaluation technique and optimization technique of the pump-jet propulsion system.
The following conclusions can be drawn from this study:
(A) The construction of the optimization design system can eliminate manual intervention, in which the full parameter modeling module can flexibly realize the three-dimensional geometry change of the pump-jet propulsion system in the configuration space, and the optimization theory can scientifically guarantee that the design result is the optimal solution, or the optimal solution set in the configuration space from the mathematical level.
(B) The key breakthrough is the automatic deformation and reconstruction method of the three-dimensional geometry of the pump-jet propulsion system. Through the establishment of a fully parameterized model of the pump-jet propulsion system, fewer design variables are used to flexibly control the change of the three-dimensional geometry of the pump-jet propulsion system, and this change includes all the parameters involved in the traditional geometric expression method. Therefore, the problems of geometric deformation and reconstruction caused by the complex parametric expression method of the traditional pump-jet propulsion system are solved; thus, the diversity of pump-jet propulsion system models and the controllability of the model are expanded, and the optimization of different performances of pump-jet propulsion system provides the basis for the model.
(C) The optimization design system of the pump-jet propulsion system was applied, and the NSGA-II algorithm was used to design the propulsion, aiming at the efficiency and thrust coefficient values under design conditions. The design results show that the thrust coefficient and open water efficiency of the pump-jet propulsion system are improved on the basis of satisfying the amplitude check of the unsteady force. It is preliminarily indicated that the optimization design system of pump-jet propulsion system constructed in this paper is feasible and can improve the performance of other aspects while ensuring the performance of some aspects
The research focus of this paper is mainly on the construction of the whole method system, and corresponding breakthroughs are made for the key technologies. The work of this paper is relatively limited, so the following aspects can be considered in a further comprehensive and in-depth study: the evaluation of the cavitation performance of the pump-jet propulsion system is further studied, and the optimization design of the noise performance of the pump-jet propulsion system is studied.

Author Contributions

Conceptualization, Y.L., Z.L. and S.L.; methodology, Y.L., Z.L. and S.L.; software, C.W., Z.G. and C.L.; validation, Y.L., Z.L. and S.L.; formal analysis, C.W., W.S. and C.L.; investigation, C.W., W.S. and C.L.; resources, S.L. and Y.L.; data curation, C.W.; Writing—original draft preparation, Y.L. and C.W.; writing—review and editing, S.L.; visualization, C.W.; supervision, S.L. and Y.L.; project administration, S.L., Z.L. and Y.L. All authors have read and agreed to the published version of the manuscript.

Funding

This work was funded by the National Natural Science Foundation of China General Program Project (Grant No. 52171293), the National Natural Science Foundation of China Youth Project (Grant No. 51809029), the Ph.D. Scientific Research Fund of the Natural Science Foundation of Liaoning Province (Grant NO. 2019-BS-025), the high-level talent innovation support program of Dalian (Grant NO. 2020RQ009), Key discipline project of Dalian Science and Technique Innovation Fund (Grant No. 2020JJ25CY016), the Fundamental Research Funds for the Central Universities (Grant No. 3132022112).

Institutional Review Board Statement

Not applicable.

Informed Consent Statement

Not applicable.

Data Availability Statement

The data presented in this study are available on request from the corresponding author.

Conflicts of Interest

The authors declare no conflict of interest.

References

  1. Hughes, M.J.; Kinnas, S.A. An analysis method for a ducted propeller with pre-swirl stator blades. In Proceedings of the SNAME 6th Propeller and Shafting Symposium, Virginia Beach, VA, USA, 17 September 1991. [Google Scholar]
  2. Kinnas, S.; Hsin, C.; Keenan, D. A potential based panel method for the unsteady flow around open and ducted propellers. In Proceedings of the Naval Hydrodynamics, 18th Symposium, Ann Arbor, MI, USA, 19–24 August 1990; National Academy Press: Washington, DC, USA, 1991; p. 667. [Google Scholar]
  3. Kawakita, C.; Hoshino, T. Hydrodynamic analysis of a ducted propeller with stator in steady flow using a surface panel method. Trans. West Jpn. Soc. Nav. Archit. 1998, 96, 17–30. [Google Scholar]
  4. Park, W.-G.; Jang, J.-H. Numerical simulation of flow field of ducted marine propeller with guide vane. In Proceedings of the Fourth International Conference on Pumps and Fans, Beijing, China, 26–29 August 2002; p. 307. [Google Scholar]
  5. Park, W.-G.; Jang, J.H.; Chun, H.H.; Kim, M.C.J.O.E. Numerical flow and performance analysis of waterjet propulsion system. Ocean Eng. 2005, 32, 1740–1761. [Google Scholar] [CrossRef]
  6. Suryanarayana, C. Advanced propulsors for high speed marine vehicles. In Technological Challenges Developments Pursued at Naval Science Technological Laboratory; Naval Science & Technological Laboratory (INDIA): New Delhi, India, 2004. [Google Scholar]
  7. Suryanarayana, C.; Satyanarayana, B.; Ramji, K.; Rao, M.N. Cavitation studies on axi-symmetric underwater body with pumpjet propulsor in cavitation tunnel. International Journal of Naval Architecture Ocean Engineering 2010, 2, 185–194. [Google Scholar] [CrossRef] [Green Version]
  8. Suryanarayana, C.; Satyanarayana, B.; Ramji, K.; Saiju, A. Experimental evaluation of pumpjet propulsor for an axisymmetric body in wind tunnel. Int. J. Nav. Archit. Ocean Eng. 2010, 2, 24–33. [Google Scholar] [CrossRef] [Green Version]
  9. Suryanarayana, C. Innovative CAM techniques for propeller manufacture. In Proceedings of the 3rd International Conference on Navy and Ship Building Nowadays (NSN2003), St Petursburg, Russia, 26–28 June 2003. [Google Scholar]
  10. Suryanarayana, C.; Satyanarayana, B.; Ramji, K. Performance evaluation of an underwater body and pumpjet by model testing in cavitation tunnel. Int. J. Nav. Archit. Ocean Eng. 2010, 2, 57–67. [Google Scholar] [CrossRef] [Green Version]
  11. Suryanarayana, C.; Reddy, K.P.; Mathi, S.; Swamy, P.V.; Suresh, R.V. Hydrodynamic design of propulsor, profile and hovering system for an expendable decoy. In Proceedings of the International Conference in Marine Hydrodynamics 2006, Shanghai, China, 11–14 July 2006. [Google Scholar]
  12. Das, H.; Jayakumar, P.; Saji, V.; Yerram, R. CFD examination of interaction of flow on high-speed submerged body with pumpjet propulsor. In Proceedings of the 5th International Conference on High-performance Marine Vehicles, Launceston, Australia, 8–10 November 2006; pp. 466–479. [Google Scholar]
  13. Ahn, S.J.; Kwon, O.J. Numerical investigation of a pump-jet with ring rotor using an unstructured mesh technique. J. Mech. Sci. Technol. 2015, 29, 2897–2904. [Google Scholar] [CrossRef]
  14. Ahn, S.J.; Kwon, O.J. Numerical investigation of cavitating flows for marine propulsors using an unstructured mesh technique. Int. J. Heat Fluid Flow 2013, 43, 259–267. [Google Scholar] [CrossRef]
  15. Ivanell, S.J. Hydrodynamic simulation of a torpedo with pumpjet propulsion system. Stockh. R. Inst. Technol. 2001. [Google Scholar]
  16. Yamada, K.; Kusano, K.; Furukawa, M. Large-scale numerical simulation of unsteady flow field in a half-ducted propeller fan using lattice Boltzmann method. In Proceedings of the Fluids Engineering Division Summer Meeting, Seoul, Korea, 26–31 July 2015; p. V01AT09A016. [Google Scholar]
  17. Baltazar, J.; Falcão de Campos, J.; Bosschers, J. Open-water thrust and torque predictions of a ducted propeller system with a panel method. Int. J. Rotating Mach. 2012, 2012, 474785. [Google Scholar] [CrossRef]
  18. Liu, Z.Y.; Song, B.; Huang, Q.G.; Hu, H.B. Hydrodynamic performance simulation method of pump-jet propulsion based on CFD technology. J. Northwestern Polytech. Univ. 2010, 724–729. (In Chinese) [Google Scholar] [CrossRef]
  19. Guang, P.; Lin, L. Numerical simulation of steady hydrodynamic performance for integrated motor propulsor on CFD. In Proceedings of the 2013 International Conference on Virtual Reality and Visualization, Shaanxi, China, 14–15 September 2013; pp. 15–20. [Google Scholar]
  20. Pan, G.; Hu, B.; Wang, P.; Yang, Z.D.; Wang, Y.Y. Numerical simulation of steady hydrodynamic performance of pump-jet propulsion. J. Shanghai Jiaotong Univ. 2013, 47, 932–937. (In Chinese) [Google Scholar] [CrossRef]
  21. Hu, Y.L.; Liu, W.F. The Inside Flow Field Simulation of Pump-jet Propulsor Based on The Software FLUENT. Mach. Electron. 2009, 27–30. (In Chinese) [Google Scholar] [CrossRef]
  22. Liu, W.F.; Hu, Y.L. Structural principle and characteristic analysis of pump-jet propulsion of a new underwater integrated motor propulsion unit. Torpedo Technol. 2007, 15, 5–8. (In Chinese) [Google Scholar]
  23. Ni, Y.Y.; Wu, T.T. Analysis and design improvement of pump water jet propulsion. Ship Sea Eng. 2012, 41, 61–63, 67. (In Chinese) [Google Scholar]
  24. Ni, Y.Y.; Liu, W.M. Research progress of pump water jet propulsion. Ship Sea Eng. 2013, 42, 1–5. (In Chinese) [Google Scholar]
  25. Gaafary, M.; El-Kilani, H.; Moustafa, M.J.A.E.J. Optimum design of B-series marine propellers. Alex. Eng. J. 2011, 50, 13–18. [Google Scholar] [CrossRef] [Green Version]
  26. Xie, G.J.P.E. Optimal preliminary propeller design based on multi-objective optimization approach. Procedia Eng. 2011, 16, 278–283. [Google Scholar] [CrossRef] [Green Version]
  27. Gaggero, S.; Gonzalez-Adalid, J.; Sobrino, M.P.J.A.O.R. Design of contracted and tip loaded propellers by using boundary element methods and optimization algorithms. Appl. Ocean Res. 2016, 55, 102–129. [Google Scholar] [CrossRef]
  28. Gaggero, S.; Villa, D.; Tani, G.; Viviani, M.; Bertetta, D.J.O.E. Design of ducted propeller nozzles through a RANSE-based optimization approach. Ocean Eng. 2017, 145, 444–463. [Google Scholar] [CrossRef]
  29. Mizzi, K.; Demirel, Y.K.; Banks, C.; Turan, O.; Kaklis, P.; Atlar, M.J.A.O.R. Design optimisation of Propeller Boss Cap Fins for enhanced propeller performance. Appl. Ocean Res. 2017, 62, 210–222. [Google Scholar] [CrossRef] [Green Version]
  30. Nouri, N.M.; Mohammadi, S.; Zarezadeh, M.J.O.E. Optimization of a marine contra-rotating propellers set. Ocean Eng. 2018, 167, 397–404. [Google Scholar] [CrossRef]
  31. Yang, L.C.; Yang, C.J.; Li, X.B. Research on Propeller Optimal Design Based on Multi-objective Evolutionary Algorithm and Decision Technology. China Shipbuild. 2019, 3, 55–66. (In Chinese) [Google Scholar]
  32. Han, Y.B.; Dong, Z.Q.; Lv, J.; Feng, J.; Zhou, W.X. Application of Optimization Theory in Propeller Hydrodynamic Design. China Shipbuild. 2019, 60, 52–59. (In Chinese) [Google Scholar]
  33. Mian, H.H.; Wang, G.; Zhou, H.; Wu, X.J.A.S. Technology. Optimization of thin electric propeller using physics-based surrogate model with space mapping. Aerosp. Sci. 2021, 111, 106563. [Google Scholar] [CrossRef]
  34. Lu, Y.; Gu, Z.H.; Liu, S.W.; Chuang, Z.J.; Li, Z.Y.; Li, C.Z. Research on optimal design of polar ship bow based on ice resistance. J. Ship Mech. 2021, 25, 1040–1048. (In Chinese) [Google Scholar]
  35. Long, W. Optimization of Propeller Cavitation Performance Based on New Profile Design. Master’s Thesis, China Ship Research Institute, Wuxi, China, 2011. (In Chinese). [Google Scholar]
  36. Zhang, X.Y. Multi-Objective Optimization Design Method of Propeller Based on Fluid-Structure Interaction. Master’s Thesis, Dalian University of Technology, Dalian, China, 2021. (In Chinese). [Google Scholar]
  37. Yu, H.; Zhang, Z.; Hua, H.J.O.E. Numerical investigation of tip clearance effects on propulsion performance and pressure fluctuation of a pump-jet propulsor. Ocean Eng. 2019, 192, 106500. [Google Scholar] [CrossRef]
  38. Liu, Y.J. Robust Optimization Design of McPherson Suspension Based on Kriging Model and NSGA-ii Algorithm. Master’s Thesis, East China Jiaotong University, Nanchang, China, 2016. (In Chinese). [Google Scholar]
  39. Ma, X.S.; Li, Y.L.; Yan, L. Comparison of traditional multi-objective optimization method and multi-objective genetic algorithm. Electr. Drive Autom. 2010, 32, 48–50, 53. (In Chinese) [Google Scholar]
  40. Feng, Z.W. Multi-Objective Evolutionary Algorithm and Its Application in Aircraft Dynamics System. Ph.D. Thesis, National University of Defense Technology, Changsha, China, 2014. (In Chinese). [Google Scholar]
  41. Saltelli, A.; Bolado, R. An alternative way to compute Fourier amplitude sensitivity test (FAST). Comput. Stat. Data Anal. 1998, 26, 445–460. [Google Scholar] [CrossRef]
  42. Deb, K.; Pratap, A.; Agarwal, S.; Meyarivan, T. A fast and elitist multiobjective genetic algorithm: NSGA-II. IEEE Trans. Evol. Comput. 2002, 6, 182–197. [Google Scholar] [CrossRef] [Green Version]
  43. Shi, S.; Tang, W.; Huang, X.; Hua, H. Broadband force spectra of a pump-jet propulsor subjected to inflow turbulence: Comparison with ducted propeller and propeller. Ocean Eng. 2022, 251, 111087. [Google Scholar] [CrossRef]
Figure 1. Shape parameters of F-Spline.
Jmse 10 00766 g001
Figure 2. Diagram of the airfoil section.
Jmse 10 00766 g002
Figure 3. Parametric airfoil profile.
Jmse 10 00766 g003
Figure 4. Diagram of pump-jet rotor blade: (a) rake and skew; (b) pitch.
Jmse 10 00766 g004
Figure 5. Comparison of chord length curve and chord length fitting curve: (a) curve comparison; (b) relative error.
Jmse 10 00766 g005
Figure 6. Comparison of pitch curve and pitch fitting curve: (a) curve comparison; (b) relative error.
Jmse 10 00766 g006
Figure 7. Comparison of thickness curve and thickness fitting curve: (a) curve comparison; (b) relative error.
Jmse 10 00766 g007
Figure 8. Fully parametric pump-jet model.
Jmse 10 00766 g008
Figure 9. Schematic diagram of the mapping relationship between the chord curve and the rotor.
Jmse 10 00766 g009
Figure 10. Pump-jet propulsion system computational domain.
Jmse 10 00766 g010
Figure 11. Schematic diagram of the surface mesh of the pump-jet: (a) Schematic diagram of front stator and conduit mesh; (b) Rotor grid diagram.
Jmse 10 00766 g011
Figure 12. Schematic diagram of X = 0 and Y = 0 mesh section: (a) X = 0 grid diagram; (b) Y = 0 grid diagram.
Jmse 10 00766 g012
Figure 13. Comparison between the numerical and experimental results.
Jmse 10 00766 g013
Figure 14. Optimization design procedure chart of pump-jet propulsion system.
Jmse 10 00766 g014
Figure 15. Optimization Design Variable Sensitivity Analysis: (a) Sensitivity of camber to optimization objective; (b) Sensitivity of pitch to optimization objective; (c) Sensitivity of chord to optimization objective; (d) Sensitivity of thickness to optimization objective; (e) Sensitivity of skew to optimization objective.
Jmse 10 00766 g015
Figure 16. Schematic diagram of NSGA-II optimization solution set.
Jmse 10 00766 g016
Figure 17. Comparison of open water performance of optimized pump-jet propulsion system and parent pump-jet propulsion system.
Jmse 10 00766 g017
Figure 18. Comparison of the surface pressure between the parent pump-jet propulsion system and the optimized pump-jet propulsion system: (a) surface pressure of parent pump-jet propulsion system; (b) surface pressure of optimized pump-jet propulsion system; (c) surface pressure on the back surface parent of pump-jet propulsion system; (d) surface pressure on the back surface parent of optimized pump-jet propulsion system; (e) surface pressure on the front surface parent of parent pump-jet propulsion system; (f) surface pressure on the front surface of optimized pump-jet propulsion system.
Jmse 10 00766 g018
Figure 19. Comparison of the axial velocity between the parent pump-jet propulsion system and the optimized pump-jet propulsion system: (a) axial velocity of the flow field of parent pump-jet propulsion system; (b) the flow field axial velocity of optimized pump-jet propulsion system (c) axial velocity of the of parent pump-jet propulsion system rotor; (d) the axial velocity of optimized pump-jet propulsion system rotor.
Jmse 10 00766 g019
Figure 20. Comparison of unsteady forces curve of pump-jet propulsion system: (a) unsteady force curve of parent pump-jet propulsion system; (b) unsteady force curve of optimized pump-jet propulsion system.
Jmse 10 00766 g020
Figure 21. Broadband spectrum of unsteady forces for pump-jet propulsion system: (a) broadband spectrum of unsteady forces for parent pump-jet propulsion system; (b) broadband spectrum of unsteady forces for optimized pump-jet propulsion system.
Jmse 10 00766 g021
Figure 22. Von Mises stress comparison diagram of pump jet propulsion rotor: (a) rotor von Mises stress of parent pump jet propulsion system; (b) rotor von Mises stress of optimized pump jet propulsion system.
Jmse 10 00766 g022
Table 1. Main parameters of pump-jet.
ParameterNumerical Value
Rotor D294 mm
Number of Rotor5
Stator chord60 mm
Number of Stator7
Stators right-turn angle7.5 deg
Rotor and stator airfoilsNaca66Mod a = 0.8
Shroud length230 mm
Shroud inlet Diameter316 mm
Shroud outlet Diameter284 mm
Table 2. Main radial parameters of the pump-jet rotor.
r/RChord (mm)Pitch (mm)Thickness (mm)
0.2564.22403.2512.78
0.3568.426401.911.26
0.470.373402.9310.46
0.573.802405.928.79
0.676.43406.877.22
0.777.74401.315.89
0.876.78383.814.91
0.971.85347.344.3
0.9566.38316.934.13
0.97562.44298.154.08
156.67276.094.04
Table 3. Comparison of hydrodynamic performance under different grid numbers.
Number of Grids10KQErrorηOErrorKTErrorKTRErrorKTSError
EFD1.0510.00%0.5620.00%0.4950.00%0.5390.00%−0.0440.00%
1.77 million1.061−0.91%0.5590.56%0.496−0.35%0.5262.29%−0.0431.56%
2.67 million1.059−0.79%0.5580.63%0.495−0.15%0.5242.71%−0.0424.60%
3.70 million1.067−1.52%0.5600.33%0.501−1.18%0.5282.08%−0.0416.73%
Table 4. Material model of pump-jet propulsion system.
ParameterNumerical Value
MaterialNickel Aluminum Bronze
Elastic Modulus117 Gpa
Poisson’s ratio0.34
Density7600 kg/m3
Allowable stress620 Mpa
Publisher’s Note: MDPI stays neutral with regard to jurisdictional claims in published maps and institutional affiliations.

