Article

Resilience Analysis of Maritime Silk Road Shipping Network Structure under Disruption Simulation

College of Transport and Communications, Shanghai Maritime University, Shanghai 201306, China
*
Author to whom correspondence should be addressed.
J. Mar. Sci. Eng. 2022, 10(5), 617; https://doi.org/10.3390/jmse10050617
Submission received: 6 March 2022 / Revised: 26 April 2022 / Accepted: 28 April 2022 / Published: 30 April 2022
(This article belongs to the Special Issue Marine Policy)

Abstract

:
As an important hub in the maritime transportation system, ports are vulnerable to events such as terrorist attacks, security accidents and bad weather. The failure of port nodes to function effectively affects the connectivity and efficiency of the shipping network and impedes trade between countries. In view of this, in this paper, we constructed the Maritime Silk Road shipping network based on route data and used transmissibility and diversity to represent the resilience of the network and nodes. Then, we analyzed the variation characteristics of resilience using disruption simulation and identified 9 dominant nodes and 15 vulnerable nodes that could help to accurately determine the factors that affect the resilience of the MSR shipping network structure. The results show that the Maritime Silk Road shipping network structure is vulnerable, and the failure of ports to function has different effects on network transmissibility and diversity. In terms of node transmissibility and diversity, there are differences in the resistance of port nodes to interventions. In addition, the failure of dominant ports to function and the emergence of vulnerable ports are significant factors that weaken the resilience of the network structure. When dominant ports are interrupted, this greatly affects the resilience of the network structure. It is necessary to reduce the possibilities of the failure of dominant ports. Vulnerable ports are weaknesses in the resilience of the network structure, which weaken the ability of the network to function. The centrality of these ports should be strengthened, and their relation to regional and trans-regional links should be enriched. The research results provide a scientific basis for ensuring the structural resilience of the Maritime Silk Road shipping network.

1. Introduction

The 21st Century Maritime Silk Road (MSR) initiative has promoted all-around cooperation between China and countries along the road in maritime transportation and port construction, providing strong support for the sustainable development of the world economy. As important hubs in the maritime transportation system, ports closely connect the whole world and play a crucial driving role in regional economic development [1]. In terms of total volume, more than 80% of goods are transported by sea, which accounts for 70% of the total international trade [2].
The MSR includes most countries in Asia, Europe, Africa and Oceania, covering a large area. The efficiency of its shipping network is very important for the stability of trade and economic development in countries along the MSR and worldwide. However, in the process of cargo transportation, the MSR shipping network often faces various uncontrollable emergencies, especially under the current background of rampant terrorism, epidemics and natural disasters. These emergencies lead to the closure of some ports, thus affecting the cargo shipment of relevant ports and routes [3]. When the disturbance is great, it may have a domino effect on other parts of the network system [4], which may eventually cause the whole shipping network to face the risk of low efficiency and the delayed delivery of goods. Therefore, the resilience of the MSR shipping network structure should be improved without delay.
The resilience of a network structure refers to the ability of a network system to restore, maintain or improve the original network performance and functions when dealing with emergencies [5]. In the research concerning network structure resilience, scholars have used indicators that describe network structure characteristics in complex network theory to measure the resilience of networks, including social networks, supply networks, urban networks, transportation networks, and so on [6,7,8]. Previous studies have found that network efficiency, diversity and connectivity can effectively evaluate the resilience of a network structure [9,10,11,12], but there is no unified evaluation method at present.
In the process of evaluation, random and deliberate attacks are mostly used [13,14]. Then, the attenuation degree, influencing factors and multiple optimization strategies concerning the overall resilience of different network structures are discussed. In addition, disruption simulation is also a common quantitative analysis method for network structure resilience, which can distinguish between dominant and vulnerable nodes [15]. This is significant to ensure network transmission efficiency and improve network stability.
Within the current background of political instability and frequent natural disasters along the MSR, studying the resilience of the MSR shipping network structure using disruption simulation can help predict the operational capability of the network to resist potential risks. This type of research would also enable targeted network resilience improvement strategies to be more scientific. Therefore, in this study, we took the MSR shipping network as an example and used complex network theory to explore the variation characteristics of the network and node resilience under an external impact.
The paper is structured as follows. In Section 2, a review of the related literature is provided. In Section 3, the research methods and objects are introduced. In Section 4, the MSR shipping network structure resilience is analyzed using a disruption simulation. In Section 5, we analyze the characteristics of key ports and propose strategies to enhance resilience. Finally, the conclusions and implications are provided in Section 6.

2. Literature Review

With the frequent occurrence of natural and man-made disasters, the concept of resilience is gradually emerging. Resilience was first proposed by Holling [16] in the study of ecosystems. The two core parts of this concept are the ability of the system to resist negative impacts created by attacks and the ability of the system to recover from damage. Since then, the concept of resilience has been introduced into other disciplines, including engineering, psychology, sociology and economics [17,18,19]. Many effective evaluation frameworks have been derived from different disciplines. Cimellaro et al. [20] constructed a framework to measure the resilience of communities on different spatial and temporal scales. Zou and Chen [21] proposed a resilience assessment framework for the transportation power system affected by hurricanes and combined this with a Monte Carlo simulation to evaluate the resilience of the two systems. Zhao et al. [22] proposed an evaluation index system for distribution network resilience by considering multi-energy coordination and constructed an ANP model for evaluation.
Combined with complex network topology, the quantification of network resilience using specific indicators is also a commonly used method [23]. The resilience of a network depends not only on the importance of disturbed nodes but also on the overall connectivity of the network [24]. Crespo et al. [25] evaluated regional network resilience by calculating degree distribution and degree correlation and pointed out that a core edge structure would weaken the resilience of a network. Dixit et al. [26] evaluated the resilience of a supply chain network based on network structure parameters, including network density, centrality, connectivity and network size. By studying the topological characteristics of water supply networks, Meng et al. [27] concluded that network topology greatly impacts network resilience. Additionally, they proposed that connectivity, efficiency, centrality, diversity, robustness and modularity are the key topological indicators in the evaluation of network resilience. Zhang et al. [28] proposed the evaluation of node and edge resilience to comprehensively evaluate the resilience of an entire network. Zhou and Hou [29] established an analysis framework of spatial simulation, resilience evaluation and spatial planning, and the node degree, structural hole, betweenness and clustering coefficients were used to evaluate resilience.
Resilience is widely used in transportation networks, including road networks, railway networks, subway networks, aviation networks, maritime networks, etc. It is often evaluated based on network topology. Network topology mainly affects network resilience in terms of resistance and recovery capability [30]. The definition of resistance is similar to robustness. The robustness of a network refers to its ability to maintain its functionality under attacks or failures [31]. Robustness analysis of the transportation network could help identify the regions sensitive to the regional and large-scale failure of the network [32]. Wandelt et al. [33] proposed a new exploration search technique for a computationally efficient attacking model and analyzed the robustness of air transportation networks. Peng et al. [34] designed statistical indices based on complex network theory and employed four attack strategies, including a random attack and three intentional attacks (i.e., degree-based attack, betweenness-based attack and flux-based attack), to evaluate the robustness of the three typical cargo ship transportation networks. Chen et al. [35] investigated the robustness of China’s air transport network (CATN) over 40 years due to random failures and targeted attacks. The results showed that when subjected to targeted attacks, CATN’s robustness is dominated by 20% of airports. The direct measurement of robustness can be carried out through random or deliberate node removal. Studies often compare the impact degrees under different deliberate attack sequences and identify the number of nodes that must be removed in order for the network to break down.
In terms of the resistance of network resilience, IP and Wang [36] abstracted cities and roads as nodes and edges, respectively, and evaluated node resilience using the weighted average of reliable channels with other urban nodes in the network. Qi et al. [37] used four indicators, including the network efficiency and sensitivity, to analyze the resilience of a bus–subway hybrid traffic network. The resilience of a transportation network is also closely related to its recovery strategy, such as the recovery sequence of multiple interrupted nodes and edges [38]. Improving the path diversity and redundancy can significantly improve the resilience of a transportation network [39]. Dunn and Wilkinson [40] analyzed the impact of adaptive and permanent strategies on the resilience of the European airport network. The results showed that the adaptive recovery strategy could effectively improve network resilience. Zhang et al. [41] used the nearest link method to change the topology of an expressway network and simulated the addition of lines to improve the redundancy and resilience of the system.
The research regarding the resilience of shipping networks is similar to that of other transport networks. Mou et al. [42] evaluated the resilience of the maritime crude oil transportation network from qualitative and quantitative aspects using complex network indicators and a resilience model. Asadabadi and Miller-Hooks [43] proposed a stochastic two-level game model that considered port competition and cooperation to evaluate and improve the resilience of the global port network. Wan et al. [44] constructed the effectiveness index of network recovery strategies based on the triangular model of resilience loss to improve the shipping network’s resilience.
At present, there is no unified evaluation method for evaluating network structure resilience, and there are few studies on the resilience of the MSR shipping network, which is of great significance in planning the layout of ports and routes along the MSR. Drawing on the relevant research results concerning resilience in different fields, in this paper, we used transmissibility and diversity to reflect the resilience of the shipping network structure. Then, the dominant ports and vulnerable ports within the scope of the MSR were identified, and the characteristics of the ports were analyzed. Finally, we put forward suggestions to enhance the resilience of the MSR shipping network structure, providing scientific references for the sustainable development of the MSR shipping network.

3. Research Method and Object

3.1. Research Method

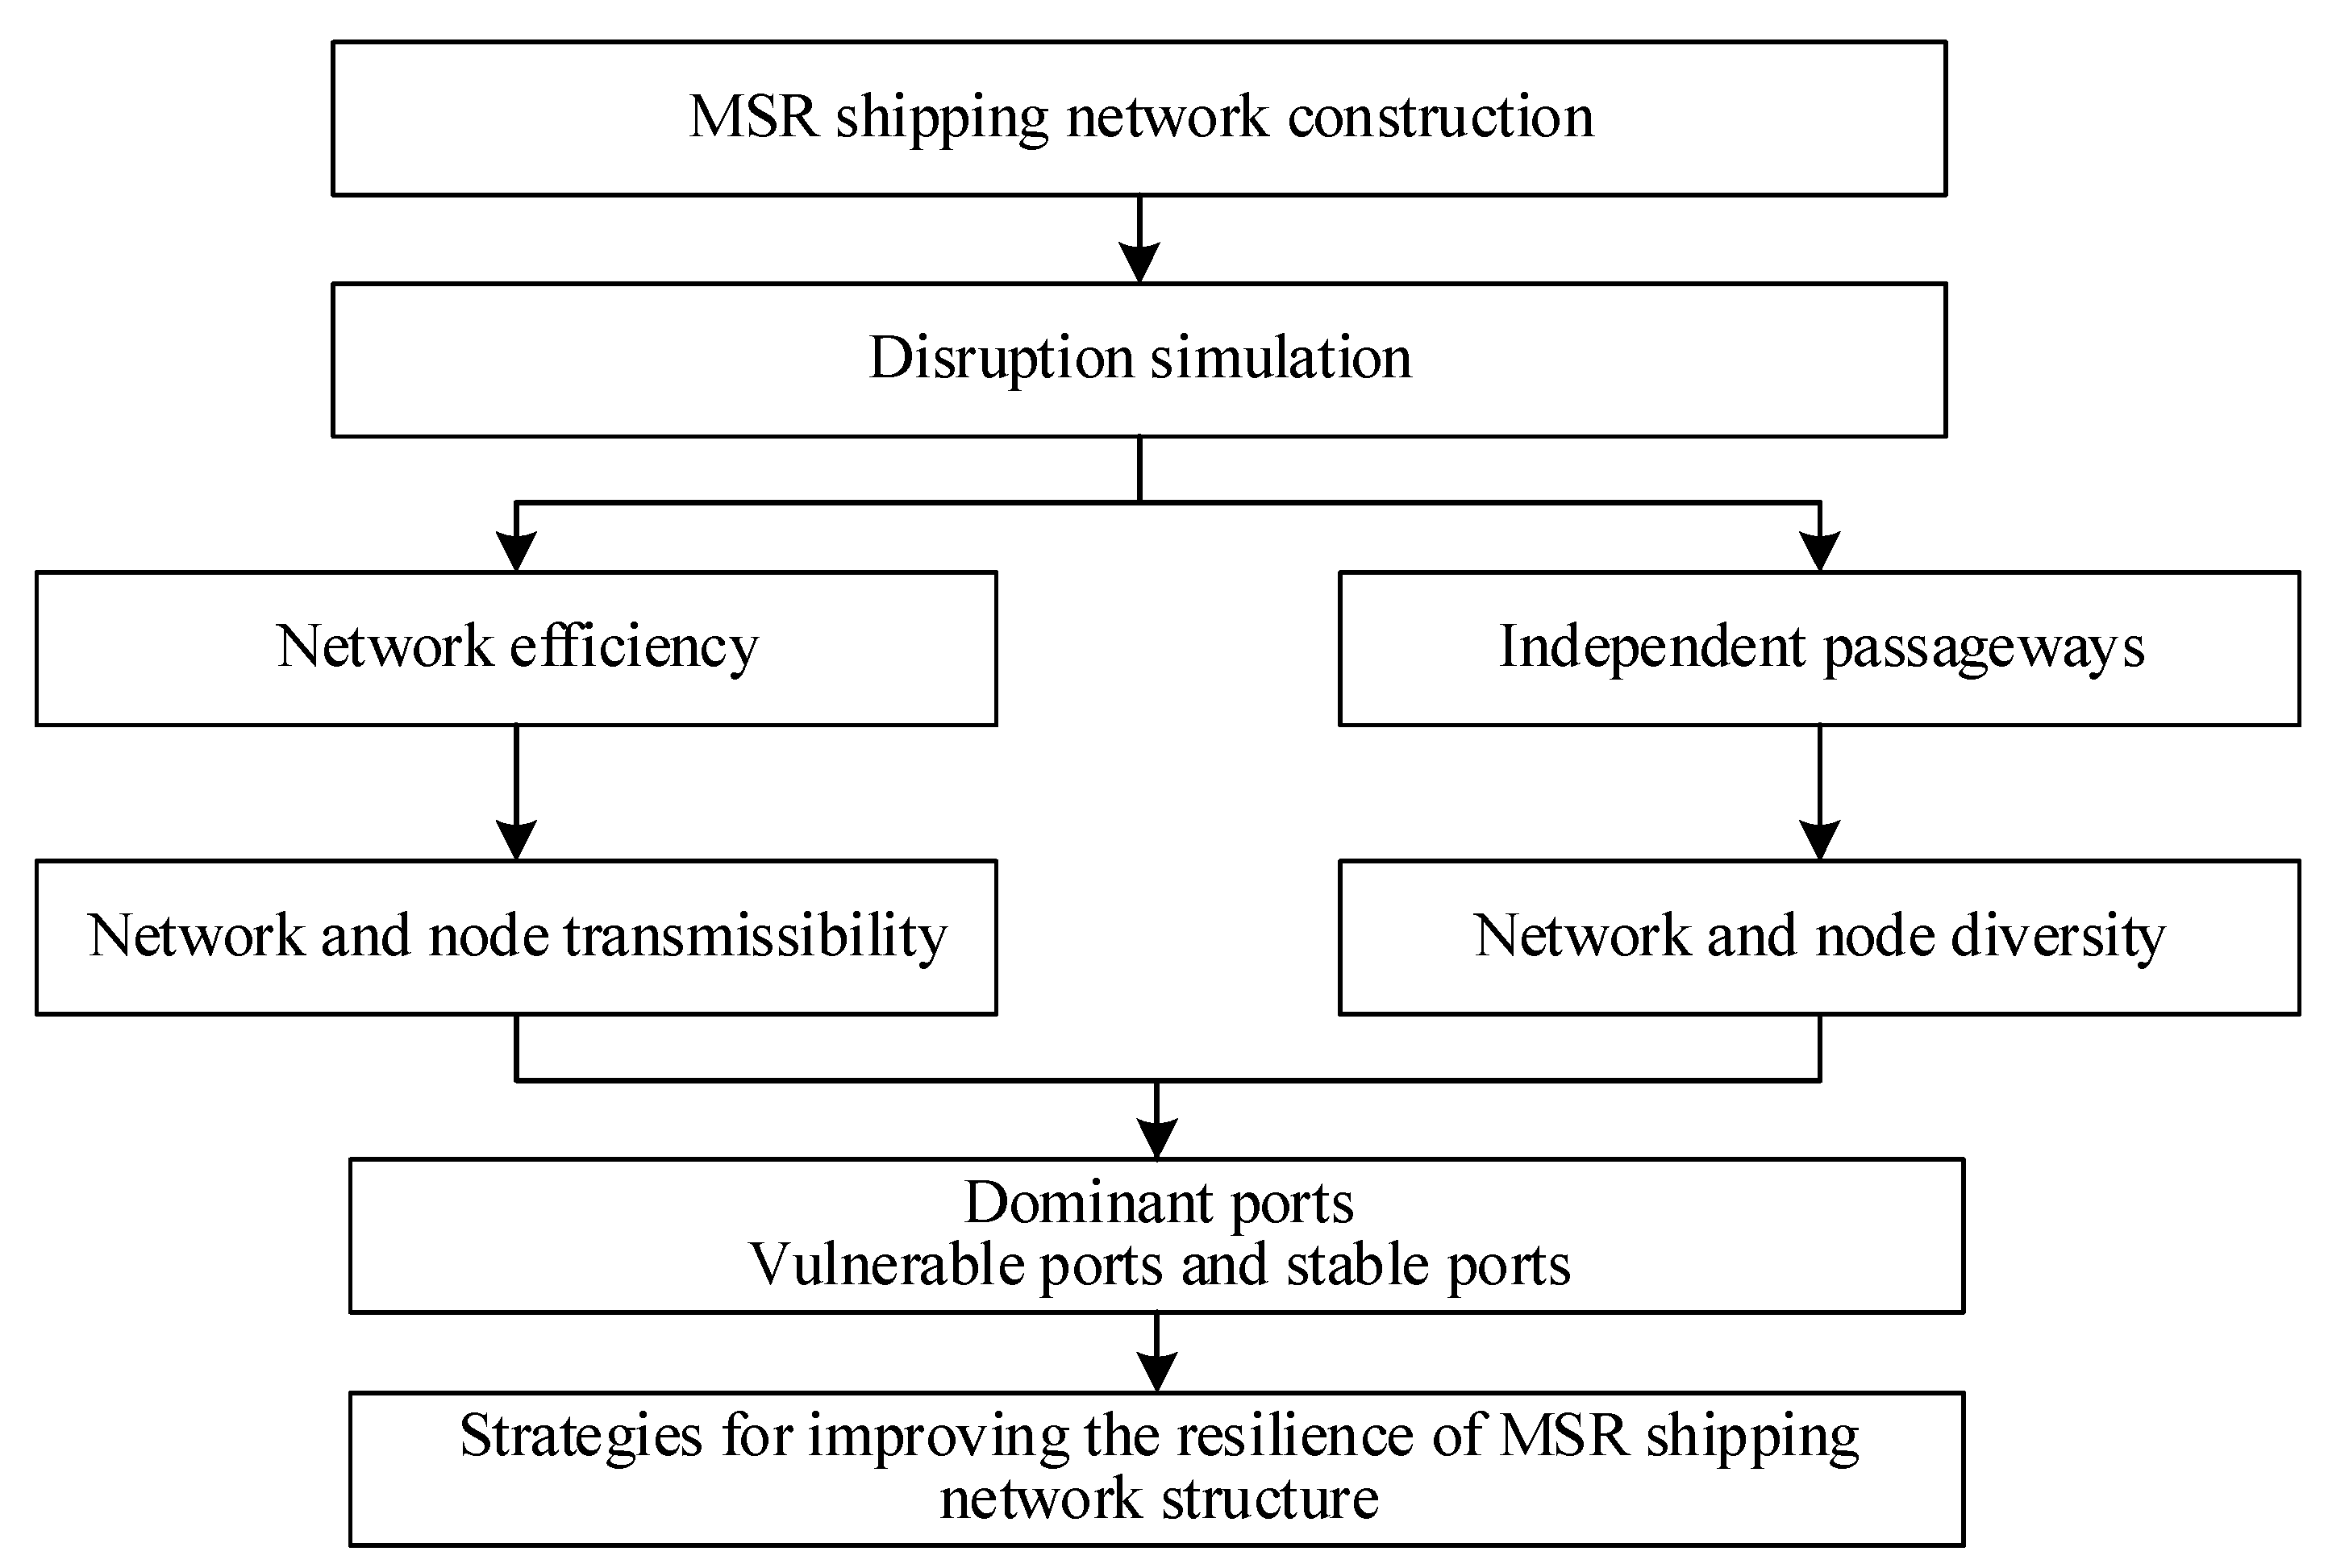
3.1.1. Research Framework

Figure 1 shows the research framework of this study.

3.1.2. Network and Node Transmissibility

Transmissibility describes the ability of element flow diffusion in complex networks, and it is mainly related to the shortest path length between nodes. High transmissibility means that port nodes in a network can quickly exchange information, goods, capital and other elements. This will promote the coordinated development of ports and countries along the MSR and enhance its resistance to emergencies.
In this paper, the index of network efficiency is used for the quantitative evaluation of network transmissibility, which is defined as the transmission function realized directly based on the network [15]. Many scholars have demonstrated the accuracy of network efficiency as a measurement of resilience through empirical studies [9]. It is expressed as:
E g = 1 N ( N 1 ) i j 1 d i j
where E g represents the network efficiency, and 0 E g 1 . d i j is the shortest path length between port i and j . N is the total number of port nodes.
The calculation method for node transmissibility is similar to network transportability. The difference is that it only reflects the transmissibility efficiency between a node and all other nodes, that is:
E i = 1 N 1 i j 1 d i j

3.1.3. Network and Node Diversity

Diversity is the description of network fault tolerance. The diversity of a network mainly refers to the existence of multiple connection paths between nodes. When a certain path is affected by emergencies, other paths ensure the normal operation of the network [45] to effectively maintain the stability of the network. Network diversity is very important for real networks such as the shipping network. When port nodes or links fail to operate due to emergencies and restoring the port or route to the normal state as soon as possible, an effective way to ensure the normal operation of the network is to connect two port nodes by another path. Therefore, the diversity of the MSR shipping network depends on whether there are alternative routes between the two ports.
Due to many nodes, the number of paths between nodes will be huge. Moreover, there will be many extremely long paths, which is seriously inconsistent with the actual situation. In this paper, we used the average number of independent passageways proposed by IP and Wang [36] as references to measure the network diversity. The independent passageway between nodes is a set of paths without the same edge connected between nodes. It is worth noting that the calculation of this indicator is a heuristic. Many scholars have used it to study resilience in many fields, such as ecological networks [8], urban networks [15], road-bridge networks [46], road networks [47,48]. These studies have proved the feasibility and effectiveness of this indicator. The calculation formula is as follows:
V g = i j n i j N ( N 1 )
where V g represents the average number of independent passageways. n i j is the number of independent passageways between port i and j .
The calculation method for node diversity is similar to that used for network diversity. For node diversity, the connectivity diversity between a node and all other nodes needs to be calculated, that is:
V i = i j n i j N 1
The idea of finding independent passageways is similar to finding the shortest paths between all node pairs. We can combine the Dijkstra algorithm to calculate the number of independent passageways. Algorithm 1 shows the calculation process of network and node diversity.
Algorithm 1: Network and Node Diversity
1:
Input   network   G ,   which   contains   N   nodes   and   E edges.
2:
Create a N*N matrix K , all values n i j are 0.
3:
for each  i ,   j  do
4:
    Set   the   initial   path   number   k = 0 .
5:
   if  i = j  then
6:
      n i j = 0
7:
   Else if  there   is   no   path   between   i   and   j , then
8:
      let   n i j   be   equal   to   k
9:
     Else   Compute   the   shortest   path   from   i   to   j   using   the   Dijkstra   algorithm ,   and   set   k = k + 1 .
10:
      Delete   all   edges   on   path   k , and go to Step 7.
11:
     end if
12:
   end if
13:
end for
14:
Compute   V g   and   V i using Equations (3) and (4).
15:
return the matrix K ,   V i   and   V g .

3.2. Research Object

The MSR focuses on the route from China’s coastal ports to Europe and Africa through the South China Sea and the Indian Ocean and the route from China’s coastal ports to the South China Sea to the South Pacific. It covers East Asia, Southeast Asia, South Asia, West Asia, East Africa, Oceania, the Mediterranean, Europe and other regions. Within this scope, we constructed the MSR shipping network and made the following assumptions:
(1)
One city corresponds to one port, and each port city is one node.
(2)
If port i and j are two calling ports adjacent to any routes, it is considered that there is edge between the ports. The direction of the route is the direction of the edge.
(3)
The number of routes attached to port i and j is taken as the weight of the edge between port i and j .
The route data were derived from the Container Forecaster of Drewry in 2019. After screening, 179 ports were finally obtained, and a directed weighted network was constructed.

4. MSR Shipping Network Structure Resilience under Disruption Simulation

The network disruption simulation mainly considered the impact of emergencies on different port nodes. The disruption simulation took the port node in the network as the attack object. A network disruption scenario was simulated under the failure of one port node at a time, and 179 port nodes were attacked successively. The port nodes immediately failed when attacked, and all of the edges connected with them were removed simultaneously.

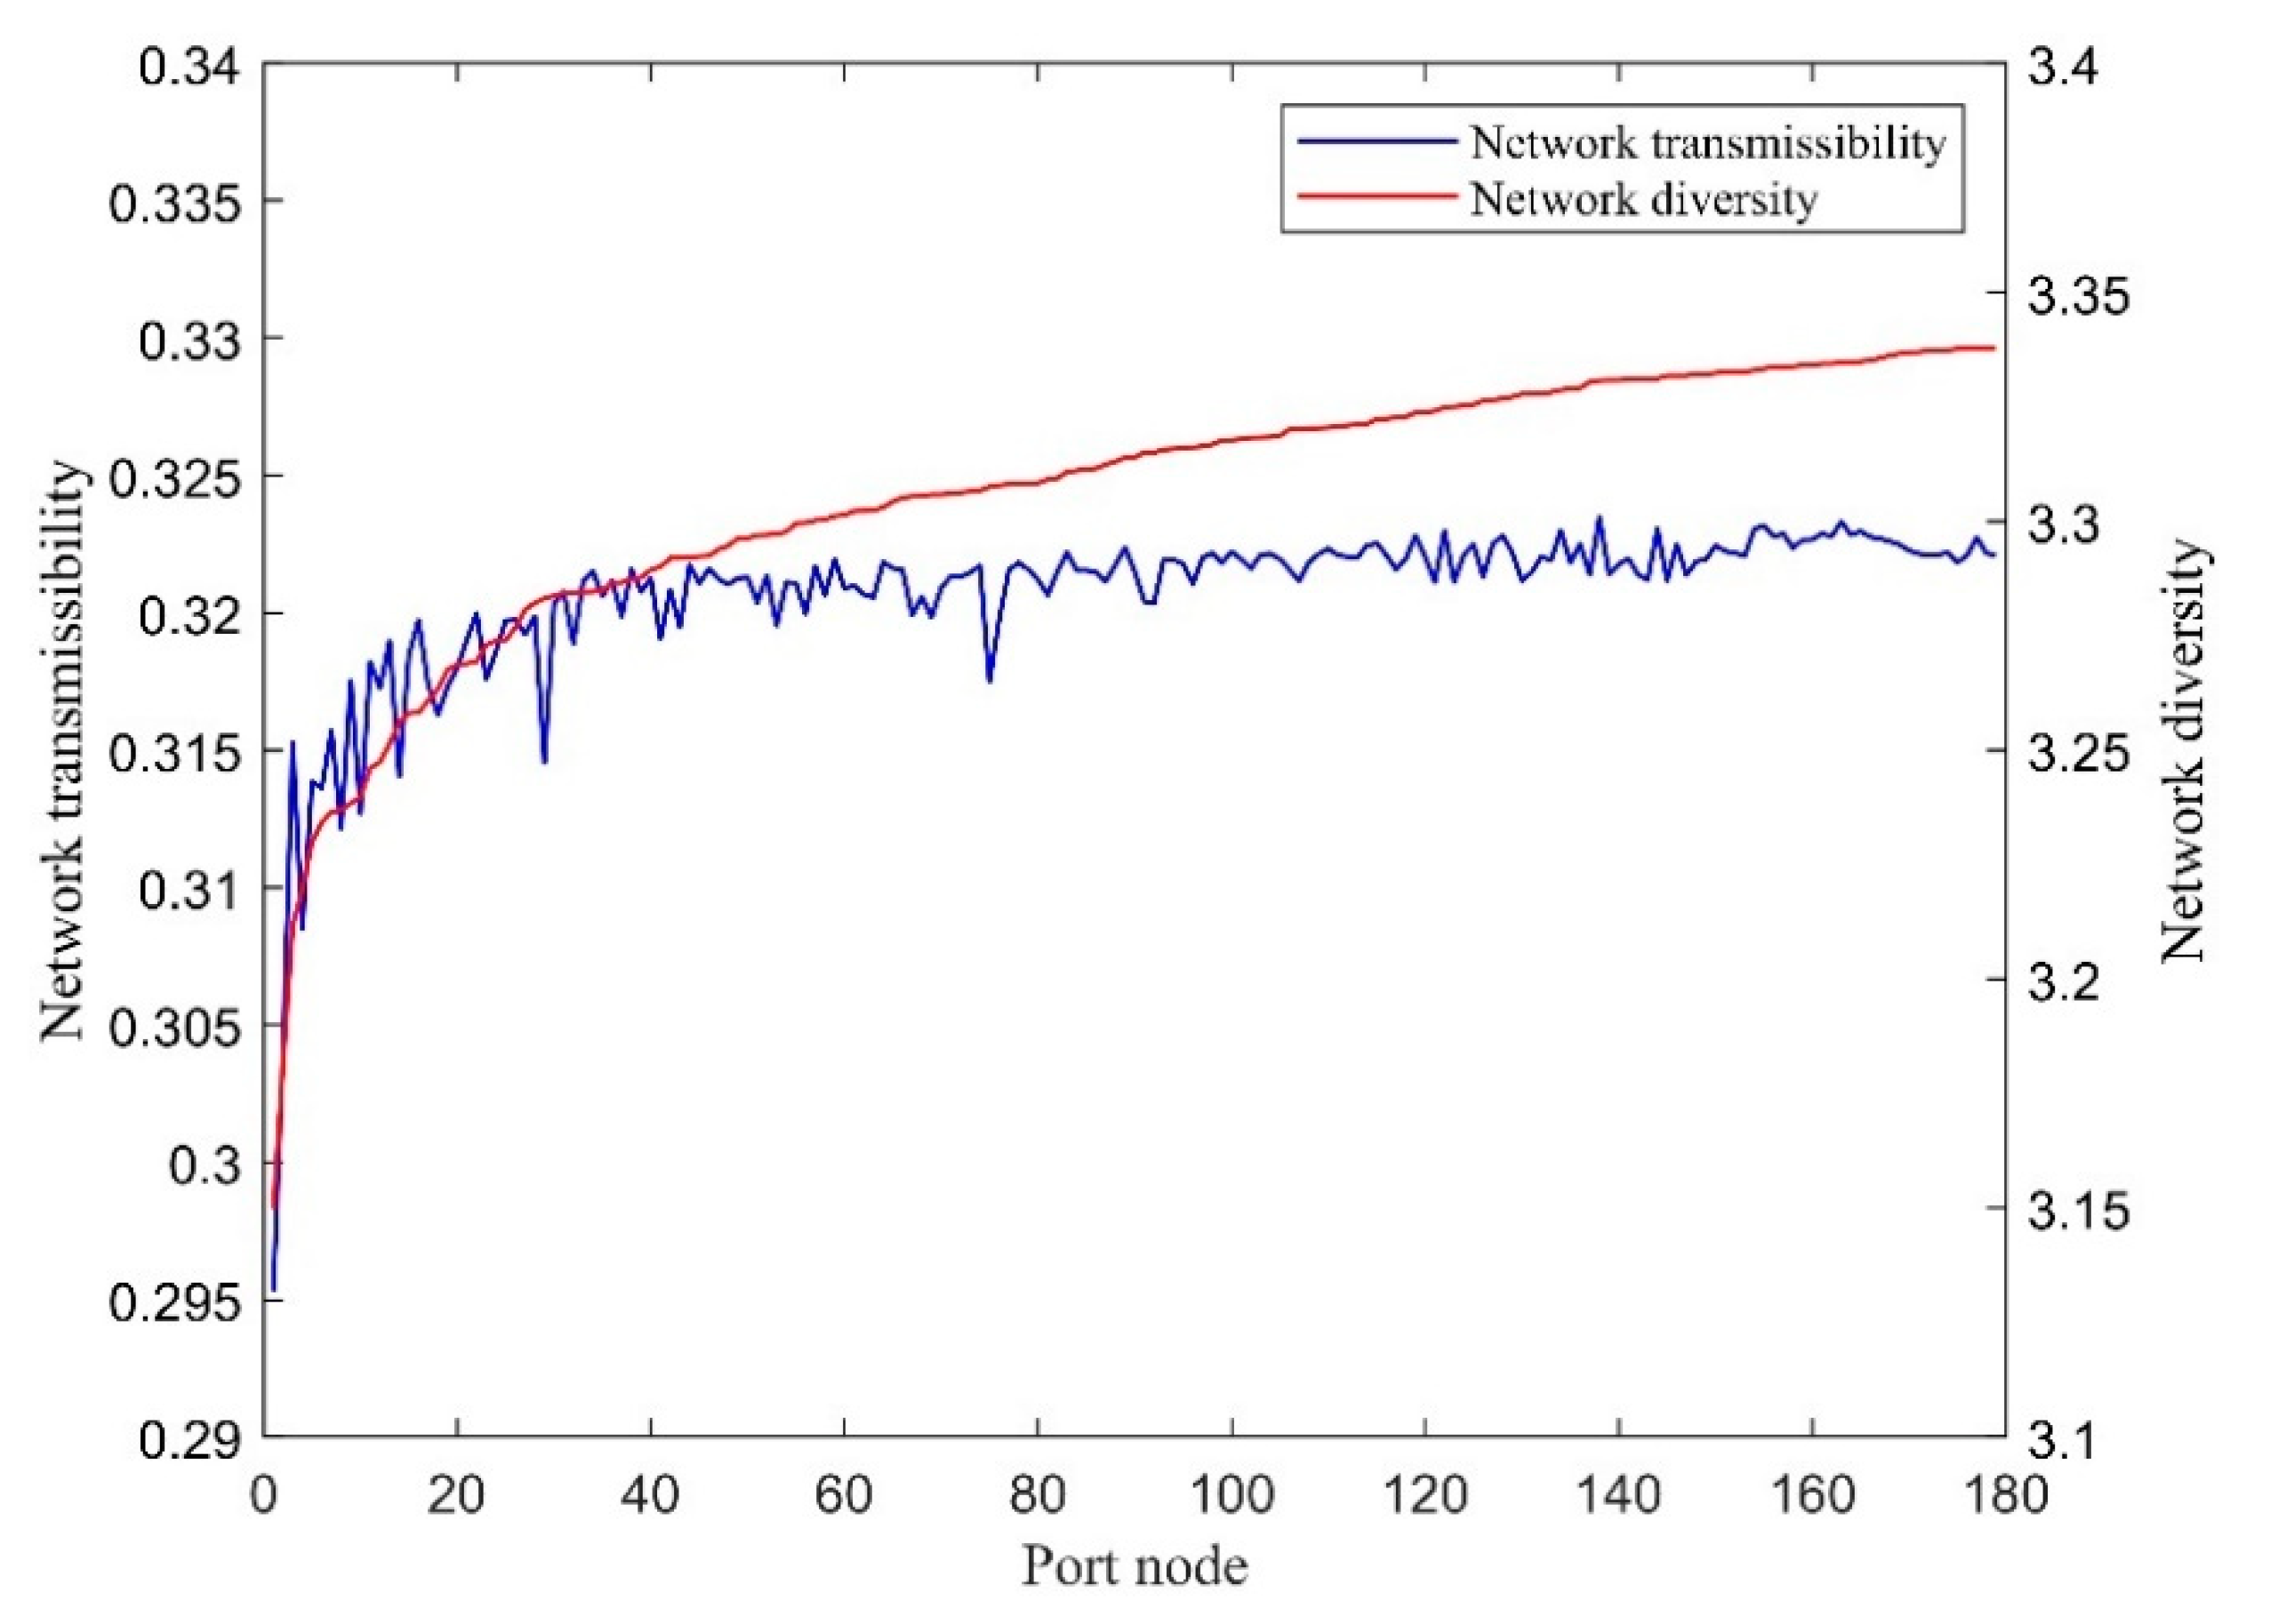
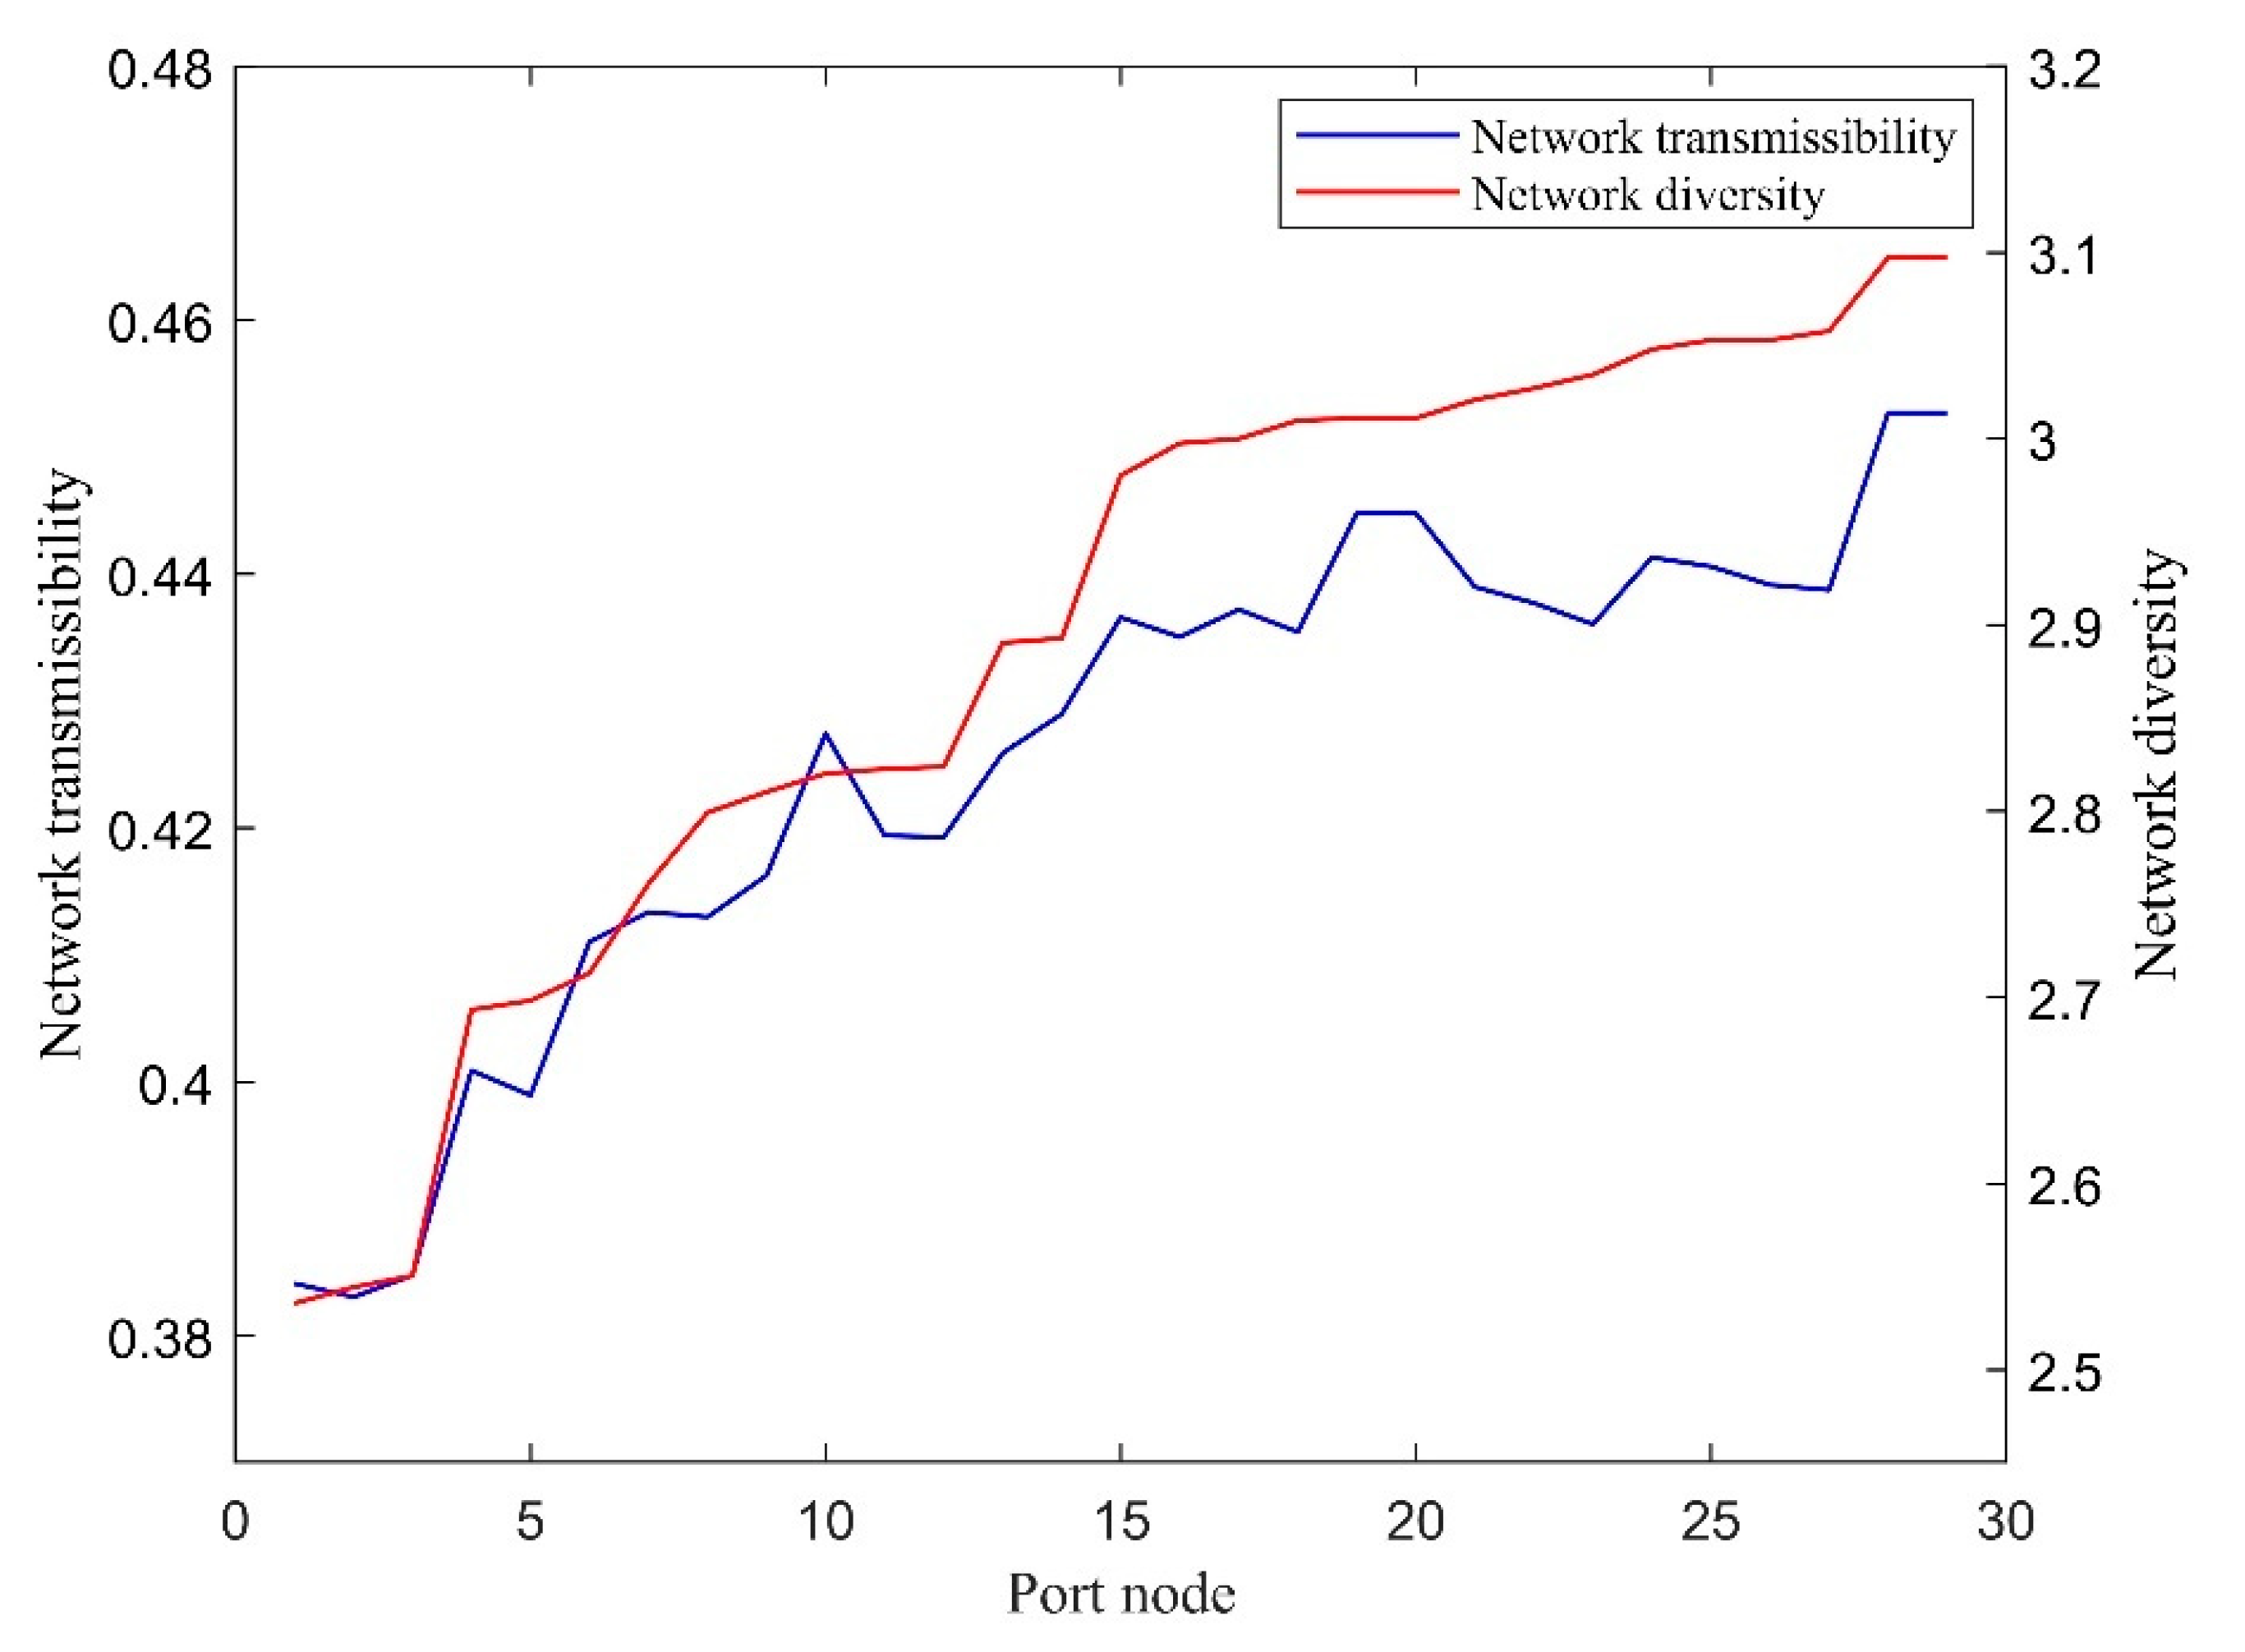
4.1. Network Transmissibility and Diversity Analysis

Firstly, the network transmissibility and diversity of the MSR shipping network in the initial state without interference were calculated, which were 0.3256 and 3.3488, respectively. Then, the adjacency matrix of the MSR shipping network under different port failure scenarios was simulated, and the resilience of the network structure was measured. Figure 2 shows the network transmissibility and diversity changes when all port nodes fail individually in sequence. The simulation found that when an emergency occurs, the path length and the number of alternative paths between ports will be affected. Additionally, the cost related to the connections between ports will increase, and the number of alternative paths will decrease, which will lead to the simultaneous attenuation of the resistance, response and resilience of the network structure. Some ports greatly impact the transmissibility and diversity of a network, meaning that they have important roles alongside their roles as bridges. Additionally, some ports are also important for path diversification.
In addition, the two broken line trends in Figure 1 display certain differences. Some ports greatly impact the transmissibility or diversity of the network, and some have small impacts. This may be due to the limitation of marine geography and channel distribution to a certain extent. There are fewer routes that directly connect multiple regions, which makes the role of ports different. However, in smaller regional shipping networks, the degree of the impact on network transmissibility and diversity tends to be synchronous. Figure 3 shows the resilience of the East Asian regional shipping network, including China, Japan, and South Korea.
The K-means algorithm adopts distance as the evaluation index of similarity. The closer the distance between two objects is, the greater the similarity. So, we adopted the K-means algorithm to cluster ports and regarded the values of the transmissibility and diversity of the MSR shipping network when different ports failed as “distance”. The K value is obtained by the elbow method. The ports were divided into five levels. The results are shown in Table 1 (only the first three levels are shown).
It can be seen that the ports at the first, second and third levels are located on the main line of the MSR. Additionally, they basically include the necessary places for all the important transportation channels. For example, the Singapore, Port Klang and Tanjung Pelepas ports are located in the Strait of Malacca. The Colombo port is an important transit port for Asian, European and African countries. The Jeddah port and Port Said are located along the Bab el-mandeb strait to the Suez Canal. The Jebel Ali and Algeciras ports are located in the Strait of Hormuz and Gibraltar, respectively.
Further analysis shows that there are ports that simultaneously have a high impact on network transmissibility and diversity. In this paper, these key ports related to resilience are referred to as dominant ports. We regard the ports in Table 1 belonging to the first and second levels of influence for network transmissibility and diversity as dominant ports. There are nine dominant ports in total, namely Singapore, Port Klang, Colombo, Ambarli, Tanjung Pelepas, Busan, Rotterdam, Ningbo-Zhoushan and Hong Kong. Singapore, Port Klang and Colombo are the three most dominant ports, with each ranking in the top five ports related to the impact of port failure on network transmissibility and diversity.

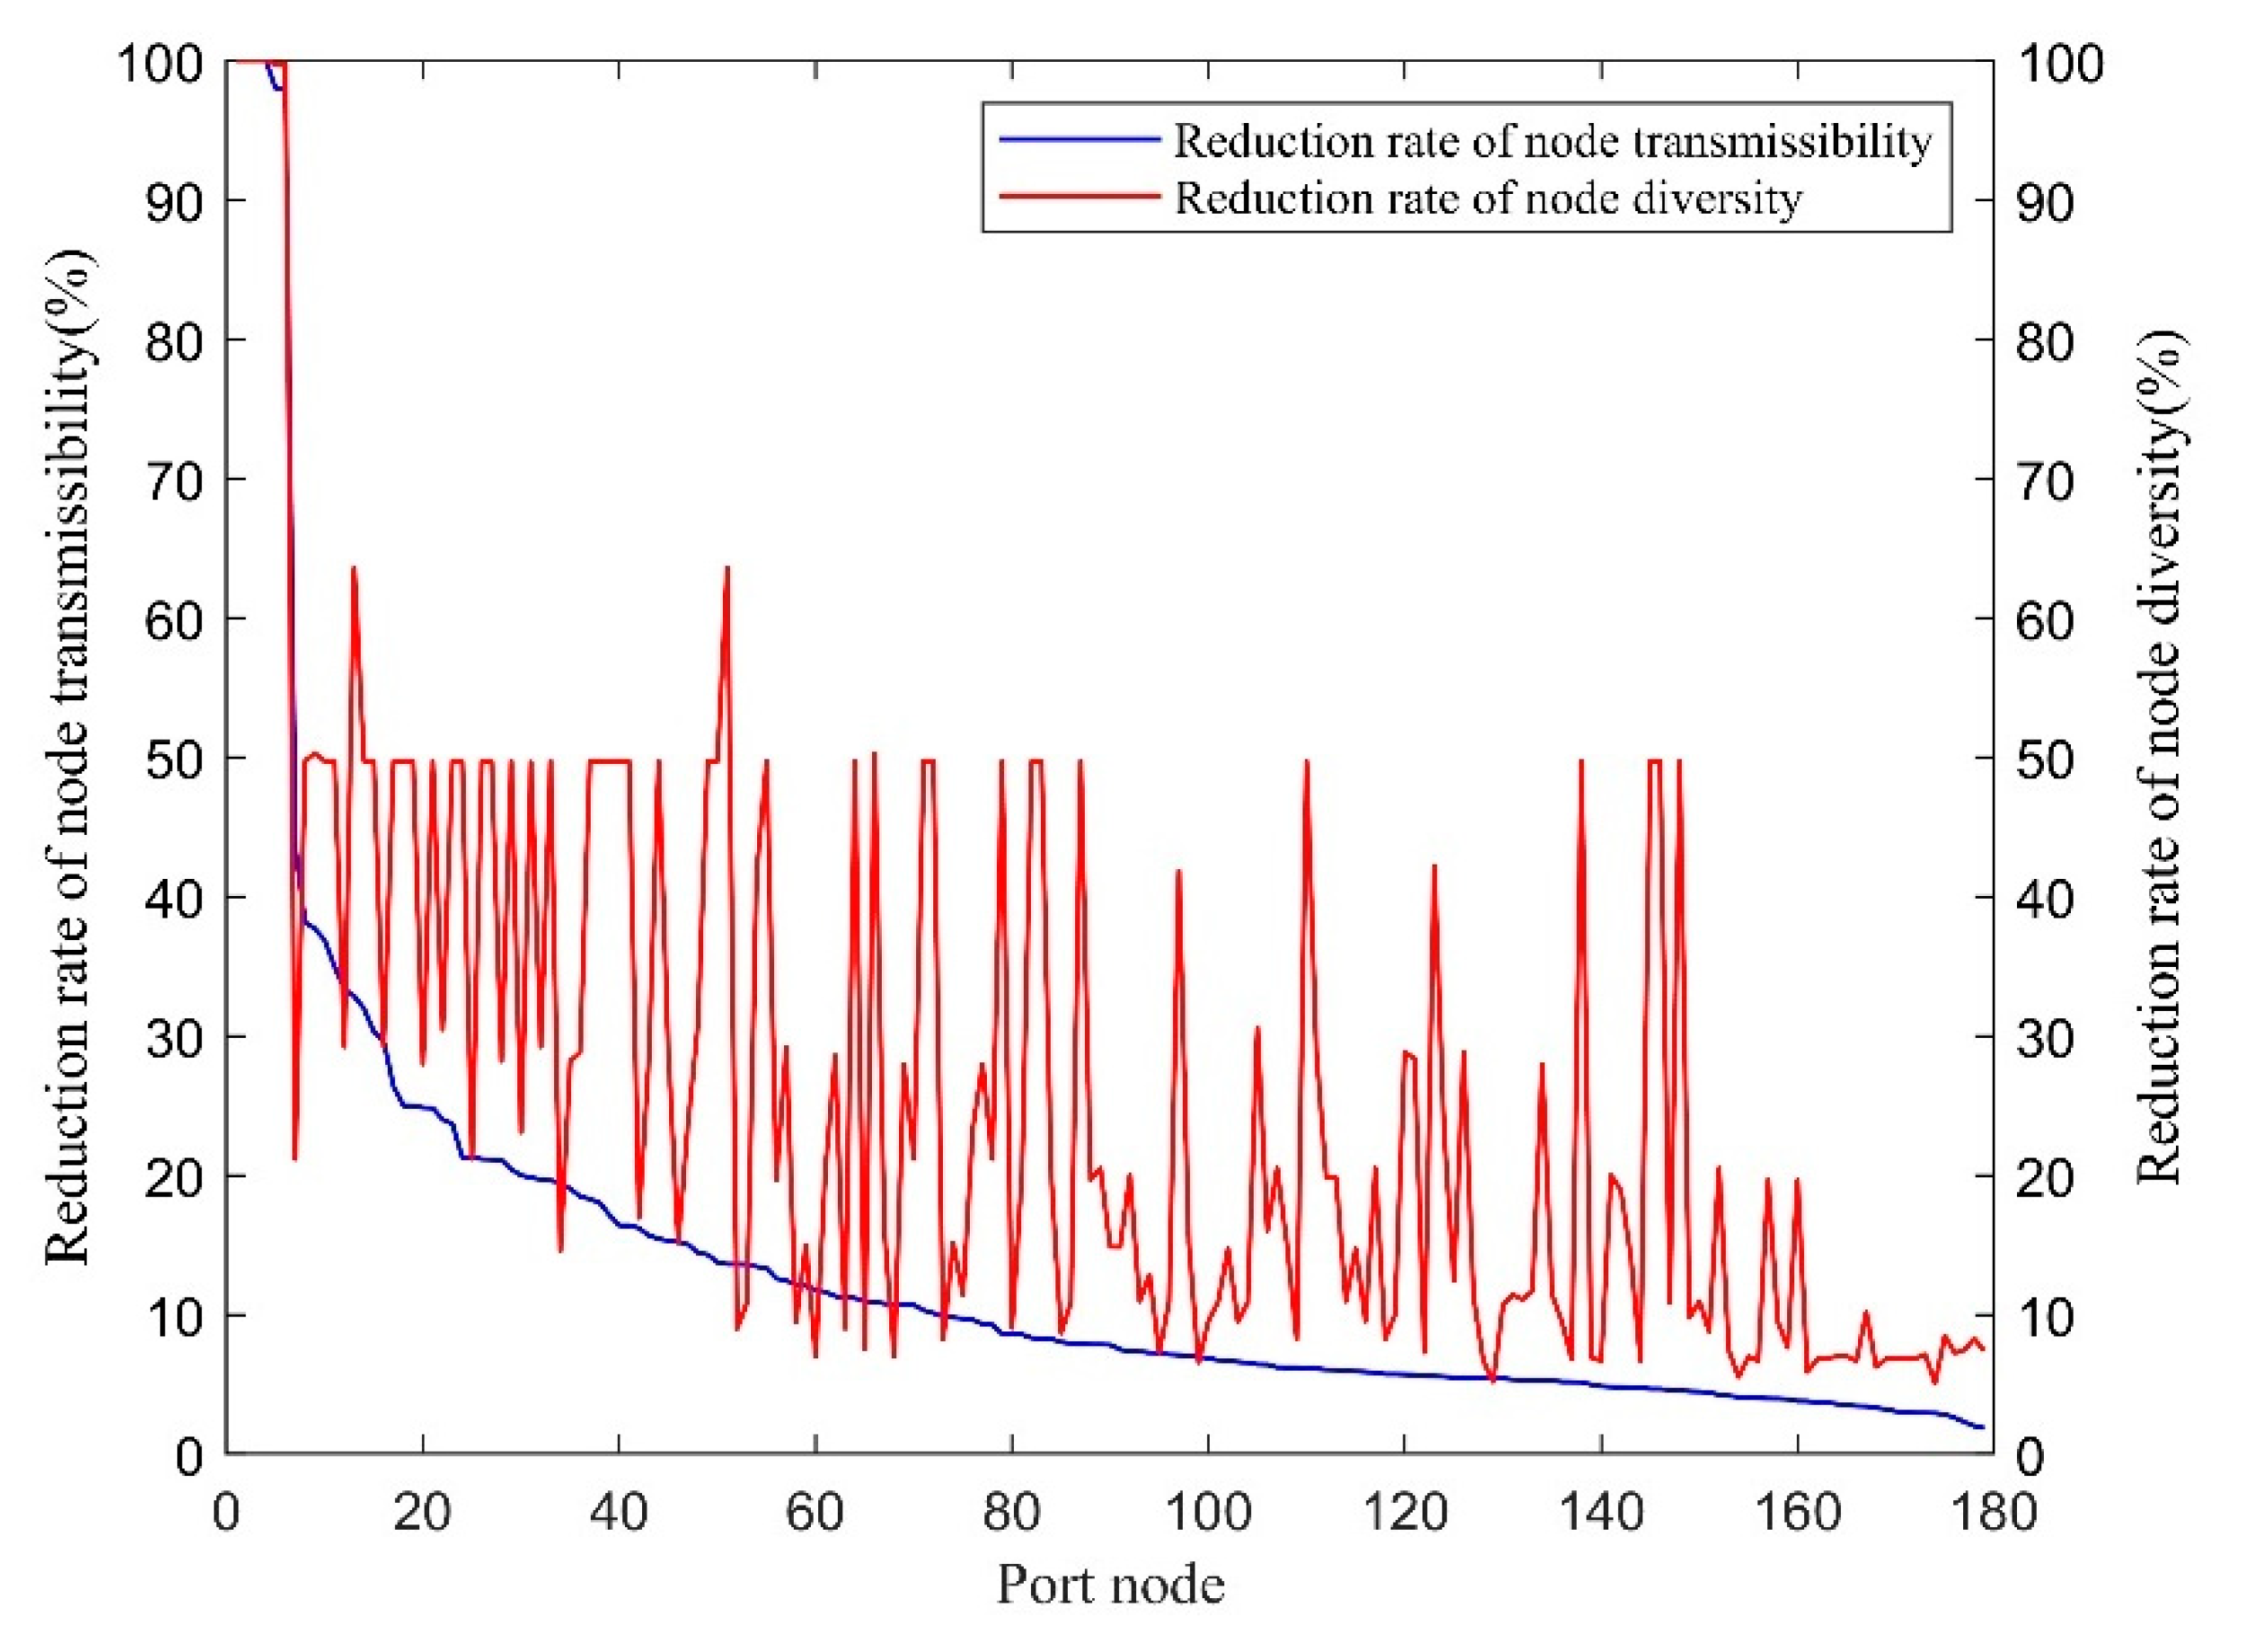
4.2. Node Transmissibility and Diversity Analysis

The resilience level of port nodes will decrease in varying degrees due to the failure of different ports. Still, there is generally only one port that has the greatest interference with a certain port. This scenario is called the maximum disturbance state of the port. Then, we compared the changes in node resilience level for each port under the maximum disturbance state, and the results are shown in Figure 4.
It can be found that the reduction degrees of port node transmissibility and diversity under the maximum disturbance state are different. The transmissibility and diversity of the Abidjan, Vigo, General Santos and Yangon ports under the maximum disturbance state both drop to 0, which is because these four ports are only connected to one port in the MSR shipping network. When their connected port fails, the four ports will be isolated. Some ports, such as Singapore port, Port Klang and Colombo port, show strong resistance to intervention.
From this perspective, another type of key port related to resilience in the MSR shipping network is called a vulnerable port. The resilience level of this kind of port easily and significantly declines with the failure of other ports. The emergence of vulnerable ports weakens the resilience of the MSR shipping network in response to emergencies. Similarly, based on the reduction rate of port node transmissibility and diversity under the maximum disturbance state, all ports were divided into five levels using the K-means clustering algorithm (the smaller the level is, the greater the average value). In this way, we obtained two classification results. Additionally, the ports in the first and second levels were regarded as vulnerable ports: the Ahus, Abidjan, Vigo, Gothenburg, General Santos, Yangon, Beira, Penang, Gdynia, Kuching, Lisbon, Male Island, Surabaya, Subic Bay and Townsville ports. In addition, for better comparative analysis, the ports in the fifth level were regarded as stable ports, which have strong abilities to resist external intervention.

5. Characteristic Analysis of Key Ports and Resilience Improvement Strategy

5.1. Characteristic Analysis of Dominant Ports

The failure of dominant ports has a great impact on the resilience of the network structure and is also the root cause of the significant reduction in the resilience level of all other port nodes, as shown in Table 2. Specifically, the failure of the Singapore port was shown to have the greatest interference on the resilience level, with more than 20% of the port nodes along the MSR being affected by its failure, followed by Port Klang. Additionally, their interference scope was not shown to be limited to Southeast Asia, which has a certain impact on many different geographical regions.
The dominant ports occupy prominent positions in the network structure, which makes them more vulnerable to attacks and poses a threat to the sustainable development of the MSR shipping network. Next, we analyzed the characteristics of dominant ports in terms of the structural location and connection strength of port nodes. Node degree was used to measure the structural location, reflecting the breadth of the connection between this port and other ports. The weighted degree measured the connection strength, reflecting the depth of connection between a certain port and other ports.
Then, a Pearson correlation analysis was conducted. The correlation coefficients between the network transmissibility when a port fails and the degree value and weighted degree value of a failed port node were −0.864 and −0.770. The correlation coefficients between network diversity when a port fails and degree value and weighted degree value of failed ports were −0.932 and −0.796, and the significance levels were all less than 0.01. The results show that the larger the degree value and the weighted degree value of a port node, the greater the influence on the network transmissibility and diversity when a port node fails. From the perspective of structural position, the degree values of dominant ports are large. Additionally, they are transfer stations for multiple ports, which means efficient connectivity and diversified connections can be realized. From the perspective of connection strength, these ports are not only connected with many ports but are also closely connected, and the flow of goods is also frequent.

5.2. Characteristic Analysis of Vulnerable Ports

The port node resilience measurement was based on the maximum disturbance state involving the port that had the greatest impact on it. Therefore, during the characteristic analysis, the factor of the sailing distance between two ports increased. The analysis method used was similar to that described in Section 5.1. The structural position and connection strength of a port node were still measured using the degree value and weighted degree value. The sailing distance refers to the actual sailing distance between the port and the corresponding failed port under the maximum interference state, obtained using Netpas Distance software. At the same time, by comparing the regional distribution of ports connected with vulnerable ports and stable ports, we further analyzed the connection characteristics.
According to the correlation analysis, when a port node is in the maximum disturbance state, the correlation coefficients between the reduction rate of port node transmissibility and degree value, weighted degree value and sailing distance are −0.582, −0.491 and −0.368, respectively. The correlation coefficients between the reduction rate of port node diversity and degree value, weighted degree value and sailing distance are −0.598, −0.496 and -0.326, respectively. The results show that the actual sailing distance is not the constraint factor of the port’s ability to resist external intervention. The structural position of a port node is an important explanation for the formation of the vulnerable ports, and the connection strength has little influence on the port node resilience.
In terms of the geographical distribution of the MSR, it is divided into eight regions: East Asia, Southeast Asia, South Asia, the Middle East, the Mediterranean coast, northern and western Europe, eastern and southern Africa, and Oceania. Based on the classification of vulnerable ports and stable ports in Section 4.2, we then compared the regional distribution of their connected ports. The results are shown in Table 3. Due to a large number of stable ports, only ports whose degree value was above 20 are shown.
The reason stable ports can resist external interference better is that they have more diversified shipping links. These ports not only form a cluster closely connected with the same region but also have rich trans-regional connections as supplements. This greatly enriches the shipping trade of ports, enabling the ports to maintain diversified and efficient transportation routes in the case of emergencies.
By contrast, vulnerable ports have exposed characteristics of the lack of connection in the same region and the lack of trans-regional connection. Most vulnerable ports have shipping links with only one or two ports in the same region. Additionally, the Ahus, Abidjan, Gothenburg, General Santos, Gdynia and Kuching ports do not have trans-regional shipping links. Therefore, such ports rely heavily on their linked core ports, and the failure of core ports will greatly interfere with port node resilience.

5.3. Strategies for Improving the Resilience of MSR Shipping Network Structure

Dominant ports and vulnerable ports are of great significance to the resilience of the MSR shipping network structure. When the dominant ports are interrupted during emergencies, this has a strong effect on the resilience of the network structure. Therefore, it is necessary to reduce the possibilities of the failure of dominant ports. The vulnerable ports are weaknesses to the resilience of the network structure, which weakens the ability of the network to deal with the impact of emergencies. The characteristics of vulnerable ports showed that the main reasons vulnerable ports affect the resilience of the network structure include the low centrality of port nodes, weak links in ports in the same region and insufficient trans-regional shipping links. Therefore, it is necessary to enhance the resistance of vulnerable ports to intervention according to their characteristics. Based on the above analysis, the following strategies are proposed to improve the resilience of the MSR shipping network structure:
First, enhancing the security and emergency response capability of dominant ports is very important to ensure the resilience of the network structure. All the ports should formulate contingency plans and establish effective management systems to deal with natural disasters, bad weather and other emergencies. This will minimize damage to ports caused by emergencies and ensure the normal operation of ports. Furthermore, port management should provide an efficient emergency repair system for port construction according to different emergencies.
Second, the centrality of vulnerable ports should be strengthened, and the network structure should be optimized. Vulnerable ports are greatly affected under the maximum disturbance state because they have fewer trans-regional connections. Therefore, the container liner routes should be adjusted appropriately, and the transit business of general ports should be improved. It is also very necessary to enhance the strength of existing connections. In this way, the existing weak connections between ports can be transformed into strong connections to improve port centrality. When vulnerable ports maintain close connections with regional hub ports, they should avoid too many single connections and promote a regional port group that can develop into a complex spatial network structure.
Third, the diversity of trans-regional connections should be enriched. Due to the geographical limitations of the MSR, trans-regional connections play bridging roles in the whole network. The enrichment of trans-regional connections can greatly improve transport efficiency and capacity and enhance the resilience of the MSR shipping network.
Fourth, it is also necessary to appropriately improve the container throughput capacity of the adjacent ports of hub ports. When a hub port fails, the adjacent port will take on some transportation tasks. If the redundant capacity of the adjacent ports is insufficient, this will lead to the failure of the adjacent ports. In addition, the increase in throughput capacity should not be formulated blindly but should be coordinated with the hub port to avoid excessive throughput capacity caused by repeated port construction and the waste of social resources.

6. Conclusions

In this paper, transmissibility and diversity were used to represent the resilience of network and port nodes. Based on a disruption simulation, the variation characteristics of the resilience of the network and port nodes in the MSR shipping network in response to an external intervention were analyzed. Then, we analyzed the characteristics of key ports and identified the factors that affect the level of resilience in the network. Finally, suggestions were put forward to optimize the MSR shipping network structure in terms of resilience. The main conclusions of this paper are summarized as follows:
(1)
Port failure will have an impact on the resilience of the Maritime Road shipping network structure, among which the failure of some ports has a great impact. Due to the limitation of marine geography and channel distribution to a certain extent, the effects of port failure on network transmissibility and diversity are different. However, in smaller regional shipping networks, the degree of impact on network transmissibility and diversity tends to be synchronous.
(2)
The reduction rate of the transmissibility and diversity of port nodes under the maximum disturbance state are different, and a few ports are isolated under the maximum disturbance state.
(3)
Dominant ports are transfer stations for multiple ports, which enable efficient connectivity and diversified connections. Additionally, they have closer connections and more frequent cargo flows. When a port node is in the maximum disturbance state, the sailing distance from the corresponding port is not the main factor that affects the resilience of a port node. In addition, stable ports are more diversified in terms of regional and trans-regional links, especially trans-regional ones.
(4)
Through the analysis of network connection characteristics regarding dominant ports and vulnerable ports, to improve the resilience of the MSR shipping network, we need to confirm the security and emergency response capability of dominant ports, strengthen the centrality of vulnerable ports and enrich the diversity of trans-regional connections. In addition, appropriately improving the container throughout capacity of the adjacent ports of hub ports will also help to improve network resilience.
Taking the MSR shipping network as an example, this paper discussed the resilience of the network structure during disruptions. The research results can provide a valuable reference for ensuring network transmission efficiency and improving network stability. However, there are still some limitations to this study. When using an independent path to measure diversity, some potential paths may be lost in the calculation process. Furthermore, in a real-life situation, there will be dynamic changes in routes and cargo transfer during the recovery of a shipping network. In the future, combined with the route weight, we can further consider the redistribution of cargo volume after the external impact on the shipping network to realize a dynamic study on the resilience of shipping networks.

Author Contributions

Conceptualization, Y.Y. and W.L.; data curation, Y.Y.; formal analysis, Y.Y. and W.L.; funding acquisition, W.L.; investigation, Y.Y.; methodology, Y.Y.; project administration, W.L.; resources, Y.Y.; software, Y.Y.; validation, Y.Y. and W.L.; Writing—original draft, Y.Y.; writing—review and editing, W.L. All authors have read and agreed to the published version of the manuscript.

Funding

This research was funded by the Major Project of the National Social Science Fund of China, grant number 20&ZD070.

Institutional Review Board Statement

Not applicable.

Informed Consent Statement

Not applicable.

Data Availability Statement

Not applicable.

Acknowledgments

The authors are thankful to the anonymous referee for their useful suggestions and comments.

Conflicts of Interest

The authors declare no conflict of interest.

References

  1. Huang, T.; Chen, Z.; Wang, S.; Jiang, D. Efficiency evaluation of key ports along the 21st-Century Maritime Silk Road based on the DEA–SCOR model. Marit. Policy Manag. 2021, 48, 378–390. [Google Scholar] [CrossRef]
  2. Kosowska-Stamirowska, Z. Network effects govern the evolution of maritime trade. Proc. Natl. Acad. Sci. USA 2020, 117, 201906670. [Google Scholar] [CrossRef] [PubMed]
  3. Zhang, Y.; Wei, K.; Shen, Z.; Bai, X.; Lu, X.; Soares, C.G. Economic impact of typhoon-induced wind disasters on port operations: A case study of ports in China. Int. J. Disaster Risk Reduct. 2020, 50, 101719. [Google Scholar] [CrossRef]
  4. Chopra, S.S.; Khanna, V. Understanding resilience in industrial symbiosis networks: Insights from network analysis. J. Environ. Manag. 2014, 141, 86–94. [Google Scholar] [CrossRef] [PubMed]
  5. Peng, C.; Lin, Y.; Gu, C. Evaluation and optimization strategy of city network structural resilience in the middle reaches of Yangtze River. Geogr. Res. 2018, 37, 1193–1207. [Google Scholar]
  6. Kim, Y.; Chen, Y.S.; Linderman, K. Supply network disruption and resilience: A network structural perspective. J. Oper. Manag. 2015, 33–34, 43–59. [Google Scholar] [CrossRef] [Green Version]
  7. Fernandez-Martinez, E.; Andina-Diaz, E.; Fernandez-Pena, R.; García-Lopez, R.; Fulgueiras-Carril, I.; Liebana-Presa, C. Social networks, engagement and resilience in university students. Int. J. Environ. Res. Public Health 2017, 14, 1488. [Google Scholar] [CrossRef] [Green Version]
  8. Wang, T.; Li, H.; Huang, Y. The complex ecological network’s resilience of the Wuhan metropolitan area. Ecol. Indic. 2021, 130, 108101. [Google Scholar] [CrossRef]
  9. Li, X.; Xiao, R. Analyzing network topological characteristics of eco-industrial parks from the perspective of resilience: A case study. Ecol. Indic. 2017, 74, 403–413. [Google Scholar] [CrossRef]
  10. Mina, M.; Messier, C.; Duveneck, M.; Fortin, M.; Aquilue, N. Network analysis can guide resilience-based management in forest landscapes under global change. Ecol. Appl. 2021, 31, e02221. [Google Scholar] [CrossRef]
  11. Ruiz-Martin, C.; Paredes, A.L.; Wainer, G.A. Applying complex network theory to the assessment of organizational resilience. IFAC-PapersOnLine 2015, 48, 1224–1229. [Google Scholar] [CrossRef]
  12. Wang, Y.; Zhan, J.; Xu, X.; Li, L.; Chen, P.; Hansen, M. Measuring the resilience of an airport network. Chin. J. Aeronaut. 2019, 32, 122–133. [Google Scholar] [CrossRef]
  13. Osei-Asamoah, A.; Lownes, N.E. Complex Network Method of Evaluating Resilience in Surface Transportation Networks. Transportation Research Record. J. Transp. Res. Board 2014, 2467, 120–128. [Google Scholar] [CrossRef]
  14. Tang, H.; Zhao, X.; Chen, Z.; Xu, J.; Su, X. “Dose-Response” Vulnerability Assessment of Urban Power Supply Network: Foundation for Its Sustainability and Resilience. Math. Probl. Eng. 2018, 2018, 8025093. [Google Scholar] [CrossRef]
  15. Wei, S.; Pan, J. Resilience of Urban Network Structure in China: The Perspective of Disruption. ISPRS Int. J. Geo-Inf. 2021, 10, 796. [Google Scholar] [CrossRef]
  16. Holling, S.C. Resilience and stability of ecological systems. Annu. Rev. Ecol. Syst. 1973, 4, 1–23. [Google Scholar] [CrossRef] [Green Version]
  17. Cicchetti, D. Resilience under conditions of extreme stress: A multilevel perspective. World Psychiatry 2010, 9, 145–154. [Google Scholar] [CrossRef] [Green Version]
  18. Rachunok, B.A.; Bennett, J.B.; Nateghi, R. Twitter and disasters: A social resilience fingerprint. IEEE Access 2019, 7, 58495–58506. [Google Scholar] [CrossRef]
  19. Dormady, N.; Roa-Henriquez, A.; Rose, A. Economic resilience of the firm: A production theory approach. Int. J. Prod. Econ. 2019, 208, 446–460. [Google Scholar] [CrossRef]
  20. Cimellaro, G.P.; Renschler, C.S.; Reinhorn, A.M.; Arendt, L. Peoples: A framework for evaluating resilience. J. Struct. Eng. 2016, 142, 04016063. [Google Scholar] [CrossRef]
  21. Zou, Q.; Chen, S. Resilience modeling of interdependent traffic-electric power system subject to hurricanes. J. Infrastruct. Syst. 2020, 26, 04019034. [Google Scholar] [CrossRef]
  22. Zhao, Q.; Du, Y.; Zhang, T.; Zhang, W. Resilience index system and comprehensive assessment method for distribution network considering multi-energy coordination. Int. J. Electr. Power Energy Syst. 2020, 133, 107211. [Google Scholar] [CrossRef]
  23. Janić, M. Reprint of “Modelling the resilience friability and costs of an air transport network affected by a large-scale disruptive event”. Transp. Res. Part A 2015, 81, 77–92. [Google Scholar] [CrossRef]
  24. Archetti, F.; Antonio, C.; Soldi, D. Network analysis for resilience evaluation in water distribution networks. Environ. Eng. Manag. J. 2015, 14, 1261–1270. [Google Scholar]
  25. Crespo, J.; Suire, R.; Vicente, J. Lock-in or lock-out? How structural properties of knowledge networks affect regional resilience. J. Econ. Geogr. 2013, 14, 199–219. [Google Scholar] [CrossRef]
  26. Dixit, V.; Verma, P.; Tiwari, M.K. Assessment of pre and post-disaster supply chain resilience based on network structural parameters with CVaR as a risk measure. Int. J. Prod. Econ. 2020, 227, 107655. [Google Scholar] [CrossRef]
  27. Meng, F.; Fu, G.; Farmani, R.; Sweetapple, C.; Butler, D. Topological attributes of network resilience: A study in water distribution systems. Water Res. 2018, 143, 376–386. [Google Scholar] [CrossRef]
  28. Zhang, C.; Xu, X.; Dui, H. Resilience measure of network systems by node and edge indicators. Reliab. Eng. Syst. Saf. 2020, 202, 107035. [Google Scholar] [CrossRef]
  29. Zhou, J.; Hou, Q. Resilience assessment and planning of suburban rural settlements based on complex network. Sustain. Prod. Consum. 2021, 28, 1645–1662. [Google Scholar] [CrossRef]
  30. Zhang, X.; Miller-Hooks, E.; Denny, K. Assessing the role of network topology in transportation network resilience. J. Transp. Geogr. 2015, 46, 35–45. [Google Scholar] [CrossRef] [Green Version]
  31. Holme, P.; Kim, B.J.; Yoon, C.N.; Han, S.K. Attack vulnerability of complex networks. Phys. Rev. E Stat. Nonlinear Soft Matter Phys. 2002, 65, 056109. [Google Scholar] [CrossRef] [PubMed] [Green Version]
  32. Woolleymeza, O.; Thiemann, C.; Grady, D.; Lee, J.J.; Seebens, H.; Blasius, B.; Brockmann, D. Complexity in human transportation networks: A comparative analysis of worldwide air transportation and global cargo-ship movements. Eur. Phys. J. B 2011, 84, 589–600. [Google Scholar] [CrossRef] [Green Version]
  33. Wandelt, S.; Sun, X.; Cao, X. Computationally efficient attack design for robustness analysis of airtransportation networks. Transp. A 2015, 11, 939–966. [Google Scholar]
  34. Peng, P.; Cheng, S.; Chen, J.; Liao, M.; Wu, L.; Liu, X.; Lu, F. A fine-grained perspective on the robustness of global cargo ship transportation networks. J. Geogr. Sci. 2018, 28, 881–889. [Google Scholar] [CrossRef] [Green Version]
  35. Chen, Y.; Wang, J.; Jin, F. Robustness of China’s air transport network from 1975 to 2017. Phys. A 2020, 539, 122876. [Google Scholar] [CrossRef]
  36. Ip, W.H.; Wang, D. Resilience and friability of transportation networks: Evaluation, analysis and optimization. IEEE Syst. J. 2011, 5, 189–198. [Google Scholar] [CrossRef]
  37. Qi, X.; Mei, G.; Piccialli, F. Resilience Evaluation of Urban Bus-Subway Traffic Networks for Potential Applications in IoT-Based Smart Transportation. IEEE Sens. J. 2020, 21, 25061–25074. [Google Scholar] [CrossRef]
  38. Zhang, M.; Du, F.; Huang, H.; Zhang, F.; Ayyub, B.M.; Beer, M. Resiliency assessment of urban rail transit networks: Shanghai metro as an example. Saf. Sci. 2018, 106, 230–243. [Google Scholar] [CrossRef]
  39. Xu, X.; Chen, A.; Xu, G.; Yang, C.; Lam, W.H.K. Enhancing network resilience by adding redundancy to road networks. Transp. Res. Part E 2021, 154, 102448. [Google Scholar] [CrossRef]
  40. Dunn, S.; Wilkinson, S.M. Increasing the resilience of air traffic networks using a network graph theory approach. Transp. Res. Part E 2016, 90, 39–50. [Google Scholar] [CrossRef] [Green Version]
  41. Zhang, J.; Hu, F.; Wang, S.; Dai, Y.; Wang, Y. Structural vulnerability and intervention of high speed railway networks. Phys. A 2016, 462, 743–751. [Google Scholar] [CrossRef]
  42. Mou, N.; Sun, S.; Yang, T.; Wang, Z.; Zheng, Y.; Chen, J.; Zhang, L. Assessment of the resilience of a complex network for crude oil transportation on the Maritime Silk Road. IEEE Access 2020, 8, 181311–181325. [Google Scholar] [CrossRef]
  43. Asadabadi, A.; Miller-Hooks, E. Maritime port network resiliency and reliability through co-opetition. Transp. Res. Part E 2020, 137, 101916. [Google Scholar] [CrossRef]
  44. Wan, C.; Tao, J.; Yang, Z.; Zhang, D. Evaluating recovery strategies for the disruptions in liner shipping networks: A resilience approach. Int. J. Logist. Manag. 2021, 33, 389–409. [Google Scholar] [CrossRef]
  45. Sterbenz, J.P.G.; Cetinkaya, E.K.; Hameed, M.A.; Jabbar, A.; Qian, S.; Rohrer, J.P. Evaluation of network resilience, survivability, and disruption tolerance: Analysis, topology generation, simulation, and experimentation. Telecommun. Syst. 2013, 52, 705–736. [Google Scholar] [CrossRef]
  46. Zhang, W.; Wang, N.; Nicholson, C. Resilience-based post-disaster recovery strategies for road-bridge networks. Struct. Infrastruct. Eng. 2017, 13, 1404–1413. [Google Scholar] [CrossRef]
  47. Gao, L.; Wang, M.; Liu, A.; Gong, H. Comprehensive Evaluation of Urban Road Network Resilience Facing Earthquakes. Math. Probl. Eng. 2021, 2021, 6659114. [Google Scholar] [CrossRef]
  48. Wang, W.; Wang, N. Resilience-based risk mitigation for road networks. Struct. Saf. 2016, 62, 57–65. [Google Scholar]
Figure 1. Research framework of this study.
Jmse 10 00617 g001
Figure 2. Network resilience when all port nodes individually fail in sequence.
Jmse 10 00617 g002
Figure 3. East Asian regional shipping network resilience when all port nodes individually fail in sequence.
Jmse 10 00617 g003
Figure 4. Port node resilience reduction under maximum disturbance state.
Jmse 10 00617 g004
Table 1. Classification of ports along the MSR based on K-means clustering algorithm.
CategoryPorts (Based on Network Transmissibility after Port Failure)Ports (Based on Network Diversity after Port Failure)
First levelSingapore, Port Klang, ColomboSingapore, Port Klang
Second levelAmbarli, Piraeus, Bremerhaven, Tanjung Pelepas, Busan, Rotterdam, Port Moresby, Ningbo-Zhoushan, Hong KongAmbarli, Tanjung Pelepas, Busan, Jeddah, Colombo, Rotterdam, Ningbo-Zhoushan, Port Said, Tauranga, Hong Kong
Third levelAlgeciras, Antwerp, Auckland, Brisbane, Dar Es Salaam, Dammam, Davao
Tanjung Priok, Durban, Kaohsiung, Guangzhou, Port of Hamad, Hamburg, Jeddah, Jebel Ali, Kimbe, Koper, Rabaul, Lae, Le Havre, Maputo, Melbourne, Jawaharlal, Nehru, Qingdao, Port Said, Shanghai, Shenzhen, Kobe, Sohar, Tauranga, Tianjin
King Abdullah Port, Algeciras, Antwerp, Auckland, Piraeus, Bremerhaven, Brisbane, Dammam, Damietta, Durban, Kaohsiung, Port of Hamad, Hamburg, Gioia Tauro, Le Havre, Lyttelton, Marsaxlokk, Mundra, Port Moresby, Melbourne, Jawaharlal Nehru, Qingdao, Genova, Shanghai, Shenzhen, Tianjin, Valencia
Table 2. The influence proportion of dominant ports on other ports’ resilience.
Dominant PortsPort Transmissibility
Influence Proportion
Port Diversity Influence Proportion
Singapore20.67%20.67%
Port Klang13.41%9.50%
Colombo3.91%2.23%
Rotterdam3.35%3.91%
Ambarli3.35%3.91%
Ningbo-Zhoushan3.35%2.79%
Busan2.23%1.68%
Tanjung Pelepas2.23%1.12%
Hong Kong1.68%1.12%
Table 3. Regional distribution of ports that are connected with vulnerable ports and stable ports.
PortsNumber of Connections in the Same RegionNumber of
Connections in
Different Regions
Stable ports
(Degree value is higher than 20)
Singapore953
Port Klang444
Colombo924
Jeddah623
Piraeus1112
Busan157
Tanjung Pelepas630
Rotterdam1016
Hong Kong1214
Jebel Ali917
Le Havre713
Ningbo-Zhoushan1610
Qingdao146
Port Said1512
Shanghai159
Shenzhen1412
Vulnerable portsAhus20
Abidjan10
Vigo01
Gothenburg20
General Santos10
Yangon01
Beira21
Penang11
Gdynia20
Kuching20
Lisbon11
Male Island21
Surabaya11
Subic Bay11
Townsville21
Publisher’s Note: MDPI stays neutral with regard to jurisdictional claims in published maps and institutional affiliations.

