Article

Storm Surge Forecasting along Korea Strait Using Artificial Neural Network

1
Geosystem Research Inc., Gunpo 15807, Korea
2
Korea Hydrographic and Oceanographic Agency, Busan 49111, Korea
*
Authors to whom correspondence should be addressed.
J. Mar. Sci. Eng. 2022, 10(4), 535; https://doi.org/10.3390/jmse10040535
Submission received: 7 March 2022 / Revised: 8 April 2022 / Accepted: 12 April 2022 / Published: 14 April 2022
(This article belongs to the Section Coastal Engineering)

Abstract

:
Typhoon attacks on the Korean Peninsula have recently become more frequent, and the strength of these typhoons is also gradually increasing because of climate change. Typhoon attacks cause storm surges in coastal regions; therefore, forecasts that enable advanced preparation for these storm surges are important. Because storm surge forecasts require both accuracy and speed, this study uses an artificial neural network algorithm suitable for nonlinear modeling and rapid computation. A storm surge forecast model was created for five tidal stations on the Korea Strait (southern coast of the Korean Peninsula), and the accuracy of its forecasts was verified. The model consisted of a deep neural network and convolutional neural network that represent the two-dimensional spatial characteristics. Data from the Global Forecast System numerical weather model were used as input to represent the spatial characteristics. The verification of the forecast accuracy revealed an absolute relative error of ≤5% for the five tidal stations. Therefore, it appears that the proposed method can be used for forecasts for other locations in the Korea Strait. Furthermore, because accurate forecasts can be computed quickly, the method is expected to provide rapid information for use in the field to support advance preparation for storm surges.

1. Introduction

Sea surface temperatures are gradually increasing as climate change accelerates because of global warming. Consequently, tropical cyclones (typhoons) are occurring more frequently in the northwestern Pacific Ocean, and their strength also shows an increasing trend [1]. As typhoon frequency increases, typhoon attacks on the coasts of the Korean Peninsula are increasing, and inundation damage is occurring frequently in coastal regions [2]. Coastal inundation damage occurred in 2003 because of Typhoon Maemi, which struck the Korean Peninsula, causing 30 deaths and 600 billion won in property damage [3]. Extensive damage to coastal regions has occurred because of typhoons attacking the Korean peninsula, such as Typhoon Bolaven (2012) and Typhoon Kong-Rey (2018), which were reported as severe disasters [4,5]. Such typhoon attacks on coastal regions result in storm surge phenomena caused by strong gusts, and are considered a cause of inundation damage. In particular, it is known that when typhoons coincide with flood tide periods, the sea surface water level increases by as much as 5–6 m, and extensive damage occurs, for example, the destruction of homes and seawalls [6,7].
As instances of such damage have attracted attention, typhoon storm surges have become a major research topic in studies of maritime disasters. Furthermore, these incidents have highlighted the importance of research into typhoon storm surge forecasting as a method of advance preparation to reduce damage [8,9,10]. Most studies on typhoon storm surge forecasting have been based on purely data-driven models, empirical formula models, or dynamic numerical models [8,11]. Early studies used statistical models to analyze the complex and nonlinear relationship between tropical cyclones and storm surges [12,13,14,15,16]. More recently, research has been performed using dynamic numerical models that use weather data and typhoon forecast information such as typhoon path, central pressure, and wind speed to obtain more accurate forecasts. Existing studies have been used to compute results, such as coastal inundation prediction maps, but their practical use is limited by their low reproducible resolution and high computational demands [17,18]. Furthermore, they have not clearly revealed the physical mechanisms behind typhoon storm surges, such as atmosphere/ocean interactions, and their ability to provide forecasts that represent the dynamic effects of typhoons [9,18,19]. Chen et al. [9] reported that the existing studies have a limitation to predict the storm surge since it involves complex interactions with the atmosphere and ocean at various scales. Moon et al. [18] also inferred that predicting typhoon-induced sea state requires very intensive computations because it should be accomplished by a full coupling between a typhoon model and a surface wave model.
Because of the limitations of methods used in existing studies, research based on artificial neural networks (ANNs) is being conducted [9]. Lee [20] confirmed the feasibility of short-term typhoon storm surge forecasting using a machine learning model. Subsequently, to obtain more accurate forecasts, studies were performed to find the optimal training conditions and parameters [21,22,23], and various artificial intelligence techniques such as support vector machines (SVMs) and recurrent neural networks (RNNs) have been used [10,24,25,26]. Di Nunno et al. [27] had a research for predicting the non-linear tidal time-series using Nonlinear Autoregressive Exogenous (NARX) neural network. A recent study by Eum et al. [10] confirmed the feasibility of long-term forecasting using typhoon storm surge data calculated by numerical modeling in a Long Short-Term Memory (LSTM) neural network. Because these models have obtained results more quickly and effectively than existing numerical hydraulic models, they have been able to highlight the usefulness of ANNs [9,10,24,28]. However, because they only use data from certain stations, they have not been able to represent spatial information such as typhoon path or radius of influence [29,30]. Furthermore, most studies have used only simple field observation data, even though a large amount of multi-source data is needed for accurate analysis when ANNs are used [9].
The effects of typhoon storm surge phenomena are known to vary from place to place [10]. The characteristics of the seas around the Korean Peninsula vary with location, and the effects of storm surges vary because of differences in typhoon path and radius of influence. Therefore, to obtain more accurate forecasts, it is necessary to represent spatial information that can be used to analyze geographical differences. Furthermore, to obtain stable results, a statistical basis for analyzing storm surge phenomena must be clearly presented [9]. This study targeted the Korea Strait and studied typhoon storm surge forecasting at five tidal stations (Busan, Geomundo, Tongyeong, Wando, and Yeosu). To create a typhoon storm surge forecast model, an ANN that combines a convolutional neural network (CNN) and deep neural network (DNN) was used. Data from a two-dimensional (2D) numerical weather model, rather than station-based time-series data, were used to represent spatial information. Results calculated by models are known to be more accurate when forecast data are used as training data [31]. Therefore, 2D numerical weather model data were used as the input, and spatially stable and accurate forecasts were computed.

2. Data and Methods

2.1. Study Area

The frequency and strength of typhoon attacks in the Korea Strait increase year by year, and the expected inundation damage is high. This area is located at the southernmost end of the Korean Peninsula along the Korea Strait, and storm surge forecasts for advance preparation are important. The Korea Strait was selected as the study area, and storm surge phenomena during typhoon attacks were predicted (Figure 1a). Typhoon storm surge forecast models were created for five tidal stations (Busan, Geomundo, Tongyeong, Wando, and Yeosu) on the Korea Strait (Figure 1b), and the forecasting results and the observation data at five tidal stations were used to verify the accuracy of the models.

2.2. Data

2.2.1. Typhoon Data

This study used past typhoon data provided by the Korea Meteorological Administration (KMA). The KMA provides data on developing typhoons, affecting typhoons, and landfalling typhoons in the northwestern Pacific Ocean, and this study used data on affecting typhoons and landfalling typhoons that directly affected the Korean Peninsula. Data from 39 typhoons over the past 10 years (2010–2019) were used, and the periods from typhoon impact to dissipation were calculated and selected as training periods for the typhoon storm surge prediction model. The variables in the typhoon data, including latitude, longitude, central pressure, maximum wind speed, gale radius, and moving speed, were used for data analysis to select the input variables for the typhoon storm surge forecast model (Table 1).

2.2.2. Observational Data from Tidal Stations

Tidal station data provided by the Ocean Data in Grid Framework of the Korea Hydrographic and Oceanographic Agency (KHOA) were used to select the training data for the typhoon storm surge forecast model and validate the model. The KHOA operates 48 tidal stations on coasts around the Korean Peninsula, and provides data on observed, harmonic, and residual tide levels, as well as data on air pressure, wind direction, and wind speed. The residual tide level refers to the difference between the observed and harmonic tide levels, and it indicates storm surges that occur during typhoon attacks. Five tidal stations on the Korea Strait (Busan, Geomundo, Tongyeong, Wando, and Yeosu) were used in this study; they were selected because it was possible to collect data from 2010 to 2019 for these stations (Figure 1b). First, the tidal station data were used to perform a statistical analysis to determine the training variables for the ANN. The observation data from the periods corresponding to the shortest and longest proximity distances between the five tidal stations and the typhoon were used in the statistical correlation analysis. Training data for the ANN model were selected on the basis of the correlation results of each variable component in the statistical analysis. The ANN model was validated by comparing and analyzing the forecasting results after training and the observed tide levels at each tidal station.

2.2.3. GFS Data

GFS numerical weather model data with a spatial resolution of 0.25° were used as the ANN training data to represent the 2D spatial characteristics. Data for a 10-day forecast period is provided by an early global forecast system operated four times daily by the U.S. National Oceanic and Atmospheric Administration. Weather data with spatial information were used in the typhoon storm surge forecast model (Figure 1a and Figure 2). The ANN training variables were selected according to the results of a correlation analysis using tidal station data. Weather elements such as air pressure, u and v components of wind speed, and wind direction were used as training variables. The GFS data for the typhoon period (2010–2019, where the time interval for forecast data is 3 h) were parsed and used (Figure 2 and Table 2).

2.3. Method

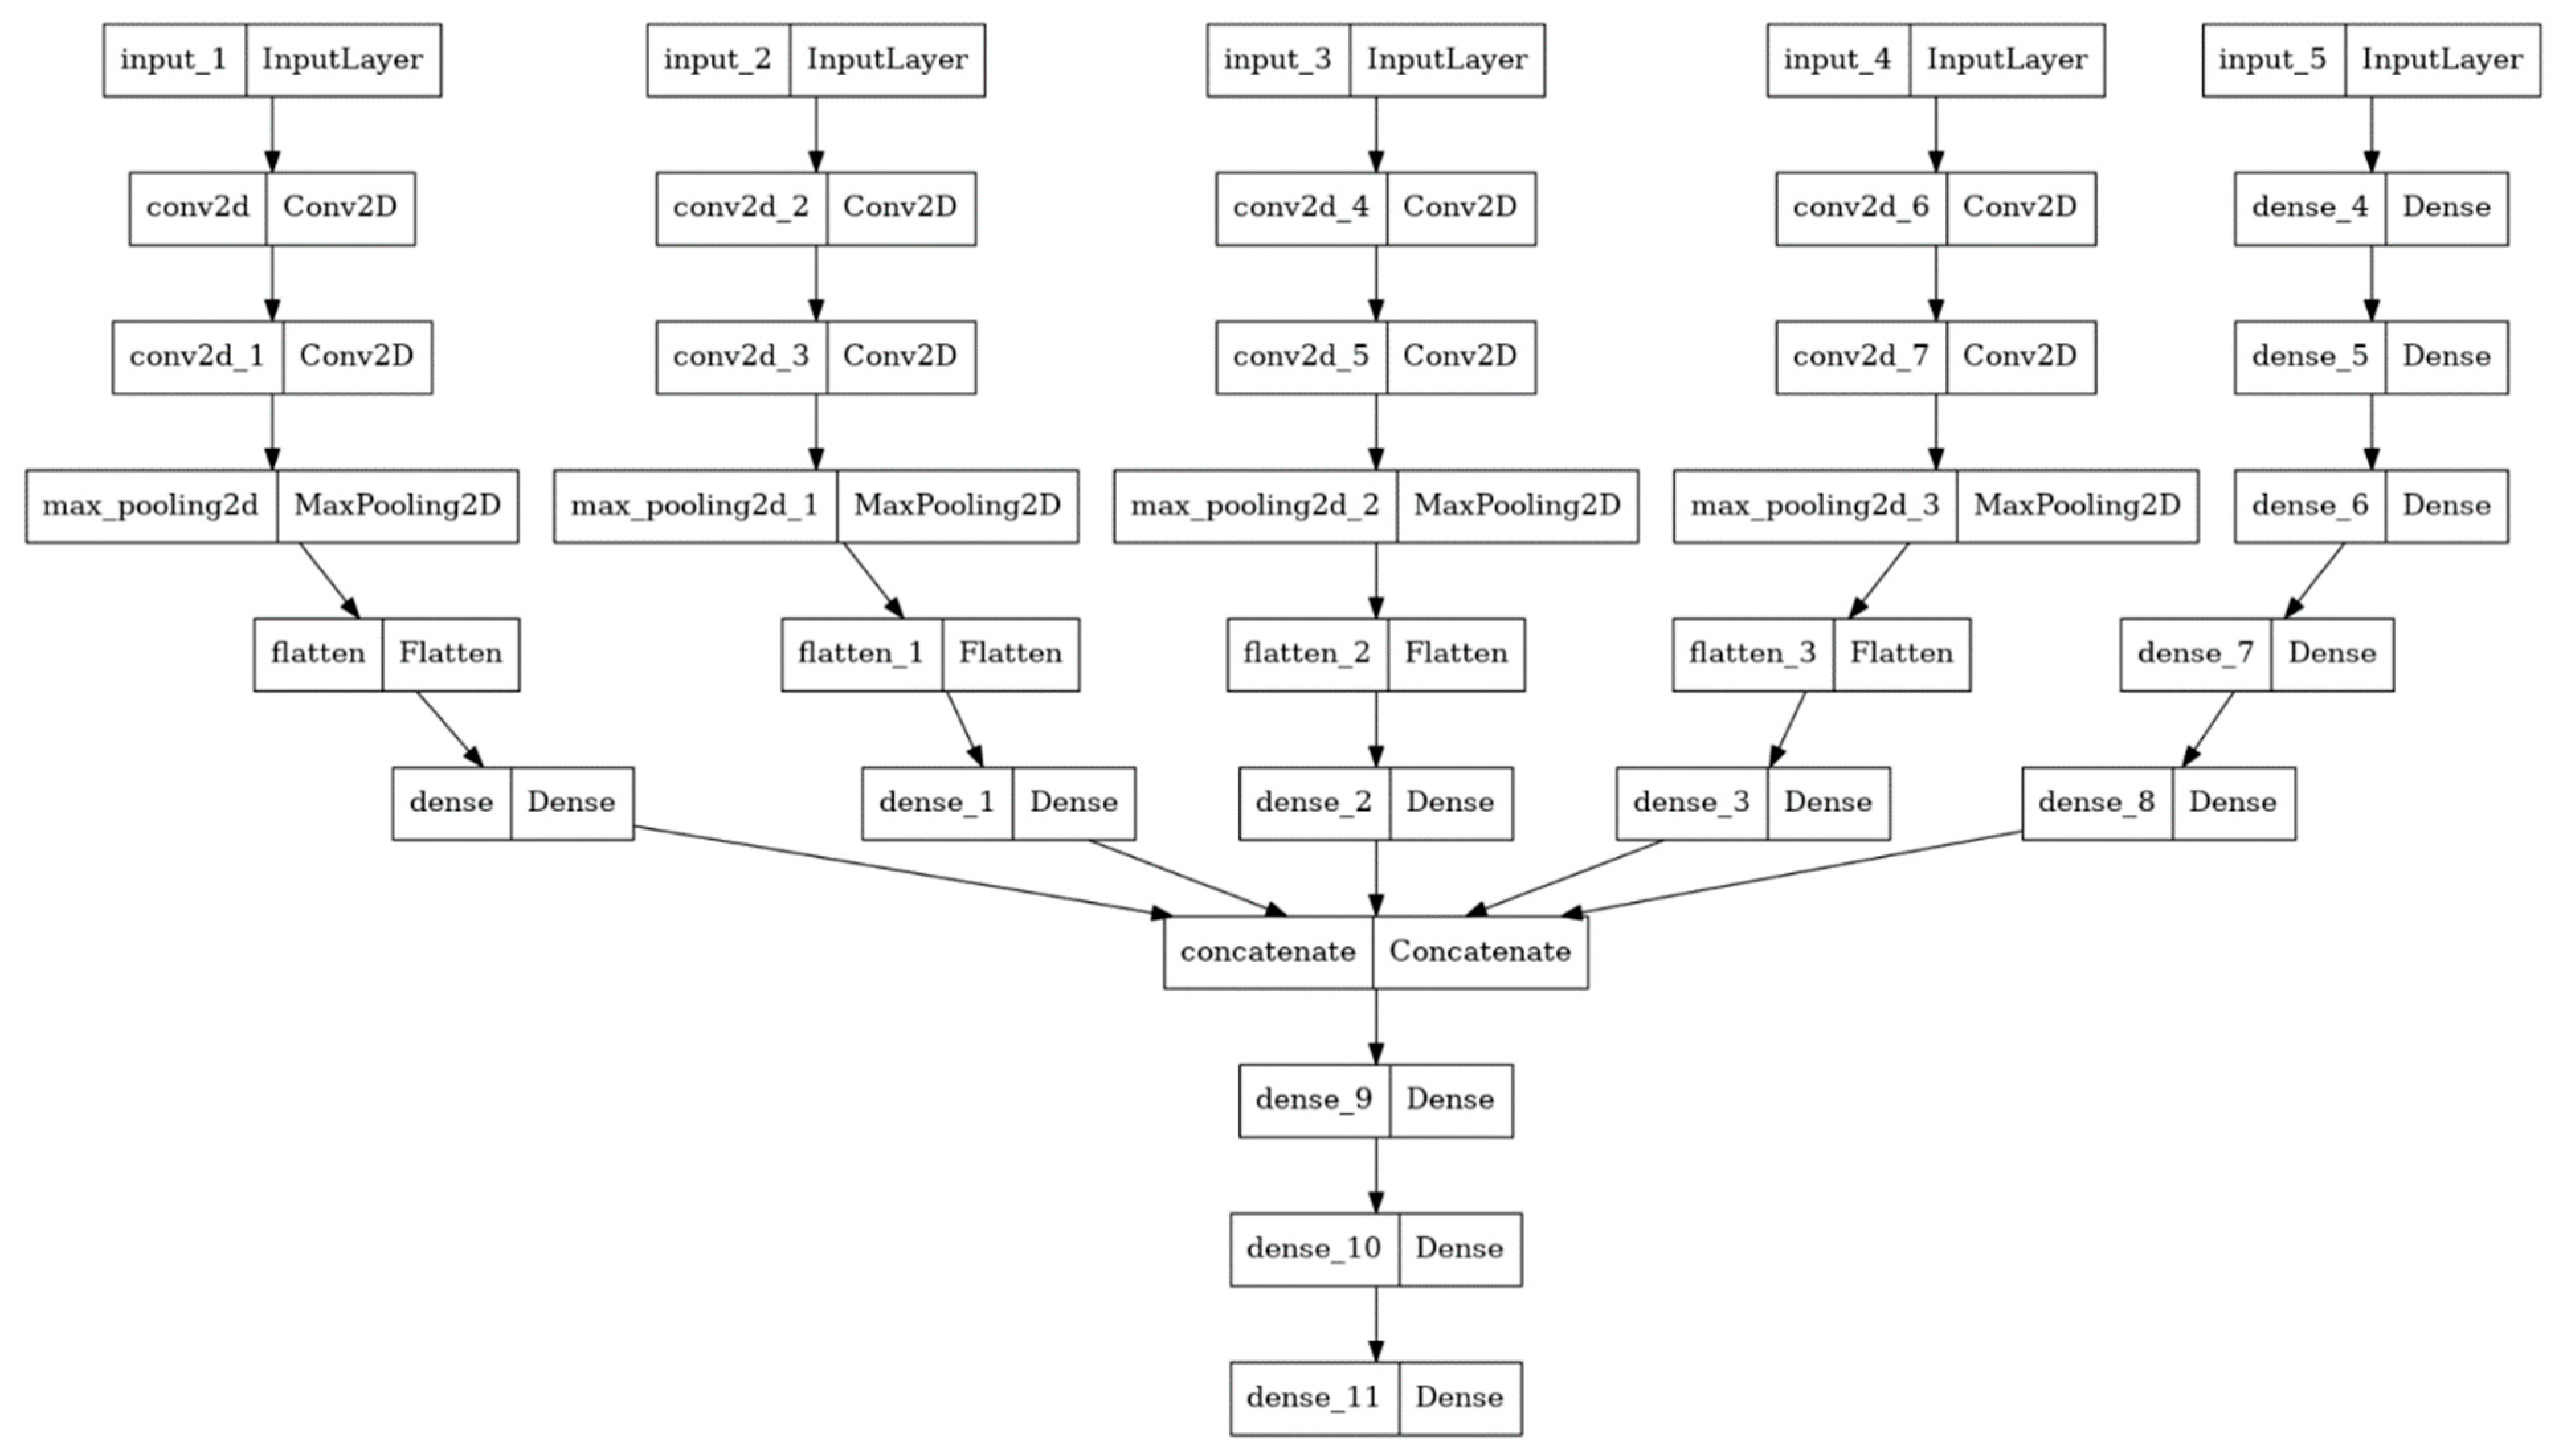
ANN Training for Storm Surge Forecasting

The air pressure, wind speed, wind direction, and air temperature in the GFS data and harmonic tide levels for each tidal station were used as input variables in the training data to create the typhoon storm surge forecast model. The data included 2438 items, and 2278 items were used to train the model, excluding the 166 test dataset for validating the final model [Chaba (2016) and Kong-Rey (2018)] which is the independent dataset not involved in training at all. Of the 2278 data, 2050 were used as the training dataset for training the model, and the remaining 228 data were used as the validation dataset for validating the training process. The residual tide levels obtained by subtracting the harmonic tide levels from the observed tide levels at the five tidal stations were used as the ground truth. The forecast period of the ANN model consisted of eight days for which it was possible to obtain GFS data, and the typhoon storm surge forecast time interval (Δt) was 3 h, which is the same as that of the GFS data. As 2D spatial data, the GFS data were used for regarding the storm surge phenomena and spatial characteristics such as typhoon path, strength, and surrounding environment. The typhoon storm surge forecast model was created by combining a CNN– an ANN algorithm used to update the weight values of the spatial characteristics of 2D data–and a DNN to incorporate station-based data (Figure 3). In addition, the hyperbolic tangent and ReLU functions were combined and used as the activation functions of the input layer and hidden layer to well represent typhoon events, and a linear function was used as the activation function of the output layer. Adam was used as the model optimizer to perform training. All variables of input and output data were used after normalization in the progress of training. In the forecasting process, the GFS forecast data and harmonic tide level data for the corresponding times in the fully trained model were preprocessed, and the results were calculated by inputting the data into the model. Then, the forecasts (240 h, 3 h intervals) were calculated by postprocessing (Figure 4).

3. Results

3.1. Data Correlation
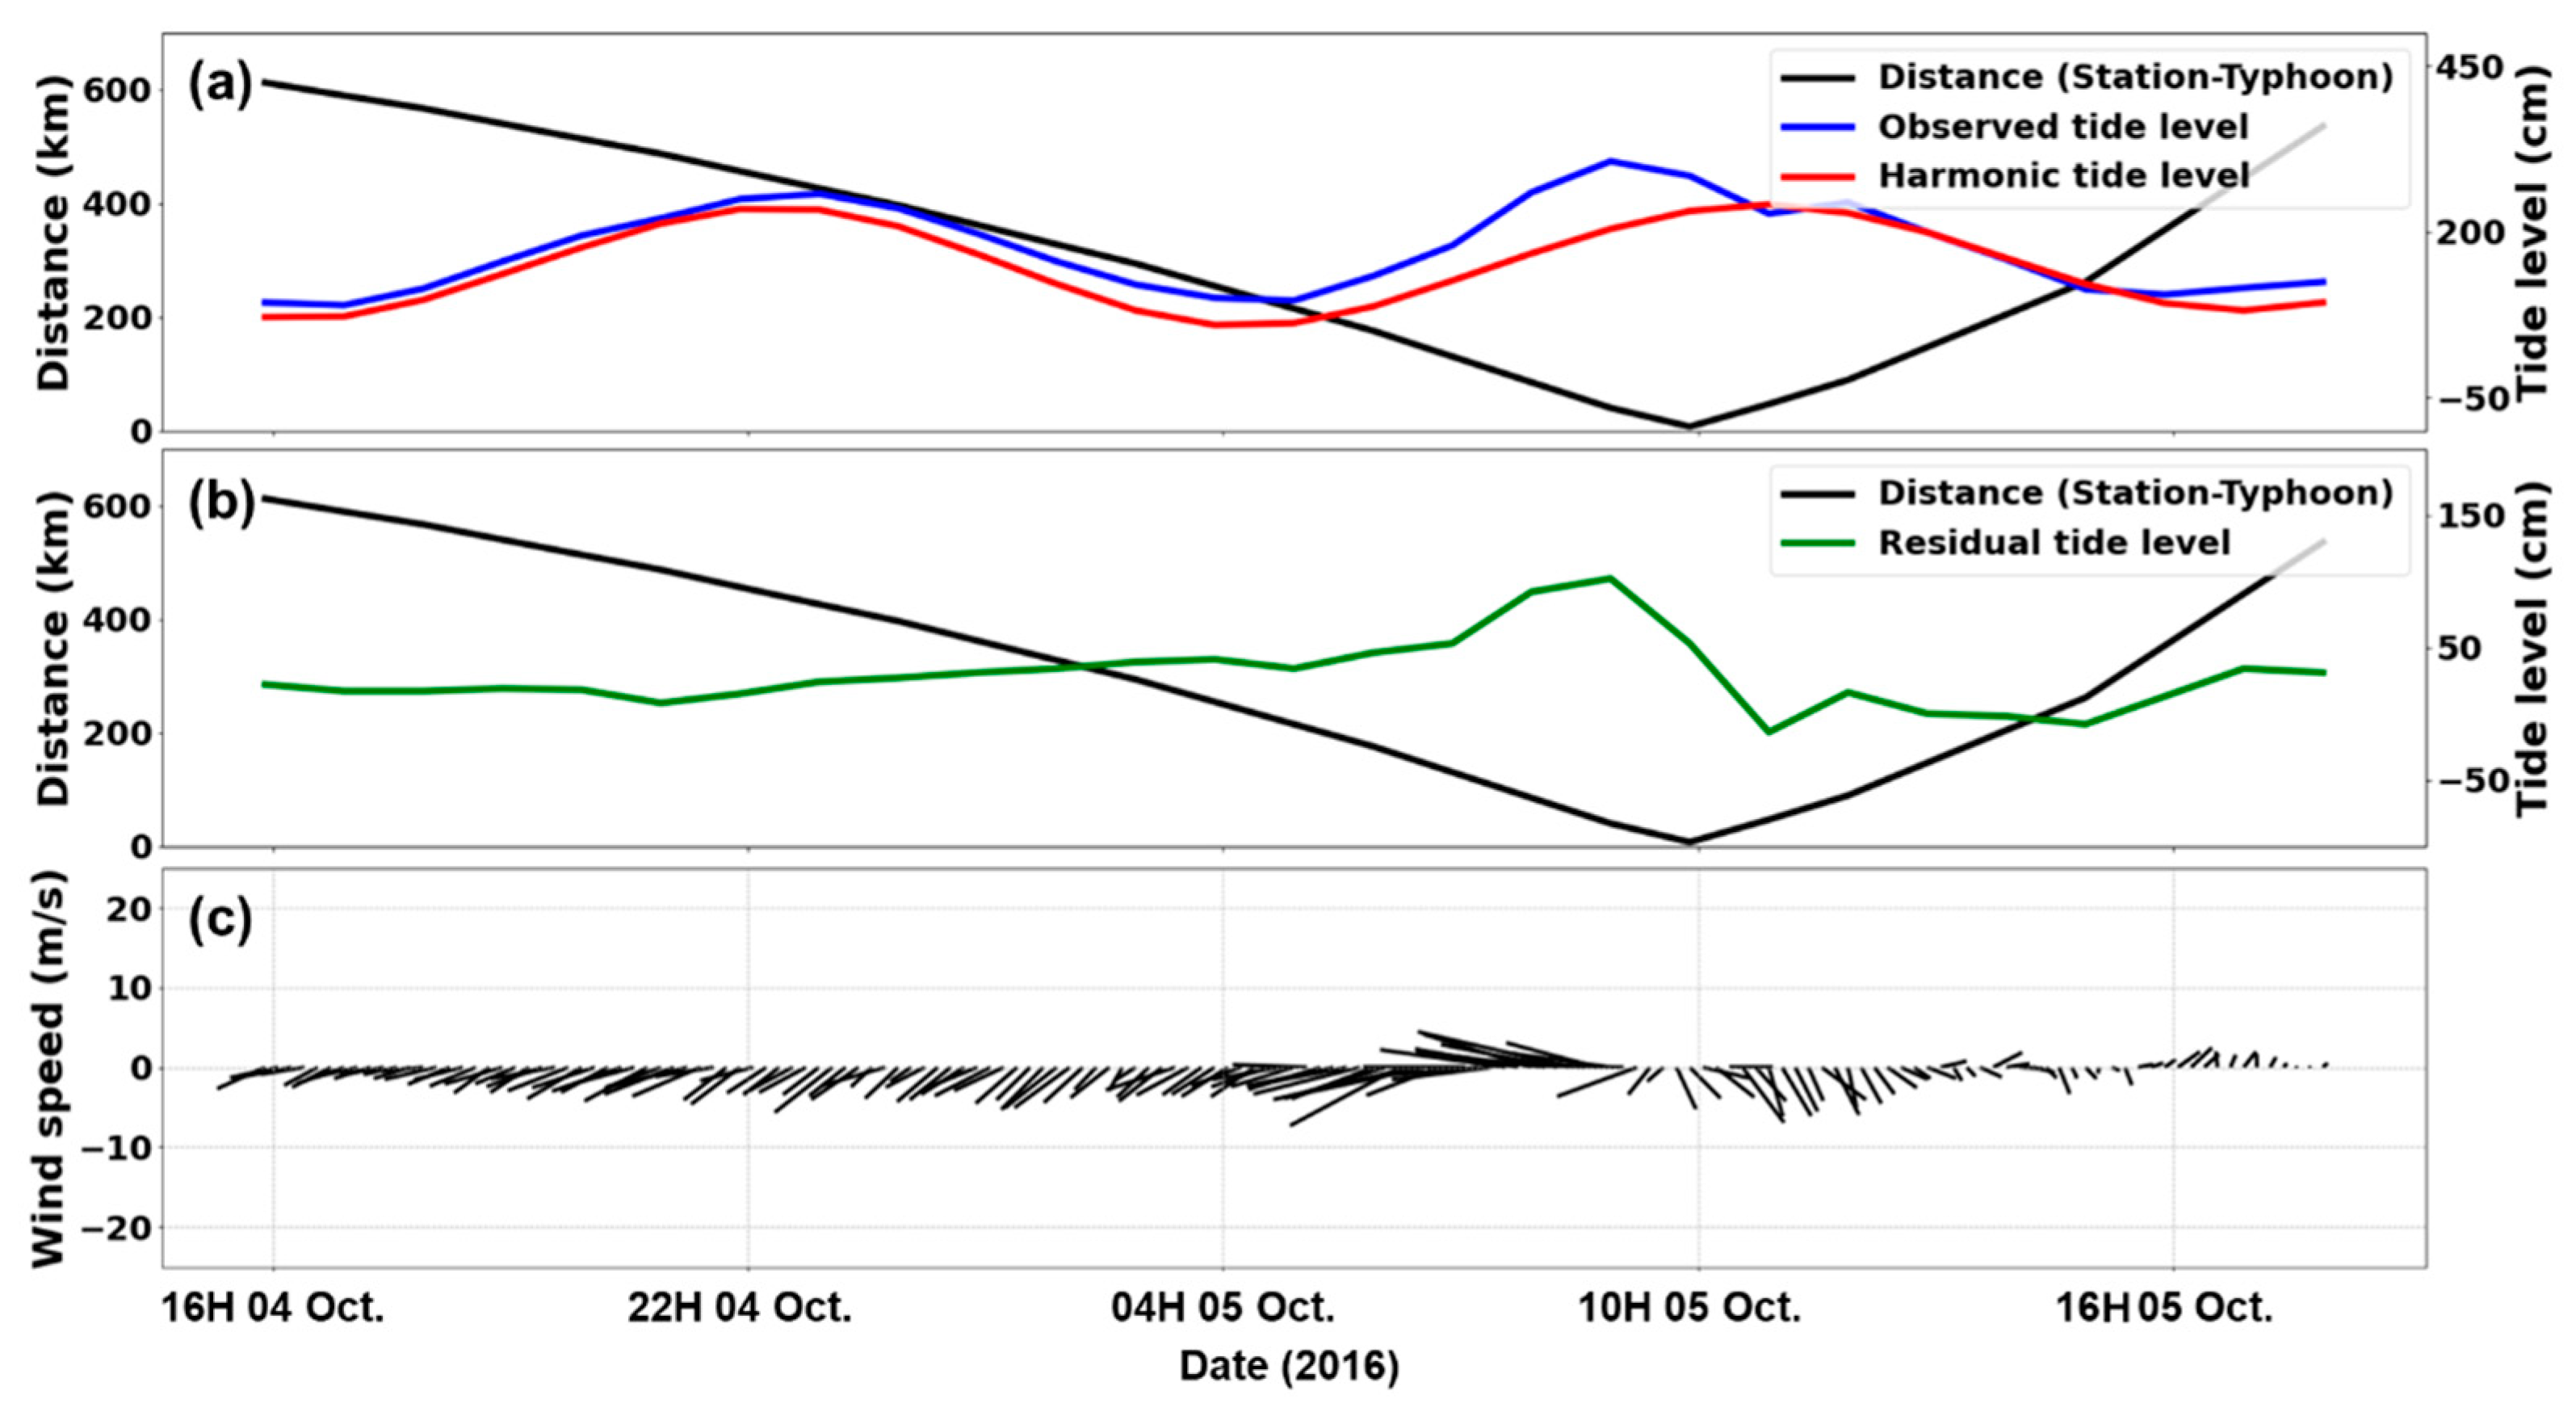
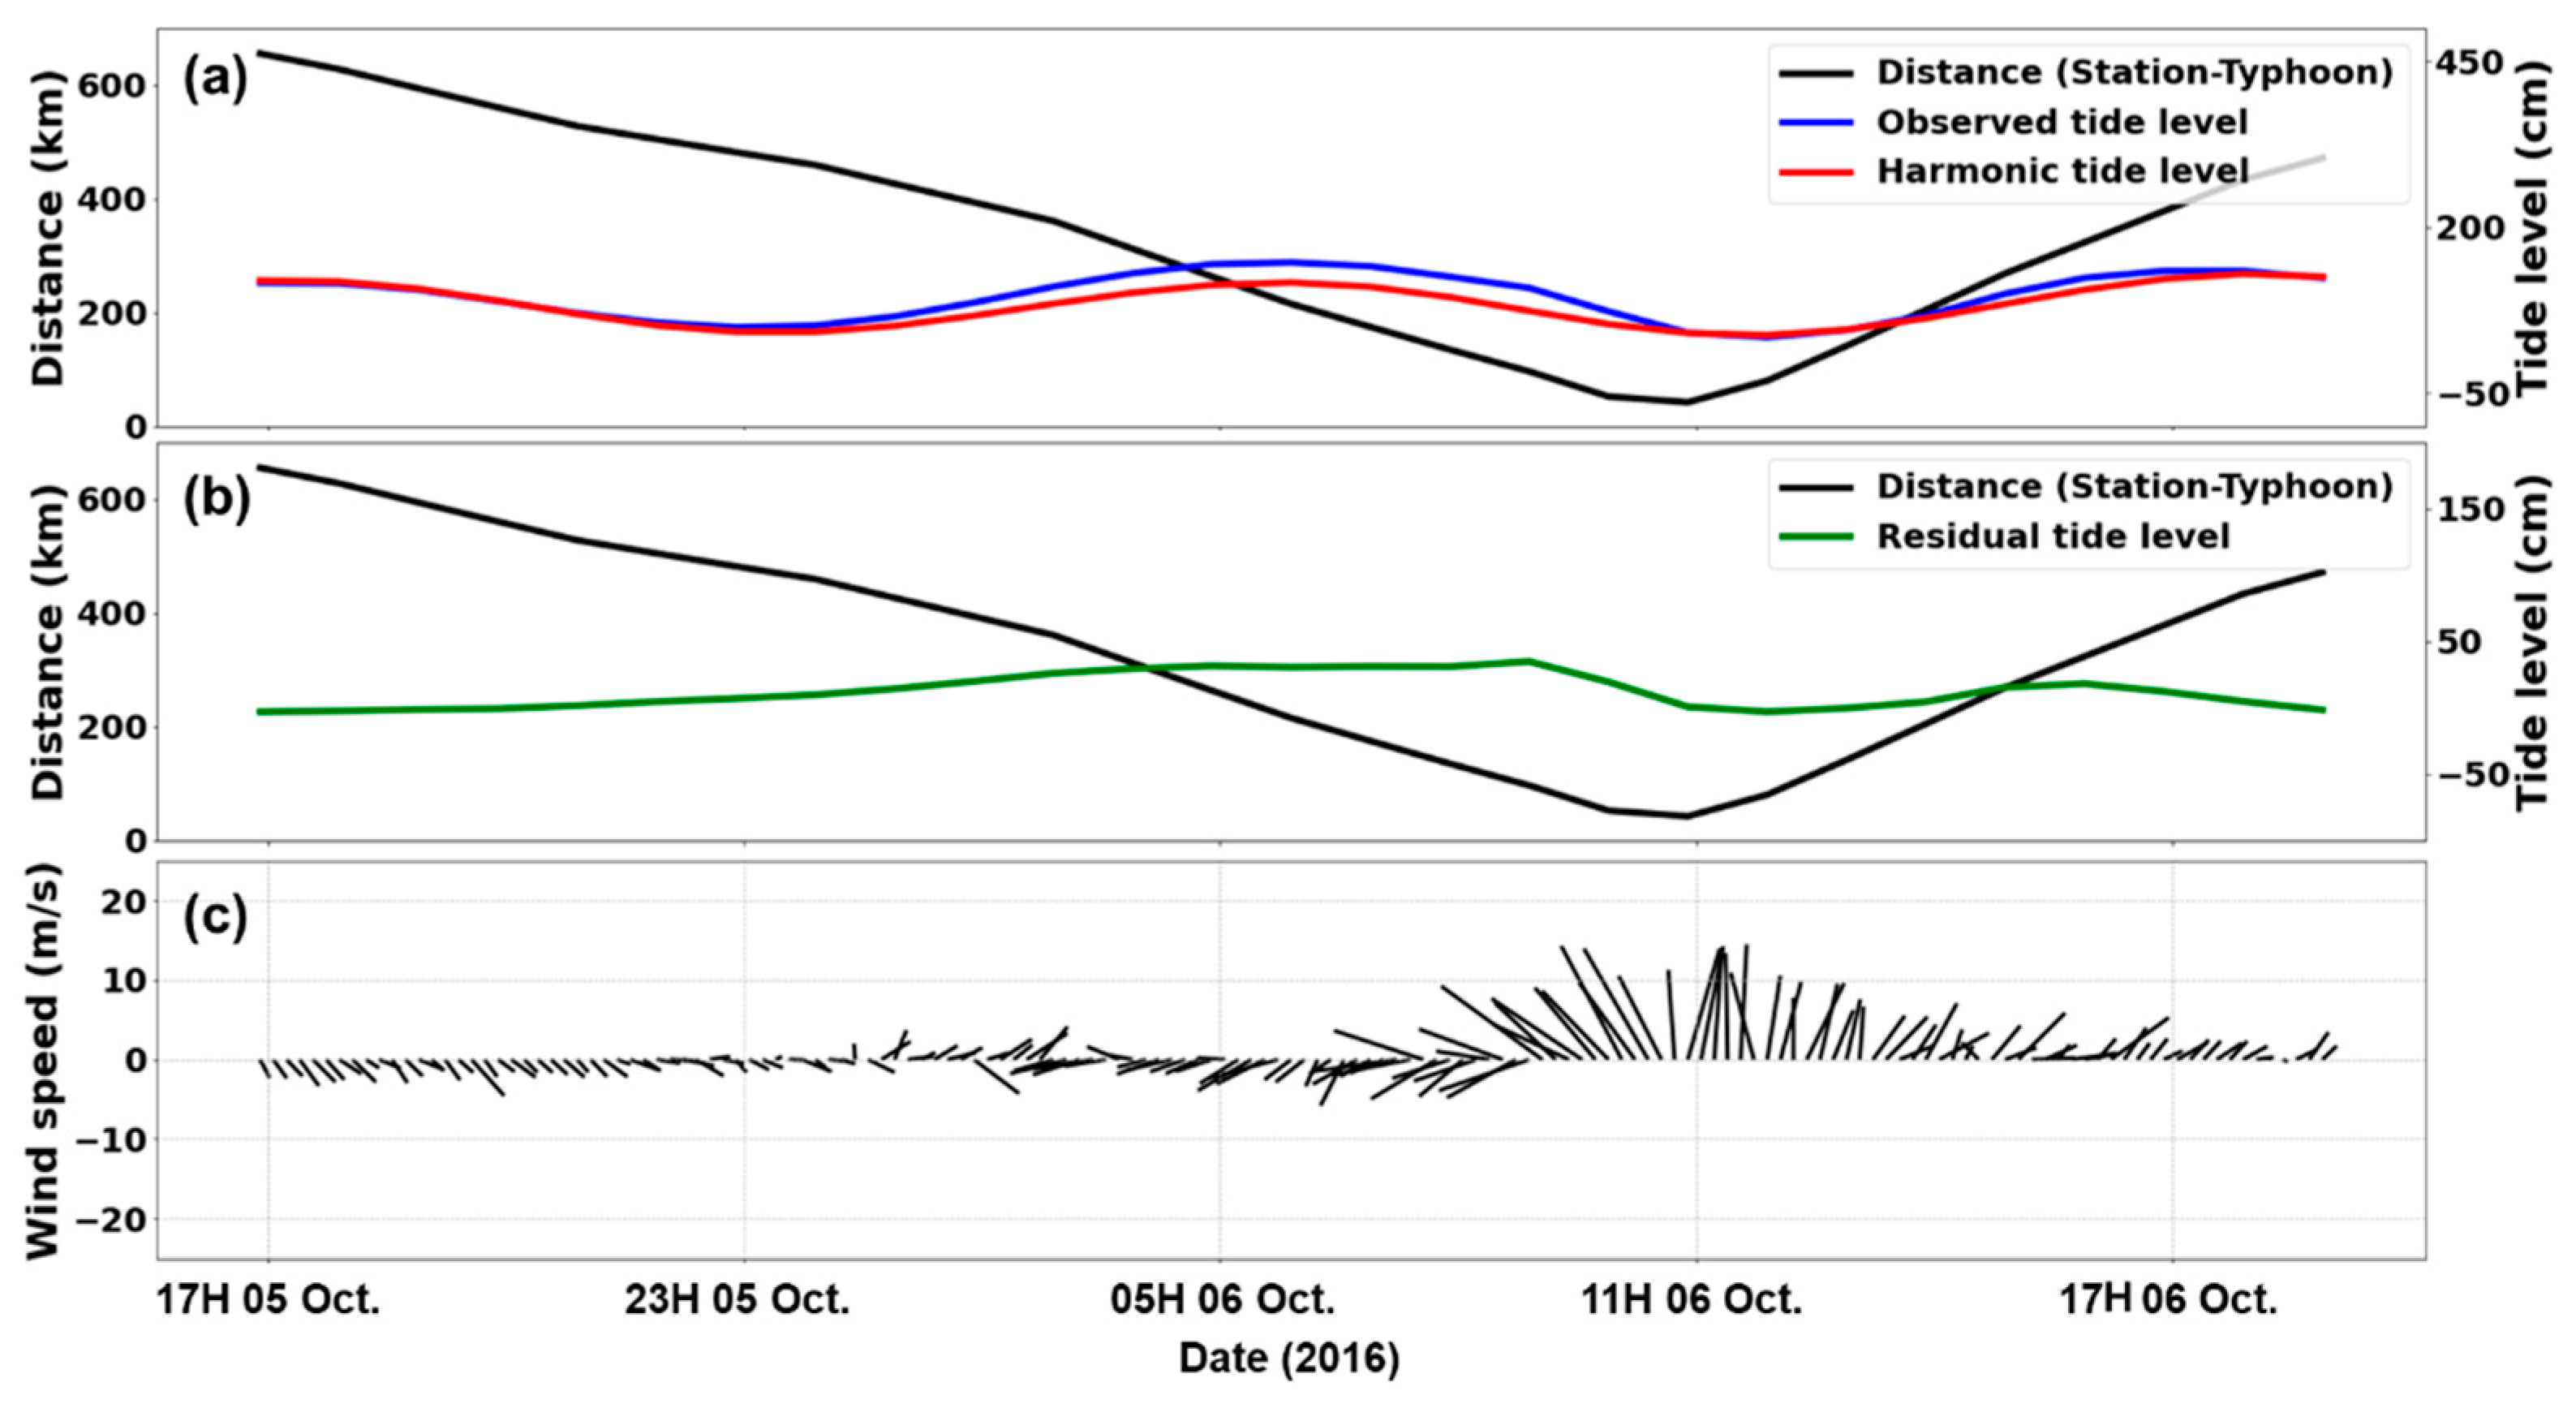
Typhoon storm surge phenomena have complex correlations with several variables, and a thorough examination of the effects of each variable is needed for a clear analysis. Furthermore, to compute ANN-based forecasts, the estimation of the variables that are likely to affect typhoon storm surges is important during model training for increasing the forecast accuracy. That is, it is important to understand the mechanism of each of the variables in regard to typhoon storm surge phenomena, and to use these variables in ANN training accordingly. Here, the complex correlations were first studied by statistically analyzing the typhoon storm surge phenomena and each of the variables (Table 3). Figure 5 shows the weather data observed at the five tidal stations and the residual components used to analyze their correlations with typhoon storm surge phenomena. Data from 39 typhoons that attacked the Korean Peninsula from 2010 to 2019 were used to calculate the distance of affecting area from the typhoon center to each tidal station, and the data from each tidal station for each time period were compared to determine the correlations. As the distance from each tidal station to the typhoon’s area of influence decreased, the air pressure decreased (slope, 0.023), and the residual tide level increased (slope, −0.044) (Figure 5a,c,e,g,i). In particular, the correlation between air pressure and the residual component was negative (R = −0.20) at all five tidal stations. This result shows that the water level increased because of the effect of air pressure as the typhoon (i.e., tropical cyclone) attacked. Figure 5b,d,f,h,j show the distance of each tidal station from the typhoon’s area of influence and the wind speed and residual tide level. As the typhoon approached, the wind speed (slope, −0.009) and residual tide level increased. Overall, the five tidal stations had similar correlations, but the variability between the wind speed and residual component was not clear, in contrast to the variability between the air pressure and residual component. The reason is thought to be that the effect of wind speed is not independent, and it exerts a complex effect in combination with other factors. Although the correlations at each tidal station were similar, other differences in variability appeared. These differences occur because the factors affect typhoon storm surge phenomena to different degrees at each observation station; thus, it is necessary to consider spatial information.
The effects of wind direction and tide levels were confirmed to have complex effects in combination with wind speed. Figure 6, Figure 7, Figure 8, Figure 9, Figure 10, Figure 11, Figure 12, Figure 13, Figure 14 and Figure 15 show time-series of the observed tide level, forecast tide level, residual component, wind speed, and wind direction at each tidal station for two typhoons that recently attacked the Korean Peninsula and caused extensive damage [Chaba (2016) and Kong-Rey (2018)]. To obtain the distance between the typhoon center and each tidal station, the distance from the area of influence was calculated according to KMA standards, and it is shown as a time-series with the tidal station data from the same time period. As shown in Figure 6, Figure 7, Figure 8, Figure 9, Figure 10, Figure 11, Figure 12, Figure 13, Figure 14 and Figure 15, the variability of the residual component varied with distance to the typhoon center. This result illustrates storm surge phenomena due to the typhoon attack. Similar variability patterns generally occurred at the five tidal stations. However, differences were found in the time periods of the effects caused by the typhoons at each tidal station. When Typhoon Chaba attacked, the typhoon effects at the Busan, Tongyeong, and Yeosu tidal stations were reflected in advance, and the residual component increased (Figure 6, Figure 8 and Figure 10), but there were no large temporal differences at the Geomundo and Wando tidal stations (Figure 7 and Figure 9). A similar difference also appeared when Typhoon Kong-Rey attacked (Figure 11, Figure 12, Figure 13, Figure 14 and Figure 15). In each typhoon time period, the tide level characteristics were different at each tidal station, and these differences are attributed by the differences in distance from the typhoon center. Regarding the relationship with wind speed and wind direction, the residual component shows a larger increase when southerly winds were stronger because of the typhoon attack (Figure 11, Figure 13, Figure 14 and Figure 15). During the attack by Typhoon Kong-Rey, a high residual component appeared during southerly winds at the Wando tidal station (Figure 14). In contrast, regarding the effects of wind speed and wind direction, the affected time periods at the tidal stations also differed. At the Tongyeong, Wando, and Yeosu tidal stations during the attack of Typhoon Chaba, the differences are attributed to differences in how the southerly wind was reflected in advance and the residual component increased. These results show that the wind speed, wind direction, and tide level factors of typhoon storm surges differed with location, and each factor exerted a complex effect rather than being independent. That is, various factors have a complex effect on typhoon storm surge phenomena, and it is necessary to represent spatial information in the model. The data needed for ANN training were selected accordingly.

3.2. Model Results

The accuracy of the typhoon storm surge forecast model was validated at five points during the attacks of typhoons Chaba (2016) and Kong-Rey (2018). Figure 16 and Figure 17 show the harmonic, observed, and predicted tide levels for the two typhoon time periods as time-series. The seawater level periodicity and storm surge phenomena during the typhoon attacks were modeled well overall. In particular, the storm surge phenomena that occurred in conjunction with flood tide periods were modeled similarly to the observed tide levels. In addition, the modeled seawater level increase caused by typhoon attack during the ebb tide period was also consistent with the actual tide level (Figure 16b,d). The storm surge occurrence time periods were found to be accurately divided and modeled, although each of the five tidal stations had different results. Table 4 shows performance indices for the storm surge forecasting results at the five tidal stations, which were calculated as the absolute error, absolute relative error, and root mean square error (RMSE). The absolute deviation is the difference between the predicted tide level and observed tide level at the time of maximum residual tide level, and the absolute relative error is the absolute deviation ratio of the observed tide level. The relative deviation at the Tongyeong and Wando tidal stations during the Chaba (2016) attack period was more than 15%, whereas the other tidal stations showed relative deviations of 5% or less. When Typhoon Kong-Rey attacked, all five tidal stations showed a relative deviation of 5% or less. The RMSE was 15 cm or less at all tidal stations. Table 5 shows accuracy evaluation results, which are calculated using residual tide levels and predicted residual tide levels. Overall, it shows the correlation between 0.7 and 0.9, and it is confirmed that the model could be possible to predict the residual tide level similarly with the observed tide level.

4. Discussion

Because storm surge phenomena during typhoon attacks cause extensive damage to coastal regions, their prediction is important. Furthermore, the frequency of typhoon attacks is gradually increasing, and the rapid computation of highly accurate forecasts is crucial. Highly accurate results have been computed in previous studies using high-performance numerical models. However, computation is time-consuming and requires considerable computing resources. Moreover, because typhoon storm surge phenomena have complex correlations with several variables, it is difficult to take all mechanisms into account in analysis and forecasting. Therefore, this study aimed to compute results more quickly using several variables as ANN training data.
First, a correlation analysis was performed by comparing various weather factors and typhoon storm surge phenomena. The results showed that the factors had complex effects rather than clear individual effects. In particular, it was possible to confirm correlations between factors such as typhoon path and distribution, and it was found that forecasts that represent spatial characteristics are needed. Therefore, this study used the air pressure, wind speed, wind direction, and air temperature from the GFS numerical weather model as training data to represent spatial characteristics. Although air pressure, wind speed, and wind direction data have been used in previous studies, this study also used air temperature data as additional training data in an attempt to consider the effect of ocean volume.
The harmonic tide levels used as training data were time-series data that were predicted using the summation of tidal constituents. Therefore, because of the properties of ANN series models, there are limitations on the training of a series of neural networks together with 2D array data from GFS. In particular, storm surge phenomena resulting from typhoons are strongly affected by tides; therefore, training is strongly affected by periodic components. This problem occurs because the harmonic tide levels have a larger effect than other data in the updating of the ANN weight values, which causes bias. Therefore, this study created an independent ANN model for each type of training data, and it used a mixed model that employed ANNs suitable for the properties of the data.
A neural network designed to serve as the forecast model was created by combining a CNN and DNN, in contrast to previous studies, which used RNNs. A recent RNN-based study found that relatively accurate forecasts were obtained using an LSTM model [32]. However, differences in the forecast performance appeared at all points. By contrast, this study, which used a CNN to represent spatial data during training, revealed that there were almost no differences between tidal stations. In the evaluation of typhoon storm surge forecasting, an absolute relative error of 10% or less is usually considered to indicate accurate modeling [10]. The forecasts obtained in this study had an absolute relative error of less than 5% overall, indicating that the model is capable of highly accurate typhoon storm surge forecasting. In addition, even though the times at which storm surges occurred and the tidal periods were different at each tidal station, the forecast model was very similar to the actual tide levels overall. The reason is thought to be that the forecast model properly considered spatial characteristics during training, and it seemed to model complex interactions with various factors via training. The fact that there were no large differences between the forecasting results at each tidal station suggests that the forecast model can be used satisfactorily to make forecasts at other stations.
The GFS numerical weather model data that were used as the training data have a low spatial resolution of 0.25°; therefore, the ability to model local weather characteristics is limited. However, it was possible to calculate highly accurate storm surge forecasts. As the frequency of typhoons that attack in succession is steadily increasing, it will be necessary for later studies to adjust the forecast time interval precisely. GFS numerical weather model data were used in this study, but it is expected that better modeling results can be obtained in future studies if data with finer temporal resolution are used for training.
A recent study by Di Nunno et al. [33] confirmed that the influence of previous observation data remained and implicitly affected the prediction in the case of absence of meteorological parameters. Therefore, this study focused on weather data to create a storm surge forecast model. However, it is thought that future studies must represent ocean time. In particular, as there are distinct differences in water temperature distributions and water mass characteristics from place to place, it is thought that representing these properties is important for accurate forecasting results. For the Korean Peninsula, typhoon attacks are not limited to the southern coast but also affect the Yellow Sea and East Sea; therefore, it is important to expand the study area in which typhoon storm surges are predicted. In future research, it will be necessary to first conduct studies in which the features of regional sea are distinguished, and it is expected that much improved results can be obtained by creating forecast models based on the method proposed in this study. Furthermore, it is challengeable whether a hypothetically predicted typhoon can produce the surge model much more accurately in the case of actual typhoon. It is necessary to study how accurately reproducible results when the predicted typhoon is used for training. It is expected to optimize the weight of training model much more clearly.
The rapid and accurate computation of typhoon storm surge forecasts is considered to be a crucial factor in responding to coastal disasters. Because the proposed method offers a forecast model that uses ANNs, it can rapidly compute accurate forecasts. Therefore, it is judged to be sufficiently effective as part of a storm surge forecasting system. Furthermore, it is expected to provide useful information when applied in the operational field for advance preparation.

Author Contributions

Conceptualization, Y.P., E.K. and Y.C.; methodology, software, validation, and formal analysis, Y.P.; investigation and resources, G.S., Y.K. and H.K.; writing—original draft preparation, E.K.; writing—review and editing, Y.P., E.K. and Y.C.; visualization, Y.P. and E.K.; supervision, Y.C. and Y.K. All authors have read and agreed to the published version of the manuscript.

Funding

This research was funded as a part of the 2019 projects entitled “Accuracy Improvement of Ocean Prediction Using Observed Data” funded by the Korea Hydrographic and Oceanographic Agency (Tender notice of Busan Regional Public Procurement Service: 20190615429-00).

Informed Consent Statement

Not applicable.

Data Availability Statement

In this paper, the typhoon data was provided by “Korea Meteorological Administration (KMA)” at http://www.weather.go.kr (accessed on 31 January 2022). The tidal station data was provided by “Korea Hydrographic and Oceanographic Agency (KHOA)” at http://www.khoa.go.kr (accessed on 31 January 2022). The GFS weather numerical model data was provided by “U.S. National Oceanic and Atmospheric Administration (NOAA)”. Informed consent was obtained from all subjects involved in this study. Written informed consent has been obtained from the patient(s) to publish this paper. Thanks for providing to complete this study.

Acknowledgments

This paper was consented by all authors. Thanks for all supports to complete this paper.

Conflicts of Interest

The authors declare no conflict of interest.

References

  1. Chan, J.C.; Liu, K.S. Global warming and western North Pacific typhoon activity from an observational perspective. J. Clim. 2004, 17, 4590–4602. [Google Scholar] [CrossRef]
  2. Seo, S.N.; Kim, S.I. Storm surges in West Coast of Korea by typhoon Bolaven (1215). J. Korean Soc. Coast. Ocean Eng. 2014, 26, 41–48. [Google Scholar] [CrossRef]
  3. Chun, J.Y.; Lee, K.H.; Kim, J.M.; Kim, D.S. Inundation analysis on coastal zone around Masan Bay by Typhoon Maemi (No. 0314). J. Ocean Eng. Technol. 2008, 22, 8–17. [Google Scholar]
  4. Ku, H.; Maeng, J.H.; Cho, K. Deterministic estimation of typhoon-induced surges and inundation on Korean coastal regions. J. Korean Soc. Coast. Ocean Eng. 2019, 31, 1–8. [Google Scholar] [CrossRef]
  5. Kim, H.; Suh, S. Estimation of frequency of storm surge heights on the west and south coasts of Korea using synthesized typhoons. J. Korean Soc. Coast. Ocean Eng. 2019, 31, 241–252. [Google Scholar] [CrossRef] [Green Version]
  6. Hubbert, G.D.; Holland, G.J.; Leslie, L.M.; Manton, M.J. A real-time system for forecasting tropical cyclone storm surges. Weather Forecast. 1991, 6, 86–97. [Google Scholar] [CrossRef] [Green Version]
  7. Kim, D.S.; Kim, J.M.; Lee, G.H.; Lee, S.D. Inundation analysis considering water waves and storm surge in the coastal zone. J. Ocean Eng. Technol. 2007, 21, 35–41. [Google Scholar]
  8. Needham, H.F.; Keim, B.D.; Sathiaraj, D. A review of tropical cyclone-generated storm surges: Global data sources, observations, and impacts. Rev. Geophys. 2015, 53, 545–591. [Google Scholar] [CrossRef]
  9. Chen, R.; Zhang, W.; Wang, X. Machine learning in tropical cyclone forecast modeling: A review. Atmosphere 2020, 11, 676. [Google Scholar] [CrossRef]
  10. Eum, H.S.; Park, J.J.; Jeong, K.Y.; Park, Y.M. Prediction of storm surge height using synthesized typhoons and artificial intelligence. J. Korean Soc. Mar. Environ. Saf. 2020, 26, 892–903. [Google Scholar] [CrossRef]
  11. Tadesse, M.; Wahl, T.; Cid, A. Data-driven modeling of global storm surges. Front. Mar. Sci. 2020, 7, 260. [Google Scholar] [CrossRef] [Green Version]
  12. DeMaria, M.; Kaplan, J. A statistical hurricane intensity prediction scheme (SHIPS) for the Atlantic basin. Weather Forecast. 1994, 9, 209–220. [Google Scholar] [CrossRef]
  13. DeMaria, M.; Kaplan, J. An updated statistical hurricane intensity prediction scheme (SHIPS) for the Atlantic and eastern North Pacific basins. Weather Forecast. 1999, 14, 326–337. [Google Scholar] [CrossRef]
  14. DeMaria, M.; Mainelli, M.; Shay, L.K.; Knaff, J.A.; Kaplan, J. Further improvements to the statistical hurricane intensity prediction scheme (SHIPS). Weather Forecast. 2005, 20, 531–543. [Google Scholar] [CrossRef] [Green Version]
  15. Lee, C.Y.; Tippett, M.K.; Camargo, S.J.; Sobel, A.H. Probabilistic multiple linear regression modeling for tropical cyclone intensity. Mon. Weather Rev. 2015, 143, 933–954. [Google Scholar] [CrossRef]
  16. Wang, Y.; Rao, Y.; Tan, Z.M.; Schönemann, D. A statistical analysis of the effects of vertical wind shear on tropical cyclone intensity change over the western North Pacific. Mon. Weather Rev. 2015, 143, 3434–3453. [Google Scholar] [CrossRef]
  17. Bender, M.A.; Ginis, I.; Kurihara, Y. Numerical simulations of tropical cyclone-ocean interaction with a high-resolution coupled model. J. Geophys. Res. Atmos. 1993, 98, 23245–23263. [Google Scholar] [CrossRef]
  18. Moon, I.J.; Ginis, I.; Hara, T.; Thomas, B. A physics-based parameterization of air–sea momentum flux at high wind speeds and its impact on hurricane intensity predictions. Mon. Weather Rev. 2007, 135, 2869–2878. [Google Scholar] [CrossRef] [Green Version]
  19. Ma, L.M. Research progress on China typhoon numerical prediction models and associated major techniques. Prog. Geophys. 2014, 29, 1013–1022. [Google Scholar]
  20. Lee, T.L. Back-propagation neural network for the prediction of the short-term storm surge in Taichung harbor, Taiwan. Eng. App. Artif. Intell. 2008, 21, 63–72. [Google Scholar] [CrossRef]
  21. Lee, T.L. Predictions of typhoon storm surge in Taiwan using artificial neural networks. Adv. Eng. Softw. 2009, 40, 1200–1206. [Google Scholar] [CrossRef]
  22. Kim, S.; Matsumi, Y.; Pan, S.; Mase, H. A real-time forecast model using artificial neural network for after-runner storm surges on the Tottori coast, Japan. Ocean Eng. 2016, 122, 44–53. [Google Scholar] [CrossRef]
  23. Kim, S.; Pan, S.; Mase, H. Artificial neural network-based storm surge forecast model: Practical application to Sakai Minato, Japan. Appl. Ocean Res. 2019, 91, 101871. [Google Scholar] [CrossRef]
  24. Rajasekaran, S.; Gayathri, S.; Lee, T.L. Support vector regression methodology for storm surge predictions. Ocean Eng. 2008, 35, 1578–1587. [Google Scholar] [CrossRef]
  25. Kim, S.W.; Melby, J.A.; Nadal-Caraballo, N.C.; Ratcliff, J. A time-dependent surrogate model for storm surge prediction based on an artificial neural network using high-fidelity synthetic hurricane modeling. Nat. Hazards 2015, 76, 565–585. [Google Scholar] [CrossRef]
  26. Hashemi, M.R.; Spaulding, M.L.; Shaw, A.; Farhadi, H.; Lewis, M. An efficient artificial intelligence model for prediction of tropical storm surge. Nat. Hazards 2016, 82, 471–491. [Google Scholar] [CrossRef]
  27. Di Nunno, F.; de Marinis, G.; Gargano, R.; Granata, F. Tide prediction in the Venice Lagoon using nonlinear autoregressive exogenous (NARX) neural network. Water 2021, 13, 1173. [Google Scholar] [CrossRef]
  28. Lee, J.W.; Irish, J.L.; Bensi, M.T.; Marcy, D.C. Rapid prediction of peak storm surge from tropical cyclone track time series using machine learning. Coast. Eng. 2021, 170, 104024. [Google Scholar] [CrossRef]
  29. Holland, G.J. An analytic model of the wind and pressure profiles in hurricanes. Mon. Weather Rev. 1980, 108, 1212–1218. [Google Scholar] [CrossRef]
  30. Xie, L.; Bao, S.; Pietrafesa, L.J.; Foley, K.; Fuentes, M. A real-time hurricane surface wind forecasting model: Formulation and verification. Mon. Weather Rev. 2006, 134, 1355–1370. [Google Scholar] [CrossRef]
  31. Lim, B.; Arik, S.O.; Loeff, N.; Pfister, T. Temporal fusion transformers for interpretable multi-horizon time series forecasting. Int. J. Forecast. 2021, 37, 1748–1764. [Google Scholar] [CrossRef]
  32. Igarashi, Y.; Tajima, Y. Application of recurrent neural network for prediction of the time-varying storm surge. Coast. Eng. J. 2021, 63, 68–82. [Google Scholar] [CrossRef]
  33. Di Nunno, F.; Granata, F.; Gargono, R.; de Marinis, G. Forecasting of extreme storm tide events using NARX neural network-based models. Atmosphere 2021, 12, 512. [Google Scholar] [CrossRef]
Figure 1. Study area. (a) Red and orange boxes indicate Korea Strait and domain area of Global Forecast System (GFS) data, respectively. Blue lines represent trajectories of typhoons (2010–2019). (b) Red dots represent the five tidal stations (Wando, Geomundo, Yeosu, Tongyeong, and Busan).
Jmse 10 00535 g001
Figure 2. Global Forecast System (GFS) numerical weather model data. Mean sea level pressure (a), air temperature (b), and U and V component of winds (c,d) were used to train the artificial neural network.
Jmse 10 00535 g002
Figure 3. Process of storm surge forecasting. This process uses the GFS data and predicted tide level, which gives the harmonic tide level.
Jmse 10 00535 g003
Figure 4. Model structure merged with convolutional neural network and deep neural network for storm surge forecasting.
Jmse 10 00535 g004
Figure 5. Correlations between air pressure (left column) and wind speed (right column) and distance from typhoon center from the observational data at (a,b) Busan, (c,d) Geomundo, (e,f) Tongyeong, (g,h) Wando, and (i,j) Yeosu during typhoons in 2010 to 2019.
Jmse 10 00535 g005
Figure 6. Time-series of observational data from Busan tidal station during Typhoon Chaba. (a) Astronomical tide, (b) residual tide level, and (c) wind components, where direction and length indicate wind direction and speed, respectively.
Jmse 10 00535 g006
Figure 7. Time-series of observational data from Geomundo tidal station during Typhoon Chaba. (a) Astronomical tide, (b) residual tide level, and (c) wind components, where direction and length indicate wind direction and speed, respectively.
Jmse 10 00535 g007
Figure 8. Time-series of observational data from Tongyeong tidal station during Typhoon Chaba. (a) Astronomical tide, (b) residual tide level, and (c) wind components, where direction and length represent wind direction and speed, respectively.
Jmse 10 00535 g008
Figure 9. Time-series of observational data from Wando tidal station during Typhoon Chaba. (a) Astronomical tide, (b) residual tide level, and (c) wind components, where direction and length represent wind direction and speed, respectively.
Jmse 10 00535 g009
Figure 10. Time-series of observational data from Yeosu tidal station during Typhoon Chaba. (a) Astronomical tide, (b) residual tide level, and (c) wind components, where direction and length represent wind direction and speed, respectively.
Jmse 10 00535 g010
Figure 11. Time-series of observational data from Busan tidal station during Typhoon Kong-Rey. (a) Astronomical tide, (b) residual tide level, and (c) wind components, where direction and length represent wind direction and speed, respectively.
Jmse 10 00535 g011
Figure 12. Time-series of observational data from Geomundo tidal station during Typhoon Kong-Rey. (a) Astronomical tide, (b) residual tide level, and (c) wind components, where direction and length represent wind direction and speed, respectively.
Jmse 10 00535 g012
Figure 13. Time-series of observational data from Tongyeong tidal station during Typhoon Kong-Rey. (a) Astronomical tide, (b) residual tide level, and (c) wind components, where direction and length represent wind direction and speed, respectively.
Jmse 10 00535 g013
Figure 14. Time-series of observational data from Wando tidal station during Typhoon Kong-Rey. (a) Astronomical tide, (b) residual tide level, and (c) wind components, where direction and length represent wind direction and speed, respectively.
Jmse 10 00535 g014
Figure 15. Time-series of observational data from Yeosu tidal station during Typhoon Kong-Rey. (a) Astronomical tide, (b) residual tide level, and (c) wind components, where direction and length represent wind direction and speed, respectively.
Jmse 10 00535 g015
Figure 16. Validation of trained model during Typhoon Chaba (2016). Time-series results for (a) Busan, (b) Geomundo, (c) Tongyeong, (d) Wando, and (e) Yeosu stations. Red lines are results predicted by the trained model. Blue and black lines show observed and harmonic tide levels, respectively, at the tidal station.
Jmse 10 00535 g016
Figure 17. Validation of trained model during Typhoon Kong-Rey (2018). Time-series results for (a) Busan, (b) Geomundo, (c) Tongyeong, (d) Wando, and (e) Yeosu stations. Red line is results predicted by the trained model. Blue and black lines show observed and harmonic tide levels, respectively, at the tidal station.
Jmse 10 00535 g017
Table 1. List of affecting and landfalling typhoons from 2010 to 2019, provided by Korea Meteorological Administration (KMA).
TyphoonImpactOccurrence DateExtinction DateCentral Pressure (hPa)Maximum Wind Speed (km/h)Radius of Wind Impact (km)
DIANMUlandfall08 Aug 201012 Aug 2010980112300
KOMPASUlandfall29 Aug 201003 Sep 2010960144450
MALOUaffected03 Sep 201008 Sep 201099086250
MEARIaffected22 Jun 201127 Jun 2011970130480
MUIFAaffected28 Jul 201109 Aug 2011930180580
TALASaffected25 Aug 201105 Sep 2011965137420
KHANUNlandfall16 Jul 201219 Jul 201298890250
DAMREYaffected28 Jul 201203 Aug 2012975122300
TEMBINlandfall19 Aug 201231 Aug 2012945162350
BOLAVENaffected20 Aug 201229 Aug 2012920191550
SANBAlandfall11 Sep 201218 Sep 2012910202530
LEEPIaffected18 Jun 201321 Jun 201399279400
KONG-REYaffected26 Aug 201331 Aug 201398597300
DANASaffected04 Oct 201309 Oct 2013935173400
NEOGURIaffected04 Jul 201411 Jul 2014915194490
HALONGaffected29 Jul 201411 Aug 2014915194500
NAKRIaffected30 Jul 201403 Aug 201498090380
VONGFONGaffected03 Oct 201414 Oct 2014900212420
CHAN-HOMaffected30 Jun 201513 Jul 2015935176450
NANGKAaffected04 Jul 201518 Jul 2015920191390
HALOLAaffected13 Jul 201527 Jul 2015960140320
GONIaffected15 Aug 201526 Aug 2015930180370
MALAKASaffected13 Sep 201620 Sep 2016935176320
CHABAlandfall28 Sep 201606 Oct 2016930180380
NANMADOLaffected02 Jul 201705 Jul 201798597170
NORUaffected21 Jul 201708 Aug 2017935176350
TALIMaffected09 Sep 201718 Sep 2017940169430
PRAPIROONaffected29 Jun 201804 Jul 2018975115280
RUMBIAaffected15 Aug 201818 Aug 201899072220
SOULIKlandfall16 Aug 201825 Aug 2018950155380
TRAMIaffected21 Sep 201801 Oct 2018920191430
KONG-REYlandfall29 Sep 201807 Oct 2018920191450
DANASaffected16 Jul 201920 Jul 201999086250
FRANCISCOlandfall02 Aug 201906 Aug 2019975115250
LEKIMAaffected04 Aug 201912 Aug 2019930180400
KROSAaffected06 Aug 201916 Aug 2019950155450
LINGLINGaffected02 Sep 201908 Sep 2019940169390
TAPAHaffected19 Sep 201923 Sep 2019965133360
MITAGlandfall28 Sep 201903 Oct 2019965133330
Table 2. GFS parameters. Air pressure (PRMSL), air temperature (TMP), and wind speed and wind direction components (UGRD and VGRD, respectively) were used to train the artificial neural network.
NumberLevelValid TimeParameterDescription
001Mean sea level3 h forecastPRMSLPressure reduced to MSL (Pa)
4352 m above ground3 h forecastTMPAir temperature (K)
44210 m above ground3 h forecastUGRDU component of
winds (m/s)
44310 m above ground3 h forecastVGRDV component of
winds (m/s)
Table 3. Correlations between variables describing storm surges for five tidal stations (Busan, Geomundo, Tongyeong, Wando, Yeosu). Data on typhoons that affected the Korean Peninsula between 2010 and 2019 were used.
ComparisonStationSlopeR2Corr.
Distance
–Air pressure
Busan0.0170.120.35
Geomundo0.0290.290.54
Tongyeong0.0220.170.42
Wando0.0310.050.22
Yeosu0.0230.200.44
Total0.0230.090.30
Distance
–Air speed
Busan−0.0070.12−0.34
Geomundo−0.0090.08−0.28
Tongyeong−0.0080.09−0.30
Wando−0.0080.01−0.07
Yeosu−0.0070.05−0.23
Total−0.0090.09−0.30
Distance
–Residual tide level
Busan−0.0270.08−0.28
Geomundo−0.0390.04−0.19
Tongyeong−0.0360.10−0.32
Wando−0.0600.13−0.36
Yeosu−0.0390.09−0.30
Total−0.0440.09−0.30
Air pressure
–Residual tide level
Busan−0.7100.13−0.36
Geomundo−1.1460.09−0.30
Tongyeong−0.8530.15−0.39
Wando−0.1030.01−0.08
Yeosu−1.0740.19−0.44
Total−0.3880.04−0.20
Air speed
–Residual tide level
Busan0.8100.030.16
Geomundo0.8430.020.14
Tongyeong1.9980.200.44
Wando0.3280.050.22
Yeosu0.3980.160.40
Total0.5780.050.22
Table 4. Performance evaluation of the model. A relative error indicates the discrepancy between the observed and predicted tide levels, which is expressed as an absolute error. The absolute error is calculated using the observed and predicted tide levels at the maximum residual tide level. RMSE: root mean square error.
StationTyphoon
Chaba (2016)Kong-Rey (2018)
Absolute Relative
Error (%)
Absolute
Error (cm)
RMSE
(cm)
Absolute Relative
Error (%)
Absolute
Error (cm)
RMSE
(cm)
Busan5.744.5910.183.374.969.05
Geomundo0.571.137.815.1714.257.05
Tongyeong15.2324.999.652.978.347.32
Wando0.110.2012.813.8811.1512.00
Yeosu16.9029.9110.360.562.007.21
Table 5. Accuracy evaluation of the model. Correlation, centered root mean square difference, and standard deviation are calculated using the residual tide levels and predicted residual tide levels.
StationTyphoon
Chaba (2016)Kong-Rey (2018)
CorrelationCentered Root Mean
Square Difference
Standard
Deviation
CorrelationCentered Root Mean
Square Difference
Standard
Deviation
Busan0.775.968.00.924.239.78
Geomundo0.897.3816.20.846.3710.39
Tongyeong0.578.136.80.915.3512.80
Wando0.857.9614.70.8410.1918.50
Yeosu0.729.8711.30.936.8415.35
Publisher’s Note: MDPI stays neutral with regard to jurisdictional claims in published maps and institutional affiliations.

