Article

Load Resistance Factor for Vertical Caisson Breakwater in Korea

1
Structures Research Division, Korea Expressway Corporation Research Institute, Hwaseong 18489, Korea
2
School of Architecture and Coastal Construction Engineering, Kunsan National University, Gunsan 54150, Korea
*
Author to whom correspondence should be addressed.
J. Mar. Sci. Eng. 2022, 10(4), 468; https://doi.org/10.3390/jmse10040468
Submission received: 21 February 2022 / Revised: 23 March 2022 / Accepted: 24 March 2022 / Published: 26 March 2022
(This article belongs to the Special Issue Breakwater Behaviour)

Abstract

:
The load resistance factor according to the target reliability level was proposed using 16 vertical breakwaters constructed along the coast of Korea. Limit state functions for sliding and overturning limit states were defined. Reliability analysis was performed to obtain the sensitivity of the limit state function to the design variables. The partial safety factors of the design variable were obtained using the sensitivity, and the load resistance factor was calculated in turn. The representative value of load resistance factors was obtained by optimizing the load resistance factors for 16 vertical breakwaters, and it was verified that the breakwater designed using the representative value had a reliability index greater than the target value.

1. Introduction

Breakwater design should reasonably consider various variables with high uncertainty. In deterministic design methods, it has been considered sufficient to use a factor of safety to account for uncertainty. However, since the magnitude of uncertainty differs for each variable and it is not simple to determine the target level of safety a single safety factor is not sufficient to prepare for all of them. For that reason, the reliability design method began to be suggested as an alternative [1,2].
The reliability design method is a very useful method to calculate the probability of failure of a structure because it quantitatively considers uncertainty. However, due to the high computational difficulty, it is not easy for design engineers to calculate the probability of failure of a structure. Level 3 reliability analysis methods such as Monte Carlo simulation and level 2 reliability analysis methods such as first-order reliability methods are still not easy to use for complex structural design. Level 1 methods such as partial safety factor (PSF) method and load resistance factor design (LRFD) method are more actively used in design codes [3,4,5]. In both methods, the failure probability is controlled by applying some safety factors to the stability evaluation formula instead of directly calculating the failure probability.
In the PSF method, safety factors are independently applied to individual design variables or element loads. Each safety factor is determined by the target failure probability and the variability of the design variable. Sørenson et al. [6] showed how code calibration is done by optimizing the difference between the reliability for the different structures and target reliability using rubble mound breakwater as examples. The partial safety factor of the vertical breakwater was also proposed by applying the same method [7]. Nagao [8] analyzed a number of quay walls in Japan and calibrated partial safety factors that satisfy the target reliability level. Partial safety factors, which is code-corrected by analyzing the Japanese gravity breakwater, have also been proposed [9]. The LRFD method is a design method using two safety factors, one for each load and resistance value. The LRFD method has the advantage of being very easy to design because it uses only two safety factors. Recently, a few studies on the port structural design using load and resistance factor have been published. The load resistance factor for the superstructure of the gravity breakwater in Japan was proposed [10,11]. By analyzing the breakwaters in Japan, load resistance factor that satisfies the target reliability index was proposed. The load resistance factor for slope stability design was also proposed by applying the same breakwater case and analysis method [12].
For breakwater reliability analysis studies in Korea, a method for determining the target reliability index has been proposed. An optimal target reliability index was proposed by analyzing existing breakwaters [13]. By analyzing the existing breakwaters, the optimal target reliability index and partial safety factors were proposed [14]. In their study, they analyzed the existing breakwater and suggested partial safety factors, but not load resistance factor. A study on the load resistance factor of breakwaters in Korea has been published on the stability of the foundation [15]. The load resistance factor for the design of the superstructure has not yet been proposed.
Unlike deterministic design methods, reliability design uses different partial factors or load resistance factor for each country because it is affected by regional characteristics such as wave height, tide level, marine environment, and material properties. Therefore, the reliability-based design formulas of the US, Japan, and Europe are different [1,3,4,5]. In order to develop a load resistance factor design method in Korea, load resistance factor that reflects the unique characteristics of the Korean coast is required. In this study, reliability analysis was performed using the design data of the breakwater actually constructed on the coast of Korea. Then, using the results, a load resistance factor suitable for Korean ports was first proposed for sliding failure and overturning failure. In Section 2, a comparative explanation of the PSF method and the LRFD method is dealt with. In Section 3, the load resistance factor calibration procedure using the reliability analysis results was explained. In Section 4, reliability analysis was performed using breakwater design data. Here, it was possible to obtain important data for the calibration of the load resistance factor, such as the sensitivity of the limit state function to the design random variable. In Section 5, the load resistance factor that satisfies the target reliability index was obtained using the optimization technique. The important conclusions of this study are summarized in Section 6.

2. PSF vs. LRFD

The vertical caisson breakwater is made of concrete and has a structure that receives waves with a flat front. In the deterministic design method, the ratio of resistance to wave force, the so called safety factor, is defined as Equation (1).
F s = f c ( W i B U ) P
where f c ,   W i ,   B ,   U and P are the friction coefficient between caisson and rubble mound, caisson self-weight, buoyancy, uplift force due to wave and horizontal wave force, respectively. Caisson self-weight ( W i ) is composed of plain concrete with no reinforcement ( W c ), reinforced concrete ( W r c ) and filling material ( W f ). Figure 1a shows each component force and Figure 1b shows the resulting horizontal load ( P ) and resisting friction force exerted by the rubble mound.
If the safety factor is set to 1.2, the current deterministic design method is to secure a safety margin of 20%. However, since the uncertainty of the design variables is different, it is not certain whether the safety margin is actually 20%. In addition, the appropriate value of the safety margin should be explained in relation to the failure probability, but the safety factor alone cannot explain this. The reliability-based limit state design method can fundamentally solve this problem because it determines the load resistance factor based on the target failure probability.
In the reliability design method, the probability of failure for the sliding mode in Equation (1) is obtained by the following equation.
P f = g i < 0 f X ( x ) d x
where g i is the limit state function, which is defined to determine whether or not to fail. X is the design random variable and f X is the probability density function of X . Since the probability of failure is often a very small number, it is often used after being converted into a reliability index by the following equation.
β = Φ ( P f )
where Φ is the cumulative density function of standard normal random variable.
In PSF method, the stability evaluation is based on the following equation.
γ f c f c [ γ W i W i γ B B γ U U ] > γ P P
where γ f c , γ W i , γ B , γ U , and γ P denote the partial safety factor for friction coefficient, self-weight of caisson, buoyancy, uplift force, and horizontal load, respectively. Each partial safety factor is determined by considering the target reliability index and the variability of the random variable. Therefore, if a breakwater satisfies the conditional expression, it is guaranteed that the sliding failure probability is less than the target value.
On the other hand, the design equation of LRFD method is as follows:
γ R f c [ W i B U ] > γ S P
where γ R and γ S are the resistance factor and load factor, respectively. Although only one partial factor is used for load and resistance each, the reliability index of the breakwater that satisfies the design formula is calibrated to be larger than the target reliability index.

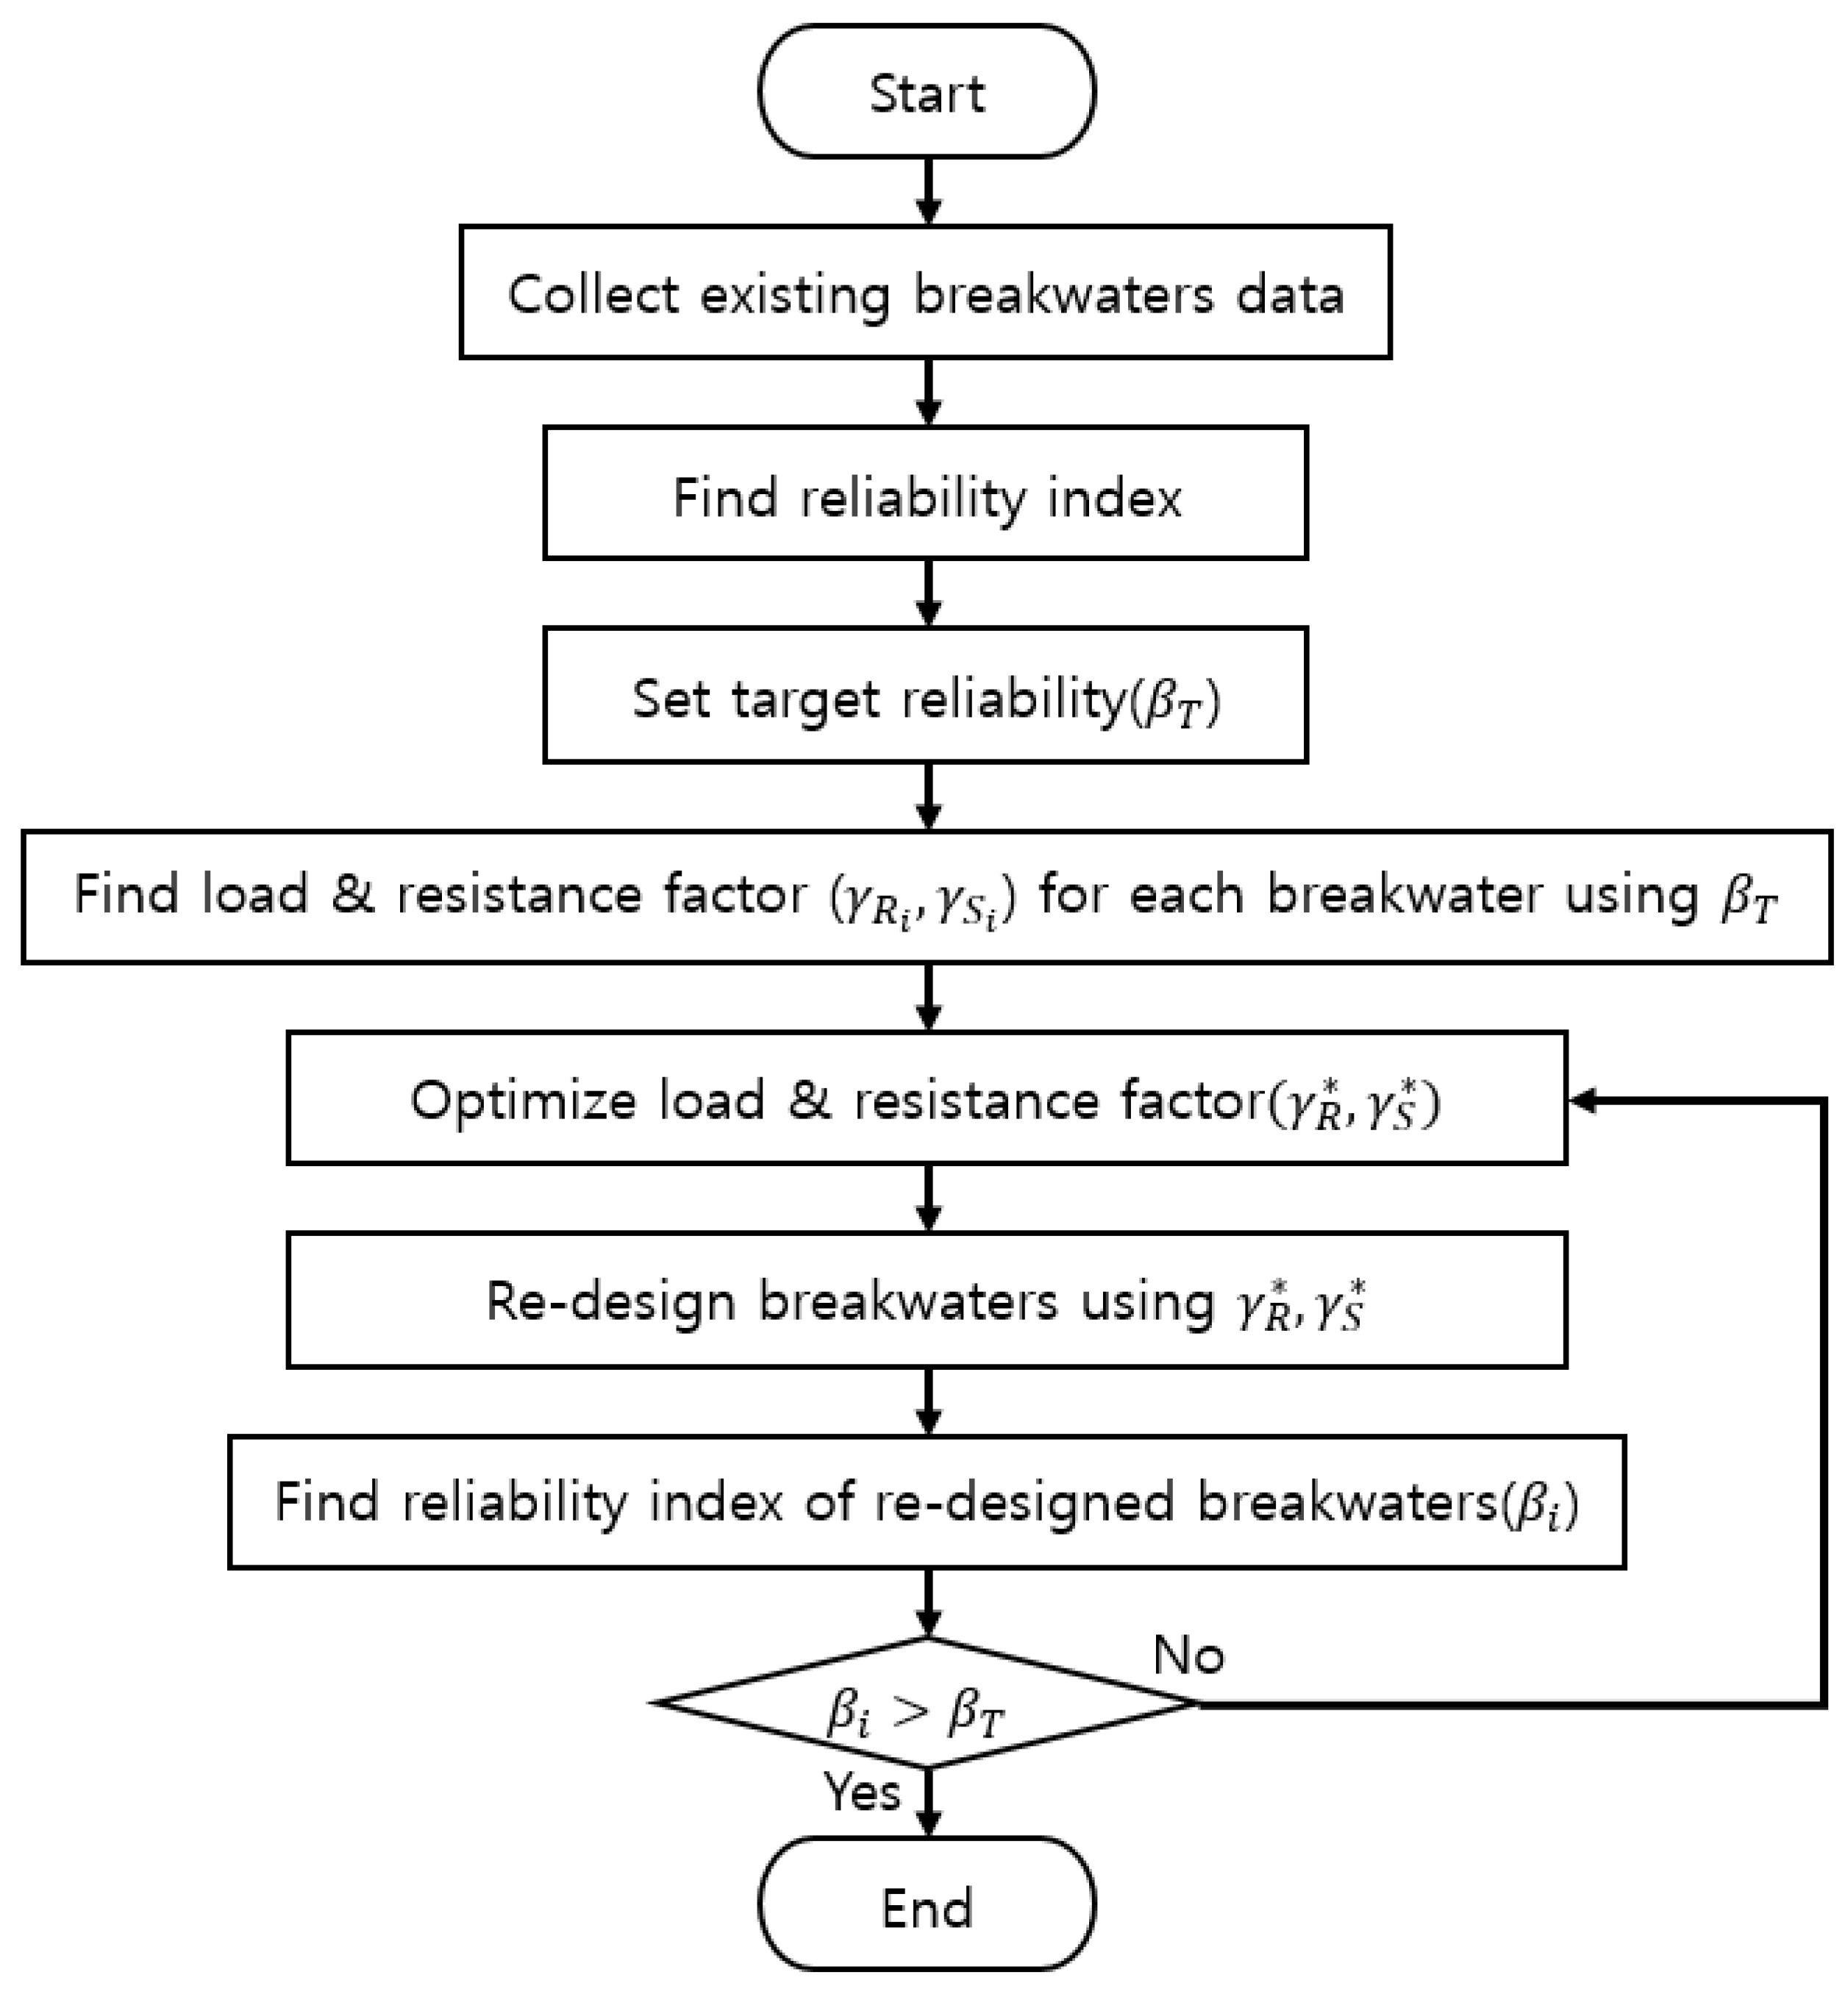
3. Load Resistance Factor Calibration Procedure

In this study, load resistance factor based on target failure probability is presented. Figure 2 shows the procedure for obtaining load resistance factor. First, the design values of the vertical caisson breakwater constructed in the coast of Korea are collected. Since Korea has three coasts (the West Sea, the South Sea, and the East Sea), it is necessary to select the same number of breakwaters as possible on each coast. In the second step, the reliability analysis of the collected breakwaters is performed to obtain the initial value of the load resistance factor. The load resistance factor can be obtained by applying the target reliability index ( β T ) together with the reliability analysis result. In this step, the load resistance factor is calculated for each breakwater collected. One load resistance factor representing the entire breakwater is then determined through optimization. After determining the load resistance factor, it should be verified whether the breakwater failure probability satisfies the target value when these values are used. Therefore, in the next step, all breakwaters are redesigned using the optimized load resistance factor. After analyzing the reliability of the redesigned breakwater, it should be evaluated whether all reliability indices are greater than the target value. If either one does not pass this condition, the optimization must be performed again to pass the condition.

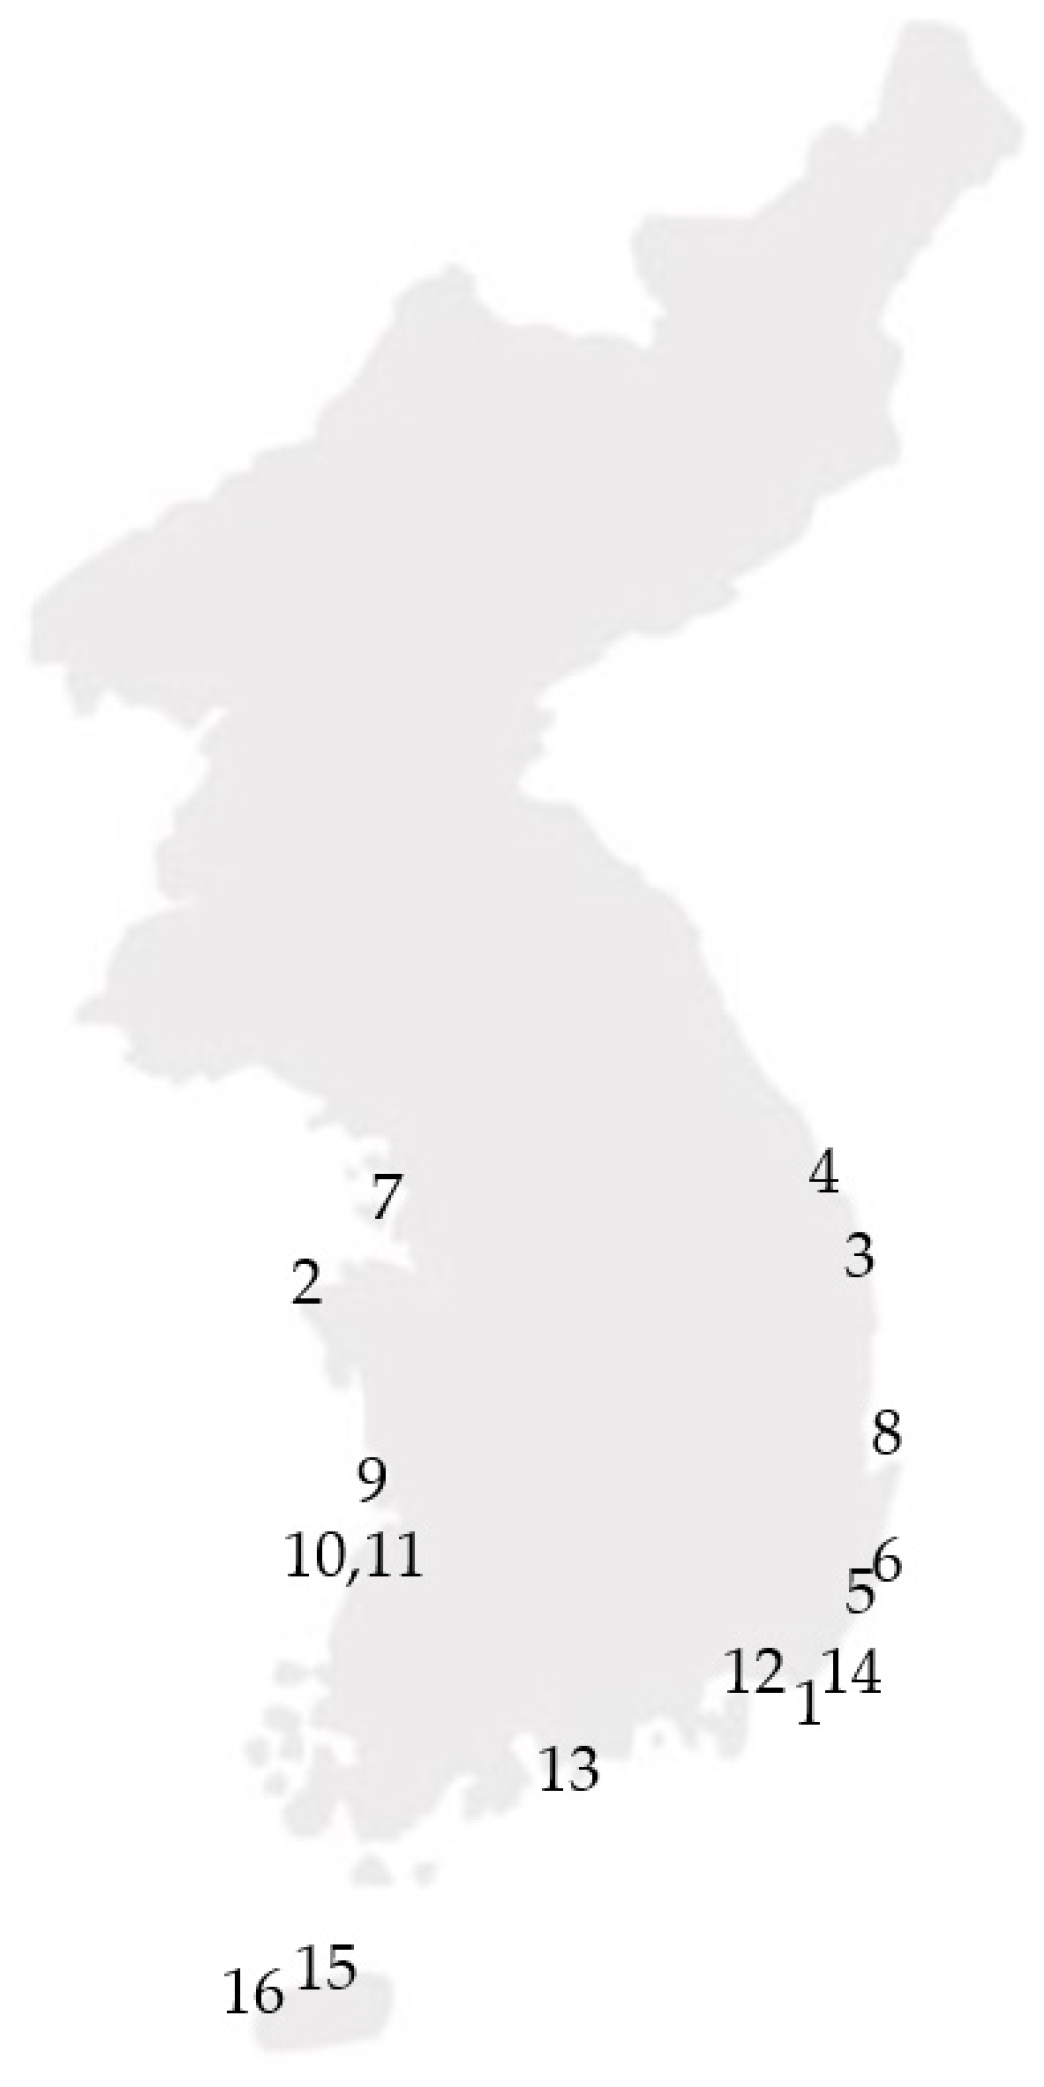
4. Reliability Analysis of Breakwater

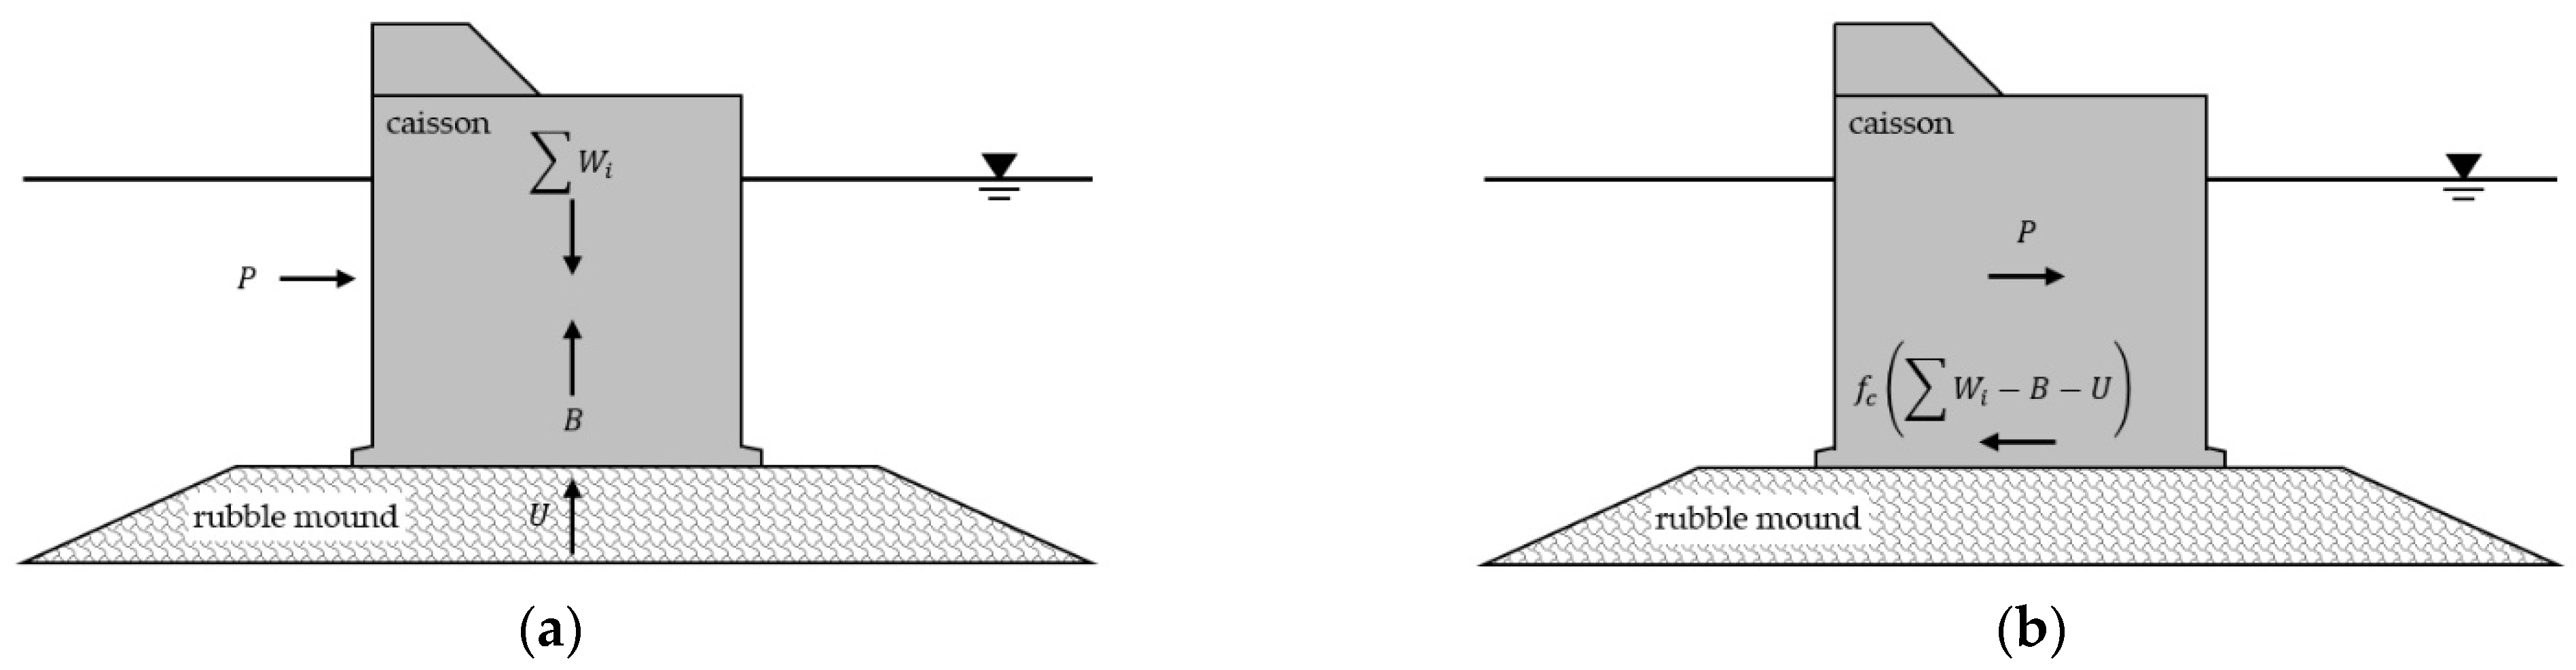
4.1. Failure Modes and Limit States

The main failure modes of vertical caisson breakwaters include sliding, overturning, and bearing failure. In this study, the first two structural failure modes except bearing failure were addressed. The limit state function for each failure mode is defined by the following Equations (6) and (7).
g s = f c ( W i B U ) P ,
g o = ( W i x W i B x B U x U ) P y P ,
where x W i ,   x B ,   x U and y p refer to the moment arm of the loads indicated in the subscripts during overturning. It was assumed that horizontal and uplift wave force have the maximum value at the same time. Therefore, a new independent parameter G was introduced to ensure that no phase difference between uplift force and horizontal wave force occurs during the reliability analysis, and the horizontal and the uplift force were defined by using G as follows.
P = P 0 G ,
U = U 0 G ,
where, P 0 and U 0 are the design values of horizontal wave force and uplift force, and the random variable G represents the uncertainty of the wave pressure by Goda [16]. Meanwhile, buoyancy acting on the body can be expressed as follows.
B = r w [ ( W L + h ) b + v f ] ,
where r w ,   W L ,   h ,   b ,   v f are the unit weight of seawater, water level, the depth to the bottom of the caisson, the width of the caisson, and the volume of the front and rear heel, respectively. In this equation, only WL is treated as a random variable and the others are constants.

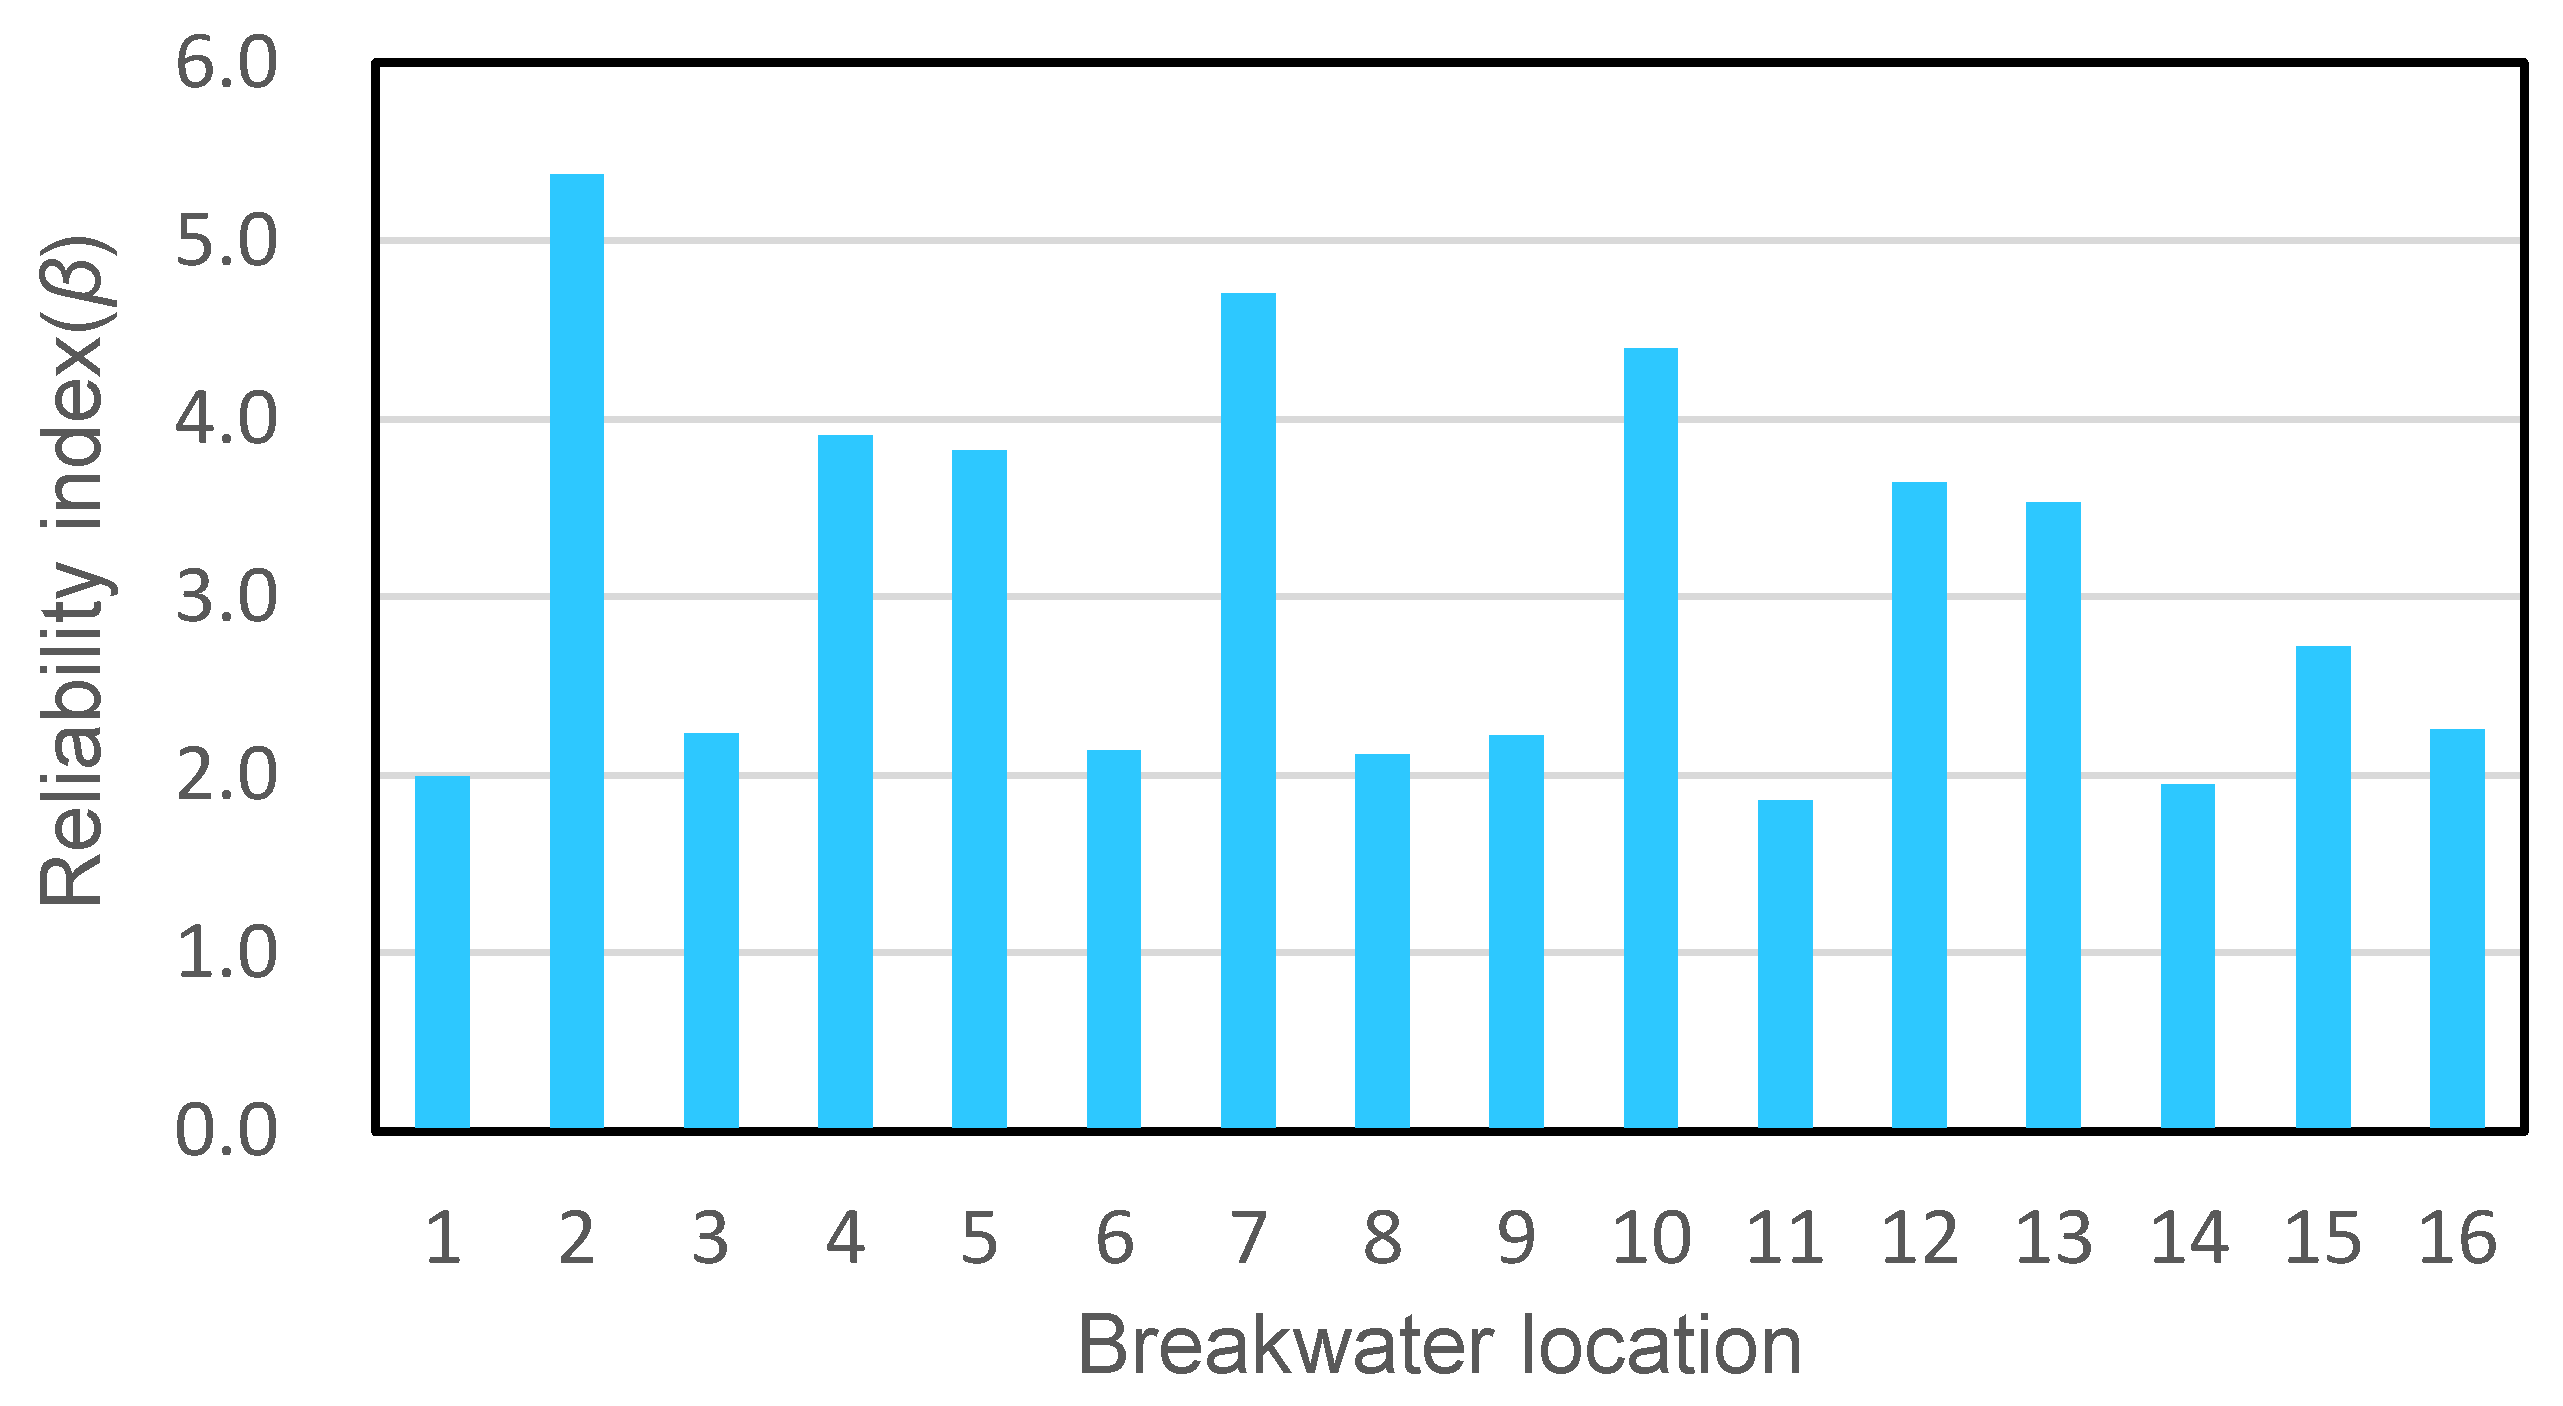
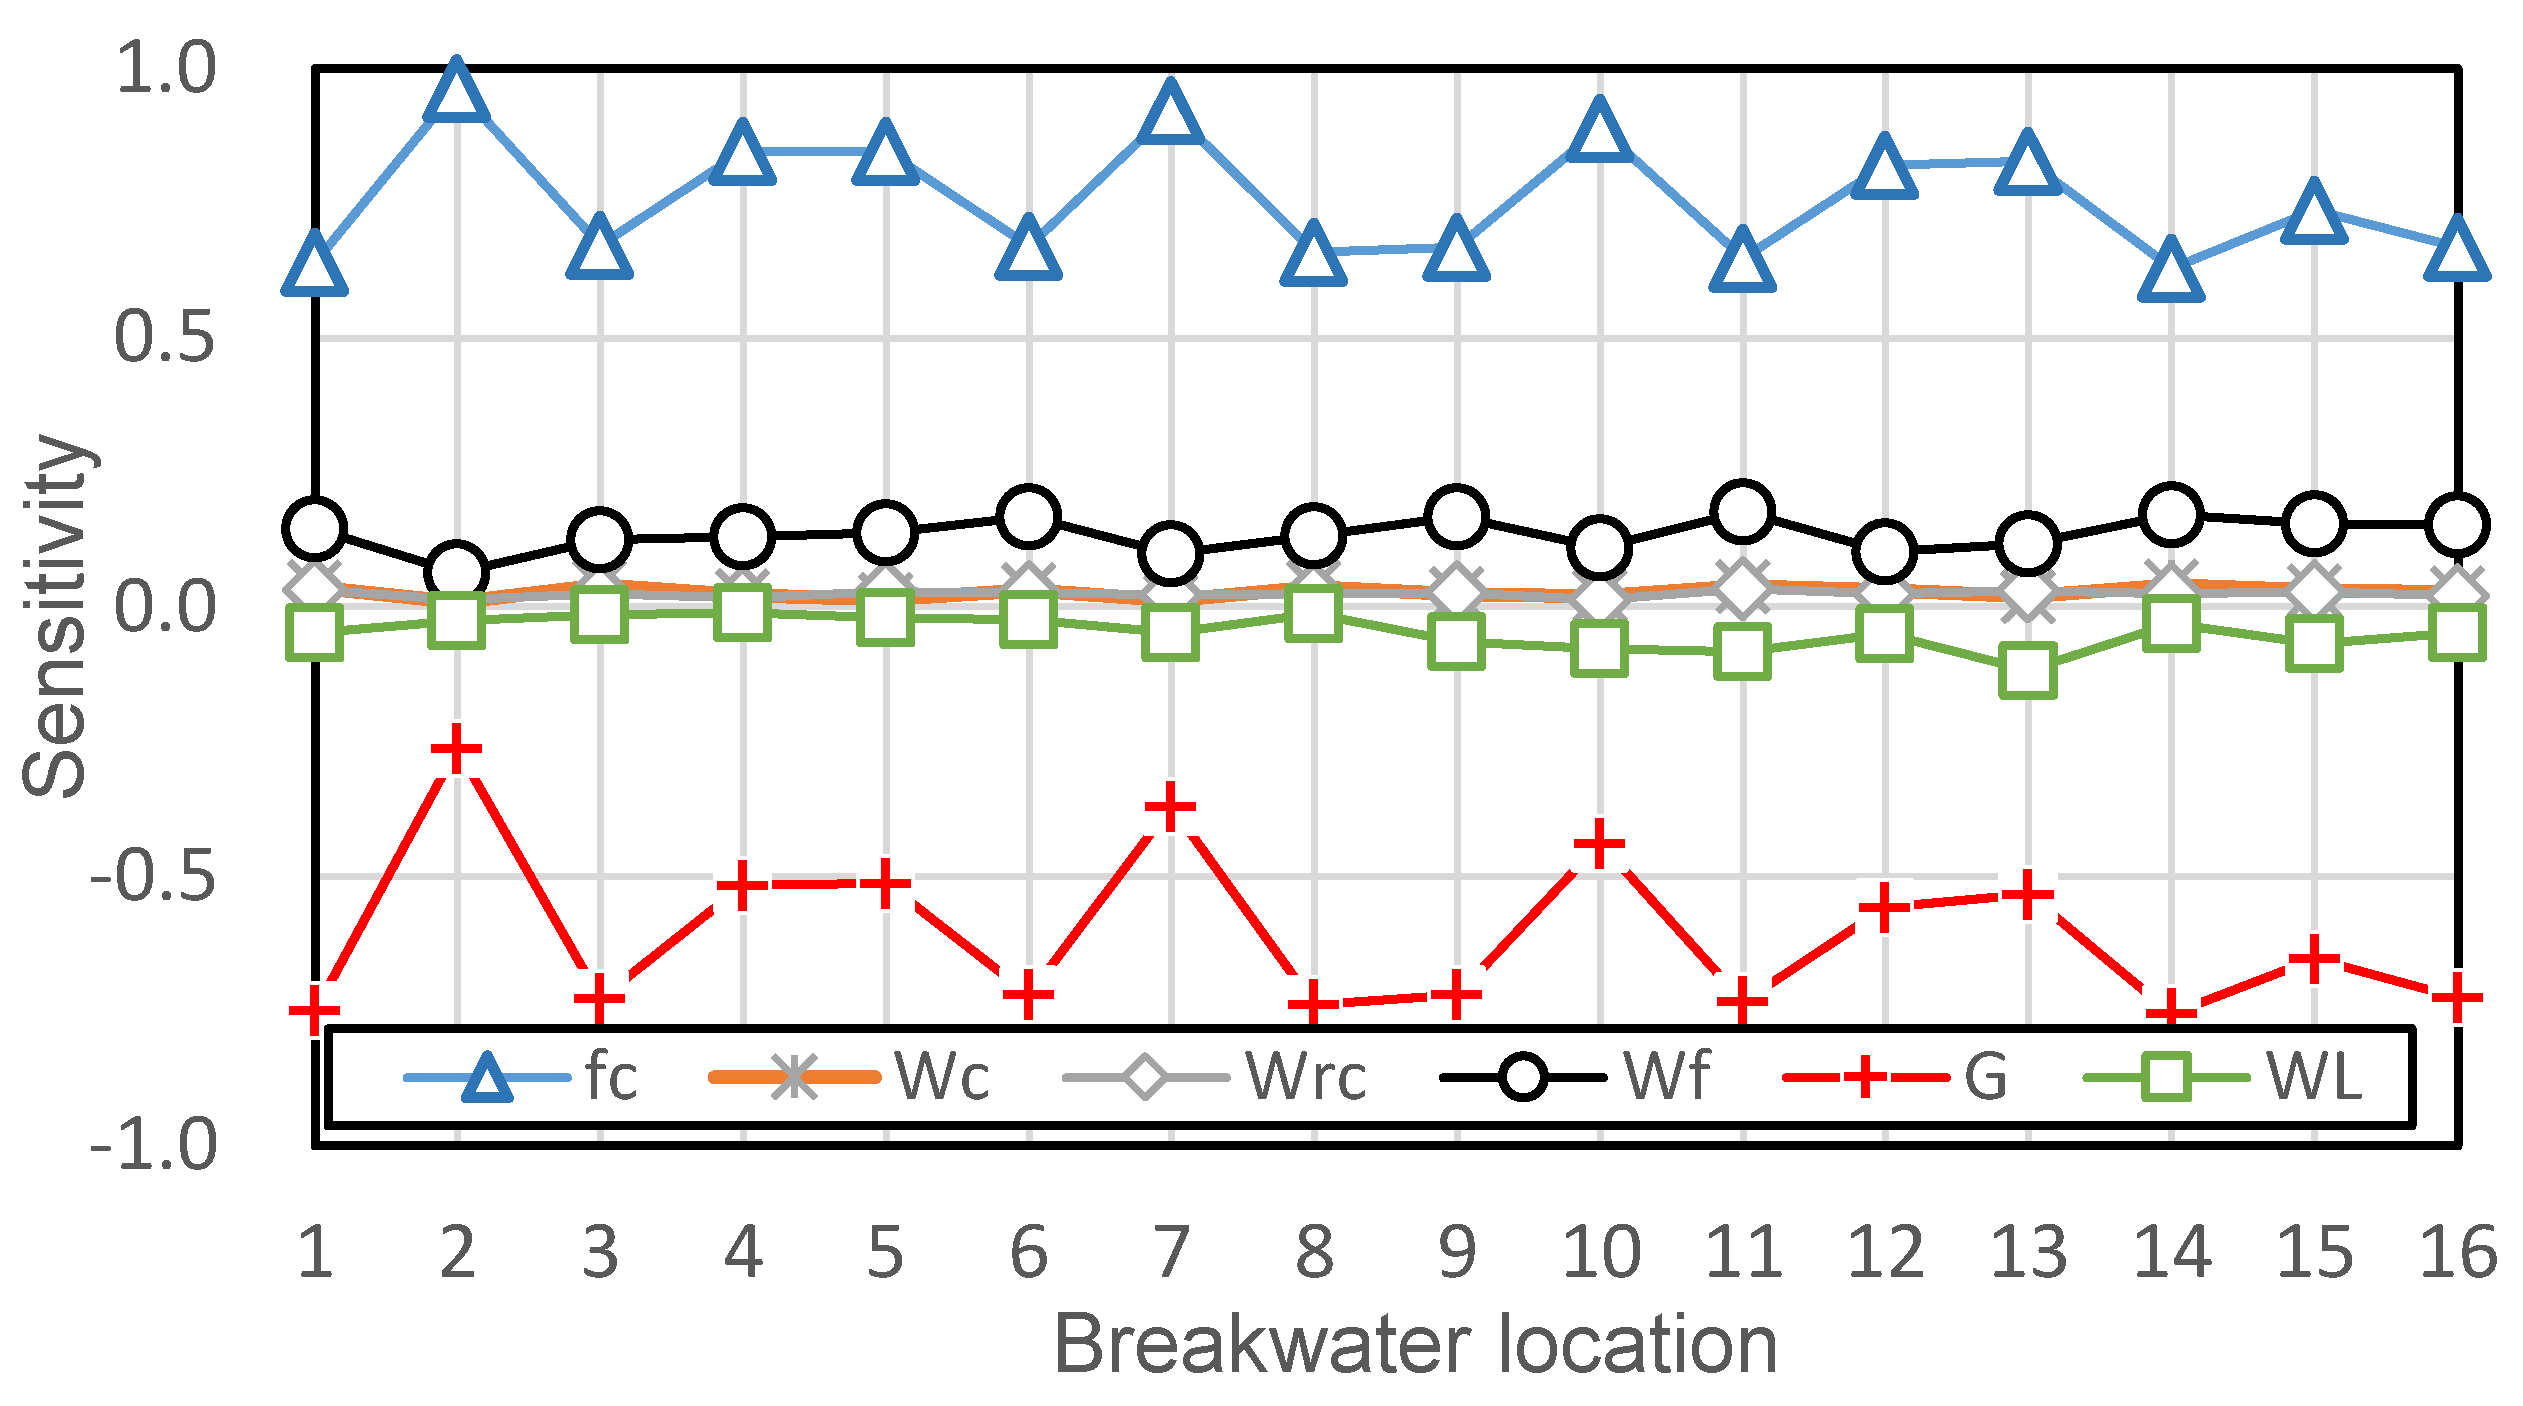
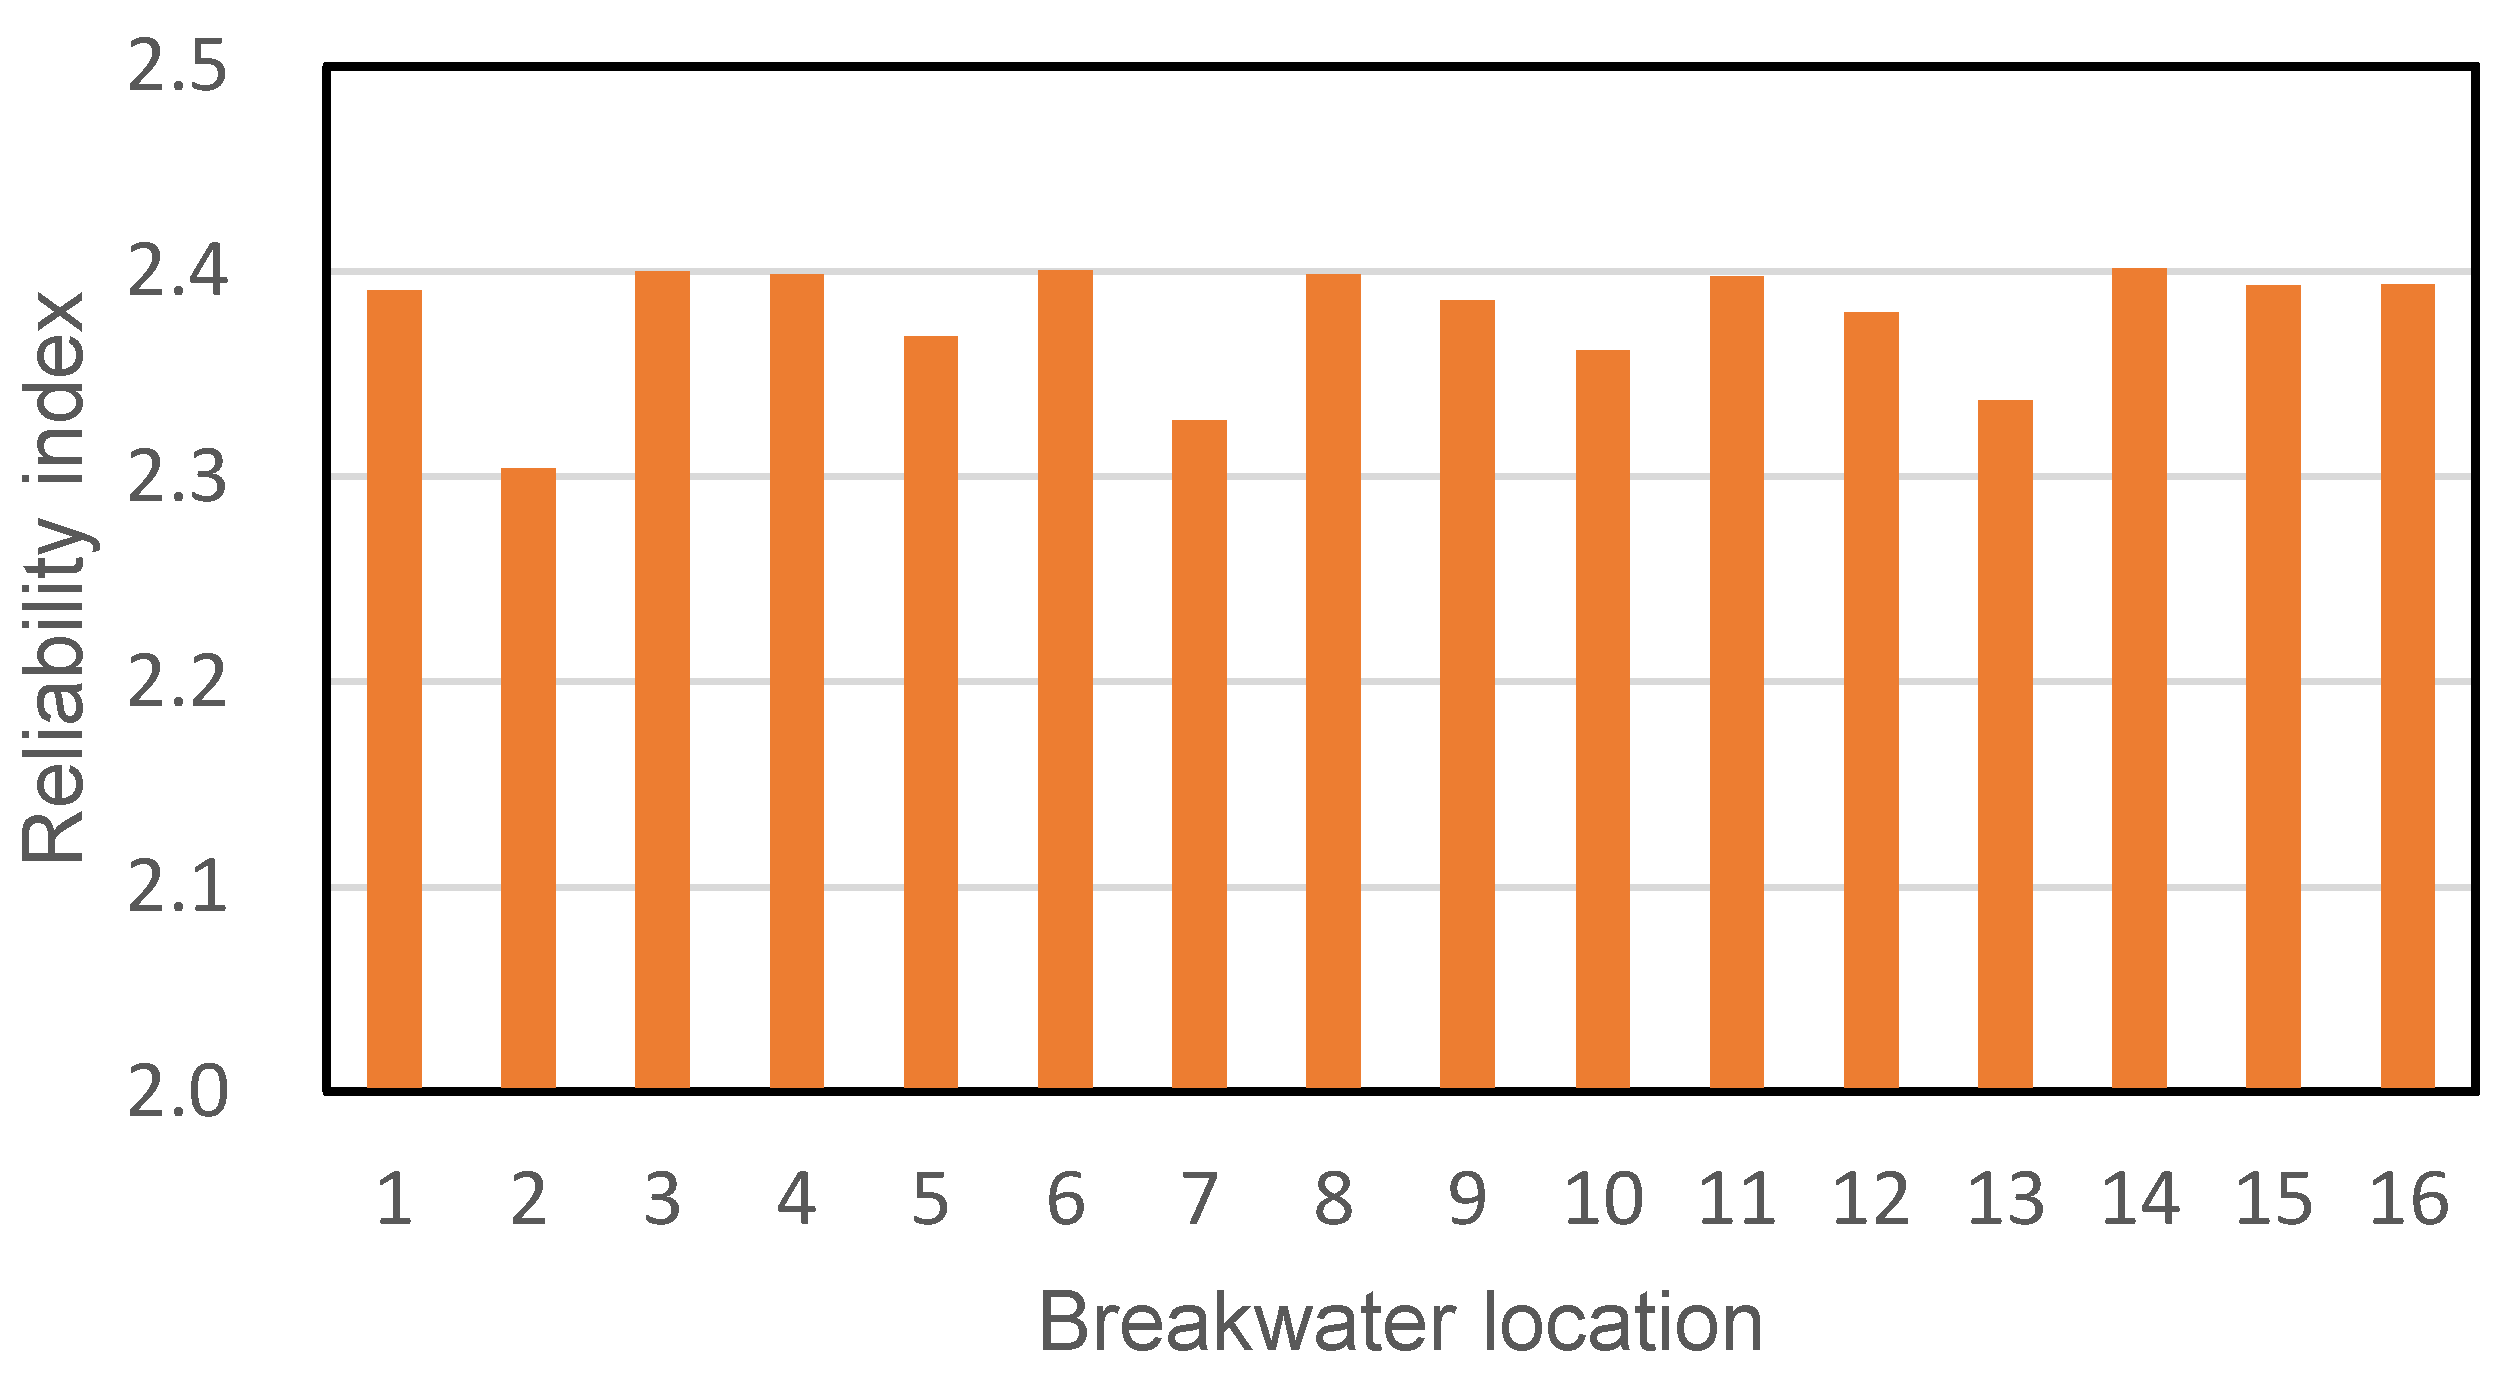
4.2. Reliability Analysis
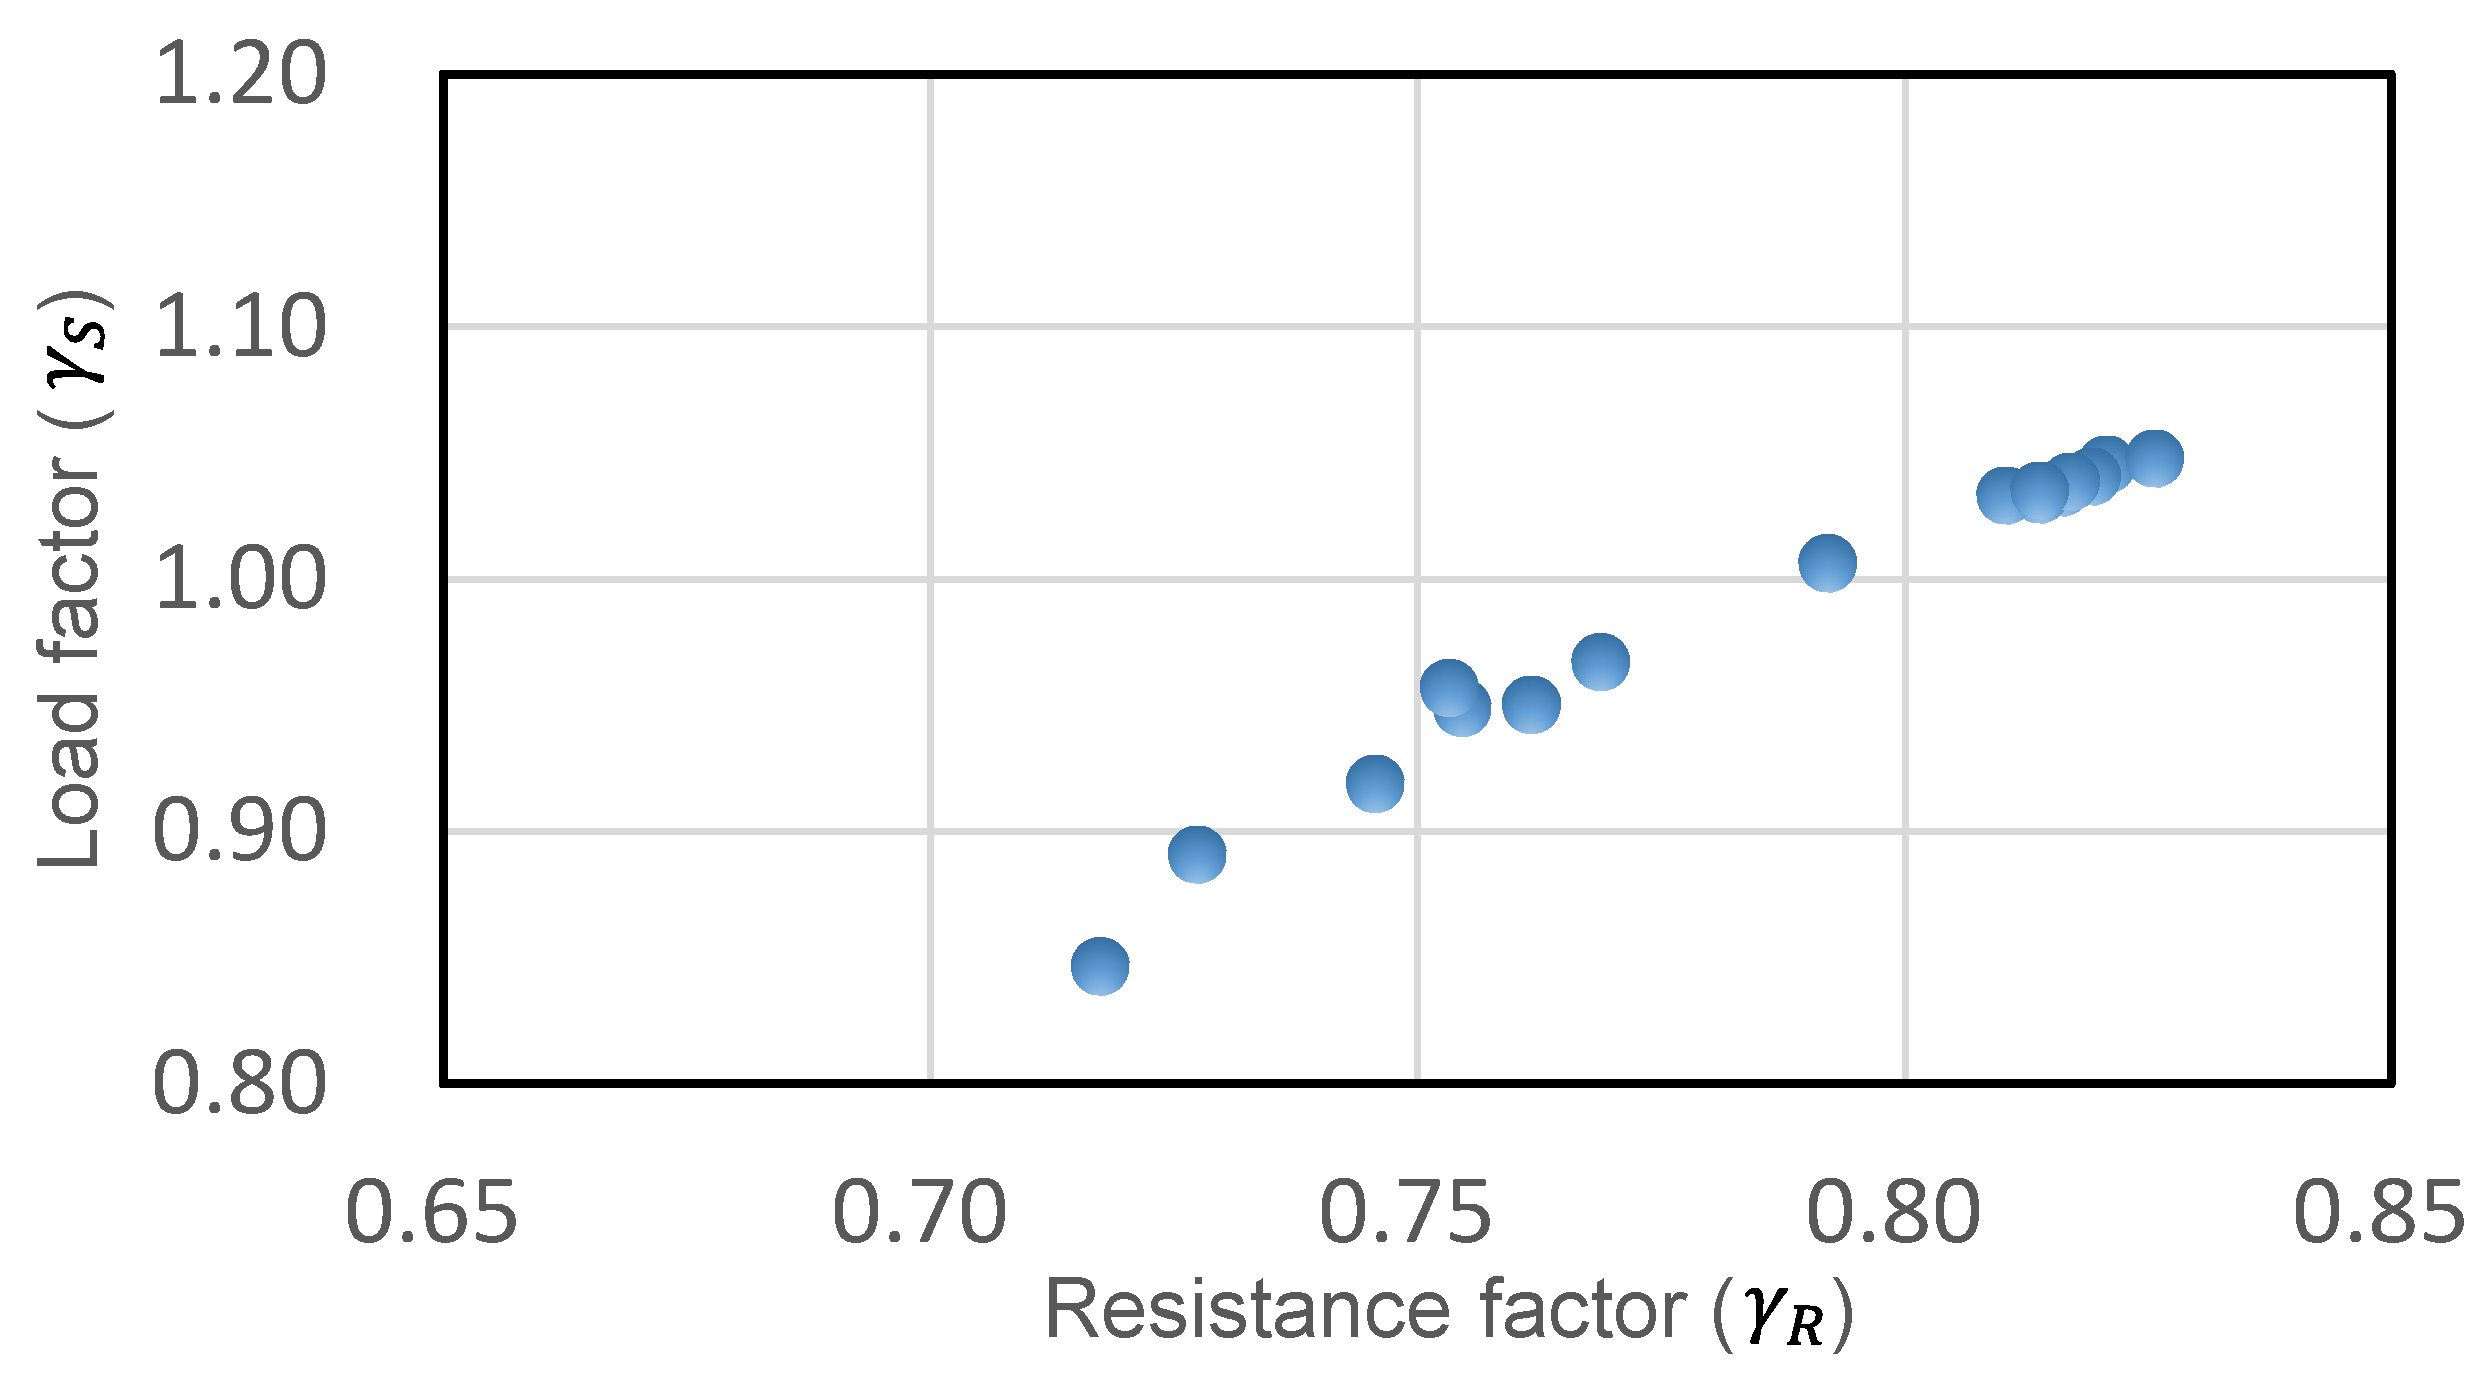
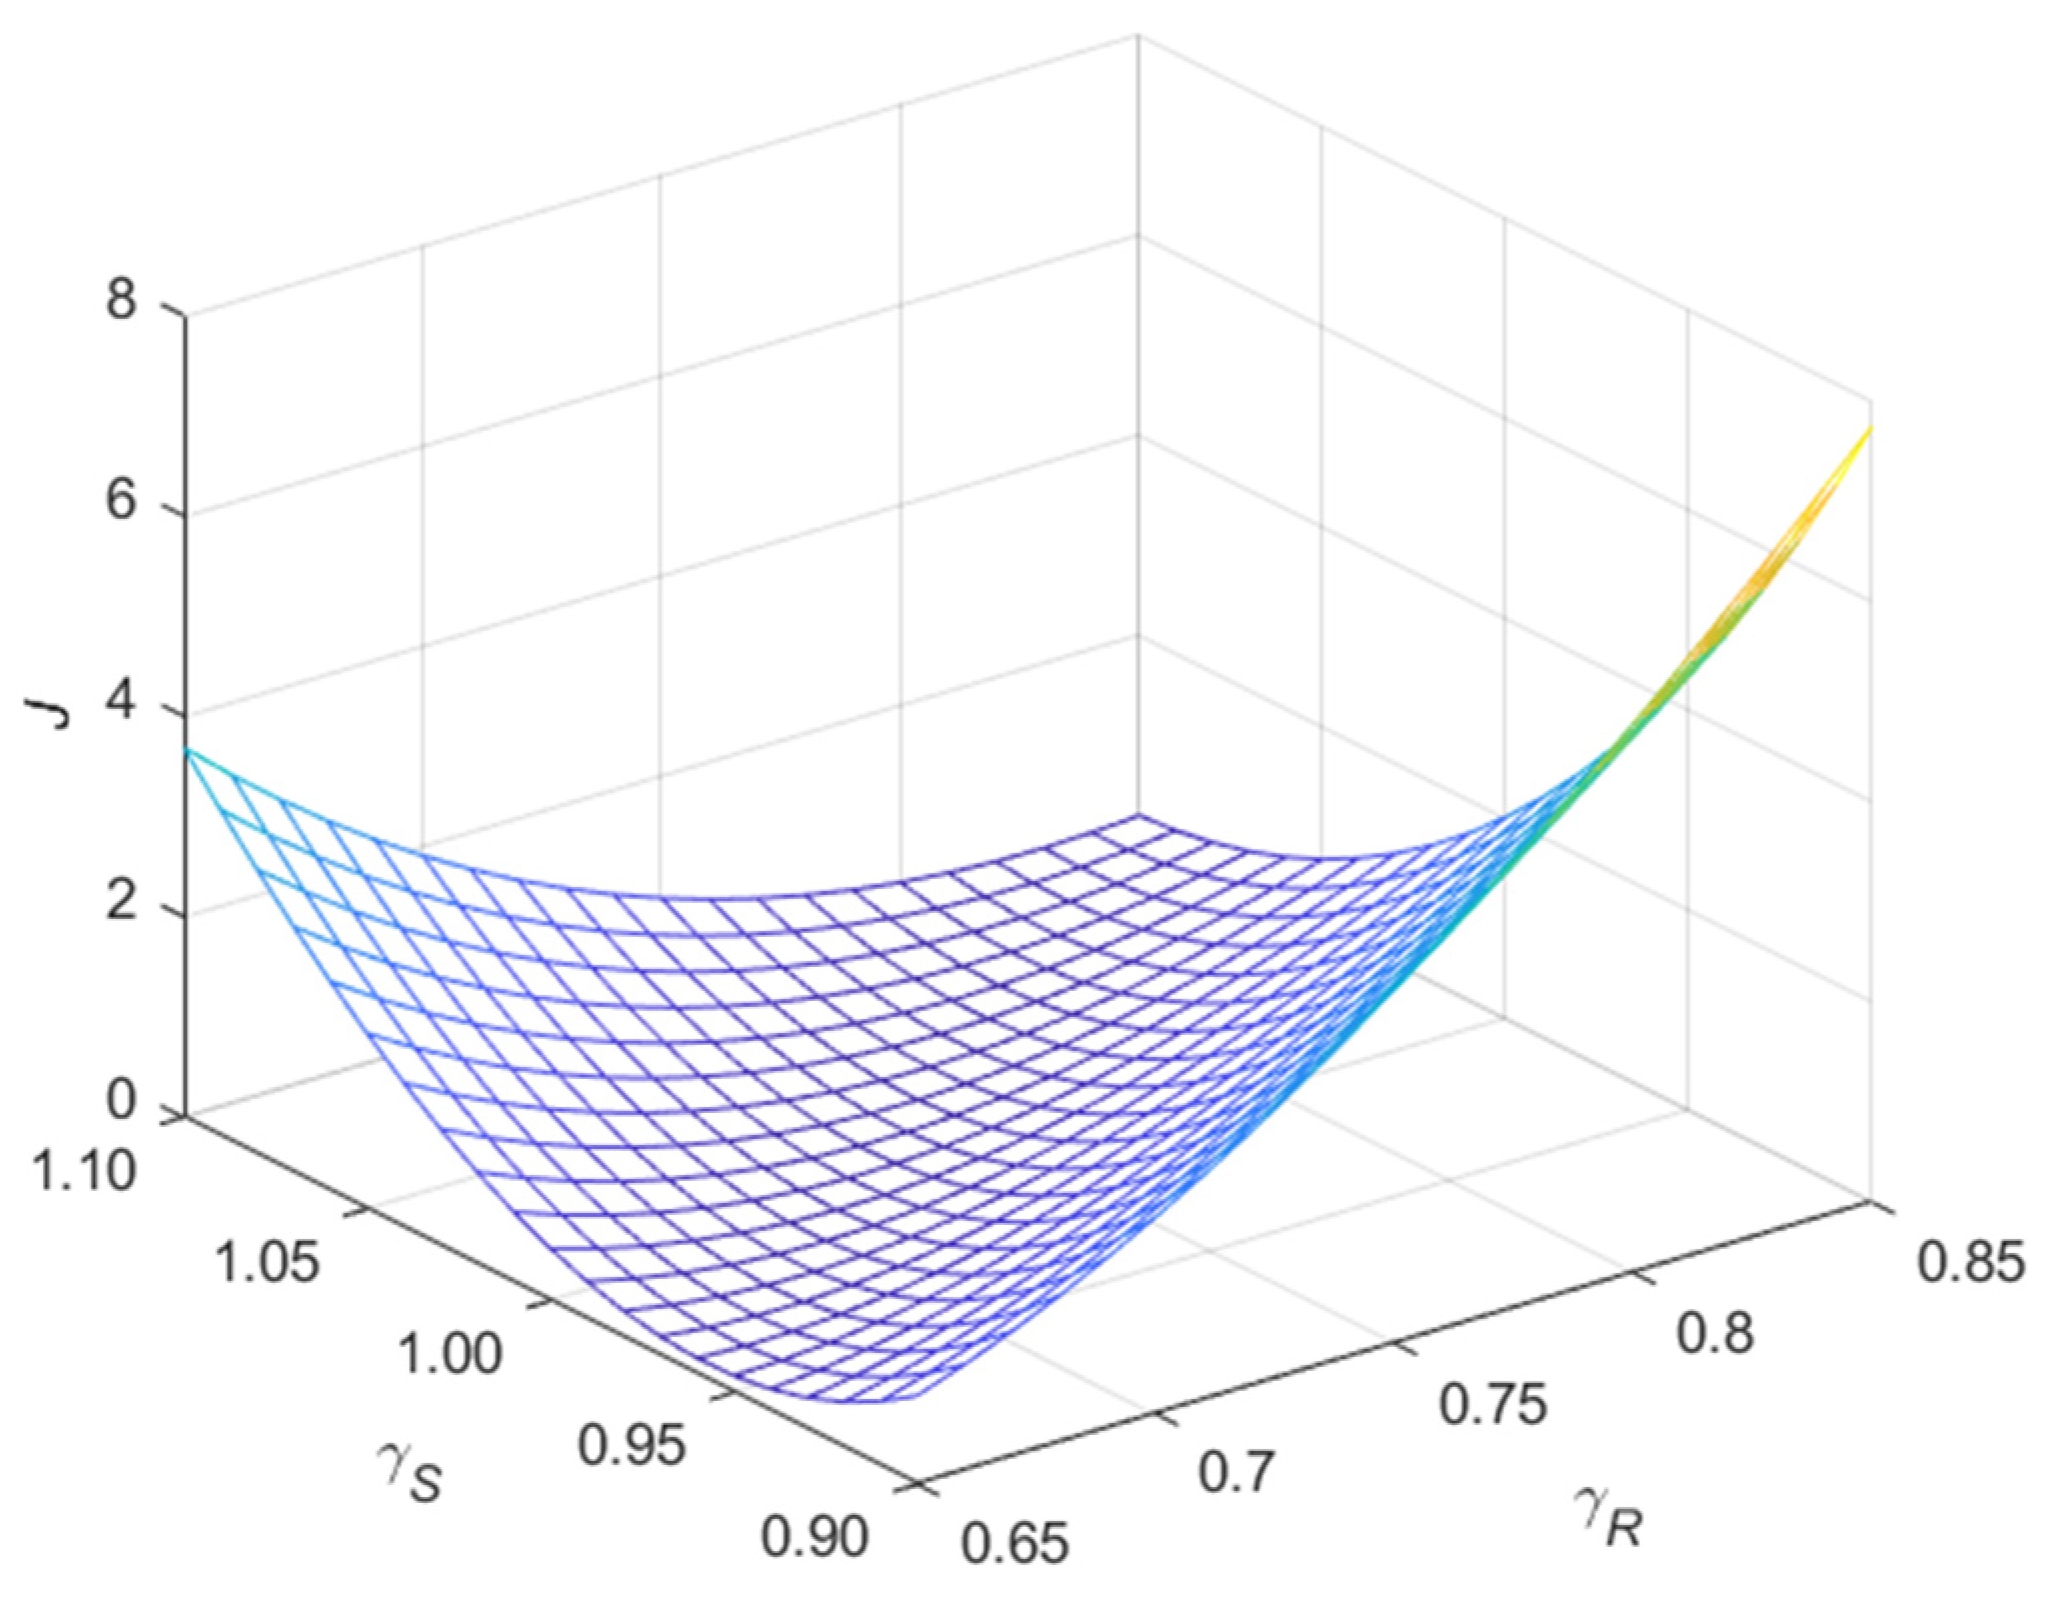
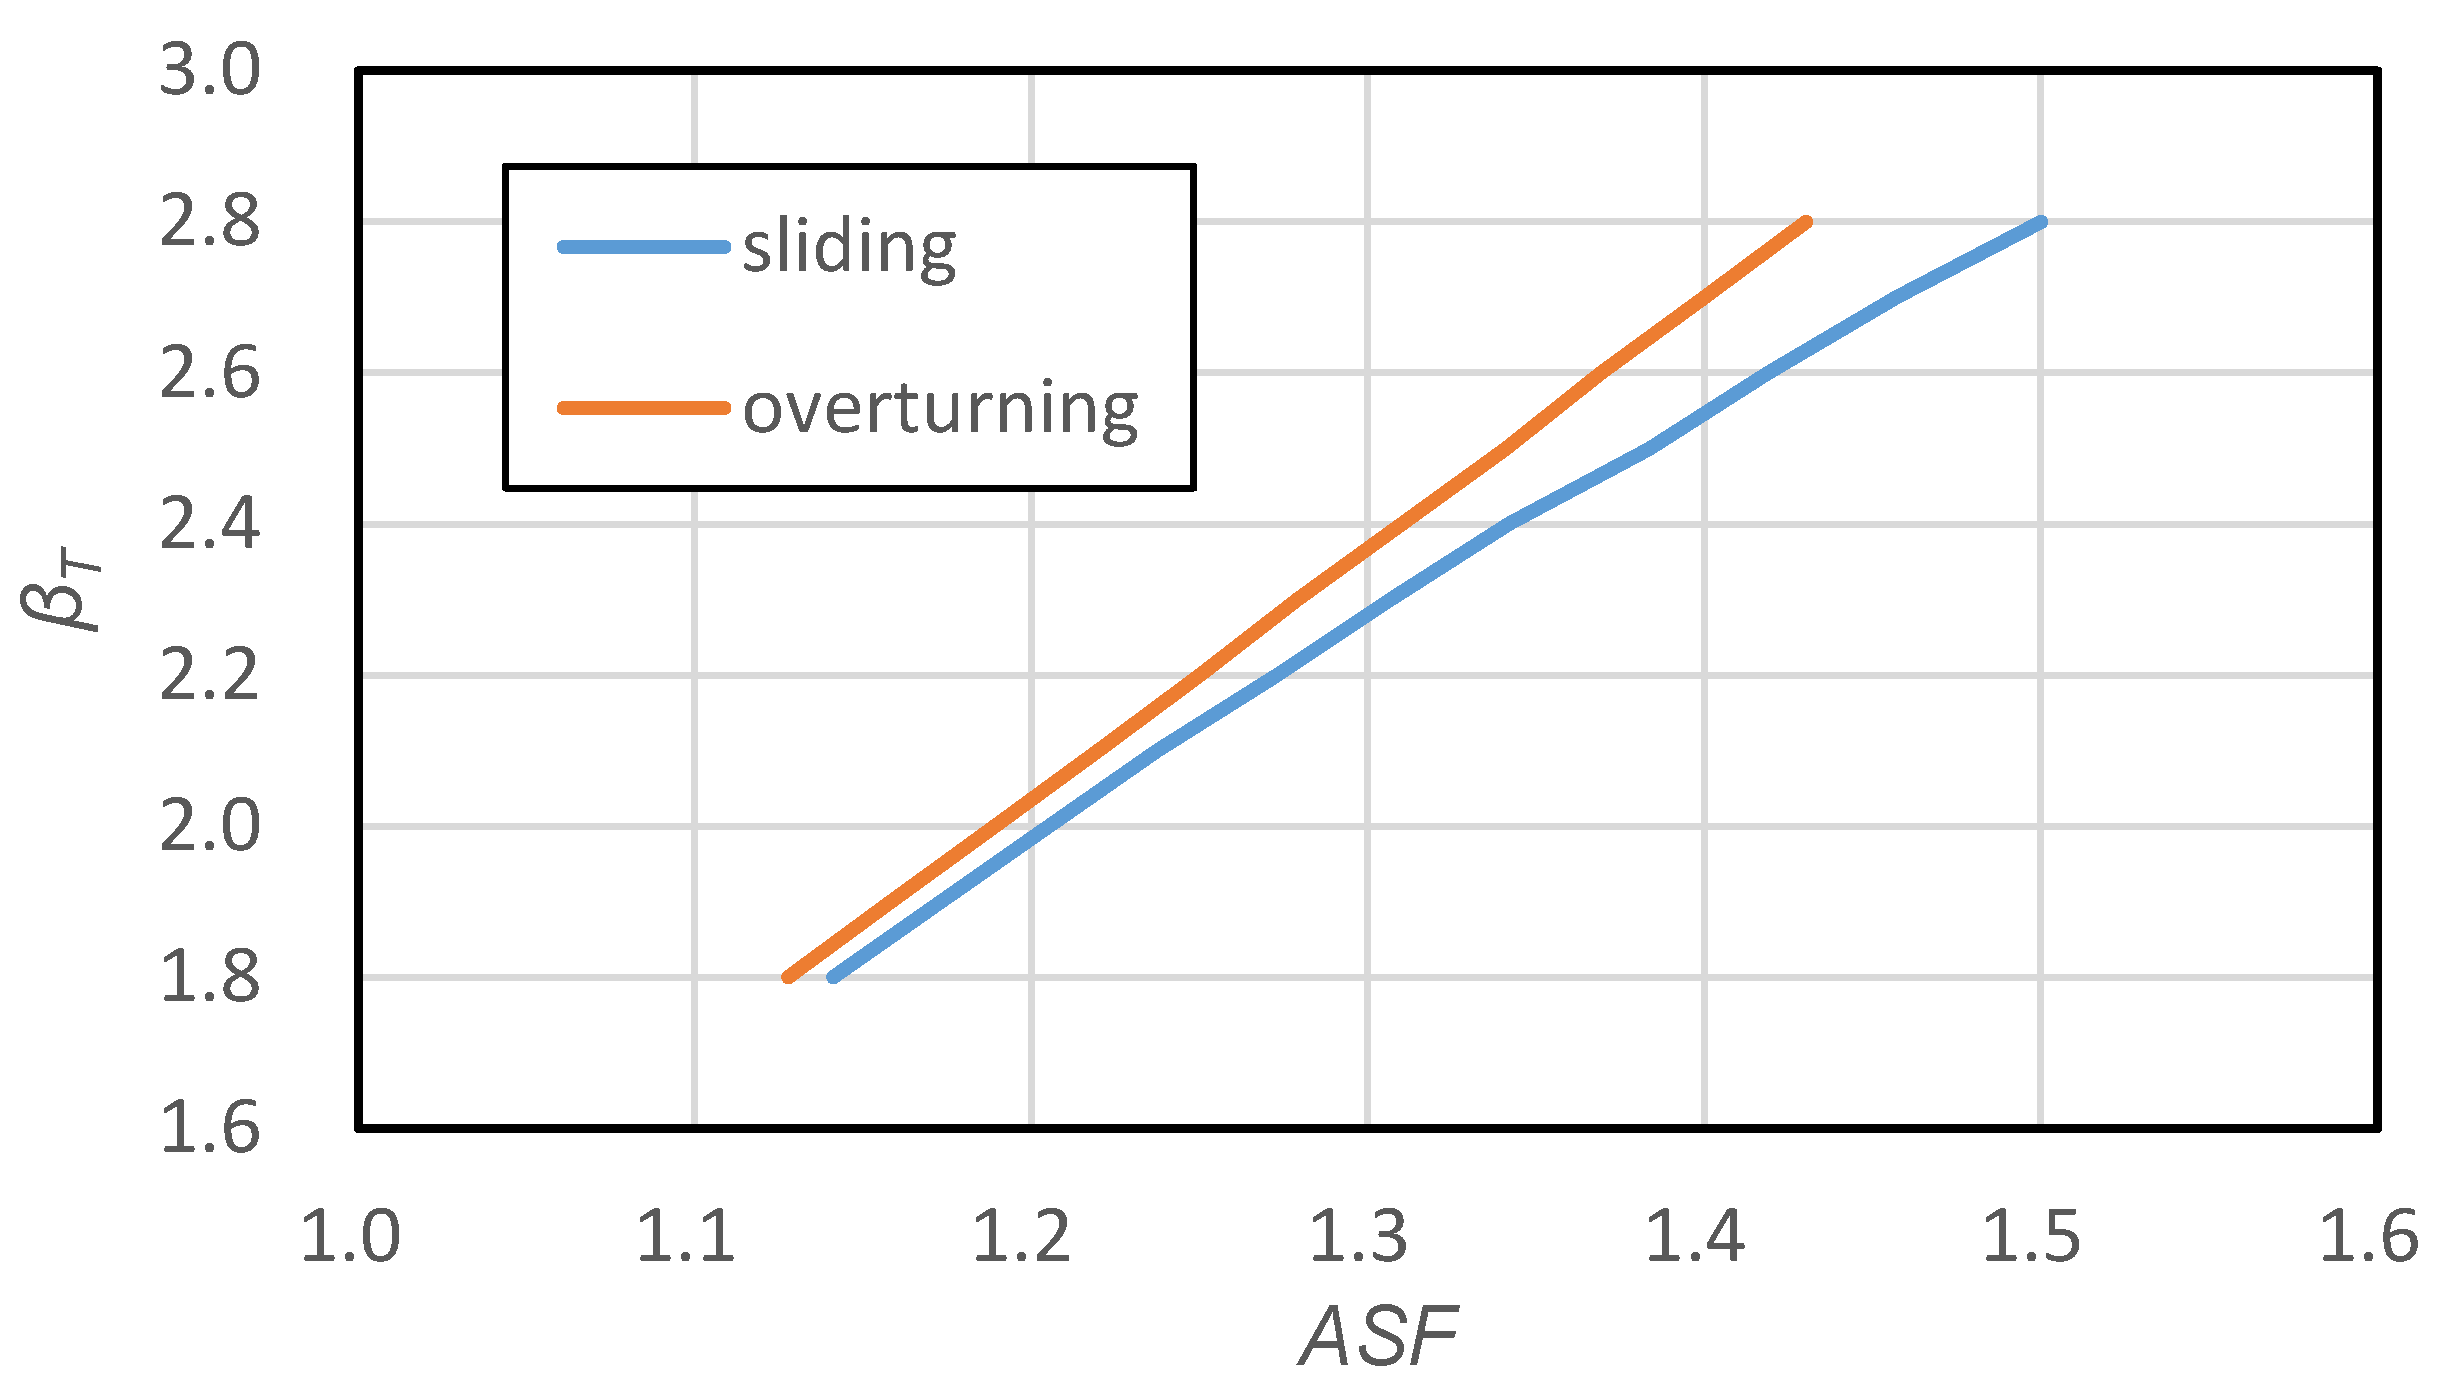
Figure 3 shows the locations of 16 breakwaters collected for this study. Five breakwaters were selected from the west coast, six from the south coast, and five from the east coast. The main design parameters of each breakwater are shown in Table 1 along with the sliding safety factor. The unit weight of seawater is 10.3 kN / m 3 , and the coefficient of friction is 0.6. Most breakwaters, except for a few such as Daesan and Saemangeum 1(SMG1), are designed with a safety factor of slightly greater than 1. Unlike others, they were designed against tsunamis and super typhoons, so their safety factors are significantly greater.
Table 2 shows the bias and the coefficient of variation (COV) used in the reliability analysis [13]. The coefficient of variation of the tide was applied differently from 0.05 to 0.20 due to the contribution and uncertainty of the astronomical and meteorological groups for the West Sea, the South Sea, and the East Sea [17]. As a result of reliability analysis using First Order Reliability Method (FORM) [18], which is a kind of Level II reliability analysis method, the reliability index and sensitivity coefficient are shown in Figure 4 and Figure 5, respectively. The sensitivity coefficient is a normalized value obtained by differentiating the limit state function with respect to the design variable. Therefore, a large sensitivity coefficient means that it is a variable with a high contribution to the failure probability. In Figure 5, the sensitivity coefficients of f c and G were relatively larger than the others. It can be confirmed that they are variables that have a high influence on the failure probability.

5. Code Calibration

Using the sensitivity coefficient ( α X ) and target reliability index ( β T ), the partial safety factor can be obtained for each random variable by the following formula [4].
γ X = ( 1 α X β T σ X   ) μ X X k
where σ X ,   μ X ,   and   X k are the standard deviation, mean, and characteristic values of design variable X , respectively. Since the sliding resistance applied by the partial safety factor method and the load resistance factor method is the same, the resistance factor ( γ R i ) can be obtained as follows.
γ R j = γ f c f c k [ γ W i W i k r w { ( γ W L W L k + h ) b + v f } γ G G k U 0 ] f c k [ W i k r w { ( W L k + h ) b + v f } G k U 0 ]     ( j = 1 , 2 , , 16 )    
The load factor can also be obtained by the following formula in the same way.
γ S i = γ G G k P 0 G k P 0 = γ G       ( i = 1 , 2 , , 16 )
The load resistance factors for the breakwaters were calculated using the target reliability index 2.3 and the sensitivity coefficients. The result is shown in Figure 6.
It is common for the resistance factor to be less than 1 and the load coefficient to be greater than 1. However, because the bias value of the variable G in Table 2 is 0.74, which is much smaller than 1, the partial safety factor of wave force using Equation (7) is less than 1, and as a result, the load factor is less than 1.
An optimization method was used to obtain a representative value of the load resistance factor to be applied to the Korean vertical caisson breakwater. The objective function and constraints of the optimization problem are as follows.
min γ R , γ S J = i = 1 N [ W β { β T β i ( γ R ,   γ S ) } 2 + W γ { ( γ R γ R i ) 2 + ( γ S γ S i ) 2 } ]
s u b j e c t   t o   β i ( γ R ,   γ S ) > β T   ( i = 1 ,   2 ,   ,   N )
In the equation, W β and W γ are the weights of each square term. β i ( γ R ,   γ S ) is the reliability index for the i-th breakwater when it was re-designed using γ R   and   γ S . γ R i and γ S i are the resistance and the load factor of the i-th original breakwater. Figure 7 shows the cost function obtained by using 0.5 for both the weights in sliding failure mode.
The objective function has two goals. The first is to make the final load resistance coefficient as close as possible to the load resistance coefficient of each breakwater, and the second is to make the reliability index of each breakwater have the minimum distance from the target reliability index. However, since the reliability index of the breakwater must be at least greater than the target value, the constraint was added.
β i ( γ R ,   γ S ) is the reliability index of the i-th breakwater designed using the load resistance factor γ R   and   γ S . If the friction resistance is increased more than necessary during redesign, safety can be satisfied, but optimization is impossible because the reliability index does not a function of the load resistance factor any more. Therefore, in order to ensure that the reliability index becomes only a function of the load resistance factor, the frictional resistance force is designed to be balanced with the external force so that a safety margin does not occur. Using this condition, the weight of the filling material can be derived as in Equation (16).
W f = γ S γ R P f c + B + U W c W r c
The reliability index of the breakwater redesigned using the optimized load resistance factor is shown in Figure 8. All the reliability indices were evaluated greater than 2.3. The smallest value is found to be 2.3039 at the Daesan breakwater. Originally, it was designed with filling material of 2265.85 (kN/m) and F s was 4.157. But it was redesigned using a load factor of 0.98 and a resistance factor of 0.75. The redesigned Daesan breakwater has a filler weight of 835.09 (kN/m) and a safety factor of 1.307.
Design equations using load resistance factor for sliding/overturning failure mode are as follows.
γ R f c ( W i B U ) γ S P
γ R ( W i x W i B x B U x U ) γ S P y P
In the above equation, γ R and γ S are the optimized factors from code calibration procedure. Those factors for different target reliability indices from 1.8 to 2.7 are shown in Table 3. In the table, γ S / γ R has the same physical meaning as the safety factor in the deterministic design method. This value can be considered as the apparent safety factor ( A S F ) when the load resistance factors are applied to breakwater design. A S F vs target reliability indices for sliding ( β T , s ) and overturning ( β T , o ) failure mode are plotted in Figure 9 and the linear regression equation can be obtained as follows.
β T , s = 2.7911 A S F 1.3634
β T , o = 3.3087 A S F 1.9333
In the current design standard, a safety factor of 1.2 is applied to both sliding and overturning failure modes. Therefore, the target reliability index of the current design criteria can be estimated using the regression equation. Using Equation (19) and (20), the target reliability indices for sliding and overturning modes are calculated as 1.986 and 2.037, respectively.

6. Conclusions

Since the load resistance factor of the LRFD method is determined by reflecting the regional characteristics of design variables, different values are used for each country. In this study, the load resistance factors were proposed by analyzing the vertical breakwater caissons in Korean. Load resistance factors according to various target reliability indices from 1.8 to 2.7 were presented so that they can be used in vertical breakwater design. If designer sets a target reliability index and then designs a breakwater using the load factor and resistance factor provided in this study, the breakwater can be designed with a reliability index greater than the target value.
The target reliability index was estimated as a function of the ratio of load factor to resistance factor. Using the estimated function, it was confirmed that the target reliability index of vertical caisson in Korea corresponding to the safety factor of 1.2 was 1.9852 and 2.0374 for sliding and overturning failure modes, respectively. Through this result, it was possible to identify the reliability level of the design standards for vertical breakwaters in Korea.

Author Contributions

Conceptualization, D.-H.K.; methodology, D.-H.K.; software, D.-H.K.; valid, I.-G.L.; formal analysis, I.-G.L.; data curation, I.-G.L.; writing—original draft preparation, D.-H.K.; writing—review and editing, D.-H.K.; supervision, D.-H.K. All authors have read and agreed to the published version of the manuscript.

Funding

This research was a part of the project titled ‘Development of Design Technology for Safe Harbor from Disasters’, funded by the Ministry of Oceans and Fisheries, Korea (No. 20180323) and also supported by Basic Science Research Program through the National Research Foundation of Korea (NRF) funded by the Ministry of Education (No. 2020R1F1A1076884).

Institutional Review Board Statement

Not applicable.

Informed Consent Statement

Not applicable.

Data Availability Statement

Not applicable.

Conflicts of Interest

The authors declare no conflict of interest.

Nomenclature

F s Safety factor
f c Friction coefficient between caisson and rubble mound
W i Weight of material i(i = c for concrete, rc for reinforced concrete, f for filler), kN
B Buoyancy, kN
r w Unit weight of seawater, kN/m3
W L Water level, m
h Depth to bottom of caisson, m
b Caisson width, m
v f Volume of front and rear heel, m3
U Uplift force, kN
U 0 Design value of uplift force, kN
P Horizontal wave force, kN
P 0 Design value of horizontal wave force, kN
P f Probability of failure
P f , T Target probability of failure
g i Limit state function of failure mode i(i = s for sliding, o for overturning mode)
f X ( x ) Probability density function
X Design random variable
β Reliability index
β T Target reliability index
β T , s Target reliability index for sliding failure mode
β T , o Target reliability index for overturning failure mode
Φ Cumulative density function of standard normal random variable
γ X Partial safety factor of design variable X
γ R Resistance factor
γ R j Resistance factor for breakwater i
γ S Load factor
γ S i Load factor for breakwater i
x W i Moment arm of self-weight, m
x B Moment arm of buoyancy, m
x U Moment arm of uplift force, m
y P Moment arm of horizontal load, m
G Uncertainty of wave pressure by Goda’s formula
α X Sensitivity of limit state function with respect to X
σ X Standard deviation of X
μ X Mean of X
X k Characteristic value of X
W β Weight of the cost by reliability index
W γ Weight of the cost by load resistance factor
N Number of breakwaters used in code calibration
A S F Apparent safety factor

References

  1. PIANC. Analysis of Rubble Mound Breakwaters; PIANC: Brussels, Belgium, 1992. [Google Scholar]
  2. Melby, J.A.; Mlakar, P.F. Reliability Assessment of Breakwater; Technical Report of US Army Corps of Engineers (CHL-97-7); US Army Corps: Washington, DC, USA, 1997. [Google Scholar]
  3. US Army Corps of Engineers. Coastal Engineering Manual (CEM), Chapter 6: Reliability Based Design of Coastal Structures; US Army Corps: Washington, DC, USA, 2006.
  4. Japanese Harbor Society. Harbor Facilities Design Code and Commentaries; Japanese Harbor Society: Tokyo, Japan, 2007. [Google Scholar]
  5. Japanese Harbor Society. Harbor Facilities Design Code and Commentaries; Japanese Harbor Society: Tokyo, Japan, 2018. [Google Scholar]
  6. Sørenson, J.D.; Kroon, I.B.; Faber, M.H. Optimal reliability code calibration. Struct. Saf. 1994, 15, 197–208. [Google Scholar] [CrossRef] [Green Version]
  7. Burcharth, H.F.; Sørensen, J.D. Design of vertical wall caisson breakwaters using partial safety factors. In Proceedings of the 26th Conference on Coastal Engineering, New York, NY, USA, 22–26 June 1998. [Google Scholar]
  8. Nagao, T. Reliability Based Design Method for Caisson Type Quay Walls; Research Report No. 2; National Institute of Land and Infrastructure Management: Tokyo, Japan, 2001. [Google Scholar]
  9. Yoshioka, T.; Nagao, T. Level 1 Reliability Based Design Method for Gravity Type Breakwaters; Research Report No. 20; National Institute of Land and Infrastructure Management: Tokyo, Japan, 2005. [Google Scholar]
  10. Sato, T.; Takenobu, M.; Miyata, M. A Basic Study of the Level 1 Reliability Design Method for Gravity-Type Breakwater; Techincal Note No. 922; National Institute of Land and Infrastructure Management: Tokyo, Japan, 2016. [Google Scholar]
  11. Takano, H.; Takenobu, M.; Miyata, M.; Sato, T. A Study of the Level 1 Reliability Design Method for Gravity-Type Breakwater with Slope; Techincal Note No. 995; National Institute of Land and Infrastructure Management: Tokyo, Japan, 2017. [Google Scholar]
  12. Kawamata, H.; Takenobu, M.; Miyata, M. A Basic Study of the Level 1 Reliability based Design Method of Circular Slip Failure Verification by Modified Fellenius’ Method; Techincal Note No. 955; National Institute of Land and Infrastructure Management: Tokyo, Japan, 2017. [Google Scholar]
  13. Kim, S.W.; Suh, K.D. Evaluation of target reliability indices and partial safety factors for sliding of caisson breakwaters. J. Coast. Res. 2011, 21, 622–626. [Google Scholar]
  14. Lee, C.E.; Kim, S.W.; Park, D.H.; Suh, K.D. Target reliability of caisson sliding of vertical breakwater based on safety factors. Coast. Eng. 2012, 60, 167–173. [Google Scholar] [CrossRef]
  15. Doan, N.S.; Huh, J.; Mac, V.H.; Kim, D.H.; Kwak, K. Calibration of Load and Resistance Factors for Breakwater Foundations under the Earthquake Loading. Sustainability 2021, 13, 1730. [Google Scholar] [CrossRef]
  16. Goda, Y. Random Seas and Design of Maritime Structures; University of Tokyo Press: Tokyo, Japan, 1985. [Google Scholar]
  17. Kim, D.H. Code Calibration of Load Resistance Factor for Limit State Design of Vertical Breakwater Caisson. In Proceedings of the Korean Society of Coast. & Ocean Engineers, Pyeong-Chang, Korea, 31 December 2019. [Google Scholar]
  18. Hasofer, A.M.; Lind, N.C. Exact and Invariant Second Moment Code Format. J. Eng. Mech. Div. 1974, 100, 111–121. [Google Scholar] [CrossRef]
Figure 1. Caisson and force equilibrium: (a) component forces; and (b) load and resistance force.
Jmse 10 00468 g001
Figure 2. Flowchart for code calibration of breakwater.
Jmse 10 00468 g002
Figure 3. Location of vertical caisson breakwaters (the numbers refer to Table 1).
Jmse 10 00468 g003
Figure 4. Reliability indices of breakwater (sliding).
Jmse 10 00468 g004
Figure 5. Sensitivities of limit state function (sliding).
Jmse 10 00468 g005
Figure 6. Sensitivities of limit state function (sliding).
Jmse 10 00468 g006
Figure 7. Cost in load & resistance factor space (sliding).
Jmse 10 00468 g007
Figure 8. Reliability indices after redesign (sliding).
Jmse 10 00468 g008
Figure 9. ASF vs. target reliability index.
Jmse 10 00468 g009
Table 1. Design values for 16 breakwaters (dim: kN, m).
NoName W c W r c W f P U b W L v f h F s
1Gamcheon1696.731500.443371.61673.88760.4417.01.285.713.01.165
2Daesan622.66947.742265.85301.2038.309.08.261.810.04.157
3Donghae2152.711341.113364.561828.64818.9019.20.39010.51.275
4Okgye1569.891370.874766.921247.36494.5518.00.453.1515.02.076
5Onsan505.41134.172560.46668.67179.1812.00.612.013.52.025
6Ulsan1308.381098.93526.021490.88530.7015.00.662.615.01.190
7Incheon473.45907.331946.6369.5737.678.09.272.29.02.860
8Pohang1029.98704.111841.76970.69436.5613.60.24608.01.226
9Gunsan1081.231284.13792.071554.57645.5316.07.2461.76.51.246
10SMG12088.661338.467381.171247.06444.4817.77.411.3511.03.365
11SMG21150.131049.683532.51156.36335.0313.57.411.359.51.573
12MD984.72808.41653.72637.65277.9612.02.2307.01.908
13Yeosu379.82618.391134.95406.3652.037.05.41.75.91.844
14Jodo2208.651411.154752.352017.99978.1120.01.445.015.51.146
15Jeju2099.942003.945279.122027.67625.5420.03.833.215.01.434
16Aeweol2277.281779.036406.182819.411292.0323.42.8585.010.51.255
Table 2. Distribution characteristics.
SymbolBias FactorCOVSymbolBias FactorCOV
f c 1.060.15 W f 1.020.04
W c 1.020.02 W L 1.000.05/0.12/0.20
W r c 0.980.02 G 0.740.239
Table 3. Load resistance factors according to target reliability index.
β T P f , T SlidingOverturning
γ R γ S γ S / γ R γ R γ S γ S / γ R
1.800.03590.850.971.1410.941.061.128
1.900.02870.810.951.1730.951.101.158
2.000.02280.780.941.2050.901.071.189
2.100.01790.800.991.2380.911.111.220
2.200.01390.770.981.2730.921.151.250
2.300.01070.750.981.3070.861.101.279
2.400.00820.761.021.3420.871.141.310
2.500.00620.731.011.3840.881.181.341
2.600.00470.741.051.4190.841.151.369
2.700.00350.701.021.4570.851.191.400
Publisher’s Note: MDPI stays neutral with regard to jurisdictional claims in published maps and institutional affiliations.

