
Effects of Suspended Particles on Exopolysaccharide Secretion of Two Microalgae in Jinjiang Estuary (Fujian, China)

Abstract
:1. Introduction
2. Materials and Methods
2.1. Experimental Materials
2.2. Experimental Methods
2.2.1. Determination Parameters of SP
2.2.2. SP Stock
2.2.3. Microalgae Cultivation
2.2.4. Preliminary Experiment
2.2.5. Experimental Design
2.2.6. Determination of Glucose Standard Curve
2.2.7. Determination of EPS Content
2.3. Data Analysis
3. Results
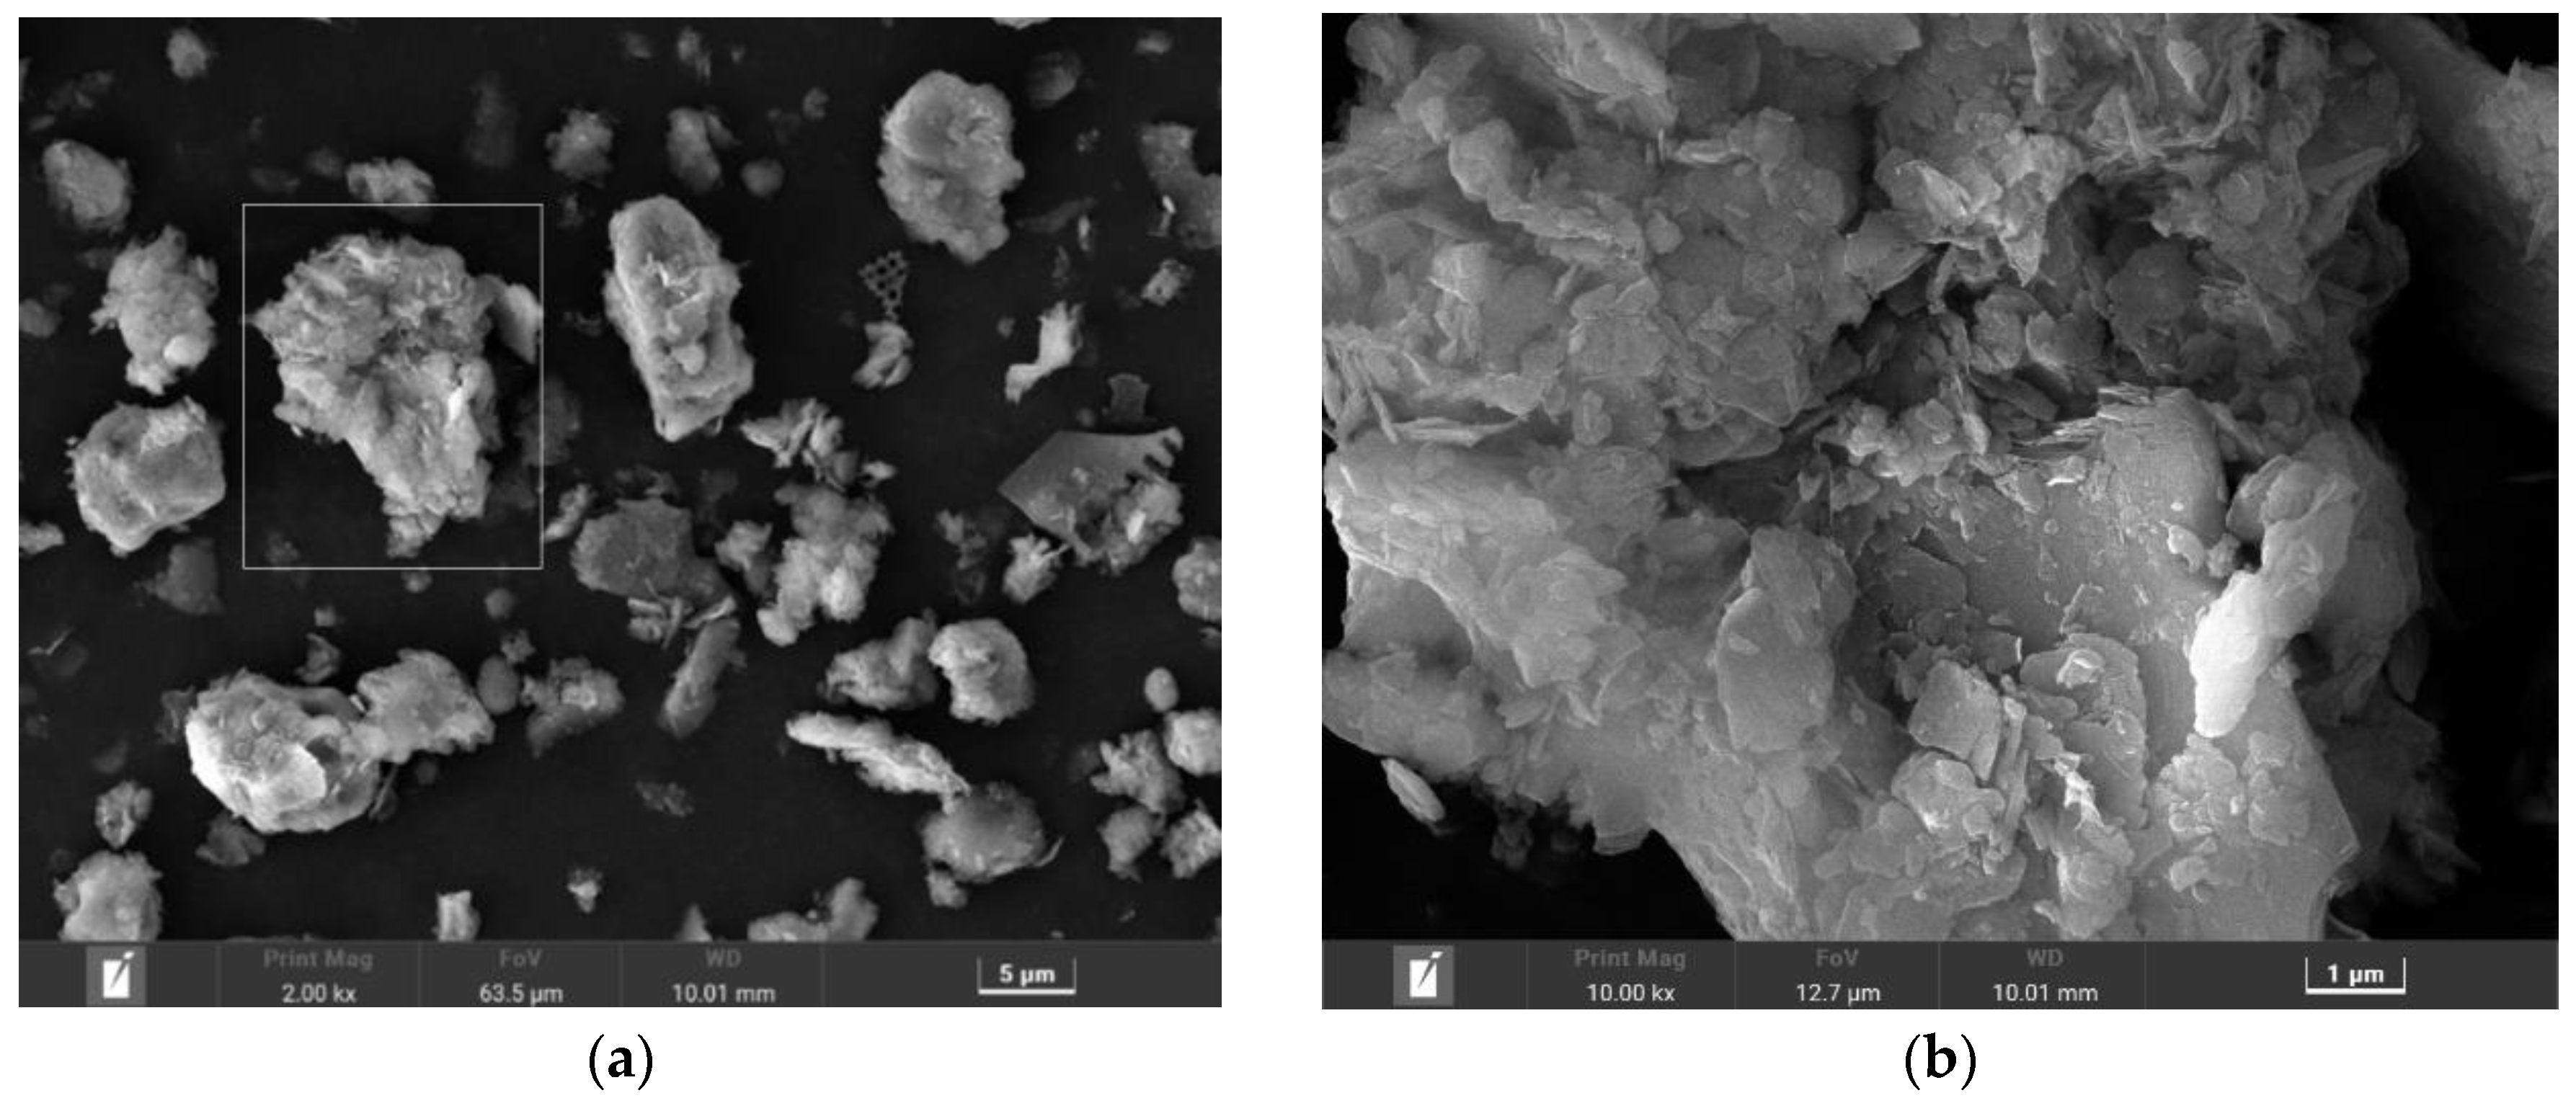
3.1. SP Parameters
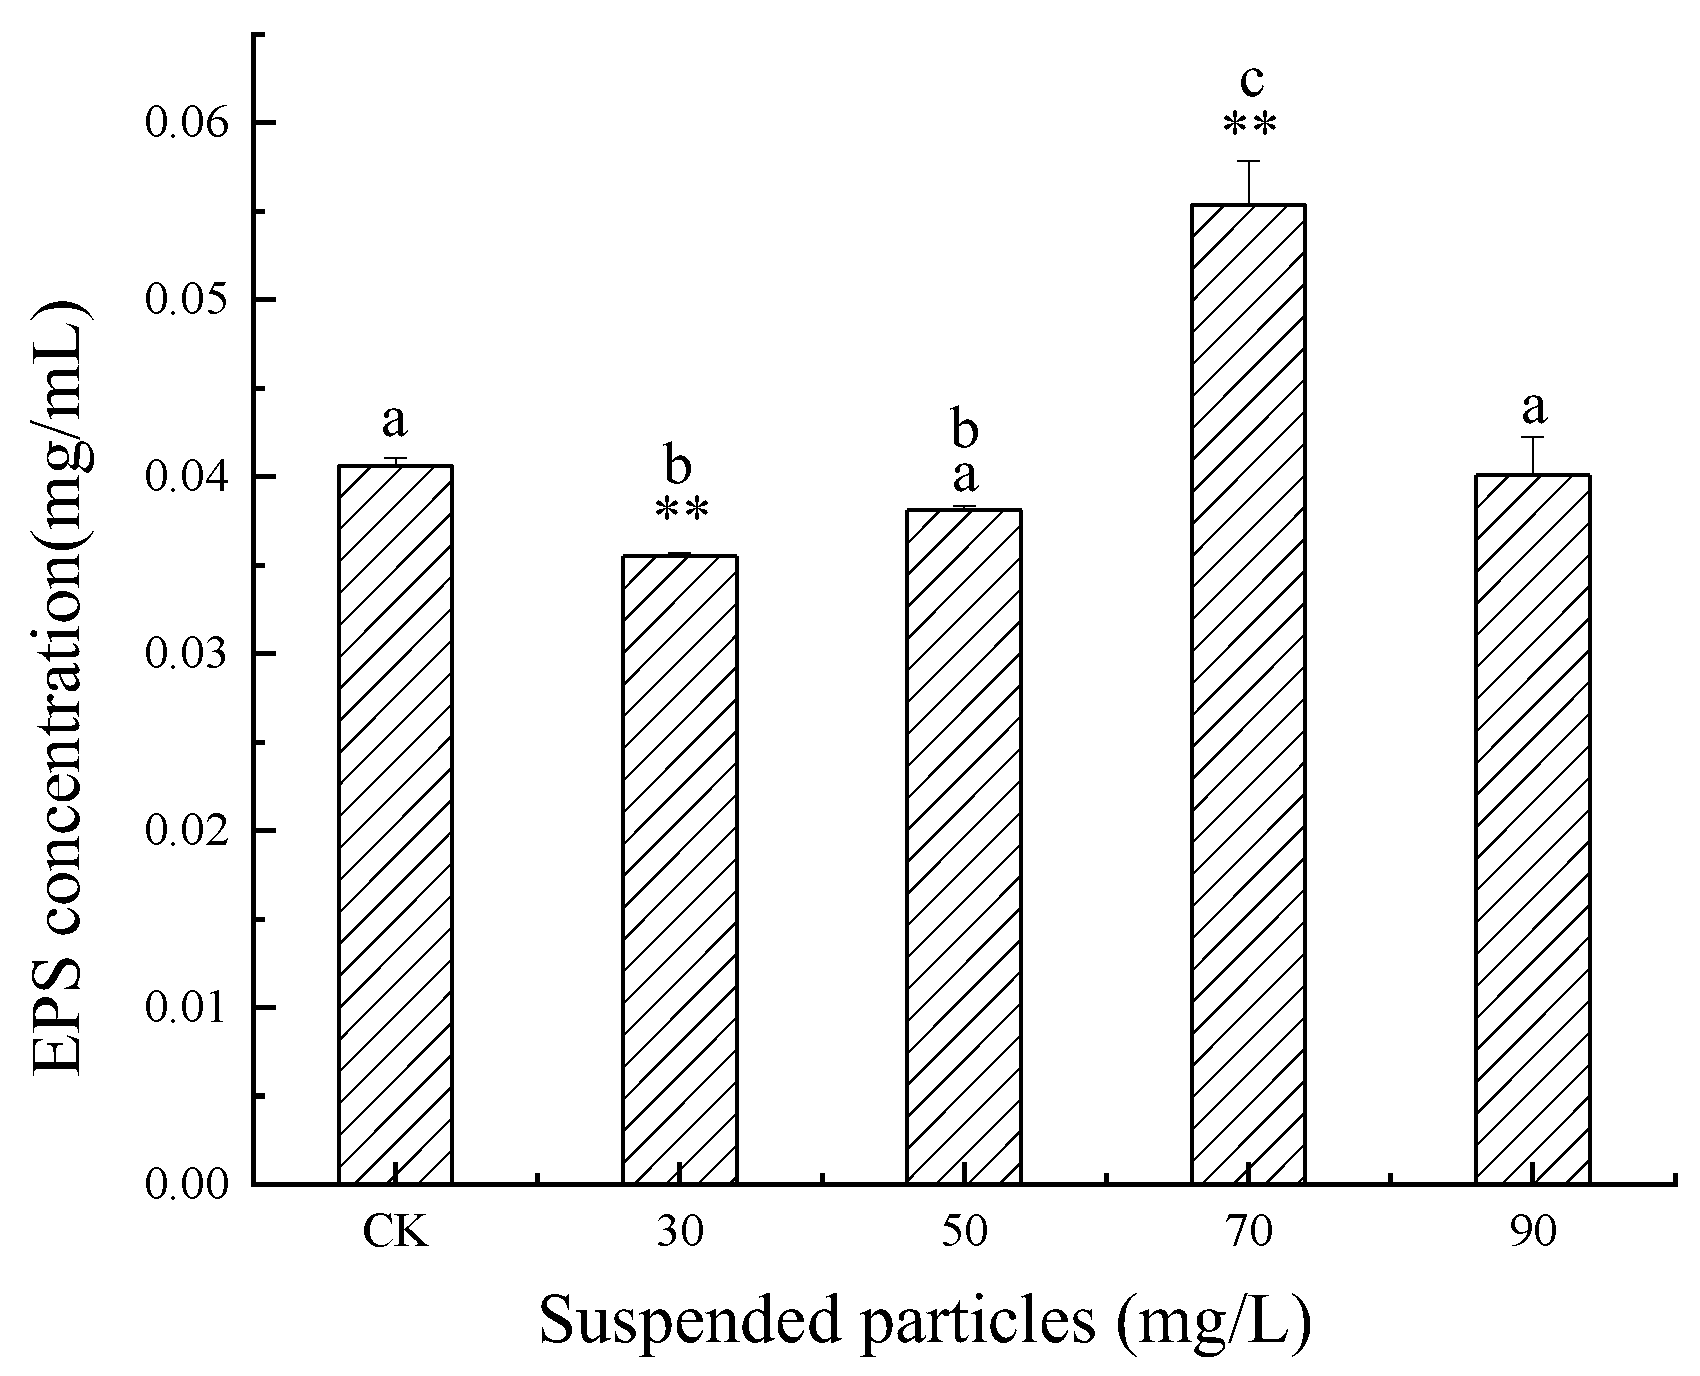
3.2. Influence of SP of Different Concentrations on EPS Content of C. pyrenoidosa in Jinjiang Estuary
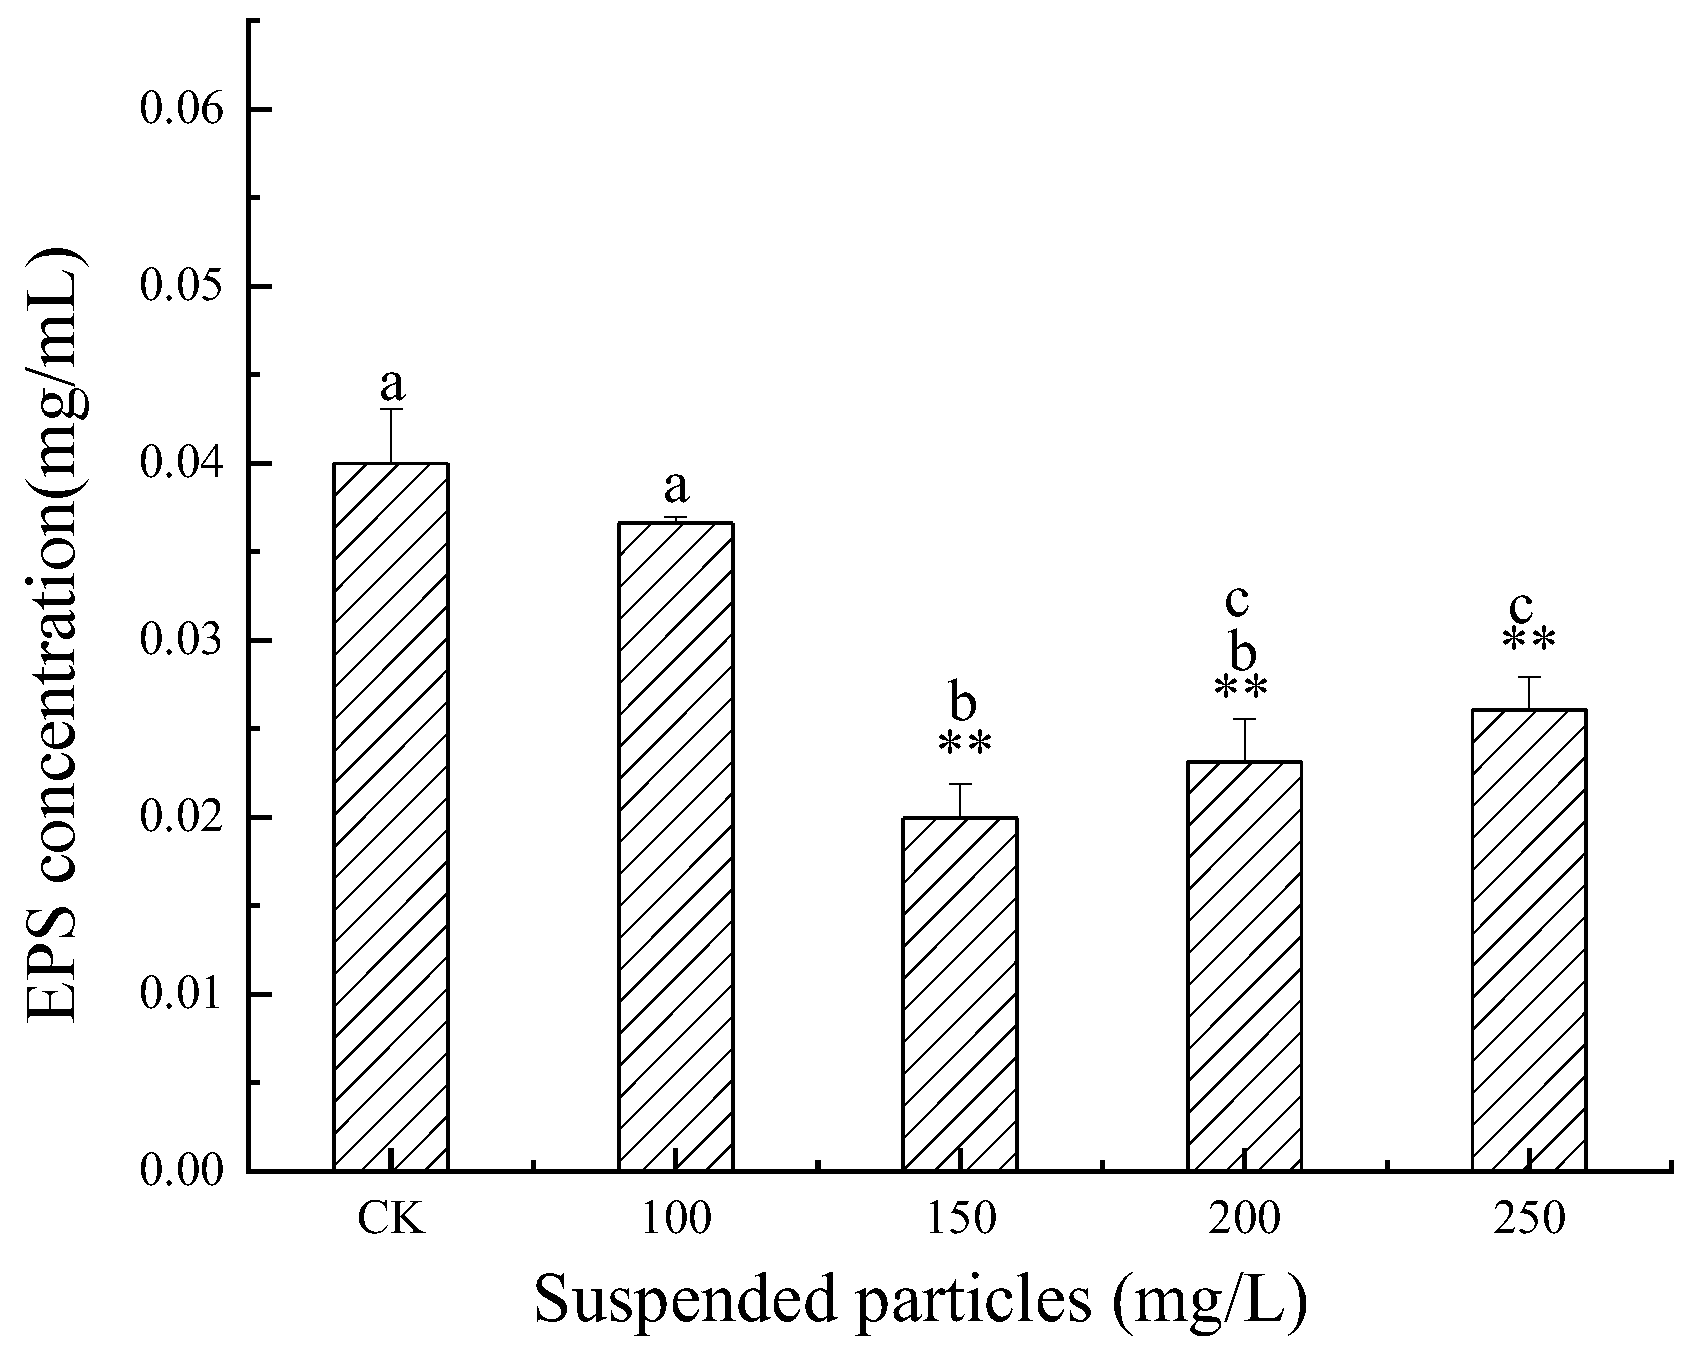
3.3. Influence of SP of Different Concentrations on the EPS Content of M. flos-aquae in Jinjiang Estuary
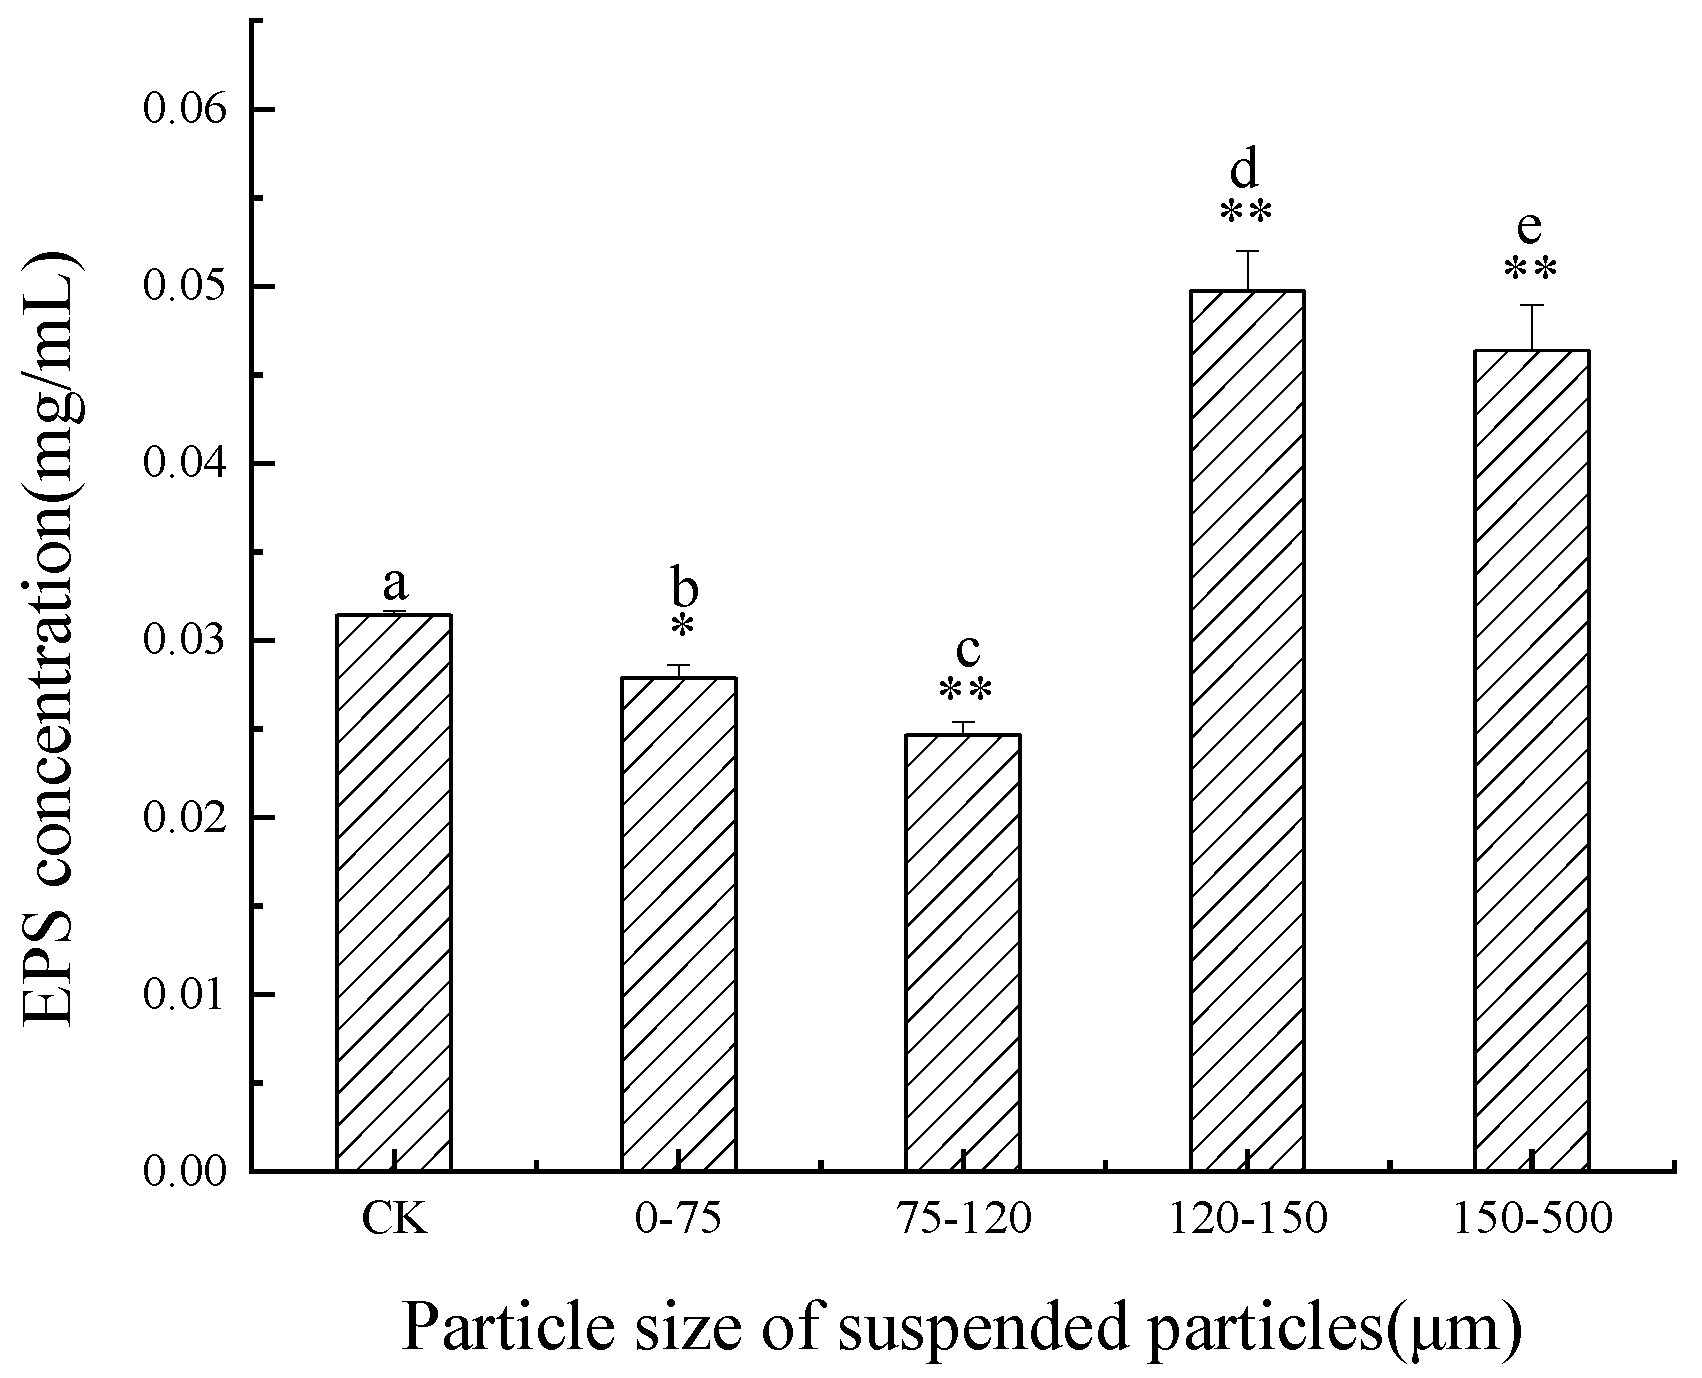
3.4. Influence of SP of Different Particle Sizes on EPS Content of C. pyrenoidosa in Jinjiang Estuary
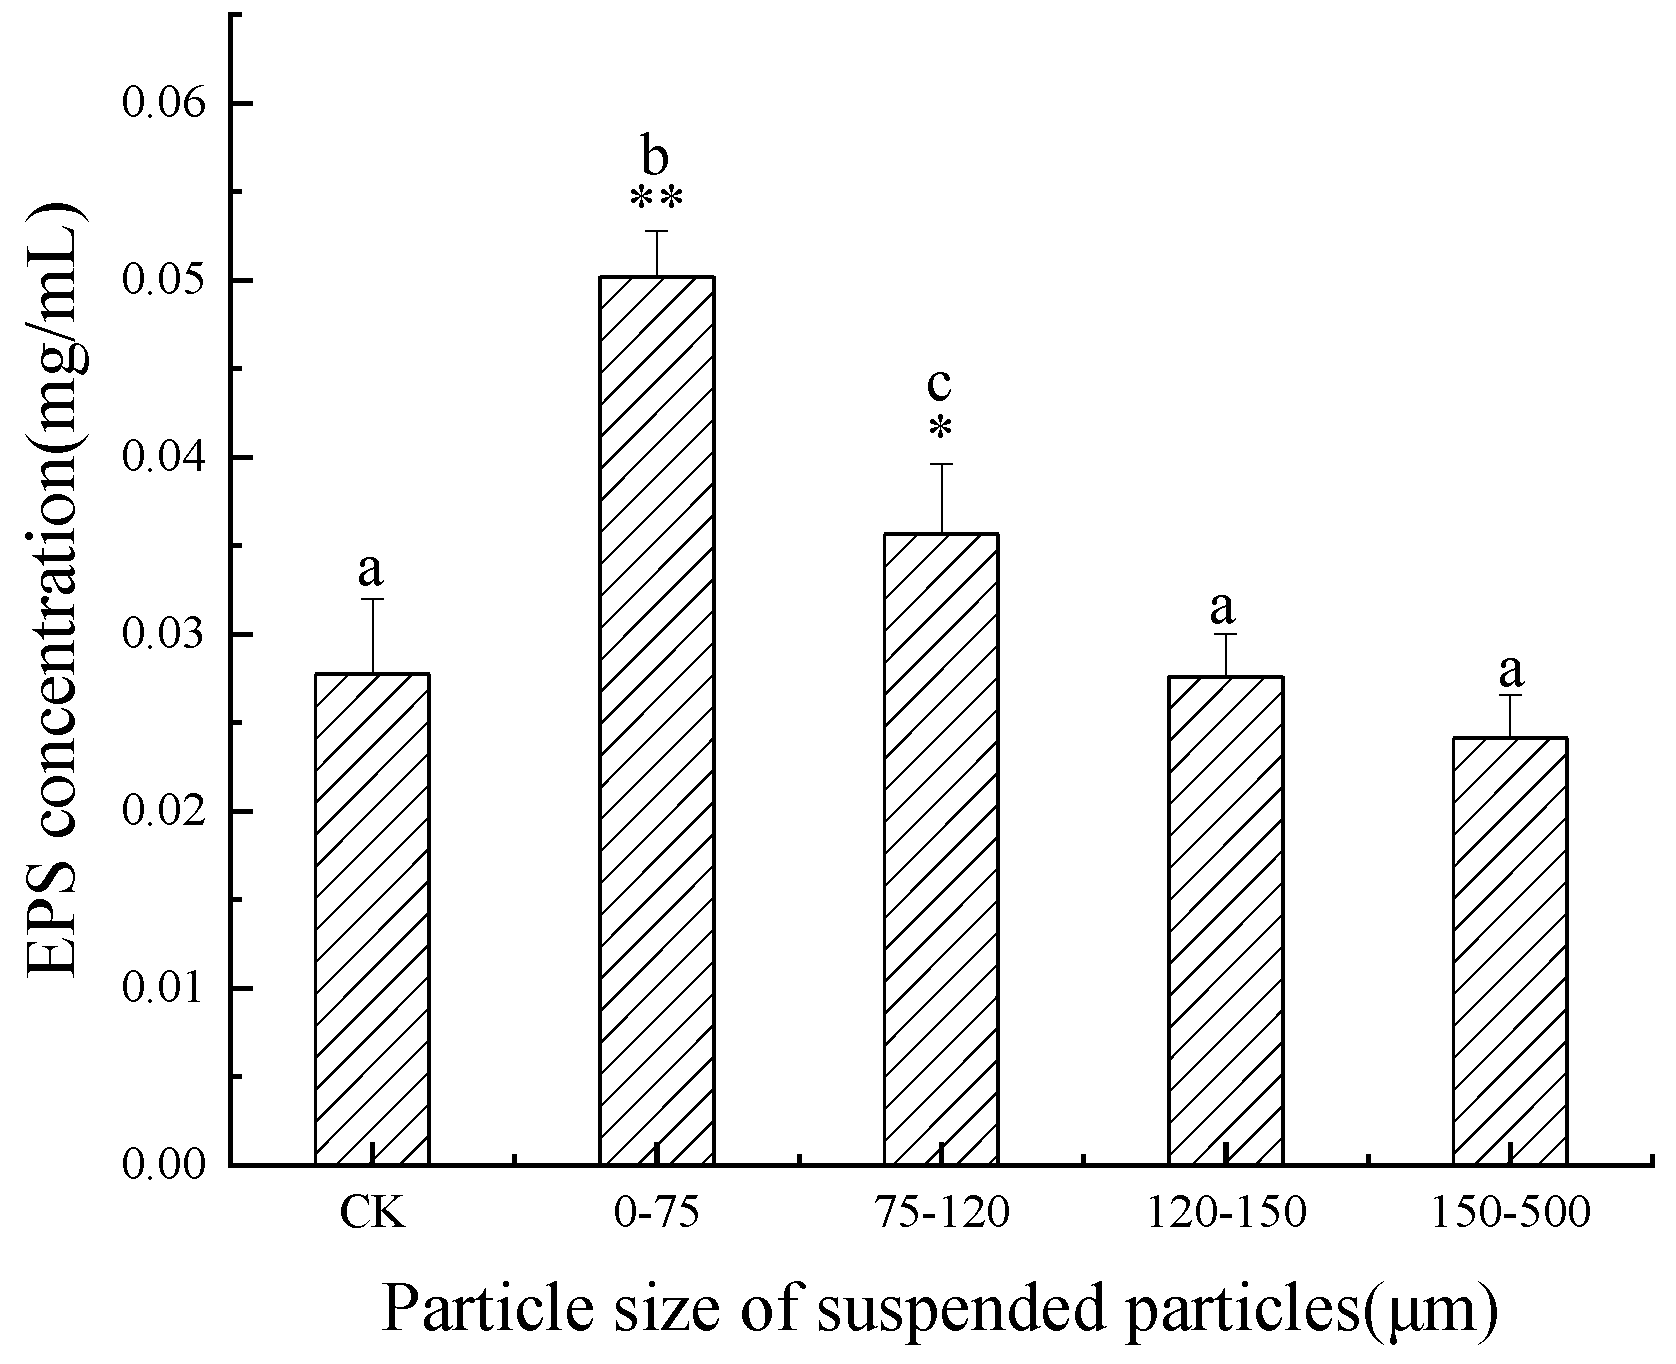
3.5. Influence of SP of Different Particle Sizes on the EPS Content of M. flos-aquae in the Jinjiang Estuary
3.6. The Light Attenuation Coefficient(kd) by SP of Different Concentrations and EPS per Unit Chlorophyll A of C. pyrenoidosa and M. flos-aquae
4. Discussion
4.1. Effects of SP of Different Concentrations on EPS Secretion of C. pyrenoidosa and M. flos-aquae
4.2. Effects of SP of Different Particle Sizes on EPS Secretion of C. pyrenoidosa and M. flos-aquae
5. Conclusions
- The effect of SP concentration on the EPS of C. pyrenoidosa was “inhibit-promote-inhibit”, that is, there was an optimal concentration of SP on the EPS secretion of C. pyrenoidosa;
- SP in a particular concentration range (0–100 mg/L) had no significant effect on the EPS content of M. flos-aquae. When the particles exceeded a specific critical concentration (150 mg/L), the EPS secretion of M. flos-aquae was inhibited;
- A small particle size did not promote the secretion of EPS from C. pyrenoidosa. By contrast, large particle size promoted the secretion of EPS from C. pyrenoidosa, with the maximum effect observed for 120–150 μm particle size;
- A small particle size promoted the secretion of EPS from M. flos-aquae, but the effect gradually weakened with the increase in particle size.
Supplementary Materials
Author Contributions
Funding
Institutional Review Board Statement
Informed Consent Statement
Acknowledgments
Conflicts of Interest
References
- Capriulo, G.M.; Smith, G.; Troy, R.; Wikfors, G.H.; Pellet, J.; Yarish, C. The planktonic food web structure of a temperate zone estuary, and its alteration due to eutrophication. Hydrobiologia 2002, 475–476, 263–333. [Google Scholar] [CrossRef]
- Chai, C.; Yu, Z.M.; Song, X.X.; Shen, Z.L. Exploratory data analysis to the study of eutrophication in the Yangtze River Estuary, China. Environ. Sci. 2007, 28, 53–58. [Google Scholar]
- Bricker, S.B.; Longstaff, B.; Dennison, W.; Jones, A.; Boicourt, K.; Wicks, C.; Woerner, J. Effects of nutrient enrichment in the nation’s estuaries: A decade of change. Harmful Algae 2008, 8, 21–32. [Google Scholar] [CrossRef]
- Liu, L.; Yang, J.; Lv, H.; Yu, X.Q.; Wilkinson, D.M.; Yang, J. Phytoplankton communities exhibit a stronger response to environmental changes than bacterioplankton in three subtropical reservoirs. Environ. Sci. Technol. 2015, 49, 10850–10858. [Google Scholar] [CrossRef] [PubMed]
- Islam, M.N.; Kitazawa, D.; Kokuryo, N.; Tabeta, S.; Honma, T.; Komatsu, N. Numerical modeling on transition of dominant algae in Lake Kitaura, Japan. Ecol. Model. 2012, 242, 146–163. [Google Scholar] [CrossRef]
- Kravtsova, L.S.; Izhboldina, L.A.; Khanaev, I.V.; Pomazkina, G.V.; Rodionova, E.V.; Domysheva, V.M.; Sakirko, M.V.; Tomberg, I.V.; Kostornova, T.Y.; Kravchenko, O.S.; et al. Nearshore benthic blooms of filamentous green algae in Lake Baikal. J. Great Lakes Res. 2014, 40, 441–448. [Google Scholar] [CrossRef]
- Yerli, S.V.; Kivrak, E.; Gurbuz, H.; Manav, E.; Mangit, F.; Turkecan, O. Phytoplankton community, nutrients and chlorophyll a in Lake Mogan (Turkey): With comparison between current and old data. Turk. J. Fish. Aquat. Sci. 2012, 12, 95–104. [Google Scholar] [CrossRef]
- Nie, L.; Yang, X.D.; Liao, B.L.; Han, J. Impact of different environmental factors on growth and polysaccharides characteristics of Nostoc commune Vauch from Shenzhen seashore. Hubei Agric. Sci. 2018, 57, 58–61. [Google Scholar]
- Xiang, X.H.; Liu, M.Q. Research progress on the structure and functional application of cyanobacteria exopolysaccharides. Technol. Manag. 2018, 51–52. [Google Scholar]
- Mou, X.Y. The Isotopic Composition of Carbon and Nitrogen in Suspended Particulate Organic Matter in the Daya Bay and the Jiaozhou Bay. MSc Thesis, Xiamen University, Xiamen, China, 2018. [Google Scholar]
- Bilotta, G.S.; Brazier, R.E. Understanding the influence of suspended solids on water quality and aquatic biota. Water Res. 2008, 42, 2849–2861. [Google Scholar] [CrossRef]
- Valeria, H.R.; Gutow, L.; Thompson, R.C.; Thiel, M. Microplastics in the marine environment: A review of the methods used for identification and quantification. Environ. Sci. Technol. 2012, 46, 3060–3075. [Google Scholar]
- Bhaskar, P.V.; Grossart, H.P.; Bhosle, N.B.; Simon, M. Production of macroaggregates from dissolved exopolymeric substances (EPS) of bacterial and diatom origin. Fems Microbiol. Ecol. 2005, 53, 255–264. [Google Scholar] [CrossRef] [PubMed]
- Fettweis, M.; Baeye, M. Seasonal variation in concentration, size, and settling velocity of muddy marine flocs in the benthic boundary layer. J. Geophys. Res. Ocean. 2015, 120, 5648–5667. [Google Scholar] [CrossRef] [Green Version]
- Manning, A.J.; Schoellhamer, D.H. Factors controlling floc settling velocity along a longitudinal estuarine transect. Mar. Geol. 2013, 345, 266–280. [Google Scholar] [CrossRef]
- Li, W.H.; Xu, H.Q. Estimation of suspended solids in the Jin River through bio-optical model-based remote sensing technology. Acta Sci. Circumstantiae 2009, 29, 1113–1120. [Google Scholar]
- Birk, S.; Bonne, W.; Borja, A.; Brucet, S.; Courrat, A.; Poikane, S.; Solimini, A.; van de Bund, W.; Zampoukas, N.; Hering, D. Three hundred ways to assess europe’s surface waters: An almost complete overview of biological methods to implement the water framework directive. Ecol. Indic. 2012, 18, 31–41. [Google Scholar] [CrossRef]
- Wu, Y.M.; Guo, P.Y.; Zhang, X.Y.; Zhang, Y.X.; Xie, S.T.; Deng, J. Effect of microplastics exposure on the photosynthesis system of freshwater algae. J. Hazard. Mater. 2019, 374, 219–227. [Google Scholar] [CrossRef] [PubMed]
- Chen, S.; Li, J.Y.; Feng, W.B.; Yuan, M.Z.; Zhang, W.; Xu, H.T.; Zheng, X.Y.; Wang, L.Q. Biochemical responses of the freshwater microalga Dictyosphaerium sp. upon exposure to three sulfonamides. J. Environ. Sci. 2020, 97, 141–148. [Google Scholar] [CrossRef]
- Wang, J.J.; Chen, R.; Fan, L.; Cui, L.L.; Zhang, Y.J.; Cheng, J.J.; Wu, X.L.; Zeng, W.M.; Tian, Q.H.; Shen, L. Construction of fungi-microalgae symbiotic system and adsorption study of heavy metal ions. Sep. Purif. Technol. 2021, 268, 118689. [Google Scholar] [CrossRef]
- Lv, J.P.; Zhao, F.; Feng, J.; Liu, Q.; Nan, F.R.; Liu, X.D.; Xie, S.L. The impact of particulate and soluble organic matter on physicochemical properties of extracellular polymeric substances in a microalga Neocystis mucosa SX. Algal Res. 2020, 51, 102064. [Google Scholar] [CrossRef]
- Zobeck, T.M. Rapid soil particle size analyses using laser diffraction. Appl. Eng. Agric. 2004, 20, 633–639. [Google Scholar] [CrossRef]
- Lu, X.X.; Song, J.M.; Li, X.G.; Yuan, H.M.; Zhan, T.R.; Li, N.; Gao, X.L. Geochemical characteristics of nitrogen in the southern Yellow Sea surface sediments. J. Mar. Syst. 2005, 56, 17–27. [Google Scholar] [CrossRef]
- Lu, D.; Guo, P.Y.; Jie, J.F.; Liu, L.P.; Yang, P. Evaluation of phosphorus distribution and bioavailability in sediments of a subtropical wetland reserve in southeast China. Ecol. Indic. 2016, 66, 556–563. [Google Scholar] [CrossRef]
- Hou, X.F.; Guo, P.Y.; Zhang, H.X.; Lu, D. Effects of water suspended particulate matter on the physiological and photosynthetic activity of Scenedesmus obliquus. Acta Sci. Circumstantiae 2013, 33, 1446–1457. [Google Scholar]
- Li, H.; Yao, J.; Duran, R.; Liu, J.L.; Min, N.; Chen, Z.H.; Zhu, X.Z.; Zhao, C.C.; Ma, B.; Pang, W.C.; et al. Toxic response of the freshwater green algae Chlorella pyrenoidosa to combined effect of flotation reagent butyl xanthate and nickel. Environ. Pollut. 2021, 286, 117285. [Google Scholar] [CrossRef] [PubMed]
- Chalifour, A.; Chin, W.Y.; Leung, P.Y.; Cheung, S.G.; Tam, N.F.-Y. Effect of light on the transformation of BDE-47 by living and autoclaved cultures of Microcystis flos-aquae and Chlorella Vulgaris. Chemosphere 2019, 233, 140–148. [Google Scholar] [CrossRef]
- Dubois, M.; Gilles, K.A.; Hamilton, J.K.; Rebers, P.A.; Smith, F. Colorimetric method for determination of sugars and related substances. Anal. Chem. 1956, 28, 350–356. [Google Scholar] [CrossRef]
- Dong, Q.; Zheng, L.Y.; Fang, J.N. Modified phenol-sulfuric acid method for determination of the content of oligo- and polysaccharides. Chin. Pharm. J. 1996, 31, 550–553. [Google Scholar]
- Hu, B.; Guo, P.Y.; Wu, Y.Q.; Deng, J.; Su, H.T.; Li, Y.Q.; Nan, Y.T. Study of soil physicochemical properties and heavy metals of a mangrove restoration wetland. J. Clean. Prod. 2021, 291, 125965. [Google Scholar] [CrossRef]
- Li, W.H. Retrieval of Euphotic Zone Depth of Jin River by Remote Sensing Technology. J. Subtrop. Resour. Environ. 2009, 4, 64–72. [Google Scholar]
- Renaud, S.M.; Thinh, L.V.; Lambrinidis, G.; Parry, D.L. Effect of temperature on growth, chemical composition and fatty acid composition of tropical Australian microalgae grown in batch cultures. Aquaculture 2002, 211, 195–214. [Google Scholar] [CrossRef]
- Gu, B.; Zhang, D.J.; Wang, Y.; Bao, Z.M.; Wang, X.Y.; Yu, H.J. Effects of iron on the growth and soluble protein and extracellular polysaccharide contents of Porphyridium cruentum. Jiangsu Agric. Sci. 2017, 45, 159–162. [Google Scholar]
- Li, P.F.; Liu, Z.L.; Ge, H.T.; Shen, R.J.; Shen, H. Effects of salinity and nutritional limitation on the growth and exopolysaccharide production of Aphanothece halophytica. J. Nanjing Univ. 2000, 36, 585–591. [Google Scholar]
- An, Q.; Li, X.Q.; Wang, S.; Huang, X.L.; Jiang, Y.Q. Effects of environmental factors on Microcystis aeruginosa colony formation and morphological characteristics in Three Gorges Reservoir. J. Lake Sci. 2017, 29, 378–388. [Google Scholar]
- Wang, M.X. Study the Response of Freshwater Microalgae to Suspended Particles, Antibiotics and Combined Stress. MSc Thesis, Huaqiao University, Xiamen, China, 2017. [Google Scholar]
- Boxall, A.B.; Kolpin, D.W.; Halling-Sørensen, B.; Tolls, J. Are veterinary medicines causing environmental risks? Environ. Sci. Technol. 2003, 37, 286A–294A. [Google Scholar] [CrossRef] [PubMed] [Green Version]
- Qian, H.F.; Li, J.J.; Pan, X.J.; Sun, Z.Q.; Ye, C.B.; Jin, G.Q.; Fu, Z.W. Effects of streptomycin on growth of algae Chlorella vulgaris and Microcystis aeruginosa. Environ. Toxicol. 2012, 27, 229–237. [Google Scholar] [CrossRef] [PubMed]
- He, W.S.; Lu, J.J. Effects of high-density suspended sediments on primary production at the Yangtze Estuary. Chin. J. Eco-Agric. 2001, 9, 24–27. [Google Scholar]
- Gong, L.; Zhong, C.H.; Deng, C.G. Effect of suspended sand particles on growth of algae in aquatic system. J. Agro-Environ. Sci. 2006, 25, 687–689. [Google Scholar]
- Xu, J.T.; Hood, R.R.; Chao, S.Y. A simple empirical optical model for simulating light attenuation variability in a partially mixed estuary. Estuaries 2005, 28, 572–580. [Google Scholar] [CrossRef]
- Parker, D.L.; Schram, B.R.; Plude, J.L.; Moore, R.E. Effect of metal cations on the viscosity of a pectin-like capsular polysaccharide from the cyanobacterium Microcystis flos-aquae C3-40. Appl. Environ. Microbiol. 1996, 62, 1208–1213. [Google Scholar] [CrossRef] [Green Version]
- Gou, Y.G.; Tian, W.; Yang, G.J.; Zhang, H.L.; Tang, X.M. Effect of disturbance on the concentrations of algal extracellular polysaccharide in Lake Taihu. Res. Environ. Sci. 2020, 33, 1830–1837. [Google Scholar]
- Qin, B.Q.; Yang, G.J.; Ma, J.R.; Wu, T.F.; Li, W.; Liu, L.Z.; Deng, J.M.; Zhou, J. Spatiotemporal changes of cyanobacterial bloom in large shallow eutrophic Lake Taihu, China. Front. Microbiol. 2018, 9, 451. [Google Scholar] [CrossRef] [PubMed]
- Tian, H.Z.; Liu, Q.P.; Goes, J.I.; Gomes, H.D.R.; Yang, M.M. Temporal and spatial changes in chlorophyll-a concentrations in the Yellow Sea from 2002 to 2018 based on MODIS data. Mar. Sci. Bull. 2020, 39, 101–110. [Google Scholar]


| SP Addition | Concentration (mg/L) & Particle Size (μm) | ||||
|---|---|---|---|---|---|
| C. pyrenoidosa | CK & 75–120 | 30 & 75–120 | 50 & 75–120 | 70 & 75–120 | 90 & 75–120 |
| M. flos-aquae | CK & 75–120 | 100 & 75–120 | 150 & 75–120 | 200 & 75–120 | 250 & 75–120 |
| C. pyrenoidosa | 30 & CK | 30 & 0–75 | 30 & 75–120 | 30 & 120–150 | 30 & 150–500 |
| M. flos-aquae | 100 & CK | 100 & 0–75 | 100 & 75–120 | 100 & 120–150 | 100 &150–500 |
| Clay (<2 μm) | Silt (2–20 μm) | Sand (>20 μm) | Organic Matter (mg·kg−1) | TN (mg·kg−1) | TP (mg·kg−1) |
|---|---|---|---|---|---|
| 4.34% ± 1.63% | 78.37% ± 1.14% | 17.26% ± 2.69% | 21.29 ± 7.9 | 388.49 ± 59.14 | 549.70 ± 8.43 |
| C. pyrenoidosa | CK | 30 mg/L | 50 mg/L | 70 mg/L | 90 mg/L |
|---|---|---|---|---|---|
| Kd | 0.00 | 1.94 | 2.92 | 3.82 | 4.67 |
| EPS per unit Chlorophyll a ×10−6 (mg/mg) | 4.16 | 4.22 | 5.19 | 7.76 | 5.50 |
| M. flos-aquae | CK | 100 mg/L | 150 mg/L | 200 mg/L | 250 mg/L |
| Kd | 0.00 | 5.08 | 7.03 | 8.85 | 10.58 |
| EPS per unit Chlorophyll a ×10−5 (mg/mg) | 13.90 | 12.99 | 7.33 | 8.85 | 9.78 |
| EPS per Unit Chlorophyll A (mg/mg) | CK | 0–75 μm | 75–120 μm | 120–150 μm | 150–500 μm |
|---|---|---|---|---|---|
| C. pyrenoidosa (×10−6) | 5.84 | 5.56 | 5.14 | 10.52 | 10.09 |
| M. flos-aquae (×10−5) | 8.69 | 16.59 | 12.11 | 9.01 | 8.02 |
Publisher’s Note: MDPI stays neutral with regard to jurisdictional claims in published maps and institutional affiliations. |
© 2022 by the authors. Licensee MDPI, Basel, Switzerland. This article is an open access article distributed under the terms and conditions of the Creative Commons Attribution (CC BY) license (https://creativecommons.org/licenses/by/4.0/).
Share and Cite
Liu, J.; Han, X.; Xing, H.; Nan, Y.; Lin, J.; He, J.; Chen, S.; Wei, Y.; Guo, P. Effects of Suspended Particles on Exopolysaccharide Secretion of Two Microalgae in Jinjiang Estuary (Fujian, China). J. Mar. Sci. Eng. 2022, 10, 277. https://doi.org/10.3390/jmse10020277
Liu J, Han X, Xing H, Nan Y, Lin J, He J, Chen S, Wei Y, Guo P. Effects of Suspended Particles on Exopolysaccharide Secretion of Two Microalgae in Jinjiang Estuary (Fujian, China). Journal of Marine Science and Engineering. 2022; 10(2):277. https://doi.org/10.3390/jmse10020277
Chicago/Turabian StyleLiu, Jie, Xiaoyu Han, Hui Xing, Yiting Nan, Jiahui Lin, Junming He, Sijia Chen, Yanfang Wei, and Peiyong Guo. 2022. "Effects of Suspended Particles on Exopolysaccharide Secretion of Two Microalgae in Jinjiang Estuary (Fujian, China)" Journal of Marine Science and Engineering 10, no. 2: 277. https://doi.org/10.3390/jmse10020277