Article

An Analysis on Hydraulic Loss in a Co-Rotating Bladed Disc Pump

1
Key Laboratory of Fluid and Power Machinery, Ministry of Education, Xihua University, No. 9999 Hongguang Avenue, Pidu District, Chengdu 610039, China
2
Key Laboratory of Fluid Machinery and Engineering, Xihua University, No. 9999 Hongguang Avenue, Pidu District, Chengdu 610039, China
3
University of Lille, CNRS, ONERA, Arts et Metiers Institute of Technology, Centrale Lille, UMR 9014-LMFL-Laboratoire de Mécanique des Fluides de Lille-Kampé de Fériet, F-59000 Lille, France
*
Authors to whom correspondence should be addressed.
J. Mar. Sci. Eng. 2022, 10(2), 214; https://doi.org/10.3390/jmse10020214
Submission received: 24 December 2021 / Revised: 31 January 2022 / Accepted: 1 February 2022 / Published: 6 February 2022
(This article belongs to the Section Ocean Engineering)

Abstract

:
Disc pumps rely on the shear force generated by a co-rotating disc to transport the fluid, the interaction between the fluid and impeller is weak, providing such pumps advantages when handling multi-phase flow. In the present study, a loss analysis is presented on a different kind of disc pump that combines both shear and pressure forces using a co-rotating disc pump and radial blades and that is often applied in marine petroleum engineering for mud-lifting. Experimental measurements on the overall pump performance were performed, and the subsequent hydraulic efficiency analysis shows that similarity laws can be applied for this pump. A particular analysis was specifically performed on the impeller and shows that the resulting loss analysis indicates that the increase in the static pressure is small and that the total pressure increase is mainly contributed to by the dynamic pressure change from the inlet to the outlet impeller sections. In addition, an evaluation of the individual loss levels is proposed in the impeller that is based on one-dimensional assumptions. This type of evaluation has never been proposed for present specific TBD pump designs in the available literature. The obtained results showed that the most important loss levels are roughly equally distributed between the incidence effects, inter-blade leakage, and bolts losses in the impeller, and that all together, they can reach 80% of the total impeller losses, while the blade-loading and friction losses are relatively small. The losses downstream of the impeller are significant; thus, a specific volute design that has been adapted for a disc impeller outlet flow pattern must be considered in order to achieve better performance. The present loss analysis was able to predict the corresponding disc pump performance well, achieving a maximum error rate of ±5% for a rather wide flow coefficient range. The proposed method can be considered to be a useful approach for research or for industrial teams who are working on the same kind of geometry by adopting the same data reduction analysis, allowing them to compare their own results with the present ones.

1. Introduction

With the increasing demand for oil resources, the importance of marine oil drilling technology is becoming more and more prominent due to the huge reserves in the world’s oceans. In deep-sea drilling engineering, a pump system is needed for subsea mud-lifting. However, the composition of subsea mud is complex and is typically a multi-phase fluid that contains large amounts of solid particles and gases. Therefore, conventional centrifugal pumps are limited for subsea mud-lifting due to the strong wear effect, which leads to rapid blade destruction, and the choice of axial flow pumps is also inadequate because of the relatively low lift head. Under these circumstances, a special pump design, known as a co-rotating disc pump, is often used for subsea mud-lifting systems [1,2,3,4,5]. Its specific design is derived from the shear pump that was first patented by Nicola Tesla [6], which was only composed of a set of smooth compact discs without blades, as shown in Figure 1.
Nicola Tesla’s design was later improved by Max [7,8,9], who enlarged the spacing between the discs and by adding blades on the surface of each disc (also called a Tesla-bladed disc pump, or TBD pump in the present paper). An example is given in Figure 2 [10].
A distinction must be made between these two types of disc pumps.
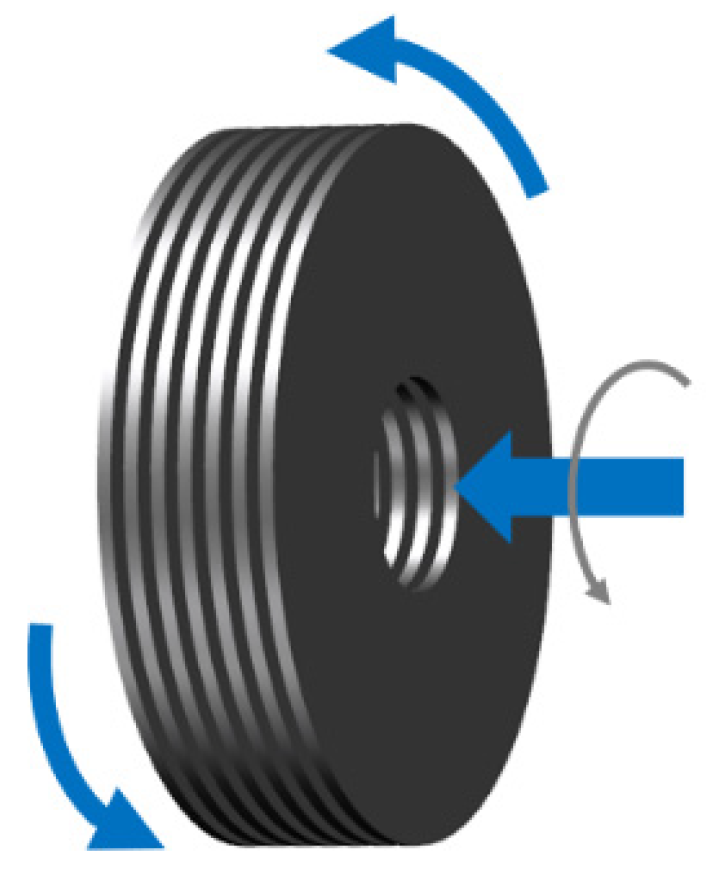
  • The initial Tesla disc pump only utilizes the viscous force, the internal flow field, and performance analyses presented by Hasinger and Kehrt [11]. Murata et al. [12,13] and Roddy et al. [14] showed that its performance is generally worse than that of a common centrifugal pump, but that the internal flow field is more stable and the streamline between discs almost axisymmetric. Wang et al. [15] analyzed the loss mechanism in the Tesla disc pump and found that the main losses occur downstream of the impeller. Cheremushkin and Polyakov [16] optimized the volute of a Tesla disc pump model, and the optimized model achieved better efficiency compared to the original model.
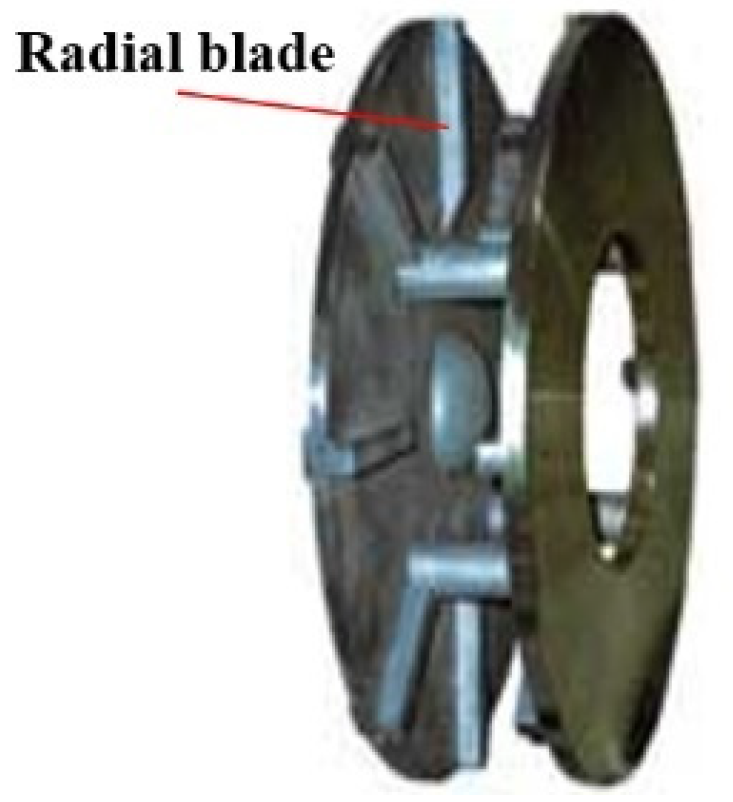
  • In contrast, the TBD pump not only utilizes not the viscous force but also the blade-like structure; moreover, the spacing between discs is much wider, similar to a common centrifugal pump. The pure radial blade shape can be considered to be quite crude in terms of design, especially for something used in impeller inlet conditions, compared to other designs, but this choice has been made to make disc pump more robust according to the transported mixture to be worked with. Therefore, the internal flow field and operating mechanism of the TBD pump are much more complex. The research team at the China University of Petroleum (East China) presented several studies related to TBD pumps that were applied in marine petroleum engineering and used as the mud-lifting pump, and these studies mainly focused on the influence of the geometrical parameters on pump performance [17,18,19], and the presented studies also showed evidence of the anti-wearability of TBD pumps by finding that the solid particles mainly concentrated in the bladeless area, which greatly reduced the interaction between the impeller and the solid particles [19,20,21,22]. Pei et al. [23] presented an approach to estimate the velocity slip at the impeller outlet, which could be helpful for t disc pump performance predictions, but only in situations that are close to design conditions. These studies provided interesting contributions for understanding the overall characteristics of TBD pumps. However, all of the published works that have been found in the available literature on TBD pumps only present overall performances and, more precisely, global efficiency, no information on the hydraulic efficiency of such pumps can be found, and there is also a research gap in terms of the evaluation of the loss distribution in each component of such a specific pump design.
In preliminary studies, authors (Heng et al. [10,24]) have analyzed the performance characteristics of present TBD pumps based on experimental results for several rotational speeds and checked the validity of similarity laws for such unconventional designs. Nevertheless, the objective of the present paper is to first carry out an evaluation of the individual loss sources in different parts of this type of pump before starting future multi-phase flow studies. The present study is therefore divided into two parts: the first part concerns a global performance analysis based on comparisons between the experimental and numerical results determined for the present pump, which were derived from the DiscfloTM example from Figure 2, but with a smaller disc spacing. This part is presented in Section 3. The overall CFD results that were obtained on the TBD pump were also used to determine impeller performance.
Hydraulic losses are then analyzed, and an evaluation of their distribution along the different pump components is proposed based on a one-dimensional approach using semi-empirical correlation analytical models. This approach has been widely used and applied for conventional centrifugal pump designs but has never been performed for this specific pump design and is presented in Section 4.
Such an approach was derived from the axial component of the moment of momentum equation applied in a control volume that included the throughflow area between the inlet and outlet sections of the impeller passage. This leads to an evaluation of the theoretical head through the well-known Euler relation based on the one-dimensional assumption that is the basis for the development of the present paper.

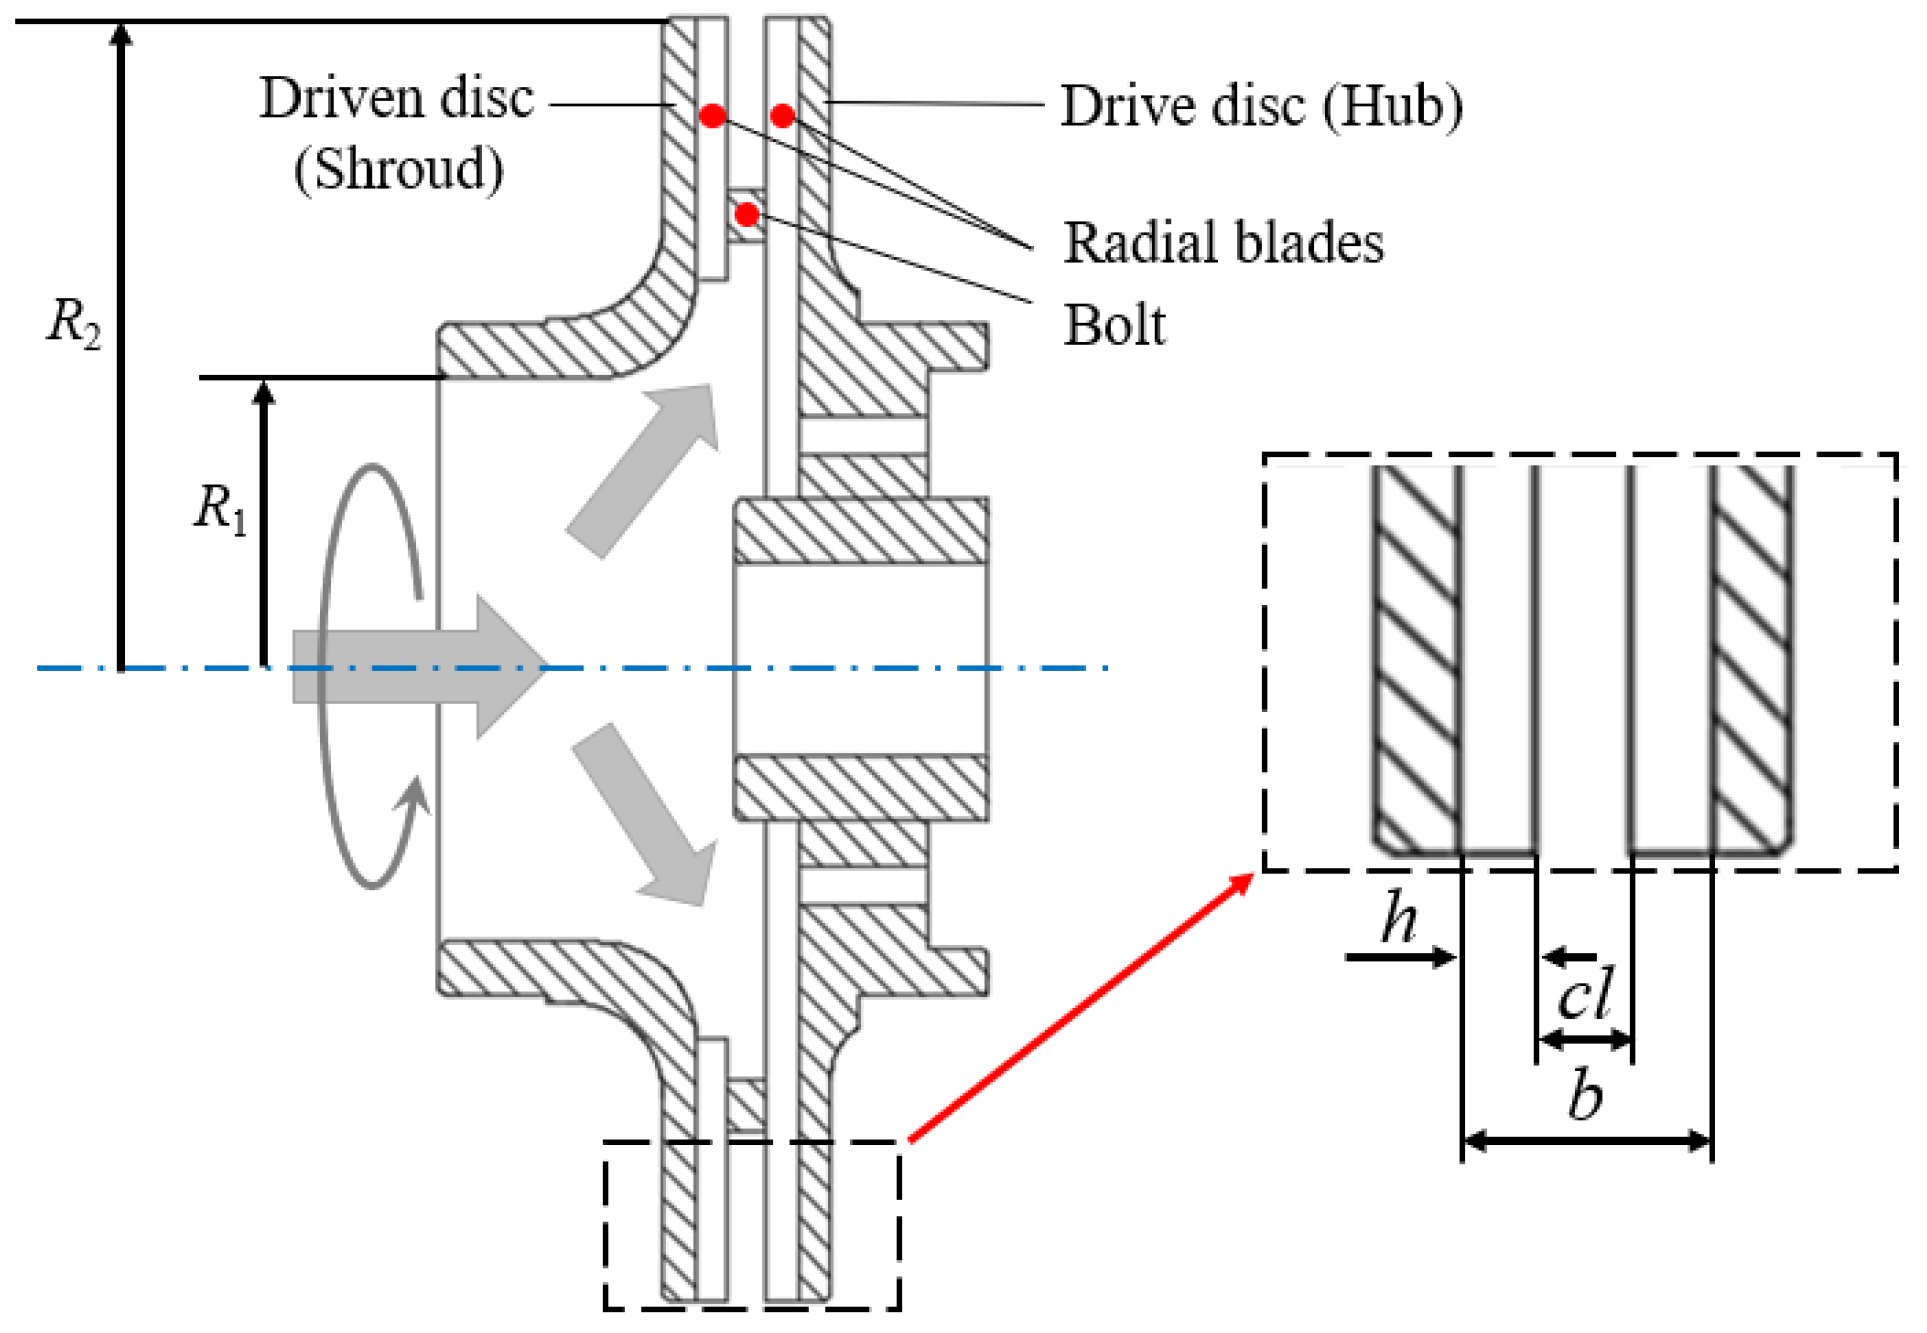
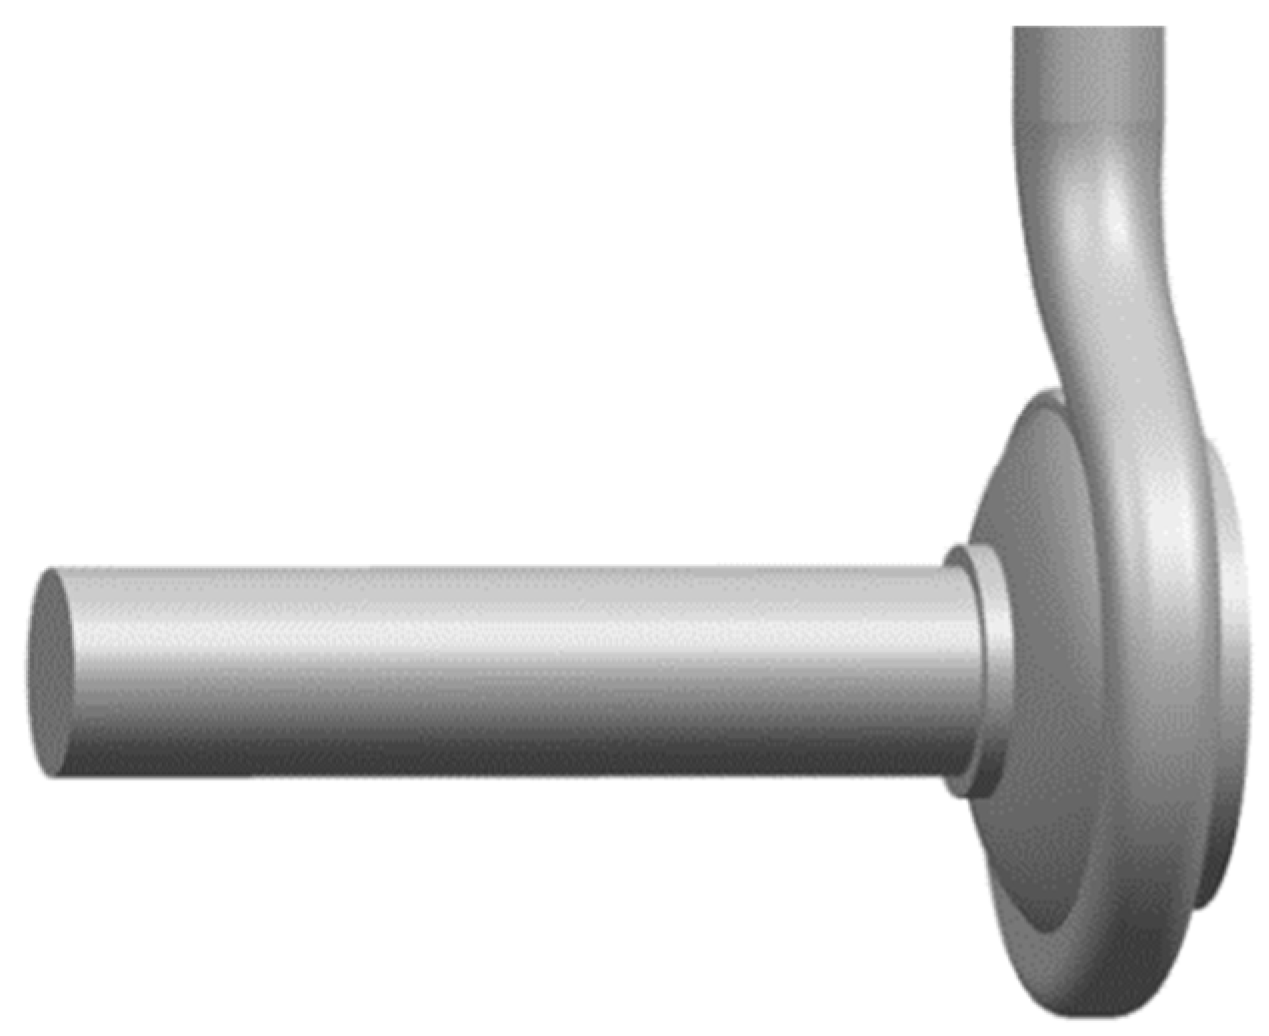
2. Presentation of the Present TBD Pump Geometry

The present TBD pump impeller, shown in Figure 3, is directly inserted into an existing industrial volute (Figure 4) pump and replaces a conventional centrifugal impeller that has been previously removed. This set-up was chosen to perform further multi-phase flow tests in the future for ground or sub-see applications. The main geometrical characteristics of the present pump impeller are shown in Figure 5 and Table 1.
The driven disc on the shroud side of the impeller is connected to the drive hub disc and is equipped with eight bolts that allow both discs to rotate at the same angular velocity (see Figure 5). The ratio between the two-blade height and the impeller width is kept at 0.5, corresponding to most existing industrial pumps of this type. However, the ratio between the impeller width and the outlet radius is lower compared to other designs.

3. Overall Pump Performances

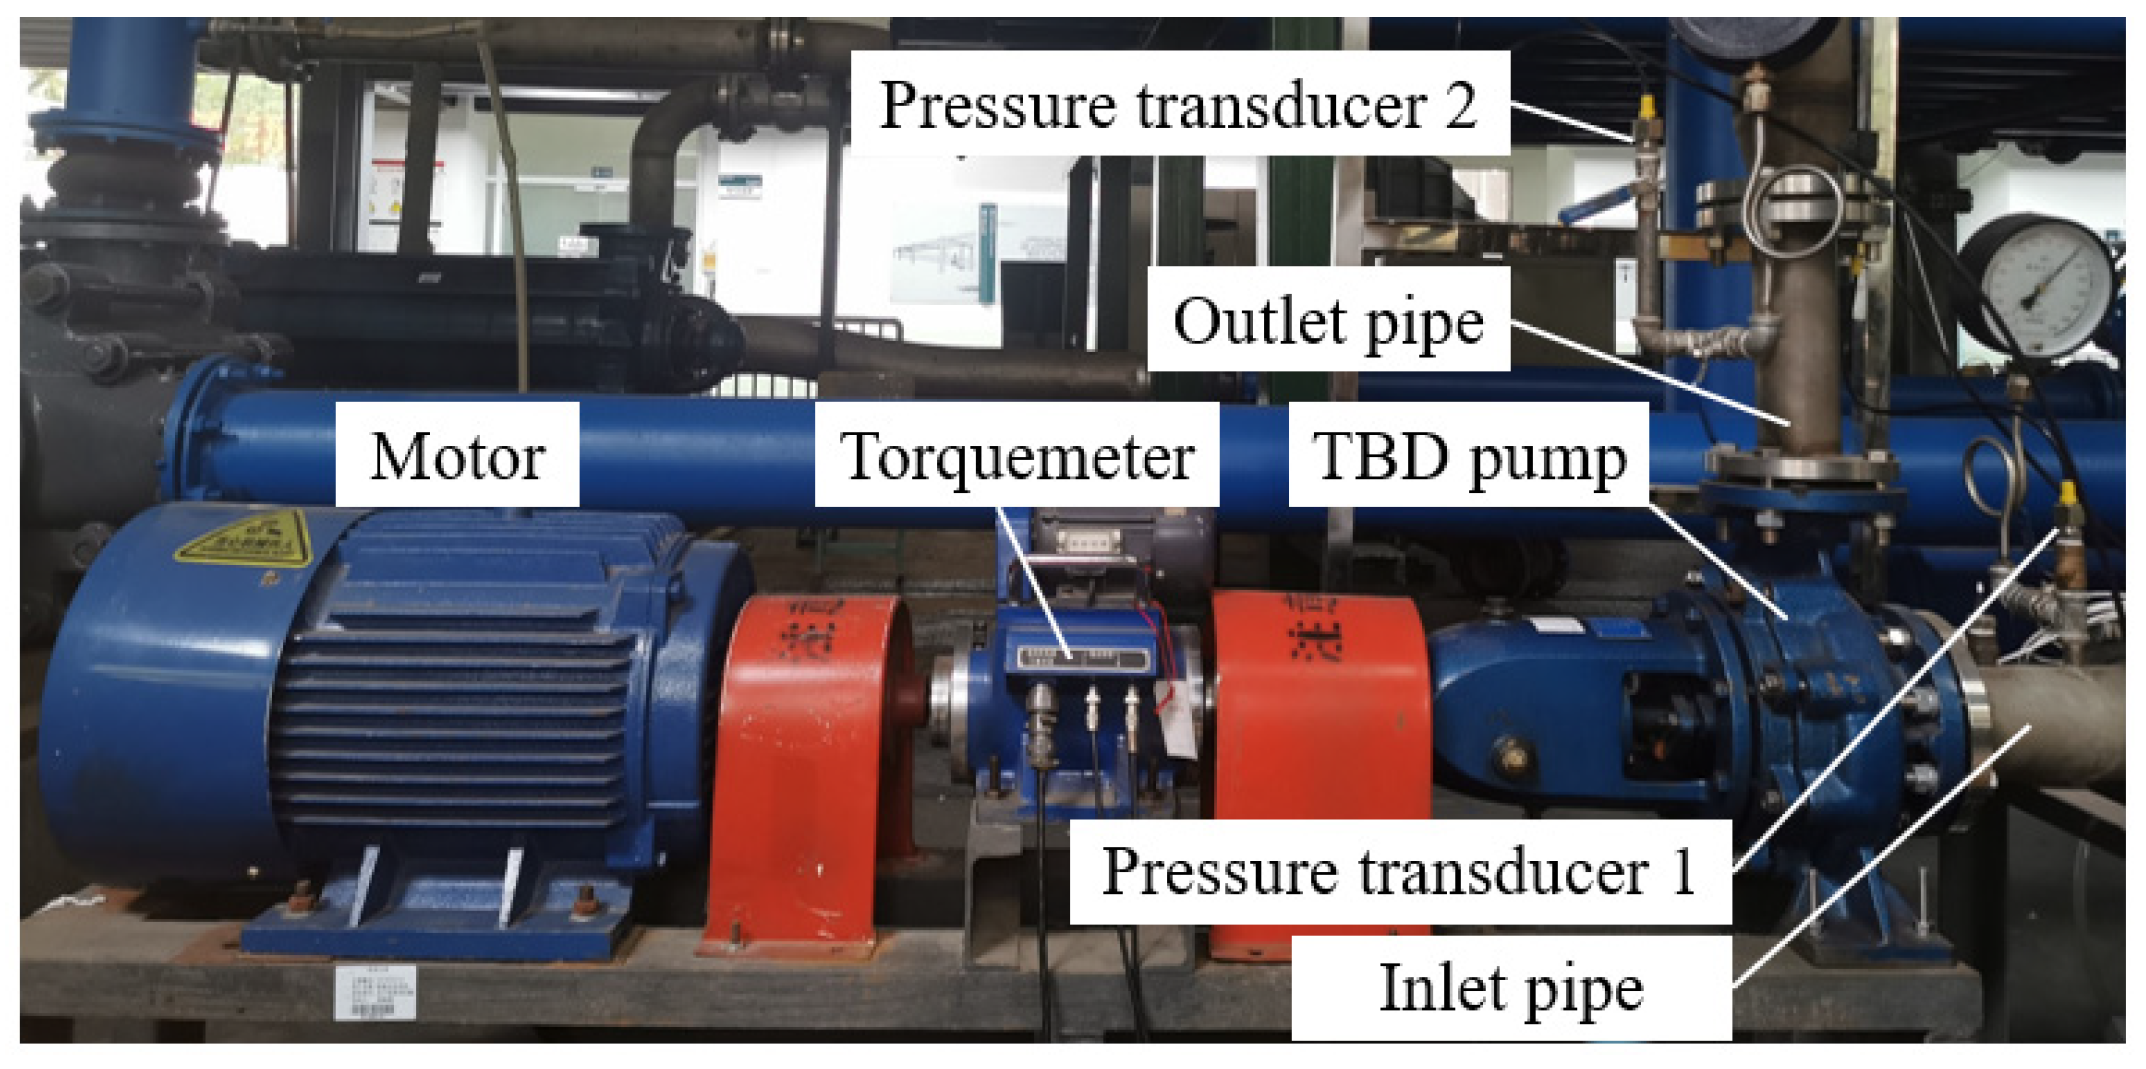
3.1. Experimental Test Bench and Instruments

A pump test system was built to test pump performance, and the tested fluid media was water. An open 3 m3 volume tank was connected to the inlet and outlet pipes to provide recyclable working fluid. A DZW BT16C-type electrical valve was applied to control the flow rate of the system, and a YH-LDG-type electromagnetic flowmeter was then used for the real-time monitoring of the volume flow rate, achieving precision of ±0.5% (range: 0–150 m3/h). The TBD pump head H was obtained by the two PTX 5072-type pressure transducers installed on the inlet and outlet pipes, achieving precision of ±0.2% (range: 0–50 m). A torquemeter device was placed between the motor and TBD pump shaft to measure the rotational speed and torque, achieving precision of ±0.1% (range: 0–3000 rpm) and ± 0.2% (range: 0–250 N·m), respectively. The test bench can be seen in Figure 6.

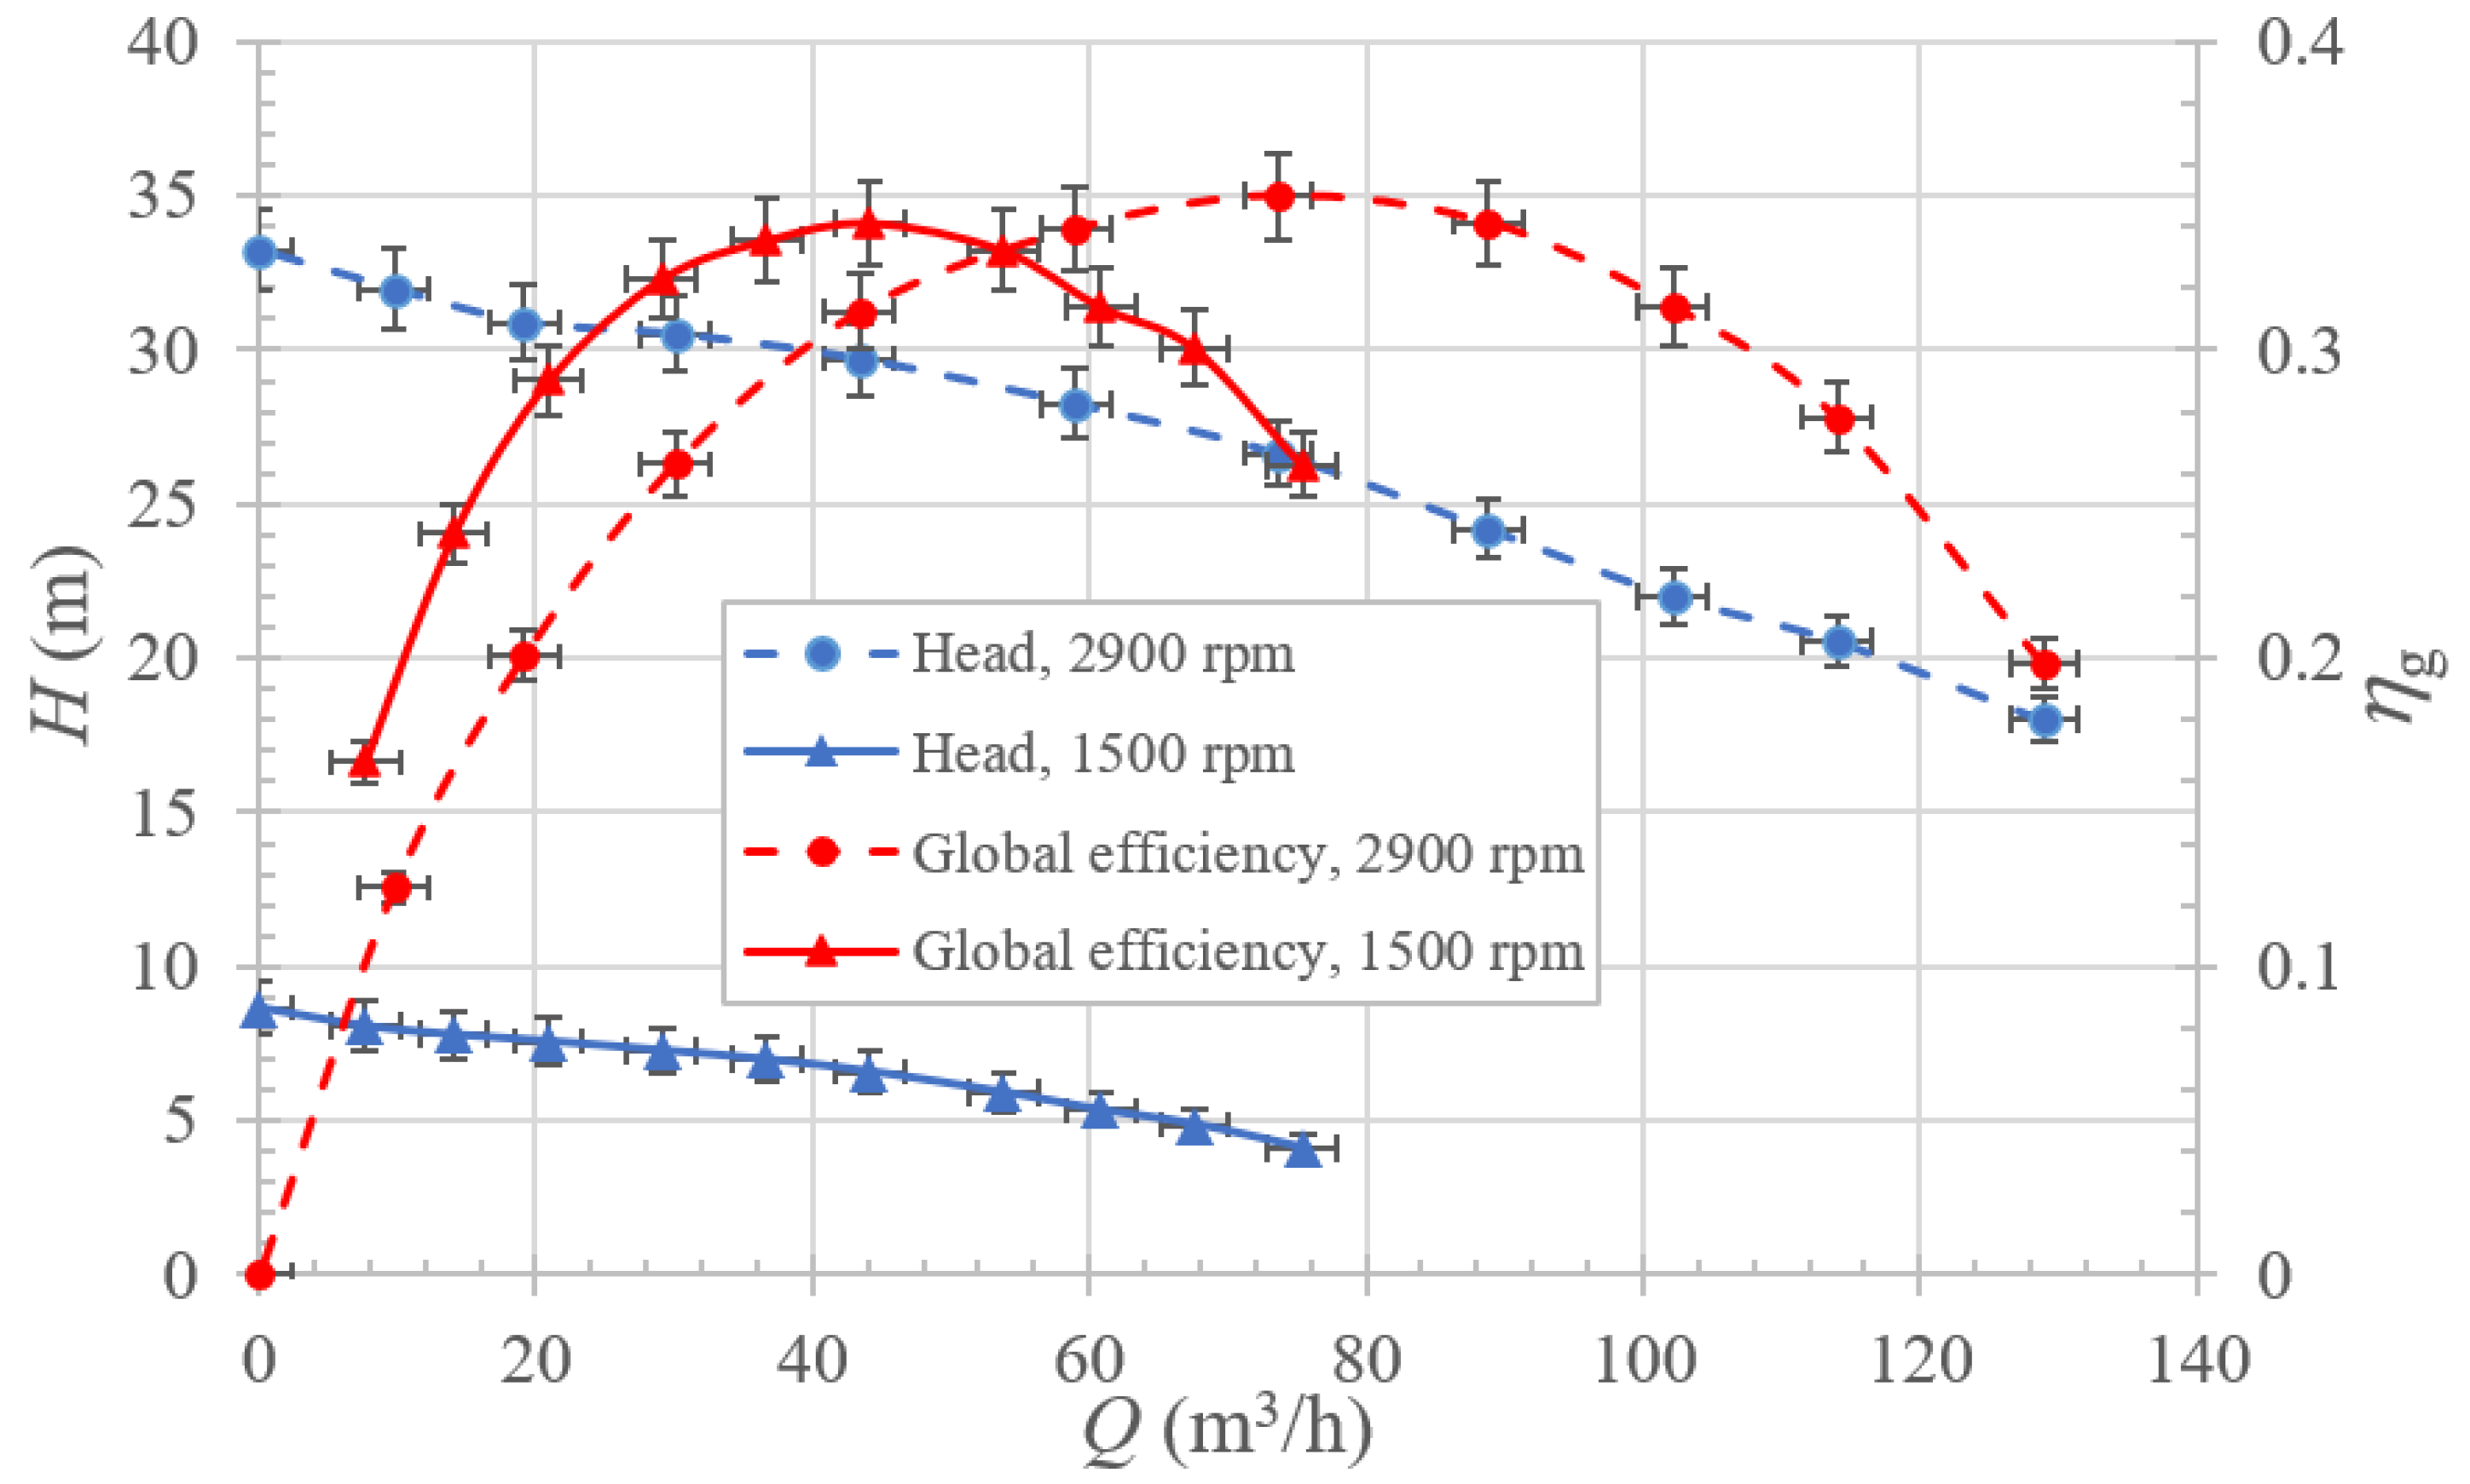
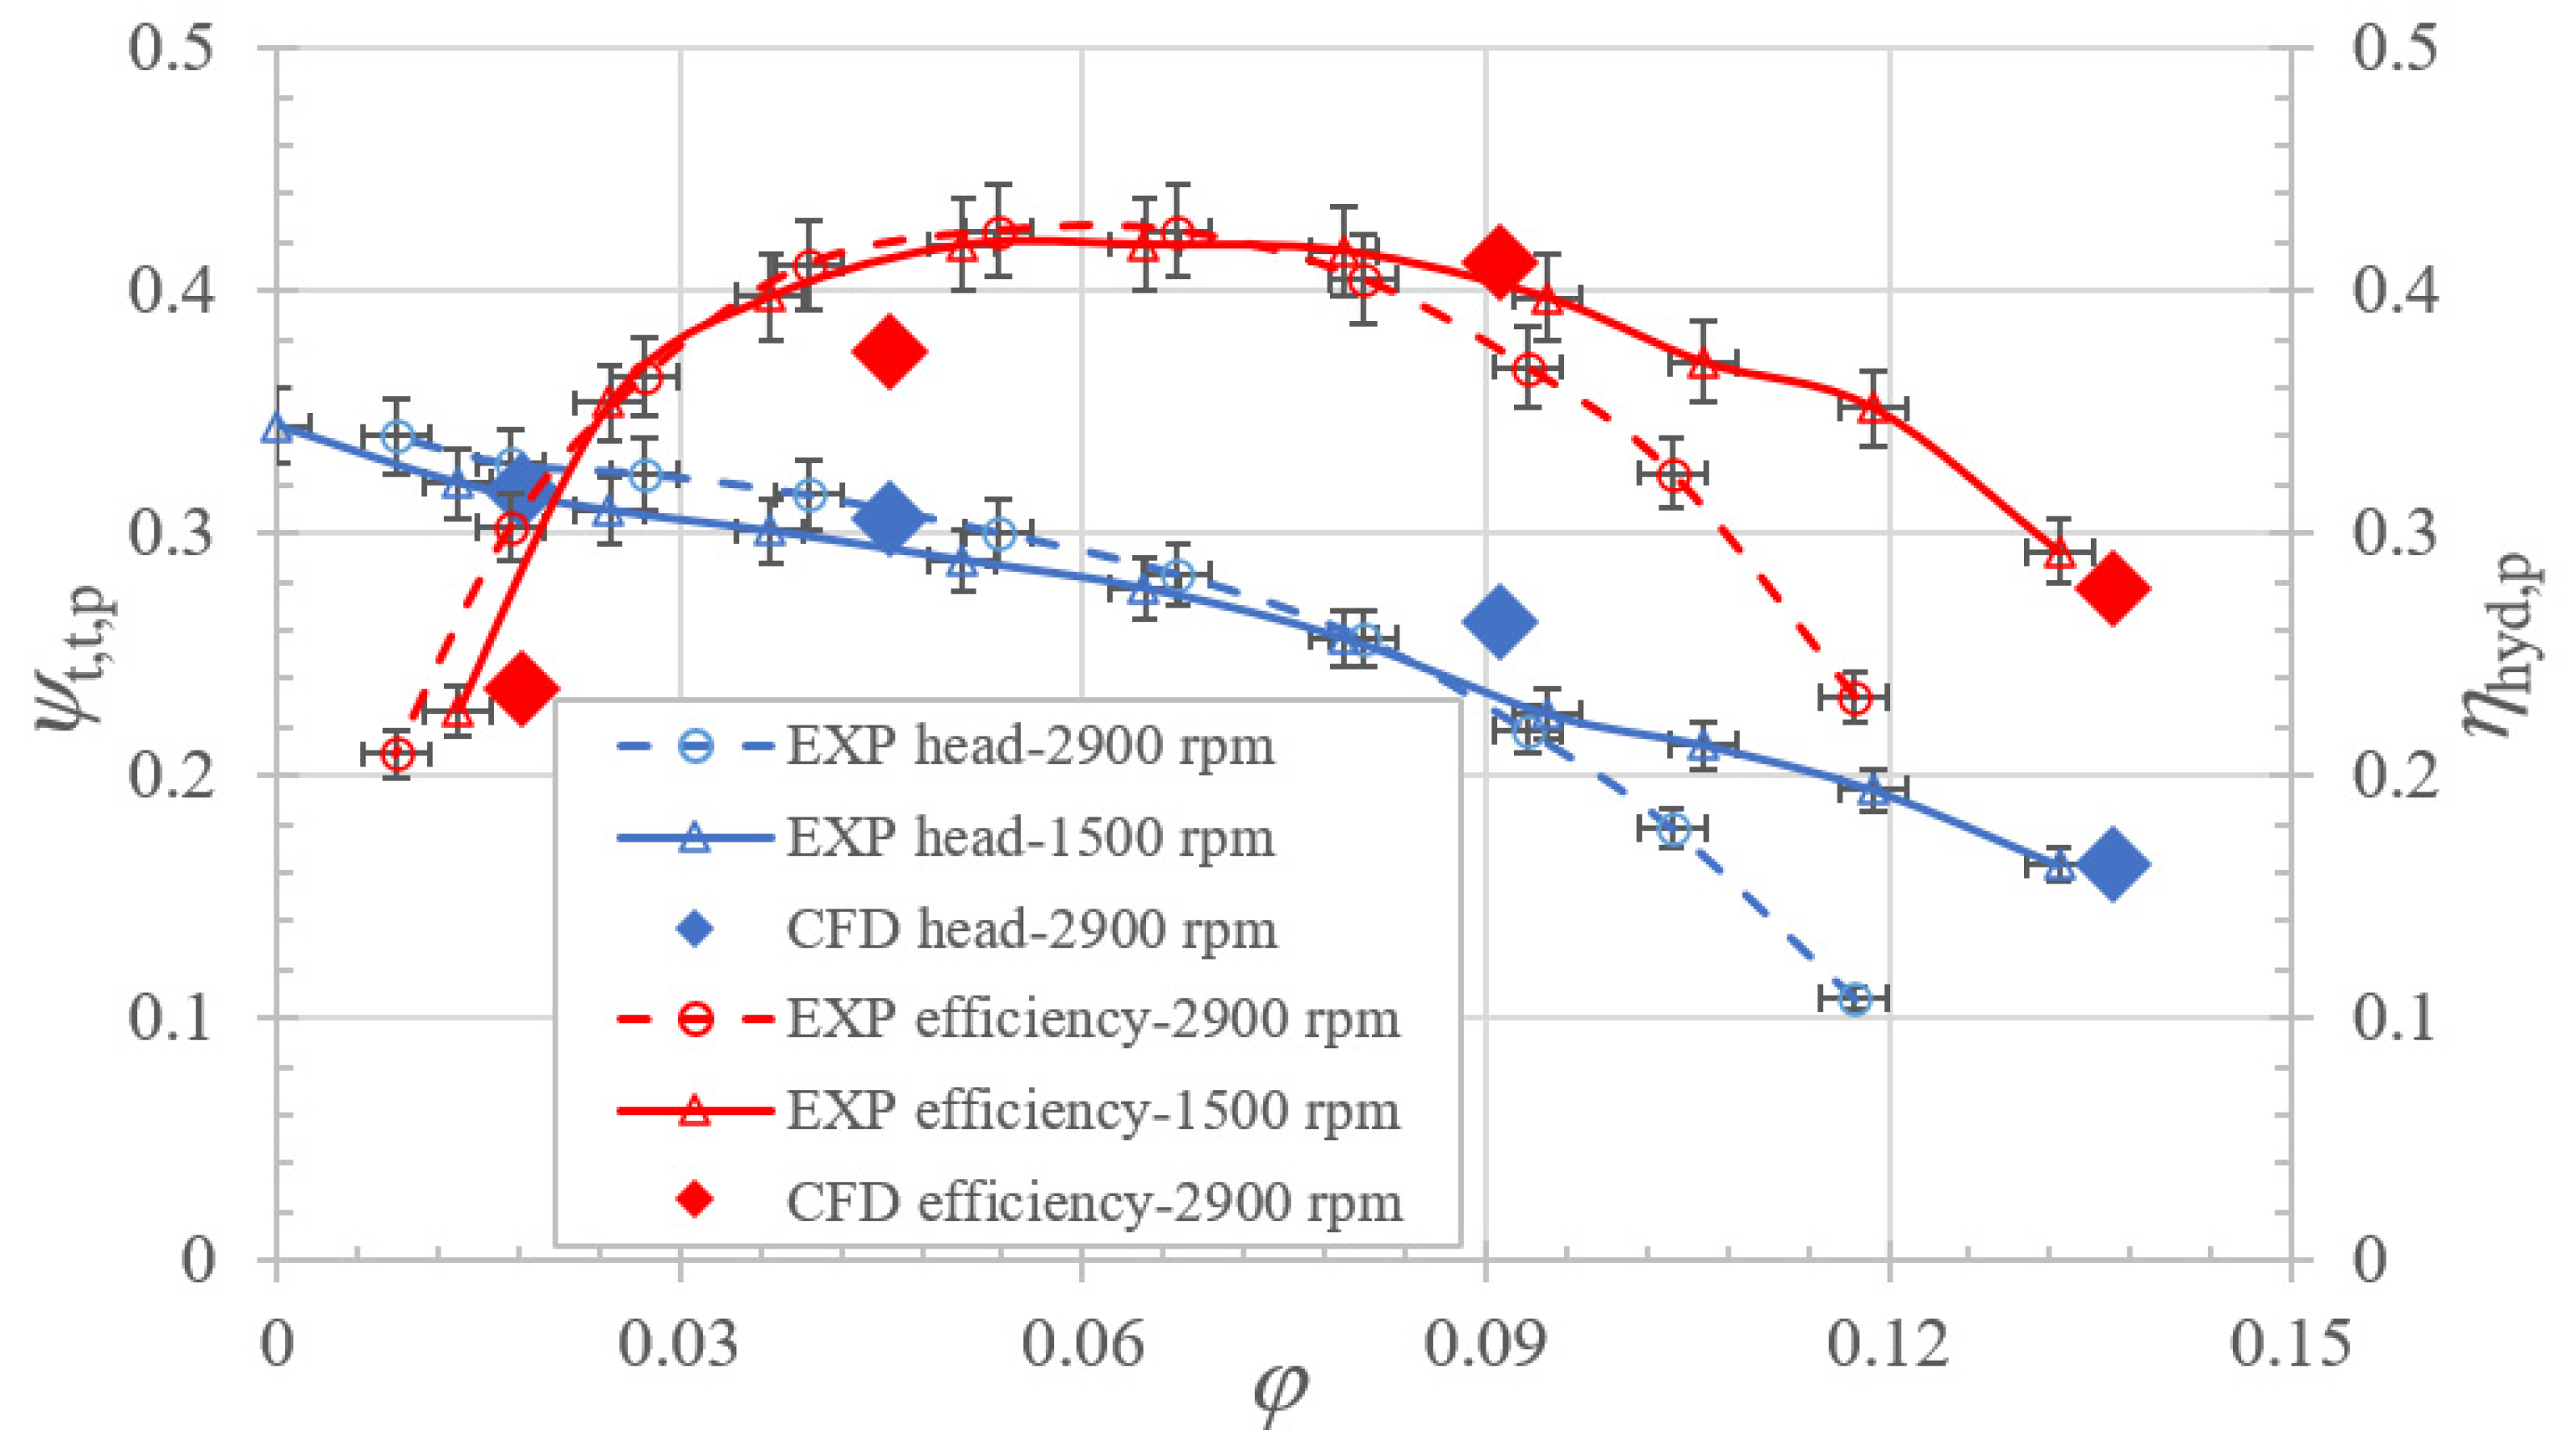
3.2. Experimental Results

The performance charts of the present TBD pump are given in Figure 7 along with the evolutions of the pump total head H and global efficiency ηg versus the volume flow rate Q for the two rotational speeds 1500 and 2900 rpm.
For the measurement uncertainties under the flow rate 100 m3/h and for 2900 rpm, the measurement uncertainties Uc are determined by:
U C = ± 2.19 × S x ¯ n × 100 %
where S is the standard deviation, x ¯ is the averaged value of the measured data, and n is the number of times the measurement is repeated (n = 10), and they are obtained by following formula:
S = i = 1 n ( x i x ¯ ) 2 n 1
x ¯ = x 1 + x 2 + x 3 + + x n n
Based on the measured data, the measurement uncertainty for the flow rate is ±2.5%, for the pump head, it is ±3%, and for the pump efficiency, it is ±4%. These values are also applicable for the hydraulic efficiency, flow coefficient, and head coefficient in relation to Equations (4)–(6).
In Figure 8, these experimental results are presented using the head and flow coefficients defined as follows:
ψt,t,p = gH/(U2)2
ηhyd,p = ρgQH/(ηvηmPs)
φ = Q/2πR2b2U2
where ηv is the volumetric efficiency estimated by taking the leakage flow into account, and ηm is the mechanical efficiency, which is fixed at 0.98 for the present model. The disc friction power, which only depends on the rotational speed, can be estimated according to the following formula (Gülich [25]):
Pdisc = kdiscρω3R25(1 − (R1/R2)5), for one disc.
where kdisc is the friction coefficient.
It was determined that the amount of leakage is small because of the small increase in the static pressure across the impeller, as explained further in Section 4.1. The pump total head coefficient ψt,t,p versus the flow coefficients φ resulting from two different rotational speeds 1500 and 2900 rpm, respectively, is plotted in Figure 8. Due to the detected cavitation at 2900 rpm, a clear discrepancy can be seen when the flow coefficient φ > 0.08. Nevertheless, the rest part of the curve indicates that similarity laws can be applied for this pump for this set of rotational speeds. For the same reason, the hydraulic efficiency ηhyd,p versus the flow coefficient is also an invariant, except when cavitation is detected for high flow rates corresponding to the last three experimental points in Figure 8 obtained for the largest rotational speed value of 2900 rpm. Cavitating flow was roughly detected using the inlet static pressure measurements in front of the pump plus the relative dynamic pressure at the blade impeller inlet section.
Maximum hydraulic pump efficiency ηhyd,p occurs for a flow coefficient φopt ≈ 0.068 and decreases much more gently for higher flow rates compared to lower ones.
Based on the experimental results, the theoretical pump head coefficient ψth can be obtained as follows:
ψth = ψt,t,phyd,p
The theoretical pump head coefficient is shown in Figure 9 for both rotational speeds. For the maximum flow coefficient, its value is less than 0.7, which is lower than that of a conventional pump design due to bladeless spacing inside the TBD pump impeller. The extrapolated straight line corresponds to the well-known ideal theoretical head coefficient, assuming that there is no inlet swirl and no recirculation.
For conventional centrifugal pump designs, the value of the head coefficient is equal to 1 for the zero mean flow rate when using the straight-line extrapolation. The corresponding present curve value only reaches 0.8 because the fluid tangential velocity component is always lower than that of conventional full-blade designs and is generally obtained using the slip coefficient evaluation from semi-empirical correlations when a one-dimensional assumption is assumed. Up until now, the corresponding slip factor correlation has not been developed for co-rotating disc pumps. This is the reason why the evaluation of the impeller hydraulic efficiency is the key point for the one-dimensional approach for the loss study conducted in the present paper. It needs both conjugate experimental and numerical data reduction analysis.

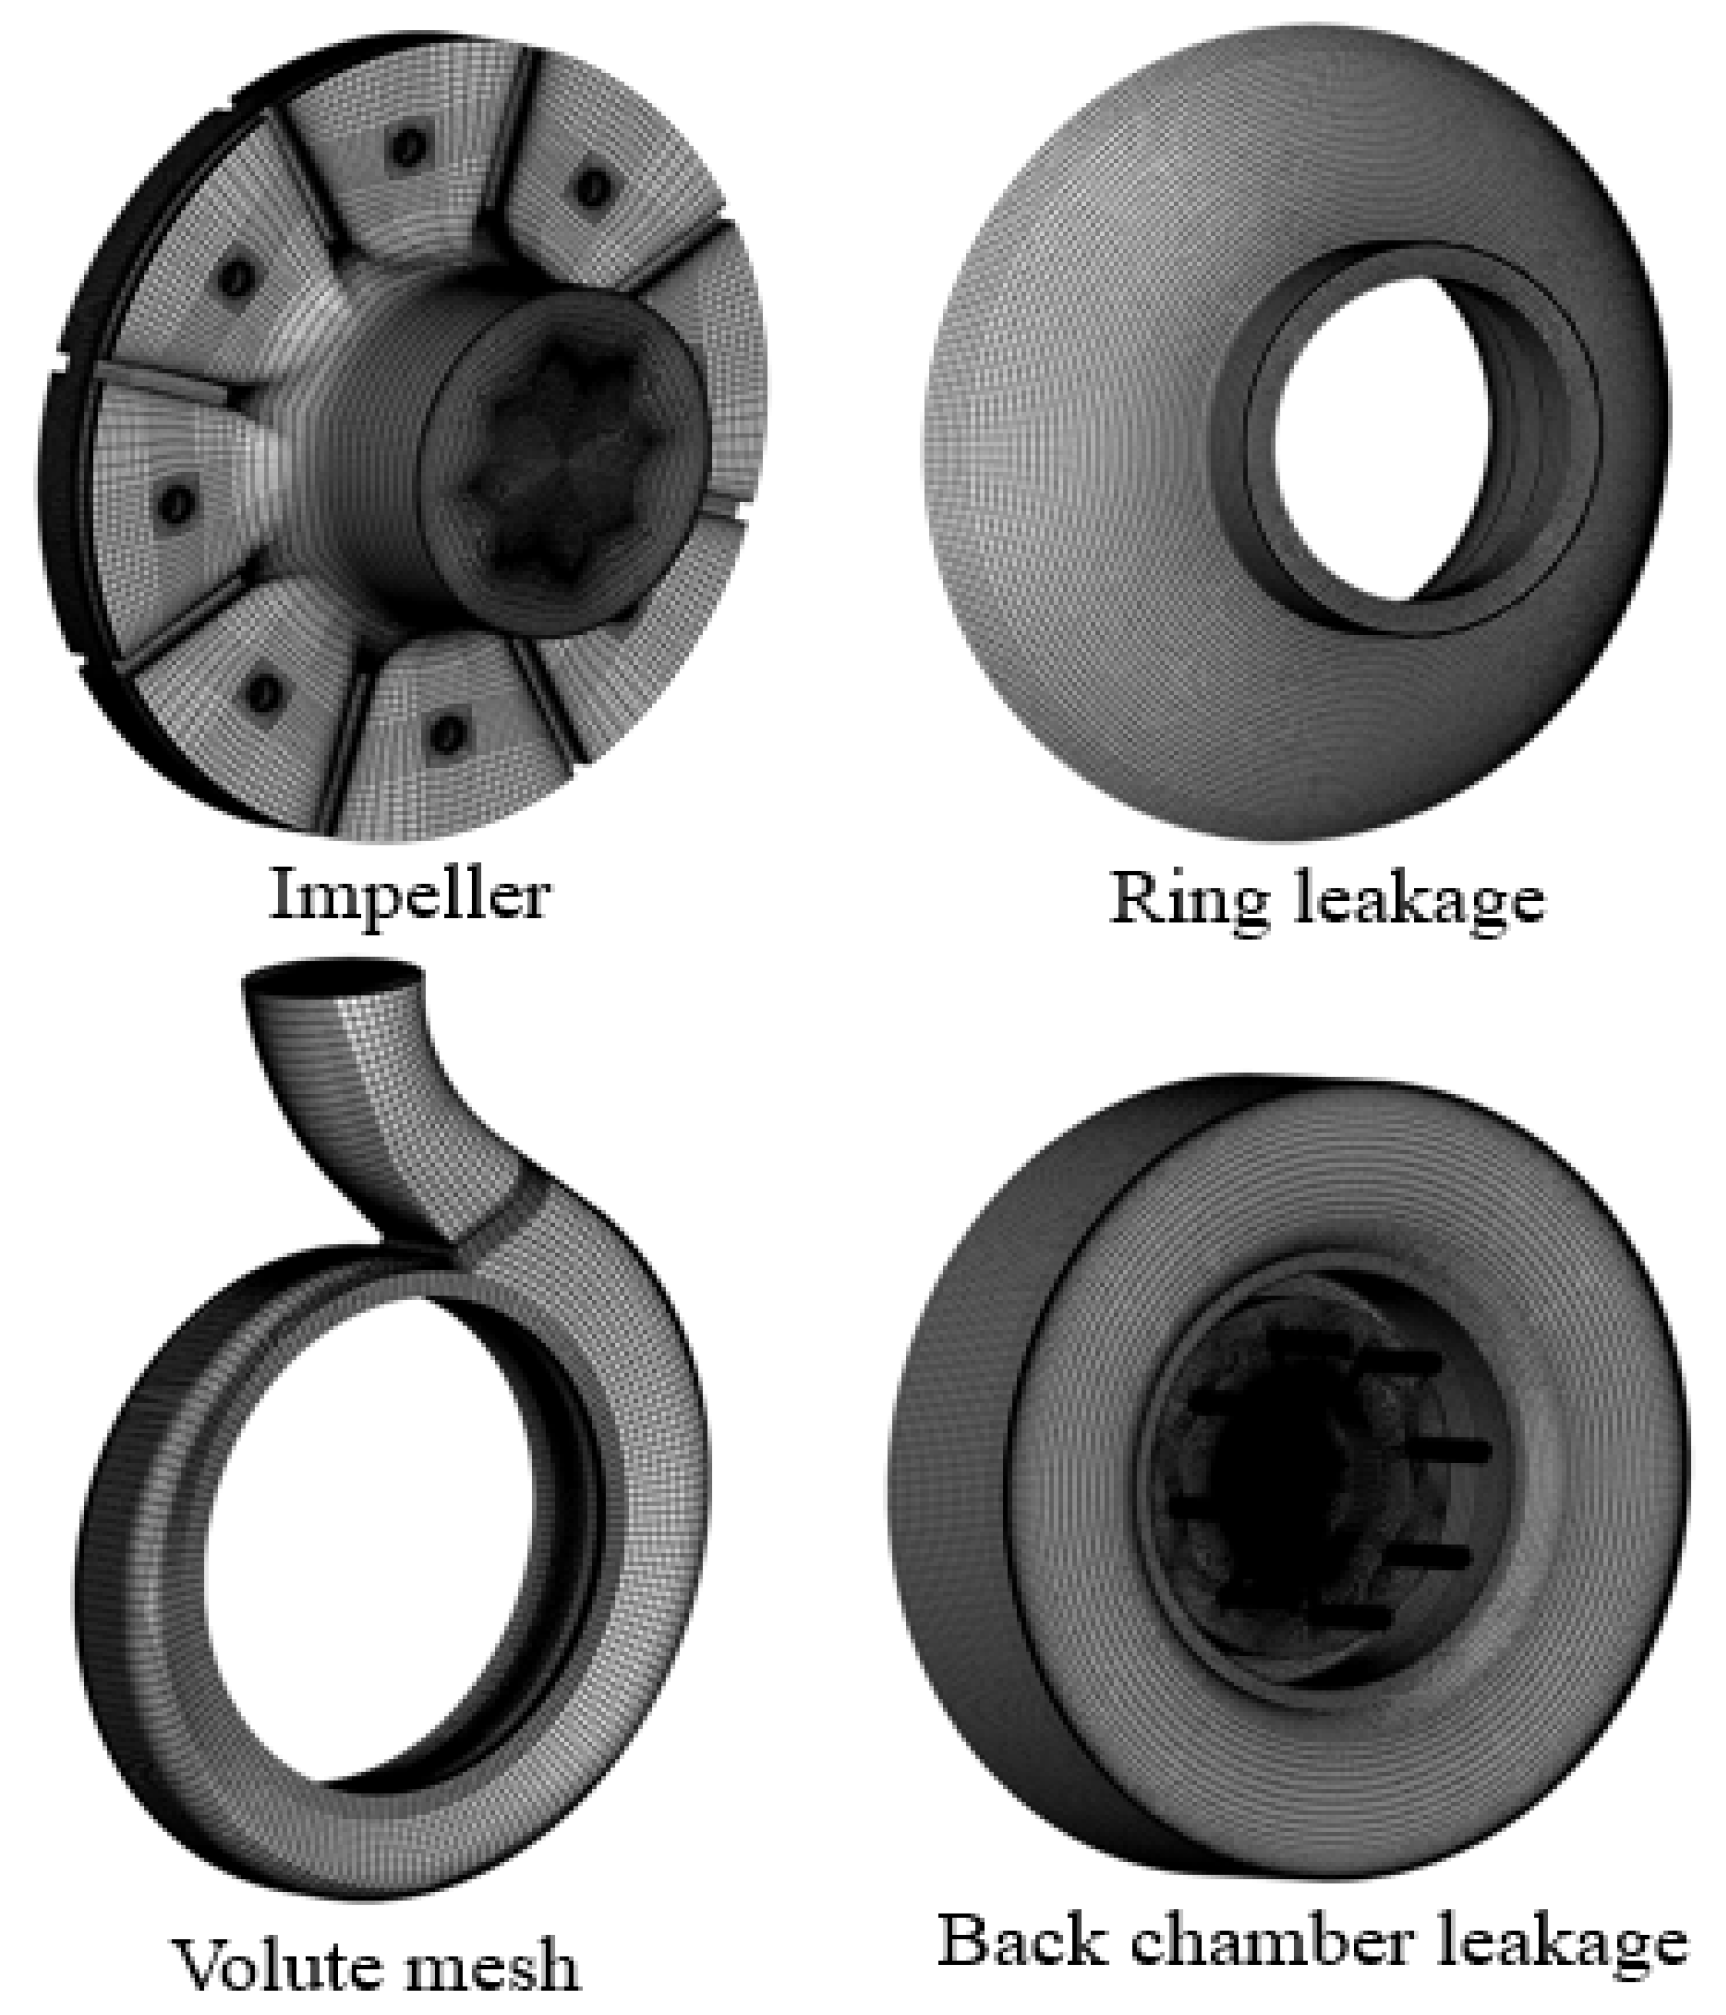
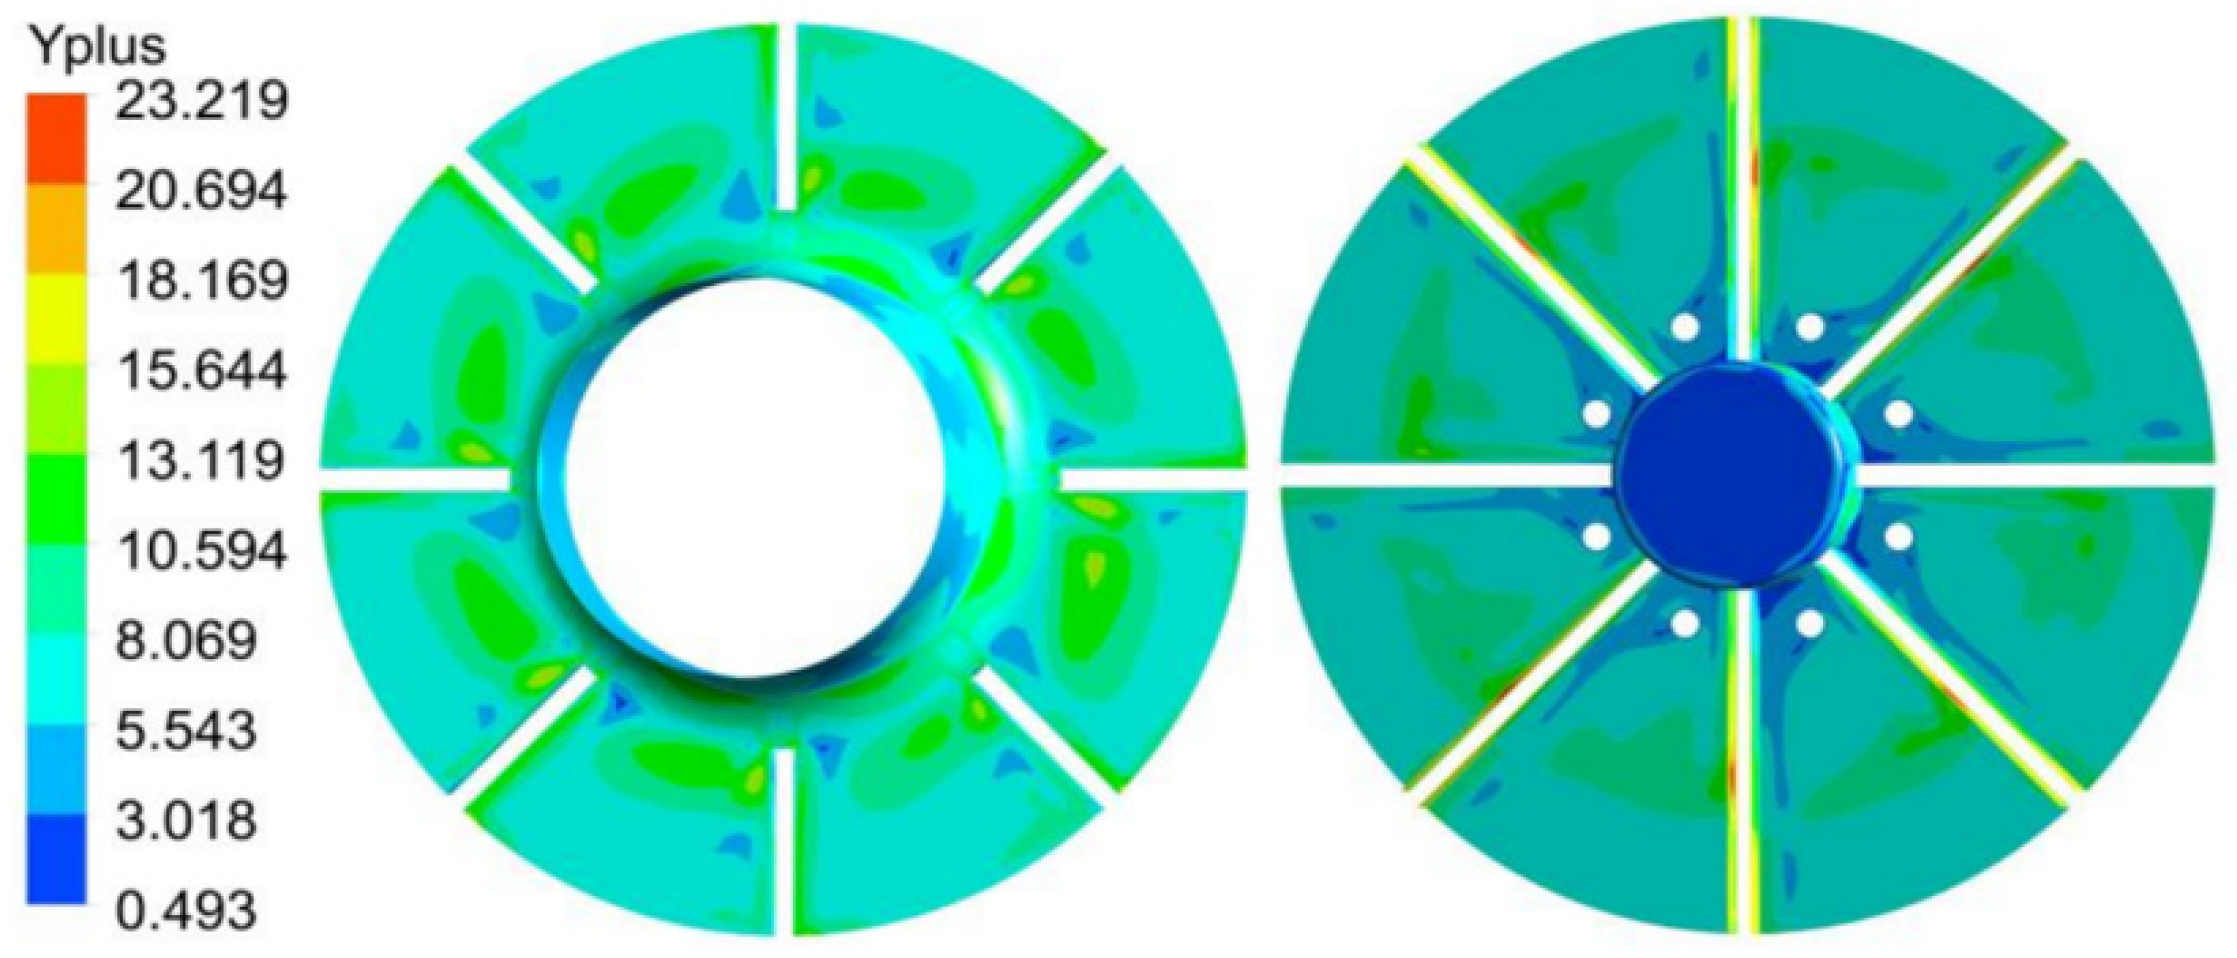
3.3. Numerical Simulation Set-Up and Results

To determine the local information impeller inlet and outlet flow characteristics that cannot been obtained from local measurement accessibility, Reynolds Average Numerical Simulations (RANS) were performed using a k-ω SST turbulent model. The 3D fluid domain was created using commercial software UG, as shown in Figure 10. This approach has been widely used thanks to the development of numerical techniques, which have been validated to some extent for specific local studies on cavitation, for example [26], or to obtain more precise information on vibration source detection using unsteady approaches that have been adapted for conventional axial or centrifugal pump designs [27].
The fluid domain corresponding to the inlet pipe was properly extended to ensure stable inlet conditions.
Because of the quite simple structure of TBD pumps, structured hexahedral mesh was used to discretize the whole fluid domain, as shown in Figure 11. Leakage fluid domains were considered: the inlet ring area and the back chamber leakage, which is the result of the balance holes on the impeller hub side. Based on the experimental measurements, the inlet average velocity, which is calculated by the flow rate and inlet cross-sectional area, was decided as the inlet boundary condition. The total pressure was imposed as the outlet boundary condition. The impeller was set as a rotary component rotating at exactly the same angular velocity as that measured in the experiments. The wall roughness was determined to be 0.025 mm according to the accuracy of manufacture, and the non-slip wall boundary was applied on all of the wall surfaces.
Mesh sensitivity analysis was performed first, and based on the mesh independency analysis, the results of which are shown in Table 2, a total mesh number of around 8 million was adopted in order to achieve stable pump head and efficiency performance results with a difference of ± 0.6% and ± 0.8%, respectively. Moreover, most of the Y-plus values of the generated rotor mesh are around 10, as shown in Figure 12.
Numerical simulations were performed for four different flow rates (Q = 20, 50, 100 and 150 m3/h). The pump head coefficient and hydraulic efficiency results are given in Figure 13 and are compared with the experimental ones. Despite the sudden drop in the experimental performance due to cavitation at a large flow rate for 2900 rpm, the head and efficiency values from CFD are quite close to the experimental ones in the vicinity of the maximum efficiency flow rate and above. Considering the objectives of the current paper, it should be considered that the CFD results could be used to determine the impeller performance, which is the main basis of the present investigation.
For lower flow rates, the difference in the efficiencies may result from a bad estimation of the mechanical losses and increasing torque measurement uncertainties due to smaller torque values. Vertical error bars correspond to the experimental measurement uncertainties obtained due to the fluctuations in the measured data. Another explanation for the difference between experiments and CFD results at low flow rates is related to unsteady effects that can be generally correctly modelled using the URANS approach, as already proven in numerous publications for conventional axial and centrifugal pumps.

4. Pump Component Performances and Related Losses

The present loss analysis is based on a one-dimensional approach that is equivalent to conventional pump designs by assuming that the total pump loss coefficient ζtot is equal to the sum of the individual pump component loss coefficients, which are referred to as the inlet loss ζinlet, impeller loss ζimp, and the volute loss ζvol. So that:
ζtot = ζinlet + ζimp + ζvol
The individual loss coefficient ζ is defined as the related total pressure loss divided by the outlet impeller rotational speed to the square multiplied by the working fluid density: ρU22,
ζi = (Pt,outPt,in)/ρU22
where “i” represents one of the pump components (inlet, imp: impeller or vol: volute), and “in/out” is related to the inlet/outlet sections of the corresponding pump component.
They are supposed to depend on the geometry of each pump component and the flow rate and are independent of the rotational speed when the Reynolds number is high enough to assume the turbulent mean flow regime inside the pump flow passage. Total loss coefficient ζtot is obtained from experiments and CFD procedures. Comparisons of both sets of results are given in Section 3. The amount of volute losses is deduced from the pump losses minus the impeller losses.
One must keep in mind that this approach is unable to take several effects, such as unsteadiness, internal and upstream reverse flows, and impeller volute interactions. Its validity for different flow coefficients values will be confirmed.

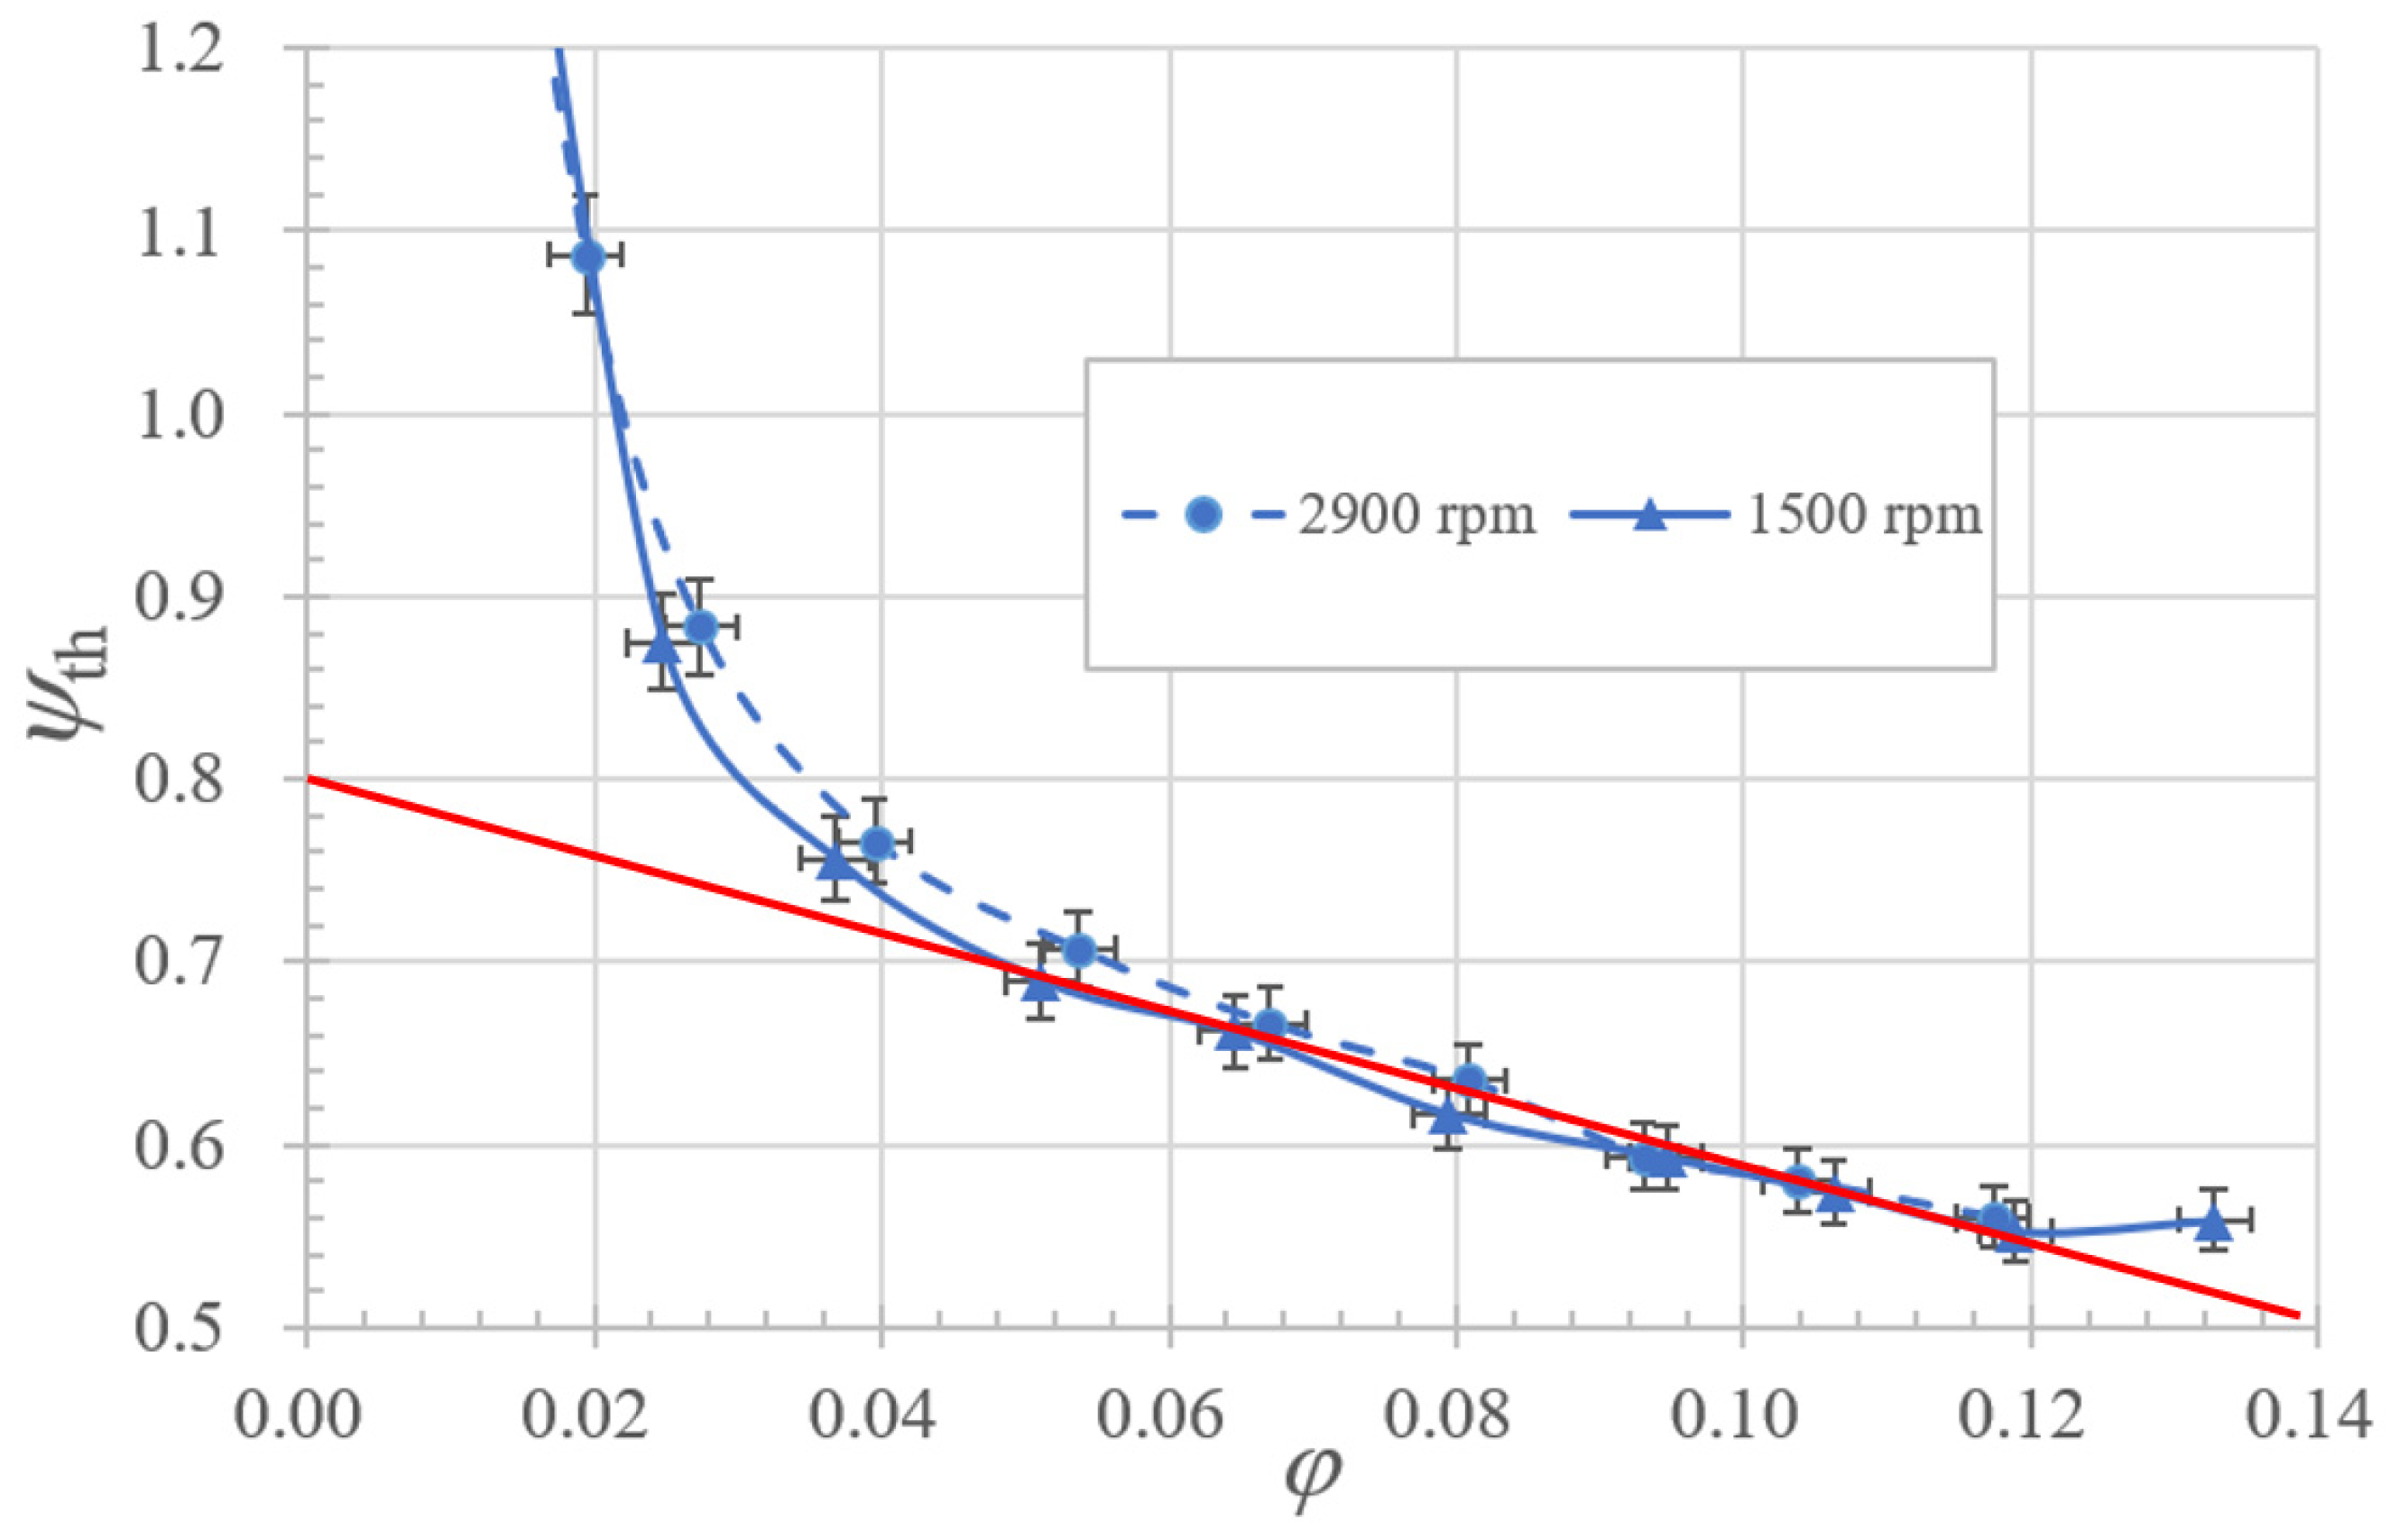
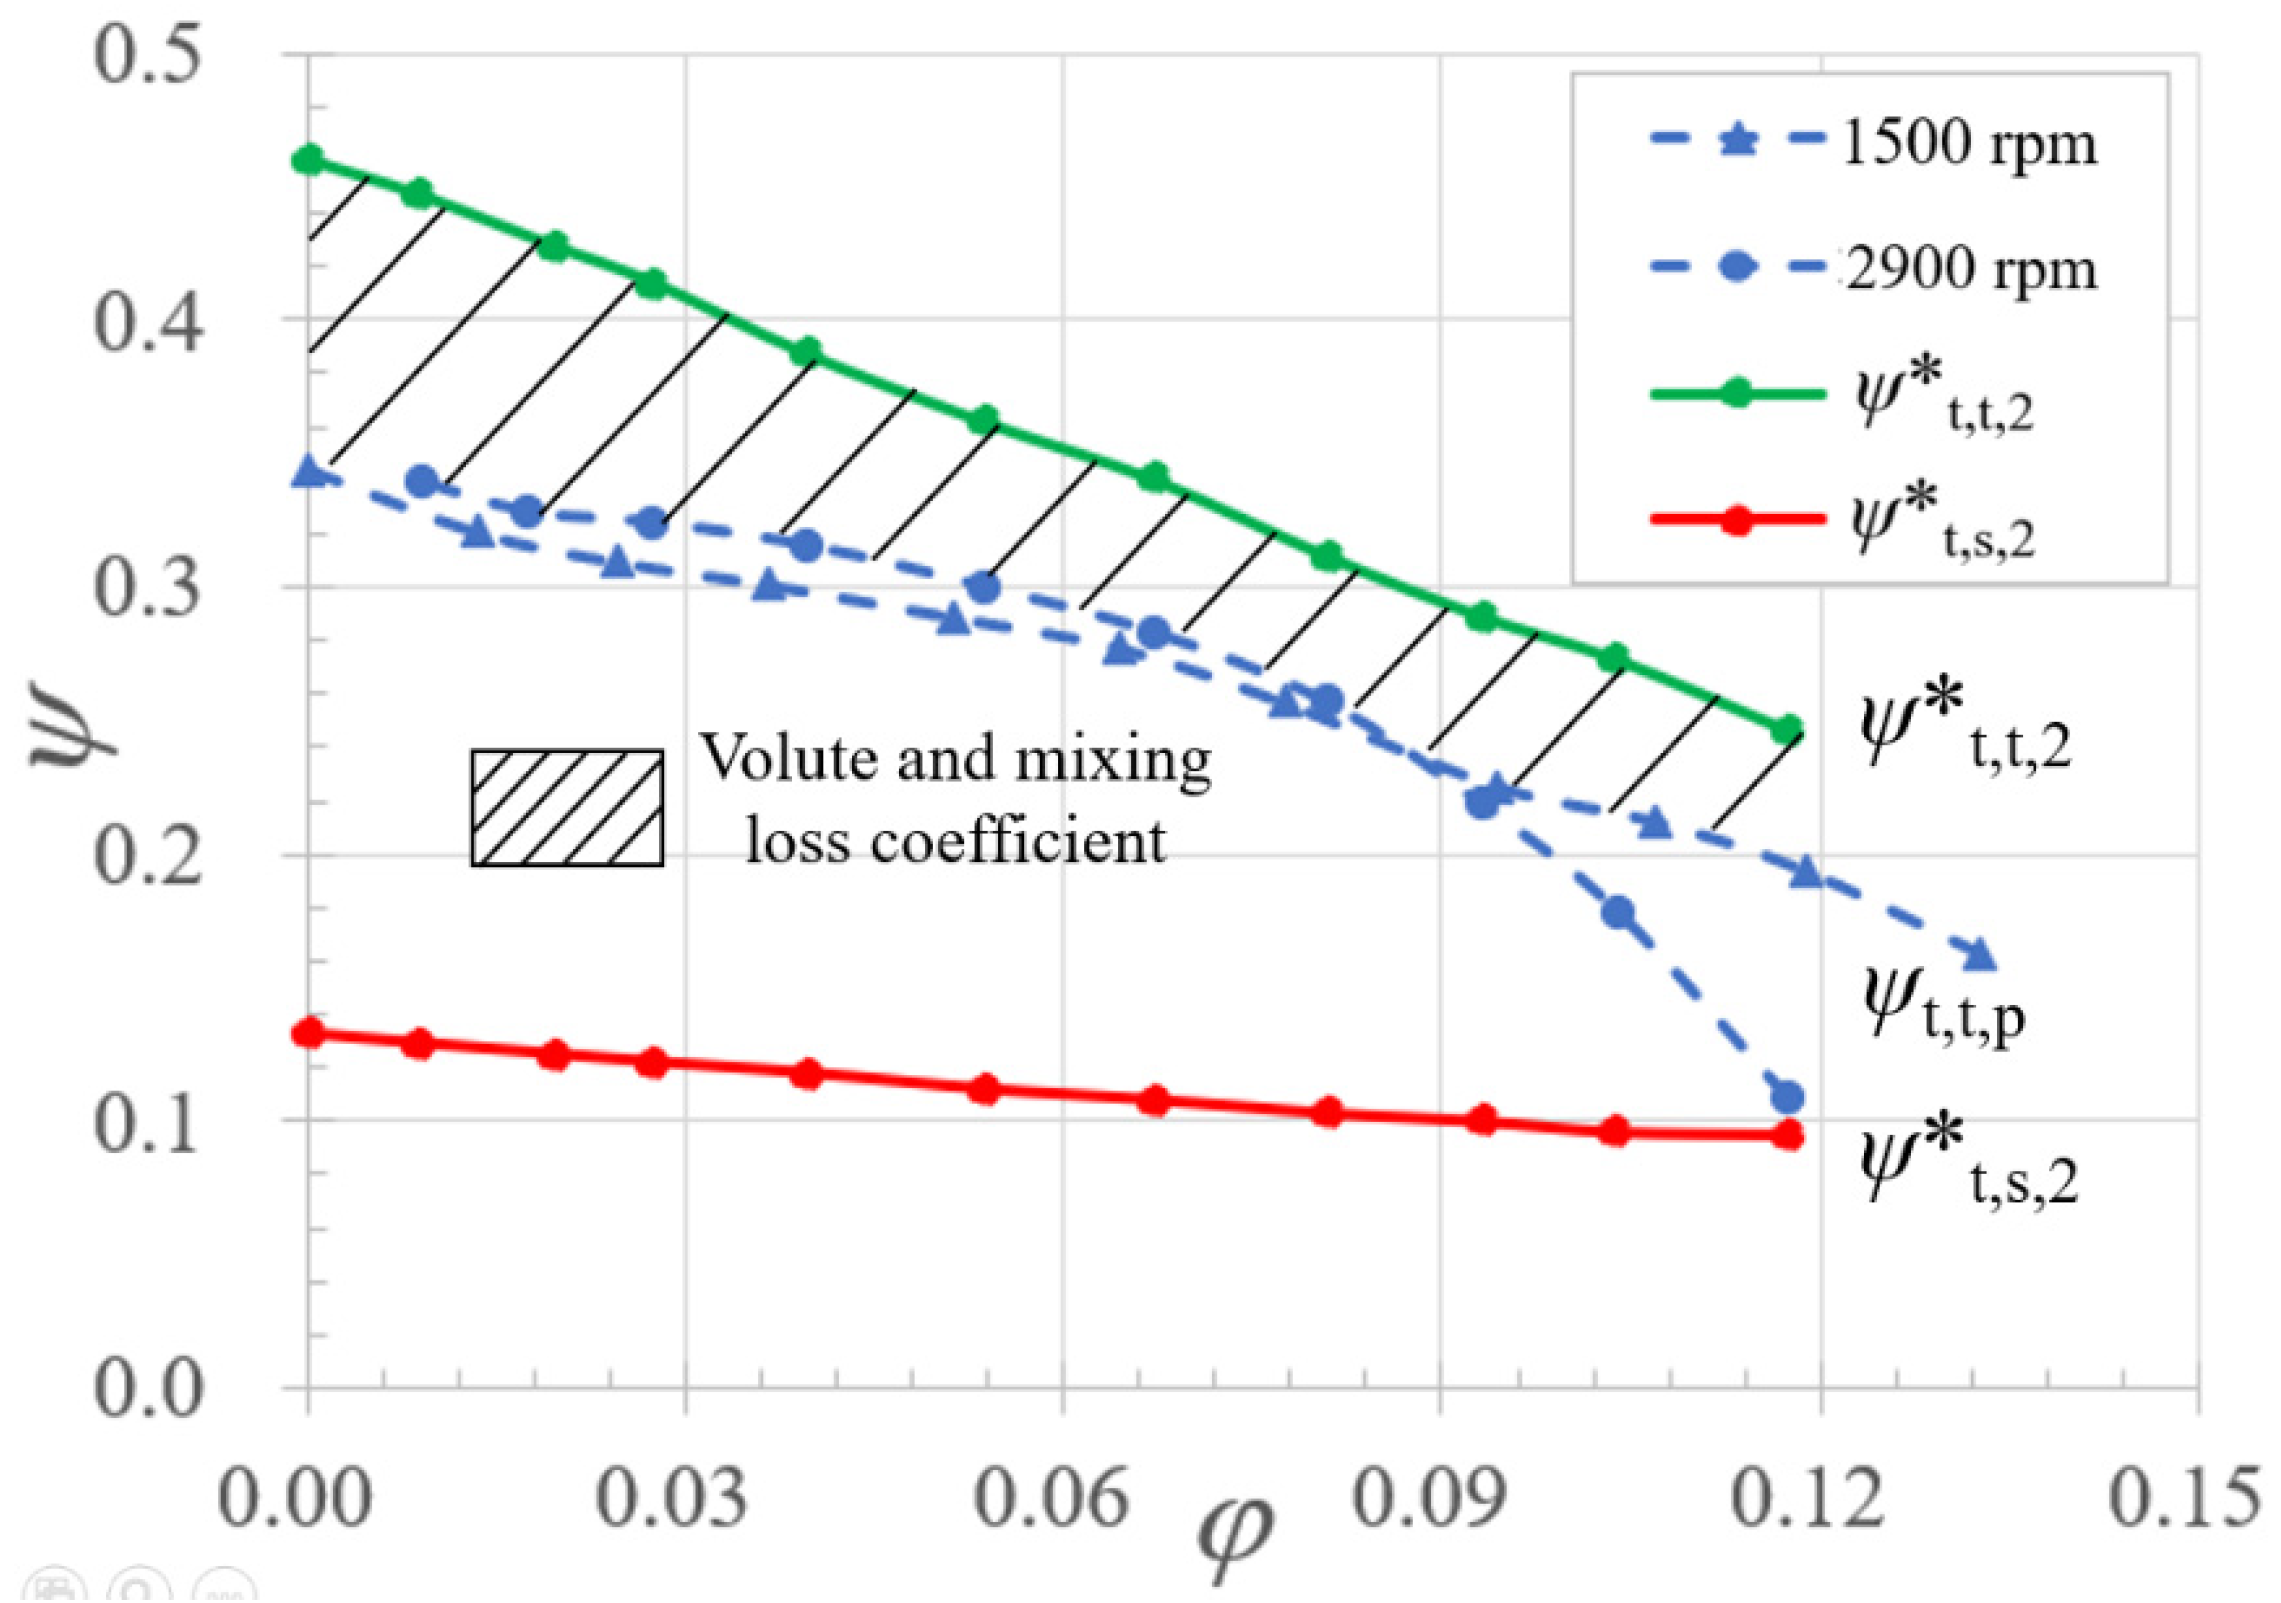
4.1. Impeller Total Head Coefficient ψt,t,2 versus Flow Coefficient φ

Measurements of the local static pressure at the impeller outlet section cannot be performed because both discs are rotating. Since the CFD results provide rather good overall performance predictions compared to experimental ones (see Figure 13), the mass-average total to static ψ*t,s,2 and total to total ψ*t,t,2 head coefficients for the impeller component alone, resulting from the CFD, are plotted in Figure 14 for several flow coefficients in addition to the experimental total head pump coefficient ψt,t,p, which is reproduced from Figure 8. Each coefficient expression is provided as follows:
ψ*t,s,2 = (Ps,2Pt,1)imp/ρU22 for the total to static coefficient
ψ*t,t,2 = (Pt,2Pt,1) imp/ρU22 for the total to total coefficient
It can be observed that the total of the static head gradient inside the impeller is small. For φ = 0, the total of the static head coefficient is equal to ψ*t,s,2 = 0.118, with the corresponding total to total head coefficient ψ*t,t,2 being equal to ψ*t,t,2 = 0.458. These values come for an extrapolation of the CFD results, which were already presented.
(1)
These two-limiting couple of values allow us to check if the coherence of these results using the so-called rotary pressure, which can be derived from the energy conservation in the relative frame of reference and can be written as follows (Gülich [25]):
P1 + 0.5ρ(W12U12) = P2,id + 0.5ρ(W22U22)
along a mean streamline for an ideal transformation. For a real transformation, it can be written as (Gülich [25]):
P1/ρg + (W12U12)/2g = P2/ρg + (W22U22)/2g + head losses
or:
P2/ρgP1/ρg= (U22U12)/2g − (W22W12)/2g − head losses
So,
head losses = (U22U12)/2g − (W22W12)/2g − (P2P1)/ρg = 31 m
The corresponding loss coefficient is equal to 0.33. The one obtained from the correlation is about 0.36 and corresponds to a 10% difference between the CFD and the model.
(2)
For φ = 0.1183, the difference between ψ*t,t,2 and ψ*t,s,2 can be written as
ψ*t,t,2ψ*t,s,2 = (Pt,2Pt,1) imp/ρU22 − (Ps,2Pt1)imp/ρU22 = Vθ22/2U22 + Vr22/2U22
According to the theoretical head coefficient in Figure 9, one can determine that Vθ2/U2 = 0.56, so Vθ22/2U22 = 0.1568. Then, Vr22/2U22 = 0.0074. As such, the estimated value of ψ*t,t,2ψ*t,s,2 = 0.1642. Compared to the value from Figure 14, which corresponds to ψ*t,t,2ψ*t,s,2 = 0.1518, there is a difference of 7.5% that can be considered small according to the simplification adopted to obtain this value.
(3)
For φ = 0, the difference between the total and static head at the impeller outlet can be written as (Gülich [25]):
H2h2 = V22/2g
and for φ = 0, Vr2 = 0, and V2 = Vθ2
V22/2g = μ2U22/2g
where μ is the slip factor, which is equal to Vθ2/U2, meaning that one can obtain
g(H2h2)/U22 = 0.5
The CFD results give a value of ψ*t,s,2ψ*t,t,2 = 0.327, which corresponds to a slip factor of 0.808. This corresponds fairly well to the extrapolated value of the experimental results that correspond to the ideal theoretical head coefficient curve without recirculation, which was already obtained in previous works (Heng et al. [10]). The extrapolated value, which was deduced from the experiments in Figure 8, corresponds to 0.8 at φ = 0. Compared to the one issued from CFD, the difference is only 1%.

4.2. Impeller Internal Flow Loss Evaluation

The internal impeller loss coefficient ζimp, is obtained from the difference (ψthψ*t,t,2), which is the result of a combination of the experimental result (for ψth) and the CFD results (for ψ*t,t,2). The values are given in Figure 15 versus the flow coefficient.
ζimp can be defined as the sum of the incidence loss coefficient ζinc, the clearance loss coefficient ζcl, the blade-loading loss coefficient ζbl, the skin friction coefficient ζsf, the recirculation loss coefficient ζrec, and the losses due to the connection bolts between two discs ζbolts. Then,
ζimp = ζinc + ζbolts + ζcl + ζbl + ζsf + ζrec
The corresponding values are shown in Figure 15, and the way they are obtained from the loss correlation modelling is presented and detailed in Section 5.

5. One-Dimensional Loss Prediction

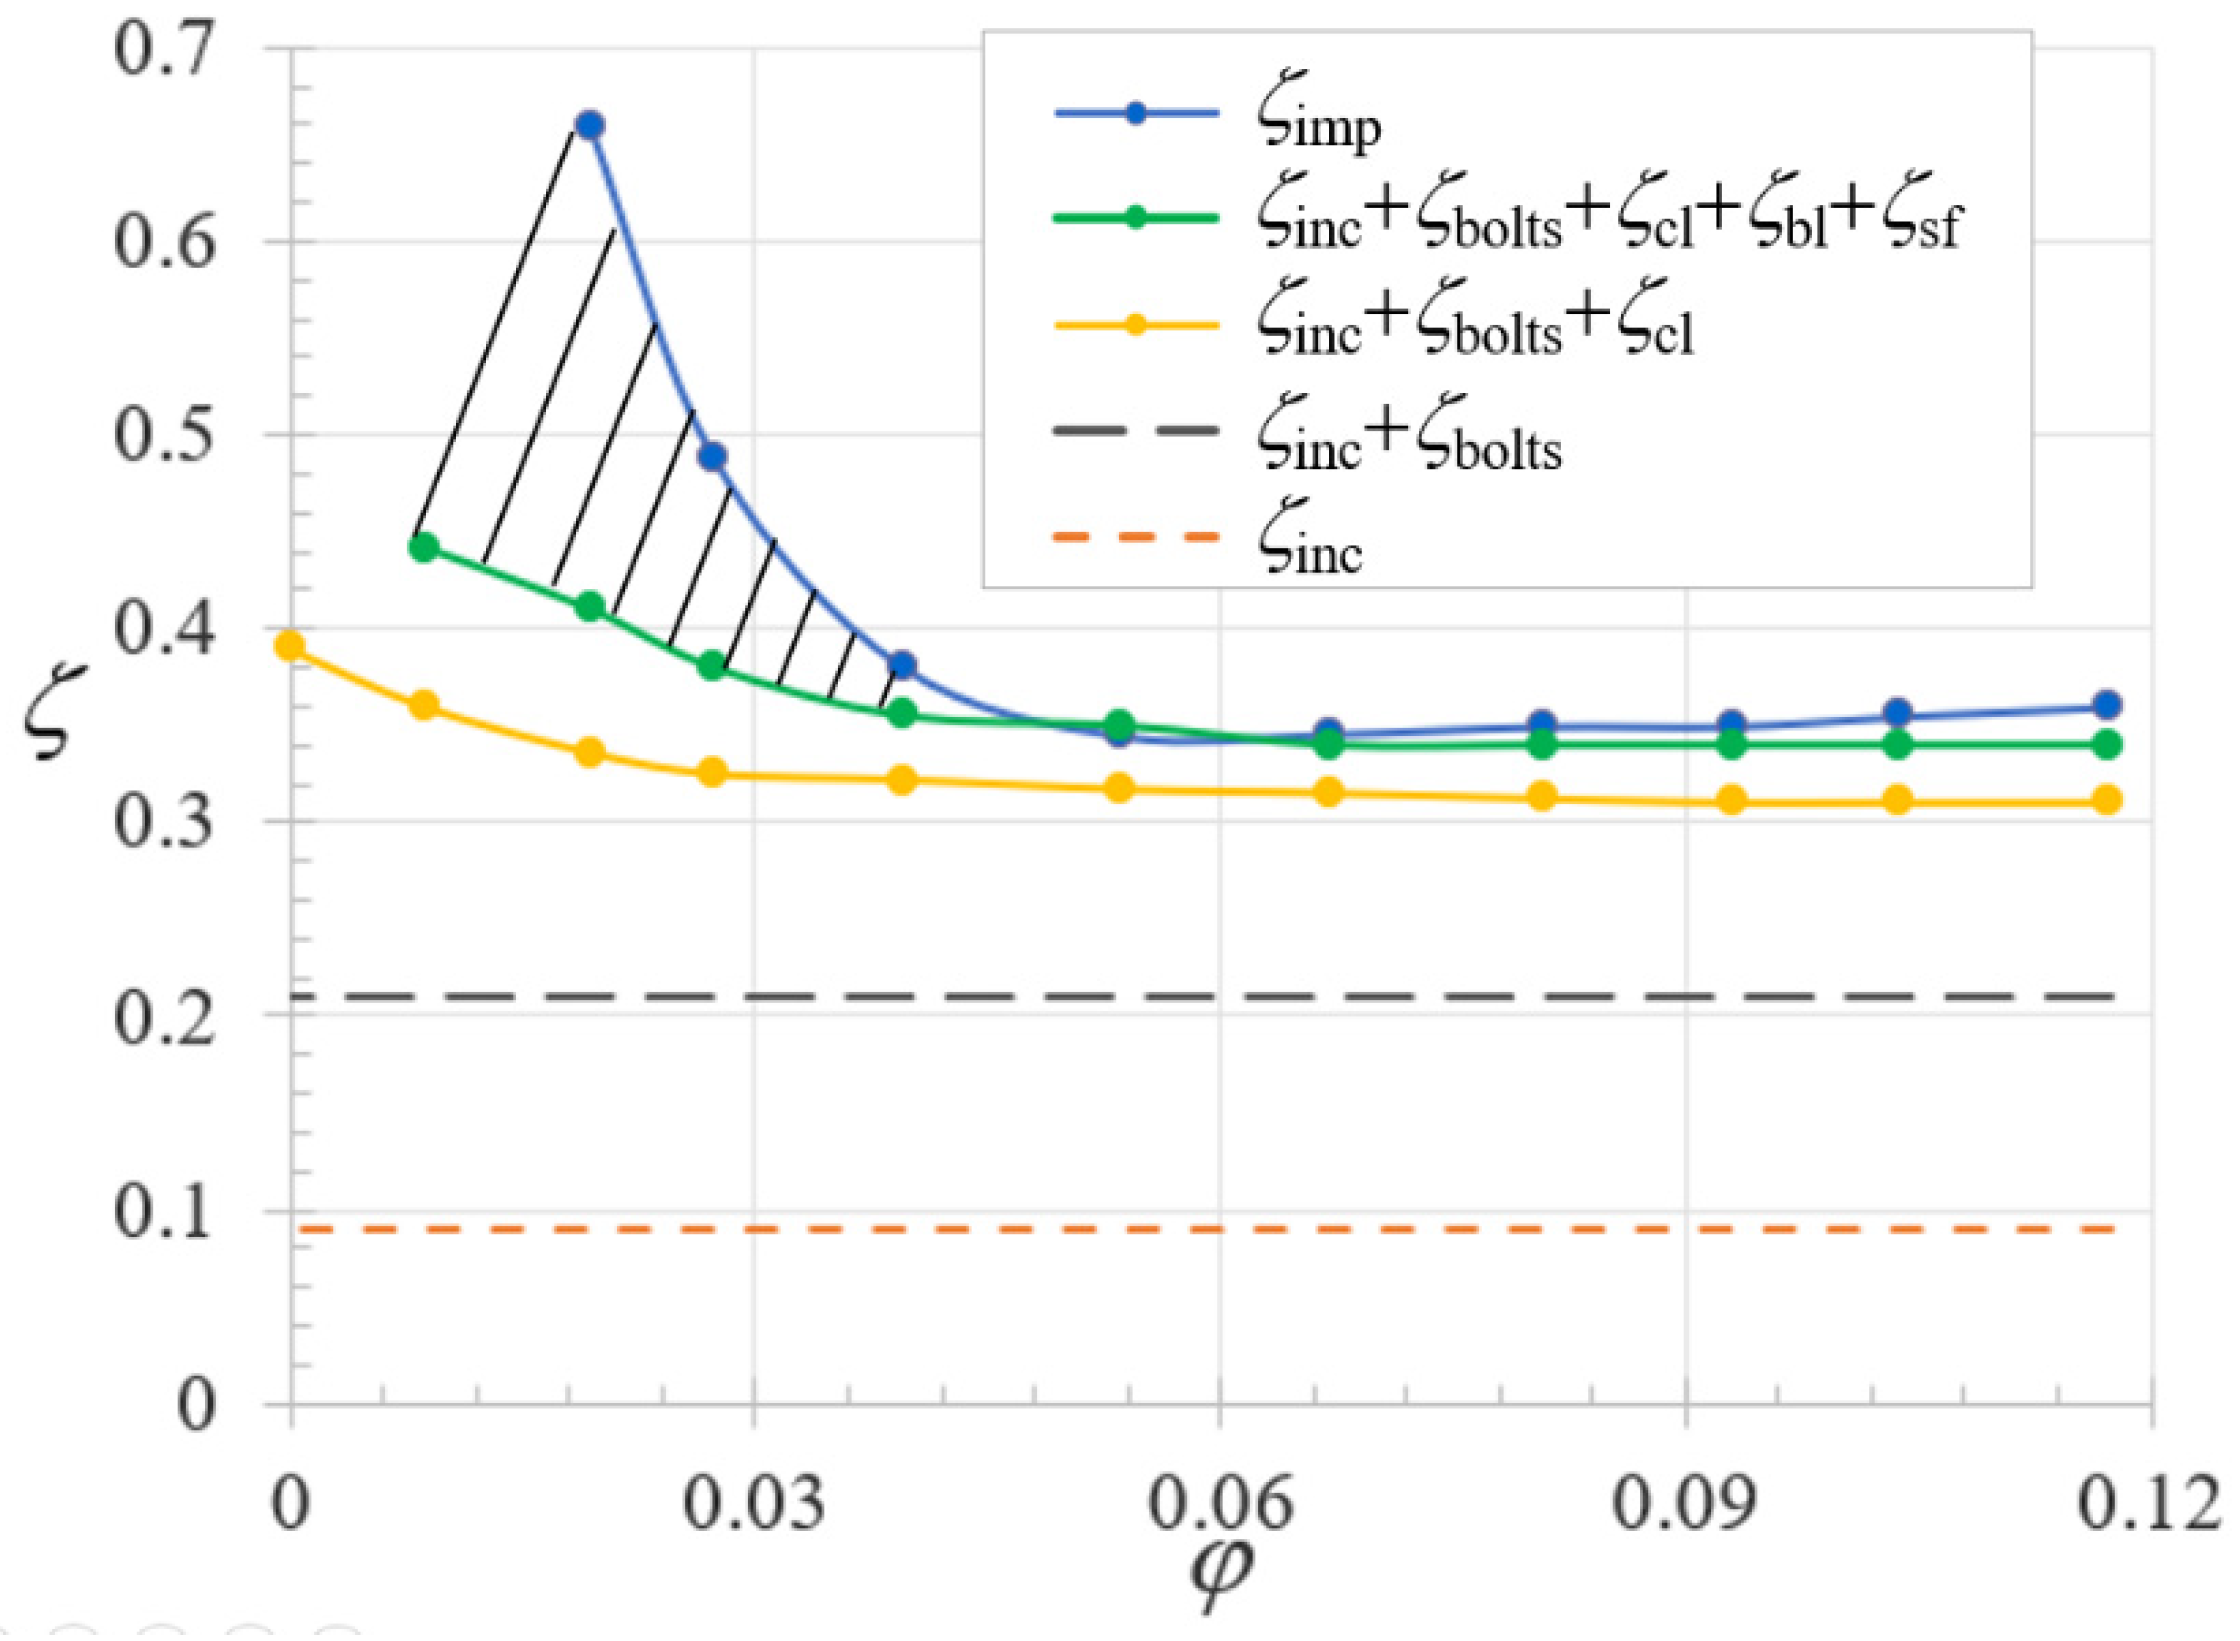
5.1. Impeller Loss Model Coefficient

The present analysis takes advantage of existing one-dimensional approaches proposed by several authors, such as Galvas [28] for incidence effects; Jansen [29] for blade-loading and clearance loss models; Johnston and Dean [30] and Coppage and Dallenbach [31] for mixing and recirculation loss models. The incidence loss correlation coefficient can be obtained from the following relationship [28]:
ζinc = (W1 cos (β1β1))2/2U22, for a complete blade.
The corresponding loss corresponds to the entire kinetic energy associated with the changes in the tangential velocity component from the impeller inlet section. This is because the blade angle β1 = 90° and absolute velocity component is always quite a bit smaller than the rotational velocity U = ωR1. The corresponding incidence loss coefficient given from the model can be approximated by:
ζinc = Us12/2U22 = (Rs1/R2)2/2 = (0.06/0.1)2/2 = 0.18
Because the bladed area is half of the total impeller with, the corresponding loss coefficient is equal to 0.08. However, this evaluation is based on a simplified assumption for which the uniform inlet flow is supposed to be present at the impeller inlet section. This is the reason why this value can vary within an uncertainty band of ± 2%. This result can be seen in Figure 15, with additional model loss evaluations for clearance, blade-loading, and skin friction being expressed below.
The losses corresponding to the bolts are modelled using the drag coefficient around the cylinders assuming a local Reynolds number that is based on the bolt diameter and the rotational velocity of the bolts; it is equal to 0.10 for the present disc pump model, within ±2.5%, depending on the drag coefficient evaluation.
Clearance loss model: This model determines the loss amount due to the fluid leakage from the pressure side to the suction side proposed according to Jansen [29] using the following equation:
ζ c l = 0.6 c l b 2 V θ 2 U 2 [ 4 π b 2 Z B ( R s 1 2 R h 1 2 ( R 2 R s 1 ) ) V r 2 V θ 2 U 2 2 ] 1 2
The skin friction loss coefficient (ζsf), diffusion factor, and related blade-loading loss coefficient (ζbl) [29,30,31] are given by Equations (25), (26), and (27), respectively.
ζ s f = 2 C f L h y d d h y d W ¯ 2 U 2 2
ζ b l = 0.05 D 2
and
W ¯ = 2 W 2 + W h 1 + W s 1 4
The diffusion factor D was defined by Whitfield and Wallace [32] and was extended to off-design conditions by Rodgers [33] as follows:
D = 1 W 2 W s 1 + 0.6 ψ t h W 2 W s 1 [ Z B π ( 1 R s 1 R 2 ) + 2 R s 1 R 2 ] 1
The skin friction and blade-loading loss coefficients were found to be small compared to the clearance and incidence losses. The summation of above five loss coefficients is quite close to the CFD results within ± 5% uncertainty, which is an acceptable result based on these correlations. This means that the inlet loss values coming from the inlet pipe can be considered to be negligible.
The recirculation loss coefficient can be estimated using the Coppage and Dallenbach [31] correlation as:
ζ r e c = 0.02 D 2 c o t α 2
The recirculation losses were found to be small for flow coefficients higher than φ = 0.05. However, they increased when the flow coefficient decreased. They correspond to the hatched area shown in Figure 15. This is because the small value of the absolute angle α2 at the impeller outlet ζrec can reach a value of 0.6 for φ = 0.02. This explains the rapid increase in the total loss coefficient of the impeller observed in Figure 15.
Additional loss evaluation due to the presence of bolts is specific to the present geometry since bolts do not exist for conventional designs with complete blades. This evaluation is based on the bolt diameter dbolt and the bolt rotational speed Ubolt, which leads to a turbulent regime since the Reynolds number related to the bolts is equal to 2.7 × 10⁵.
The corresponding loss level is independent of the flow rate because it is assumed that most of the dynamic local pressure 0.5ρWbolt2 can be approximated by 0.5ρUbolt2 with Ubolt = ωRbolt, with Rbolt = 0.075 m.
The corresponding evaluation of the loss coefficient ζbolt is:
ζbolt = k(Ubolt/U2)2 = k(Rbolt/R2)2 = 0.1125, using k = 0.2

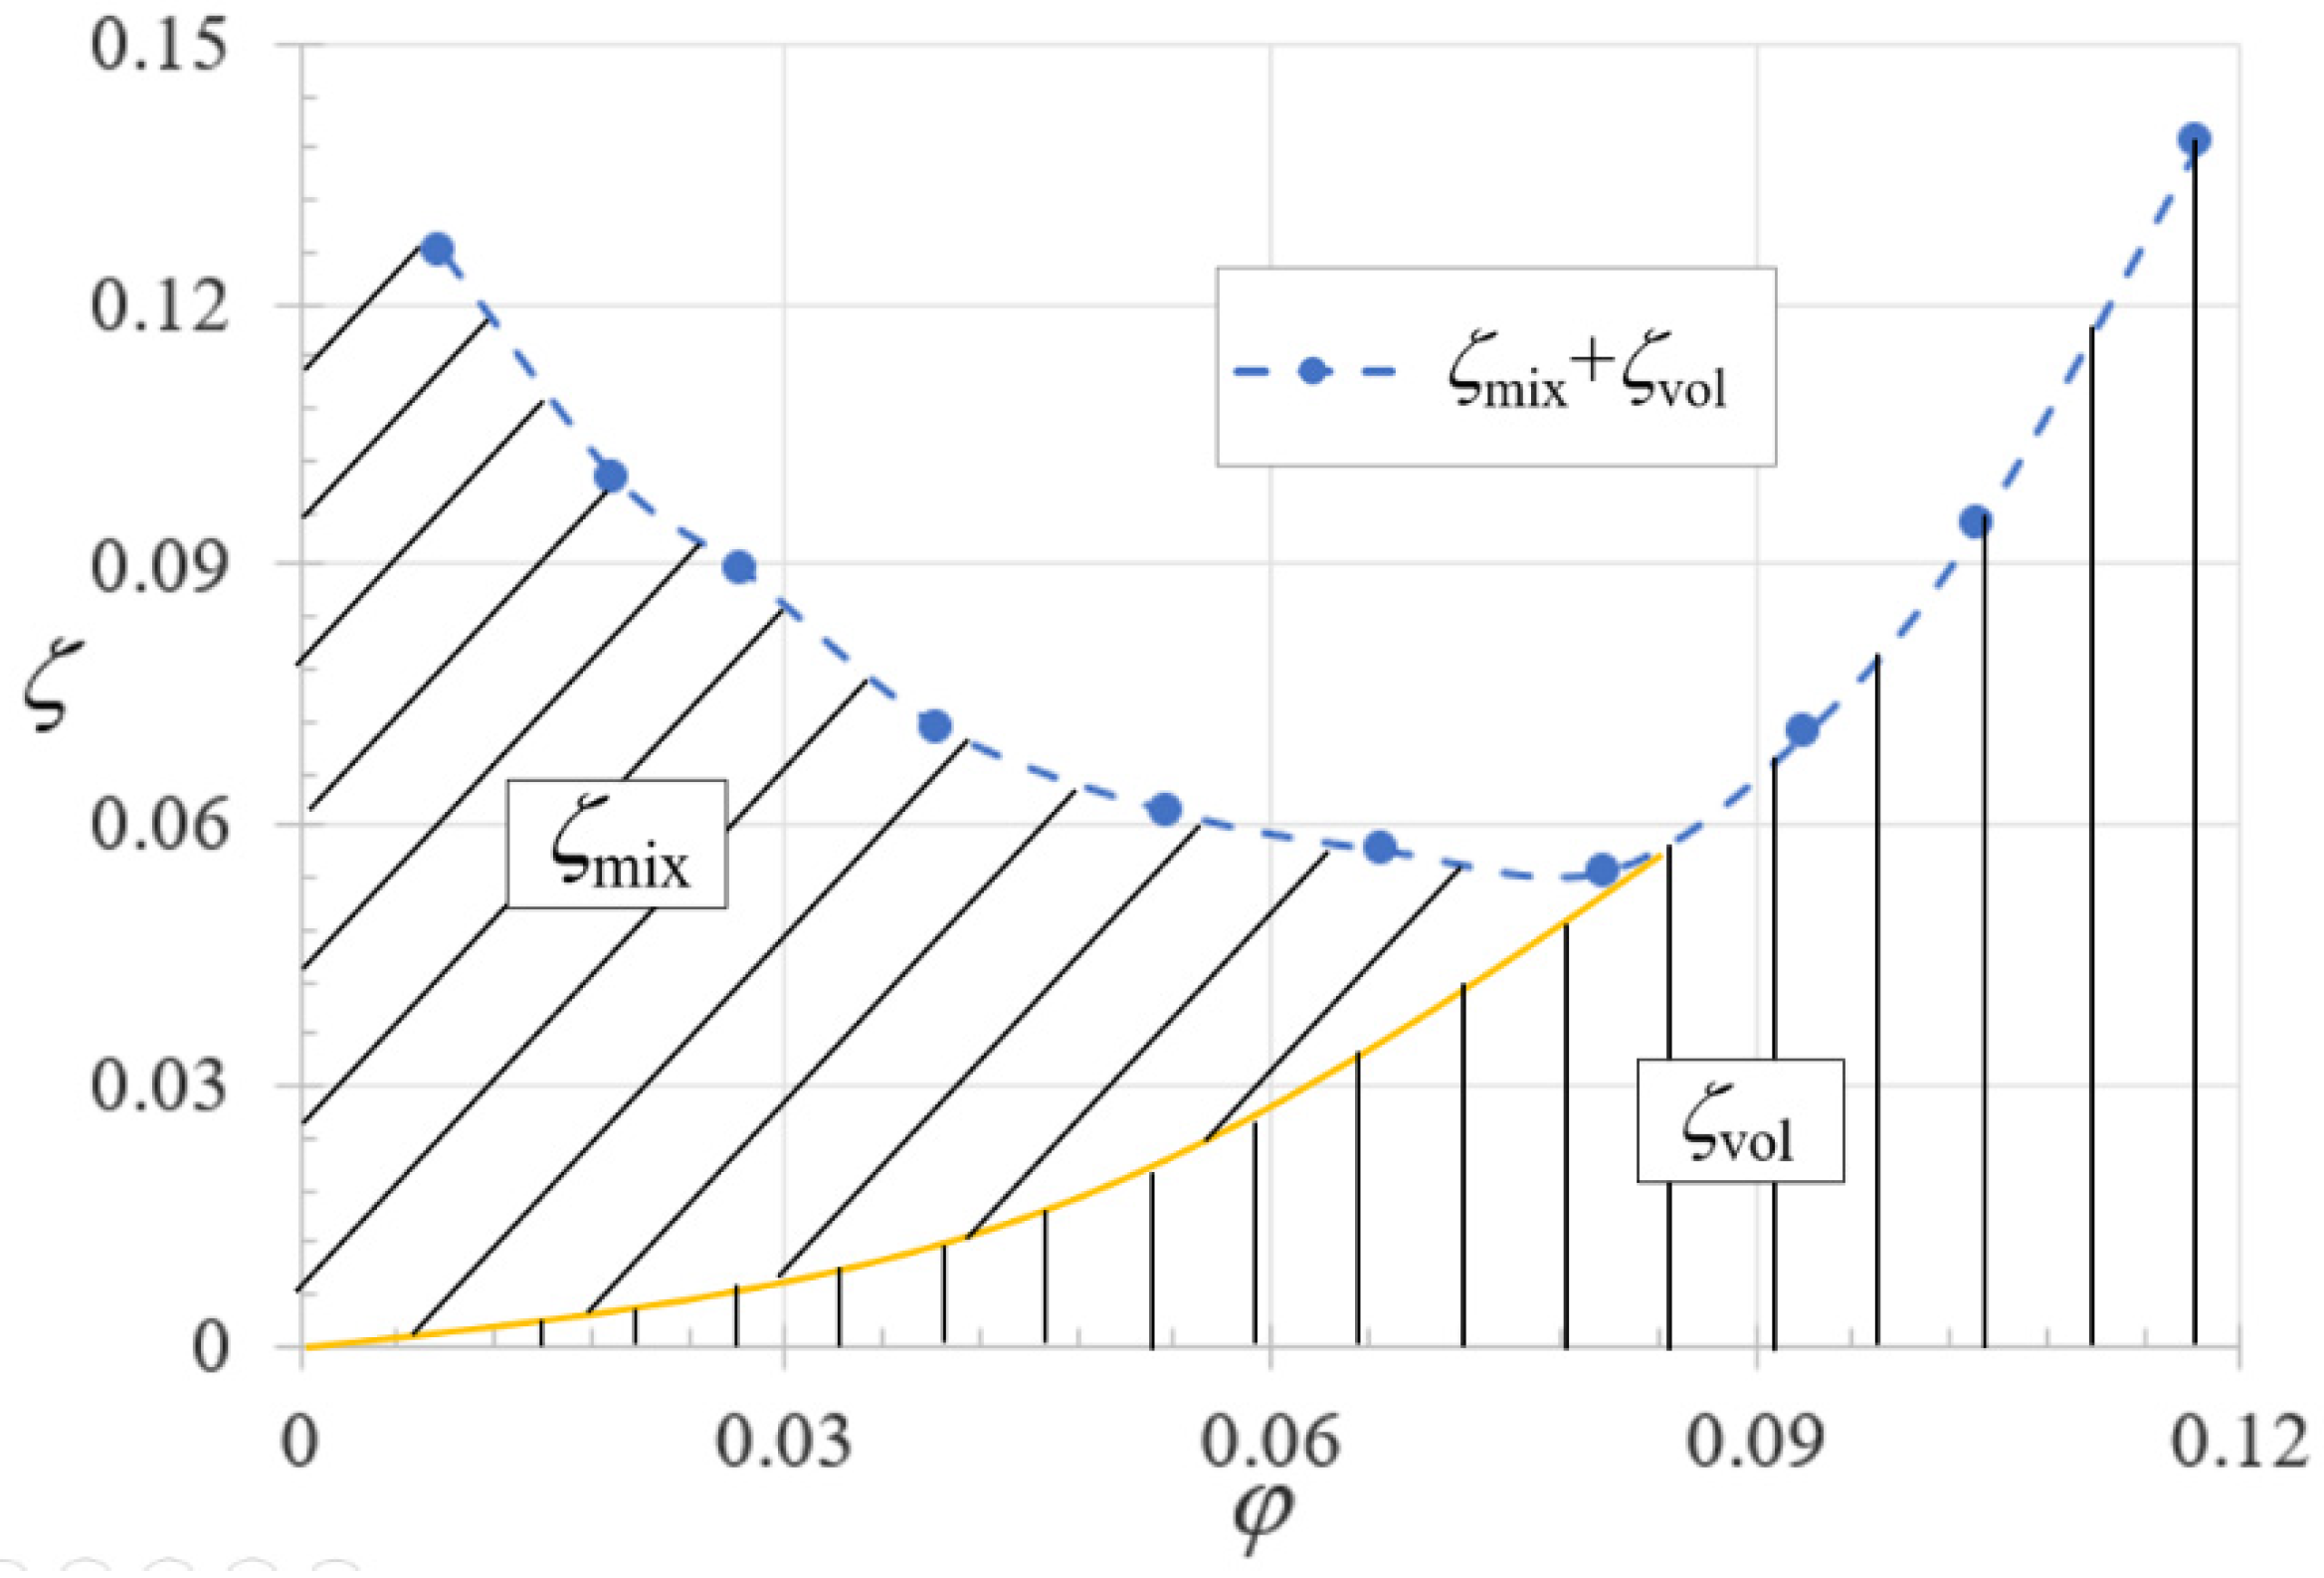
5.2. Volute Loss Coefficient

Volute losses include mixed losses that generally develop at the inlet part of the volute just after the impeller outlet section. They can be written as the loss coefficient after the impeller being equal to (ζmix + ζvol). In this last relationship, ζvol corresponds to the volute loss coefficient with an ideal uniform inlet volute velocity without mixing effects.
The evolutions of (ζmix + ζvol) = ψ*t,t,2ψt,t,p are given in Figure 16. The corresponding loss coefficient exhibits minimum values for flow coefficient 0.075, for which the maximum efficiency values have been obtained from experiments. The yellow curve should represent the volute loss coefficient evolution that corresponds to ideal uniform inlet conditions at the impeller outlet without recirculation and without wakes.
If this assumption is adopted, then the difference between the ideal curve and the real one corresponds to the mixed loss coefficient, which increases as the flow coefficient decreases.
The mixed losses can be derived from the work of Johnston and Dean [30]:
ζ mix = 1 1 + c o t 2 α 2 [ 1 ε W b * 1 ε W ] 2 V 2 2 2 U 2 2
The first term of Equation (31) is small because the absolute angle value is quite small in the present case, regardless of the flow rate. However, the evaluation of the mixed losses strongly depends on the term in brackets, which is quite difficult to evaluate in the present case. However, the mixed loss coefficient can increase to up to one third of the impeller losses in the present case for low flow rates. The large sudden expansion from the impeller outlet width and the volute inlet width should be avoided to reduce these losses.
In a wide range of flow coefficients ranging from 0.6φopt to 2.0φopt, these loss evaluations lead us to conclude that the impeller losses reach approximatively 85% of the total hydraulic pump losses and that the volute is responsible for 15% of the total amount of pump losses. The individual loss amount inside the impeller compared to the total pump loss corresponds to 20% due to incidence effects, 25% each due to the bolts and the clearance effects, and 15% for blade-loading and skin friction effects. These percentages are obviously different for low flow coefficients because of the significant increase in the total losses due to strong recirculation effects.
An additional important result of this approach is related to the prediction of the optimum flow rate value, which allows the maximum hydraulic efficiency to be obtained. The analysis deduced from the results in Figure 16 tends to indicate that it is strongly related to the volute design parameters. These need to be confirmed using other pump designs in the future if relevant information on detailed geometries and hydraulic efficiencies are given.

6. Conclusions

An experimental analysis on global performance and on flow field inside the impeller of a TBD pump was performed using the CFD approach. Data reduction was performed using the overall data from the experiments to extract several loss coefficients from each element of the pump based on existing loss models that were initially developed for conventional pump designs. This procedure has never been presented before for the present disc pump geometry. The following conclusions can be drawn:
(1)
The overall results of the experiments were determined in a specific pump design for two different rotational speeds: 1500 and 2900 rpm. Similarity laws that usually are applied for conventional pump designs can also be applied in the present pump geometry. The maximum global pump efficiency reached 35% for a flow coefficient ψ = 0.068.
(2)
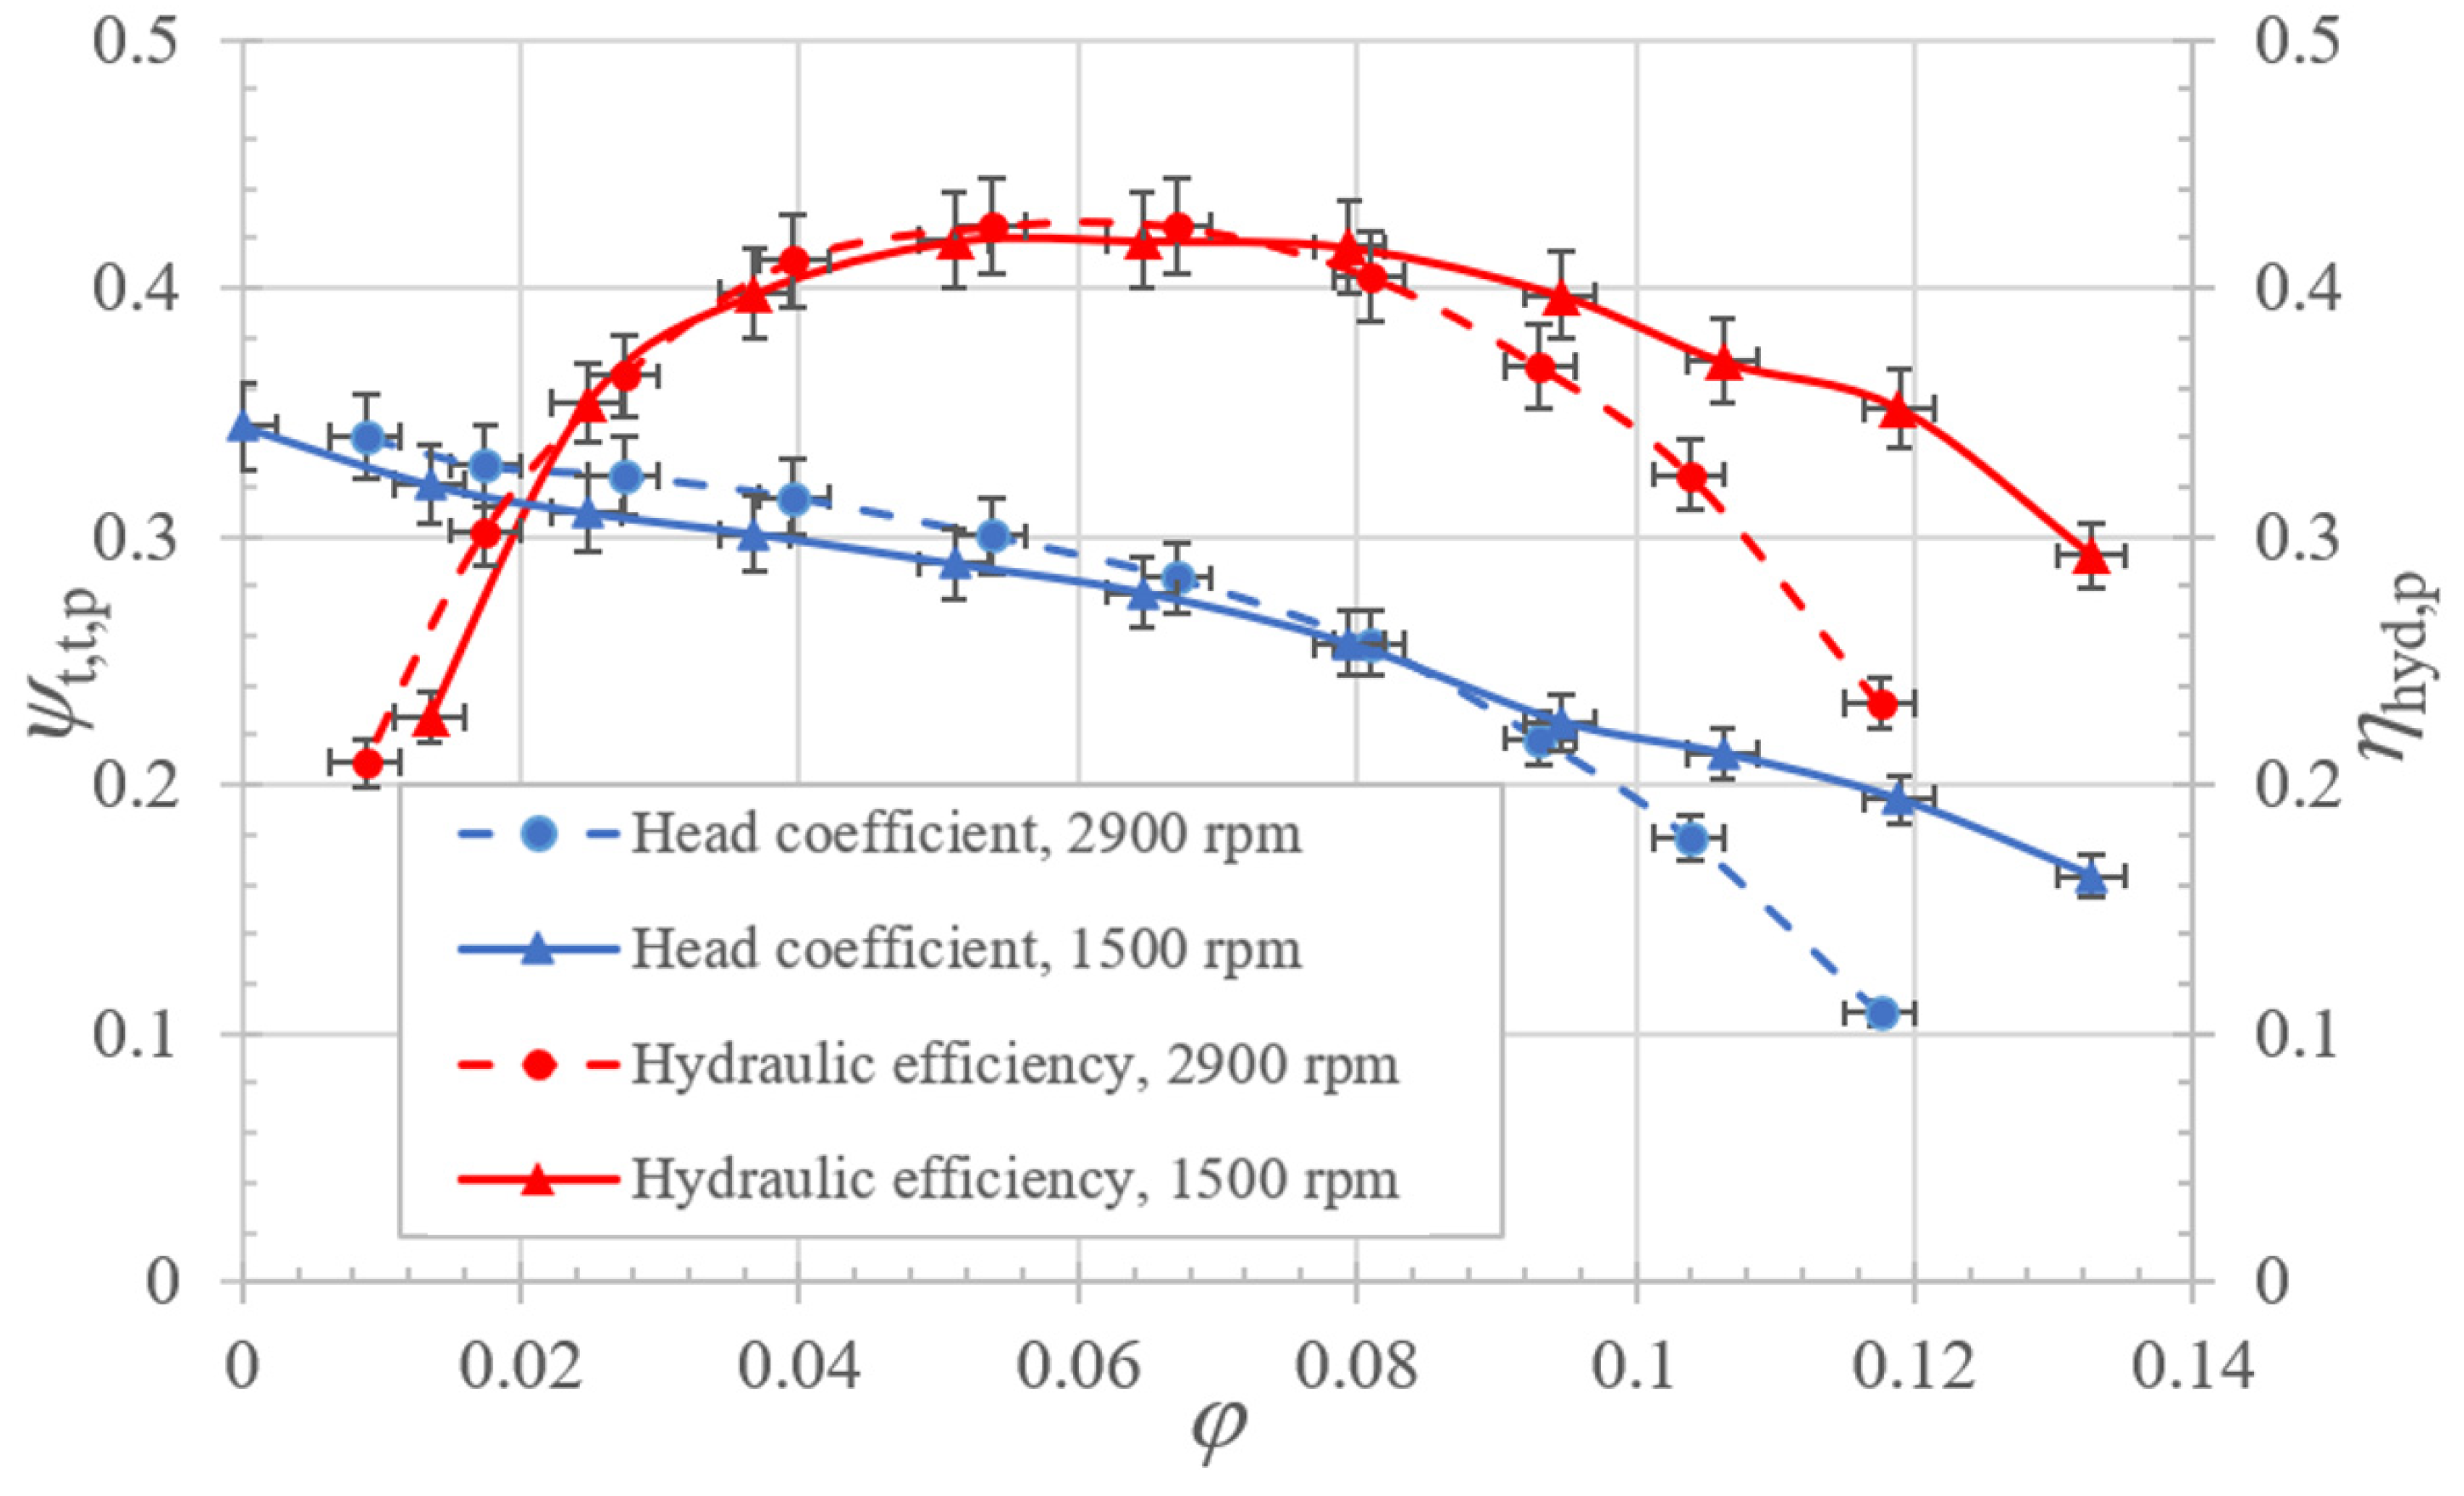
The data reduction procedure that was adopted allows that calculation of the pump’s hydraulic efficiency. The maximum hydraulic efficiency value was close to 42%. It is equivalent to conventional semi-open impeller geometries with large clearance.
(3)
The present loss correlation evaluation can predict such disc pump performances within a maximum error range of ± 5% for a rather wide flow coefficient range. This procedure also allowed us to have good initial predication for the optimum flow rate value for a given rotational speed. Such a prediction is usually related to the optimum incidence angle for conventional designs but cannot be applied in pure radial blade shapes that are often used in co-rotating disc pumps.
(4)
The present loss evaluation can basically be applied to different disc pump geometries since it only relies on geometrical parameters and mean velocity components that can be obtained using one dimensional assumptions and classical similarity laws that are generally used in rotating machinery.
(5)
The losses inside the impeller reached 85% of the total pump losses. The impeller efficiency reached a maximum value of 50%. The most important effects come from incidence, inter-blade leakage, and bolts losses. The blade-loading and friction losses inside the impeller were small due to small static pressure increases inside the impeller. Further investigation into the effects of the number of bolts and their location relative to the blade should be an important issue for reducing the related loss levels.
(6)
Mixing losses downstream of the impeller are important below maximum flow coefficient values. This means that attention must be taken on the volute design that must be adapted to the present case.
(7)
Based on the present results, a comparative study on the relative influence of geometrical parameters, such as the blade height ratio, impeller outlet width, and blade angle should be performed in the future. The authors also recommend providing mor detailed geometrical information on the bolt diameter and radial location in the impeller. Mechanical and disc friction power must also be evaluated to determine the hydraulic efficiency for the whole flow rate range. Problems related to bolt location and diameter must also be further analyzed due to mechanical stress and disc deformation.

Author Contributions

Writing—original draft preparation, Y.H. and G.B.; writing—review and editing, Y.H. and G.B.; software, K.H.; funding acquisition, Q.J. and X.L.; methodology, G.B.; validation, K.H. and W.Z. All authors have read and agreed to the published version of the manuscript.

Funding

This research was funded by National Key R&D Program of China (2018YFB0905200), Open Fund of Key Laboratory of Fluid and Power Machinery, Ministry of Education, Xihua University (Grant No. LTDL2021-008), Sichuan Science and Technology Program (No. 2020YFH0152, 2020YFH0135 and 2021YFH0027), and the National Natural Science Foundation of China (No. 52079118).

Institutional Review Board Statement

Not applicable.

Informed Consent Statement

Not applicable.

Data Availability Statement

Not applicable.

Conflicts of Interest

The authors declare no conflict of interest.

Nomenclature

b
b*
cl
impeller channel width (m). b = 2h + cl
ratio of diffuser inlet height to impeller outlet height
inter blade clearance
Cffriction coefficient
Cf = 0.0622Re−0.2 when Re > 3 × 10⁵
Cf = 2.67Re−0.5 when Re < 2 × 10⁵
CFDrelated to computational fluid dynamic results
ddiameter (mm)
Ddiffusion factor
EXPrelated to experimental results
gacceleration (m2/s)
hblade height (m).
Htotal head (m)
kcoefficient
Llength (mm)
nrepeat times of the measurements
Nrotational speed (rpm)
Ppressure (Pa)
Pdiscdisc power (W)
Psshaft power (W)
Qvolume flow rate (m3/s)
Rradius (m)
Urotational velocity (m/s), U = ω R
Ucmeasurement uncertainties
Vabsolute velocity (m/s)
Wrelative velocity (m/s)
xvalue of measured data
ZB
a
β
number of impeller blades (-)
absolute flow angle (°), from tangential direction
relative flow angle (°), from tangential direction.
β’
εw
blade angle (°), from tangential direction
wake blockage coefficient
ηgglobal efficiency (%)
ηhydhydraulic efficiency (%)
ω
ρ
angular velocity (rad/s)
fluid density (kg/m3)
φflow coefficient (-)
ψhead coefficient (-)
ψththeoretical head coefficient, (-)
ψth = ψ/ηhyd
ζloss coefficient
Ωsspecific speed = ωQ0.5/(gH)0.75
Ʌspecific radius = R2(gH)0.25/Q0.5
Subscripts
1impeller inlet section
2impeller outlet section
blblade loading
boltrelative to the bolt
clclearance
discrelative to the disc
hhub
gglobal
hydhydraulic
idideal
in, inletinlet
incincidence
impimpeller
m
mes
mechanical
related to measurement
mixmixing
optrelated to the optimum efficiency location
outoutlet
ppump
rrelated to the radial component
recrecirculation
sstatic, shroud
sfskin friction
ttip, total
ththeoretical
t,stotal to static
t,ttotal to total
tottotal
volvolute
vvolumetric
wwake
relative to blade geometry
θrelated to the tangential component
Superscripts
-
*
average, mean value
relative to the impeller

References

  1. Yin, S. The Optimization of Subsea Mud Lift Disc Pump and the Development of Its Multi-Stage Pump. Master’s Thesis, China University of Petroleum (East China), Qingdao, China, 2012. [Google Scholar]
  2. Gao, B. Flow Field Simulation and Performance Assessment for the Subsea Mudlift Disc Pump. Master’s Thesis, China University of Petroleum (East China), Qingdao, China, 2009. [Google Scholar]
  3. Zhou, C. Research on the Blade Disk Pump for Subsea Mudlift Drilling. Ph.D. Thesis, China University of Petroleum (East China), Qingdao, China, 2012. [Google Scholar]
  4. Zhang, Y. Study on Design Application Method for Subsea Mudlift Disc Pump. Master’s Thesis, China University of Petroleum (East China), Qingdao, China, 2015. [Google Scholar]
  5. Chen, Y. Strength Analysis of Fluid-Solid Interaction and Performance Improvement of Disc Pump with Radial Straight Blade. Master’s Thesis, China University of Petroleum (East China), Qingdao, China, 2013. [Google Scholar]
  6. Tesla, N. Fluid Propulsion. U.S. Patent No. 1061142, 6 May 1913. [Google Scholar]
  7. Max, I.G. Rotary Disc Slurry Pump. U.S. Patent No.4773819, 27 September 1988. [Google Scholar]
  8. Max, I.G. Rotary Disc Pump. U.S. Patent No. 4940385, 10 July 1990. [Google Scholar]
  9. Max, I.G. Rotary Disc Pump. U.S. Patent No. 7097416B2, 29 August 2006. [Google Scholar]
  10. Heng, Y.; Han, Y.; Zhang, H.; Zhang, W.; Bois, G.; Jiang, Q.; Wang, Z.; Liu, X. Tesla bladed pump (disc bladed pump) preliminary experimental performance analysis. Energies 2020, 13, 4873. [Google Scholar] [CrossRef]
  11. Hasinger, S.H.; Kehrt, L.G. Investigation of a shear-force pump. J. Eng. Power 1963, 85, 201–206. [Google Scholar] [CrossRef]
  12. Murata, S.; Miyake, Y.; Iemoto, Y. A study on a disk friction pump (1st report, theoretical analysis for flow between corotating disks). Bull. JSME 1976, 19, 168–178. [Google Scholar] [CrossRef] [Green Version]
  13. Murata, S.; Miyake, Y.; Iemoto, Y.; Akazawa, H.; Sagawa, S.; Fujita, H.; Yamaji, C. A study on a disk friction pump (2nd report, Experiments on flow through corotating disks and pump performance). Bull. JSME 1976, 19, 1160–1171. [Google Scholar] [CrossRef] [Green Version]
  14. Roddy, P.J.; Darby, R.; Morrison, G.L.; Jenkins, P.E. Performance characteristics of a multiple-disk centrifugal pump. J. Fluid. Eng.-Trans. ASME 1987, 109, 51–57. [Google Scholar] [CrossRef]
  15. Wang, B.; Okamoto, K.; Yamaguchi, K.; Teramoto, S. Loss mechanisms in shear-force pump with multiple corotating disks. J. Fluid. Eng.-Trans. ASME 2014, 136, 081101-1–081101-10. [Google Scholar] [CrossRef]
  16. Cheremushkin, V.; Polyakov, A. Optimization of the output device of a disk pump for high viscous fluid. IOP Conf. Ser. Mater. Sci. Eng. 2019, 589, 1–11. [Google Scholar] [CrossRef]
  17. Chen, Y.; Chen, G.; Zhou, C.; Zhang, Y.; Xie, Y. Analysis on the influence of blade structure on exterior characteristics of disc pump. J. Mech. Des. 2014, 31, 93–96. [Google Scholar]
  18. Yin, S.; Chen, G.; Zhou, C. New-type impeller design and performance prediction for disc pump. Fluid Mach. 2012, 40, 19–23. [Google Scholar]
  19. Yin, S.; Chen, G.; Zhou, C.; Chen, Y. Numerical analysis on the two-phase flow and performance characteristics of conical disc pump. China Pet. Mach. 2011, 39, 26–28. [Google Scholar]
  20. Zhou, C.; Qu, Y.; Zhang, D.; Gao, B. Influence of particle characteristics on the distribution of solid particles in the impeller with radial straight blade. Fluid Mach. 2015, 43, 14–18. [Google Scholar]
  21. Zhou, C.; Chen, G.; Xu, C. Numerical simulation of solid-liquid two-phase flow mechanism in disc pump with radial straight blade. J. China Univ. Pet. (Ed. Nat. Sci.) 2010, 34, 147–151. [Google Scholar]
  22. Li, B.; Qi, H.; Guo, Y.; Si, Y. Structure improvement of disc pump and its solid/liquid two-phase flow simulation. Drain. Irrig. Mach. 2009, 27, 95–99. [Google Scholar]
  23. Pei, Y.; Liu, Q.; Wang, C.; Wang, G. Analytical methods, and verification of impeller outlet velocity slip of solid–liquid disc pump with multi-type blades. Arab. J. Sci. Eng. 2020, 46, 6835–6847. [Google Scholar] [CrossRef]
  24. Heng, Y.; Jiang, Q.; Han, Y.; Zhang, H.; Zhang, W.; Bois, G.; Wang, Z.; Liu, X. Performance Analysis on a Tesla Bladed Disc Pump. In Proceedings of the 14th European Conference on Turbomachinery Fluid dynamics & Thermodynamics, Gdansk, Poland, 12–16 April 2021. [Google Scholar]
  25. Gülich, J.F. Centrifugal Pumps; Springer: Berlin/Heidelberg, Germany, 2010. [Google Scholar]
  26. AI-Obaidi, A.R. Monitoring the performance of centrifugal pump under single-phase and cavitation condition: A CFD analysis of the number of impeller blades. J. Appl. Fluid Mech. 2019, 12, 445–459. [Google Scholar]
  27. AI-Obaidi, A.R. Investigation of the influence of various numbers of impeller blades on internal flow field analysis and the pressure pulsation of an axial pump based on transient flow behavior. Heat Transf. 2020, 49, 2000–2024. [Google Scholar] [CrossRef]
  28. Galvas, M.R. Fortran Program for Predicting Off-Design Performance of Centrifugal Compressors. Available online: https://www.google.com.tw/url?sa=t&rct=j&q=&esrc=s&source=web&cd=1&cad=rja&uact=8&ved=2ahUKEwiR08PYo7jjAhXXad4KHfP5AxIQFjAAegQIBRAC&url=https%3A%2F%2Fntrs.nasa.gov%2Farchive%2Fnasa%2Fcasi.ntrs.nasa.gov%2F19740001912.pdf&usg=AOvVaw3f0Tck78T3iHWGftnDERtz (accessed on 29 January 2022).
  29. Jansen, W. A method for calculating the flow in a centrifugal impeller when entropy gradients are present. In Royal Society Conference on Internal Aerodynamics (Turbomachinery); Institution of Mechanical Engineers: London, UK, 1967; pp. 133–146. [Google Scholar]
  30. Johnston, J.P.; Dean, R.C. Losses in vaneless diffusers of centrifugal compressors and pumps. J. Eng. Gas Turb. Power 1966, 88, 49–60. [Google Scholar] [CrossRef]
  31. Coppage, J.; Dallenbach, F. Study of Supersonic Radial Compressors for Refrigeration and Pressurization Systems; WADC Technical Report, No.55-257; Equipment Laboratory: Los Angeles, CA, USA, 1956. [Google Scholar]
  32. Whitfield, A.; Wallace, F.J. Performance prediction for automotive turbocharger compressors. Proc. Inst. Mech. Eng. 1975, 189, 557–565. [Google Scholar] [CrossRef]
  33. Rodgers, C. A diffusion factor correlation for centrifugal impeller stalling. J. Eng. Gas Turb. Power 1978, 100, 592–601. [Google Scholar] [CrossRef]
Figure 1. Tesla disc pump impeller.
Jmse 10 00214 g001
Figure 2. Disc pump model [10].
Jmse 10 00214 g002
Figure 3. Present TBD pump impeller.
Jmse 10 00214 g003
Figure 4. Volute assembly.
Jmse 10 00214 g004
Figure 5. Driven and dive disc assembly.
Jmse 10 00214 g005
Figure 6. Experimental pump test bench.
Jmse 10 00214 g006
Figure 7. Experimental pump total head and global efficiency versus flow rate.
Jmse 10 00214 g007
Figure 8. Experimental total head coefficient and pump hydraulic efficiency versus flow coefficient for 1500 and 2900 rpm.
Jmse 10 00214 g008
Figure 9. Theoretical head coefficient.
Jmse 10 00214 g009
Figure 10. A 3D model of the fluid domain.
Jmse 10 00214 g010
Figure 11. Mesh of fluid domains of the whole pump.
Jmse 10 00214 g011
Figure 12. Y-plus values of the TBD pump impeller.
Jmse 10 00214 g012
Figure 13. Comparison between experimental and CFD results.
Jmse 10 00214 g013
Figure 14. Performance curves of the TBD impeller and TBD pump versus the flow coefficient.
Jmse 10 00214 g014
Figure 15. Impeller loss coefficients versus flow coefficient.
Jmse 10 00214 g015
Figure 16. Volute and mixed loss coefficients versus flow coefficient.
Jmse 10 00214 g016
Table 1. Main geometrical parameters of present TBD pump.
Geometric ParametersValues
Inlet shroud tip radius R1s60 mm
Inlet tube radius R150 mm
Outlet radius R2100 mm
Number of blades ZB8
Number of bolts8
Bolt diameter12 mm
Radial bolt location75 mm
Inter blade clearance gap cl8 mm
Blade height h4 mm
Blade angle β90° (radial blade)
Impeller channel width b16 mm
Specific speed Ωs0.8
Specific radius Λ2.4
Table 2. Mesh independency analysis.
Mesh Number (Million)HeadEfficiency
Inlet and Outlet PipesImpellerVolute and LeakagesTotal
10.110.350.430.8930.8925.31
20.330.641.202.1730.0523.88
30.581.402.594.5729.9523.82
40.792.814.438.0329.7723.63
Publisher’s Note: MDPI stays neutral with regard to jurisdictional claims in published maps and institutional affiliations.

