Article

Dredged Material Decision Tool (DMDT) for Sustainable Beneficial Reuse Applications

Department of Civil, Materials, and Environmental Engineering, University of Illinois at Chicago, 842 West Taylor Street, Chicago, IL 60607, USA
*
Author to whom correspondence should be addressed.
J. Mar. Sci. Eng. 2022, 10(2), 178; https://doi.org/10.3390/jmse10020178
Submission received: 16 December 2021 / Revised: 22 January 2022 / Accepted: 26 January 2022 / Published: 28 January 2022
(This article belongs to the Special Issue Sediment Remediation at Harbour)

Abstract

:
The Dredged Material Decision Tool (DMDT) was developed by the United States Environmental Protection Agency (USEPA) to allow project managers, stakeholders, and communities to quantify environmental, economic, and social considerations of using dredged material for beneficial purposes. Dredged material may be disposed in a confined disposal facility (CDF); however, this option is unfavorable because of the finite capacity problems these facilities pose. A more sustainable option is to use dredged materials beneficially such as construction material, for habitat restoration, or for brownfield remediation projects. This study demonstrates the applicability of the DMDT to three relevant candidate projects: (1) Dog Beach, Greenwood, and Lee Street Beaches (Evanston, IL, USA); (2) New York-New Jersey Harbor (New York/New Jersey); and (3) Poplar Island (Chesapeake Bay). The DMDT requires the project information and then completion of worksheets with each criteria (biophysical environment, economic, governance, social, and built environment) ranked, weighed, and scored. The DMDT is applied for all potential alternatives and the results are then analyzed to select the best beneficial reuse alternative. It was found that for the beaches in Evanston, the most beneficial option was on-beach placement with hydraulic dredging. The best option for the New Jersey Harbor was found to be using for brownfield and landfill remediation. The best option for Poplar Island was the lateral and vertical expansion of 50% uplands and 50% wetlands. Overall, DMDT is found to be a valuable tool to facilitate the evaluation of multi-criteria based on the project-specific data and help select the best beneficial use alternative for the dredged material.

1. Introduction

Dredging is the excavation of silt, sediments, debris, and other materials from the bottom of lakes, rivers, harbors, and oceans. This dredged material is usually removed from underwater or partially underwater in shallow bodies of water. There are three commonly used methods for dredging materials: mechanical, hydraulic, and hydrodynamic dredging. Each method is tailored specifically to the project that requires dredging and each method has its own advantages and disadvantages. The dredged material can either be utilized at the dredging location or it can be repurposed for another use off-site. There are also occurrences when the dredged material will be disposed of. Applicable regulations must be conformed to dispose of any dredged material properly.
The US Army Corps of Engineers (USACE) is responsible for the maintenance of navigation channels, and the port authorities are responsible to manage the harbors. Approximately 4 million cubic yards of sediment are dredged from 136 harbors on the Great Lakes. The problem that faced by USACE and the port authorities is how to dispose of the materials that are dredged from the harbors. Half of the 4 million cubic yards of material are contaminated and are not eligible for beneficial use. Dredged materials containing heavy metals, polycyclic aromatic hydrocarbons (PAHs), polychlorinated biphenyls (PCBs), dioxins, and furans are disposed in a confined disposal facility (CDF) [1].
The CDF poses its own finite capacity problem. Replacing a CDF is expensive and complicated. It requires funding from non-federal organizations and the use of scarce land. The USACE has operated 45 CDFs and has managed over 90 million cubic yard of contaminated sediments over the past 40 years. There are a variety of concerns surrounding CDFs, such as environmental risks to wildlife and the risk to surrounding habitats if the contamination was to ever be released.
Several concerns have been expressed by the interest groups about CDFs. There may be opposition and hesitation towards these facilities, having a ‘not in my backyard’ attitude. There are concerns about noise, odors, aesthetics, and property values. There are human impacts, with concern of contamination of water supplies, beaches, groundwater, and fisheries. The decisions on alternatives to disposal of dredged material are generally subjective because of the lack of guidance. However, the USEPA recently developed a tool to assist in finding the best alternative to dispose of dredged material. This tool is known as Dredged Material Decision Tool (DMDT), aimed at decision making on beneficial reuse options to the disposal of dredged material [2,3].
The tool works by considering different options by the user. It does this by considering and weighing the environmental, social, and economic factors of dredged material management. With these complex factors influencing the decision, the tool makes the decision process simple. DMDT requires a set of questions to be answered by the user, thereby assisting in finding the best dredged material management option. The tool provides charts and scores (scorecards) based on the user’s input to help visualize the different management options possible. Complete details can be found in the DMDT User Manual [2].
This study presents example applications to demonstrate how to apply the DMDT and to demonstrate the outcomes of its use. Specifically, this study addresses the concerns of how to handle dredged materials by analyzing several case studies associated with the disposal of dredged materials. The selected case studies included: (1) beach sites in the City of Evanston, (2) New York/New Jersey Harbor, and (3) Poplar Island. Along with the handling of the dredged materials, the effects of dredged materials on residents and the environment are also assessed.

2. Dredged Material Decision Tool (DMDT)

The DMDT helps to evaluate sustainable alternatives for dredged material disposal by considering relevant economic, environmental, and social impacts. It should be noted that reuse of dredged material is allowed only when it meets the toxicity criteria. Sustainable reuse options could include: using to cap contaminated soil at Superfund or Brownfield cleanup sites, using for road construction, using to create green spaces, and to increase habitat for plants and animals. The scoring in DMDT considers multiple factors such as habitat impacts, transportation costs, job creation potential, and infrastructure improvements. The highest scoring option is considered the preferred option as it best meets the stakeholder needs, regulatory requirements, and benefits the environment and community. The DMDT results can be presented in spreadsheets and bar graphs which make communication among the stakeholders easier. Complete details on different criteria and scoring used in DMDT can be found in its user’s manual [2,3].
The most critical aspect of using DMDT is to develop input data relevant to the specific project being assessed. Typical input data requirements for DMDT are presented below.

2.1. Input Data

The DMDT tool user interface is an Excel workbook. Each tab of the Excel workbook is a scorecard containing the criteria from the DMDT [2]. The categories of criteria include: biophysical environment (habitat restoration applications), economic (funding, placement costs and options, and transportation), governance (rules and regulations, and organizational decision factors), social (community benefits), and built-environment (utilization for construction). Each criteria includes different specific considerations [2]. For instance, biophysical environment criteria considerations include aquatic habitat, shoreline habitat, river habitat, wetland habitat, terrestrial habitat, priority habitat, restoration of native species, reduction of invasive species, stormwater management/control, and contamination reduction. Governance criteria consider maintain navigation channels, environmental windows, permits, zoning, etc. Economic criteria include funding, partnerships, transportation, project duration, business growth, long-term care, etc. Built environment criteria encompass reduced contamination, borrow sources, cap/fill material use, etc. Social benefits criteria include reduced exposure, job creation, improved infrastructure, aesthetics and park access, etc.
Project and dredging information is gathered first. Two scorecards A and B are included in the Excel tool. Scorecard A rates the different considerations in each criteria using Likert scale 1 to 5 (‘1’ represents low impact, and ‘5’ represents high impact) for different alternatives for reuse of dredged material being considered (Figure 1). Whereas Scorecard B uses binary choice “Yes” or “No” instead of scores 1 to 5.

2.2. Ranking Criteria

Criteria are ranked (C rank) in the order of importance to the stakeholder completing the scoresheet (Figure 1). Scores associated with criteria ranked higher will generate more points than those scores associated with criteria ranked lower [2]. For example, if “Aquatic habitat gain/loss” is ranked higher than “Reduce invasion vegetation” and both criteria score a 4 on scorecard A, then “Aquatic habitat gain/loss” adds more points to the total score than “Reduce invasion vegetation” even though they scored the same.

2.3. Weighting Factors

If the user wishes to emphasize the relative importance of certain criteria, the user can do so by adjusting the weighting factors. For example, if the user wishes to signify the importance of the “Rivers and stream habitat quantity gain/loss” criteria, that category will receive a higher weight, and its outcome will weigh heavier in the total score. For simplicity (as default), adjusted weighting factors are set to 1 for all criteria [2].

3. Case Studies: Project Locations and Background

Three case studies are described, providing the project locations and background, to gain a better understanding of the circumstances surrounding the need to develop the dredged material beneficial use alternatives.

3.1. Case Study 1: Dog Beach, Greenwood, and Lee Street Beaches (Evanston, IL, USA)

Waukegan Harbor is a Federal navigation harbor located in Waukegan, Illinois, USA, where dredging occurs on the western shore of Lake Michigan. It is in the Advance Maintenance Area, an adjacent federal harbor, that dredging occurs to form a basin where littoral sand is deposited before it settles in the federal channel. The primary purpose of dredging is to support the economic viability of the Waukegan Harbor. An additional need is to protect and restore Illinois’ public Lake Michigan shoreline. The actions are driven by several municipalities, including the City of Evanston. The role of the USACE and municipal authorities is to leverage local resources to address Lake Michigan shoreline issues to be sustainable and cost-effective. One effort is to build a regional sand management network to manage and protect Illinois’ public shoreline.
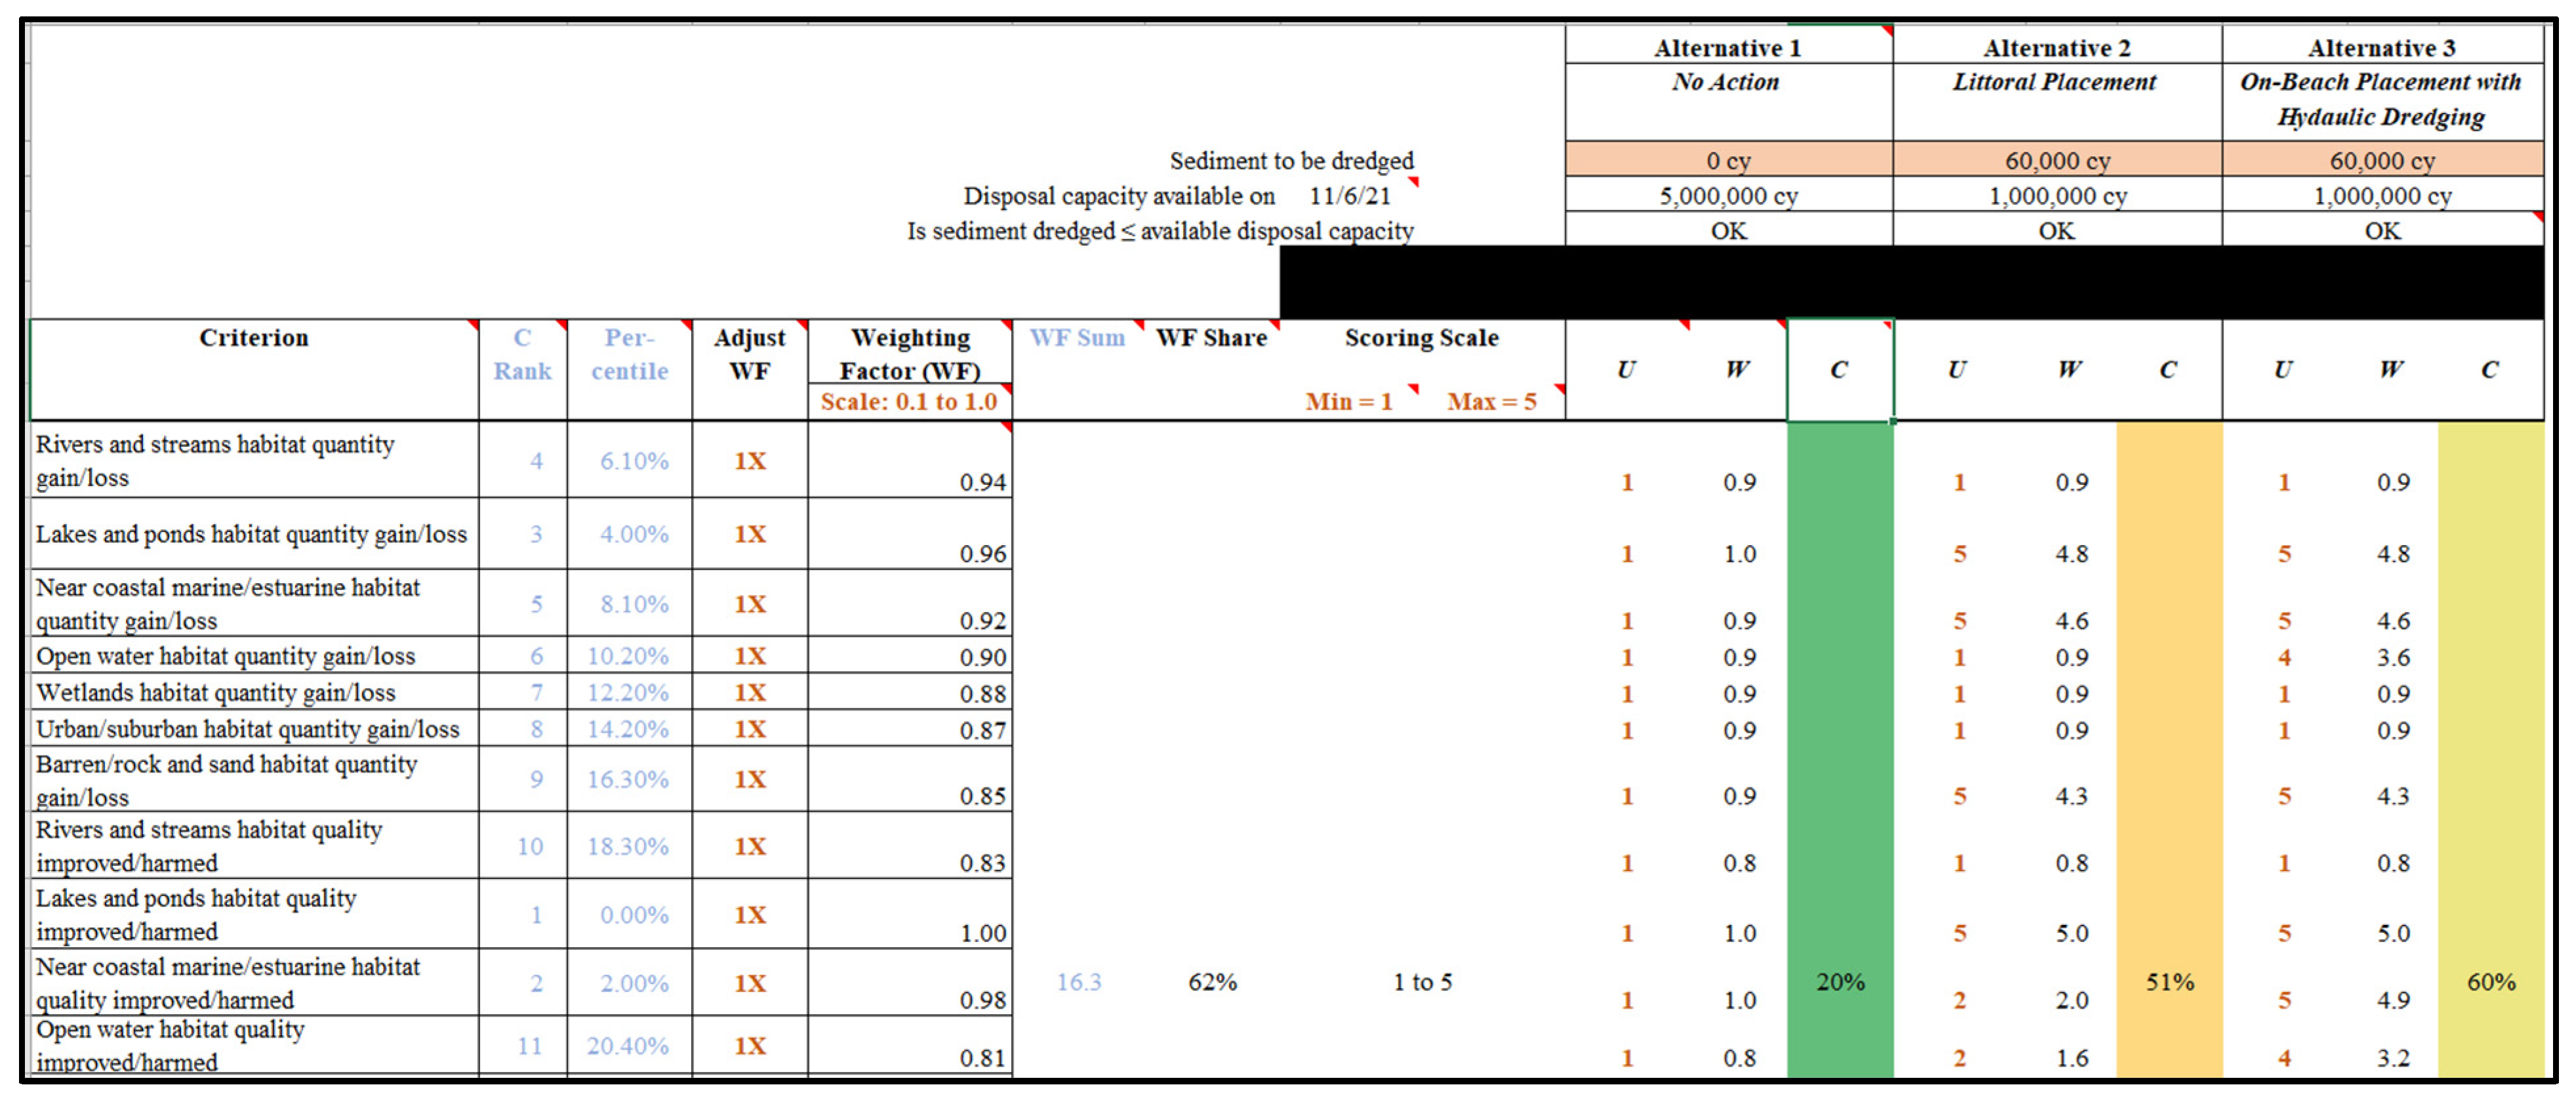
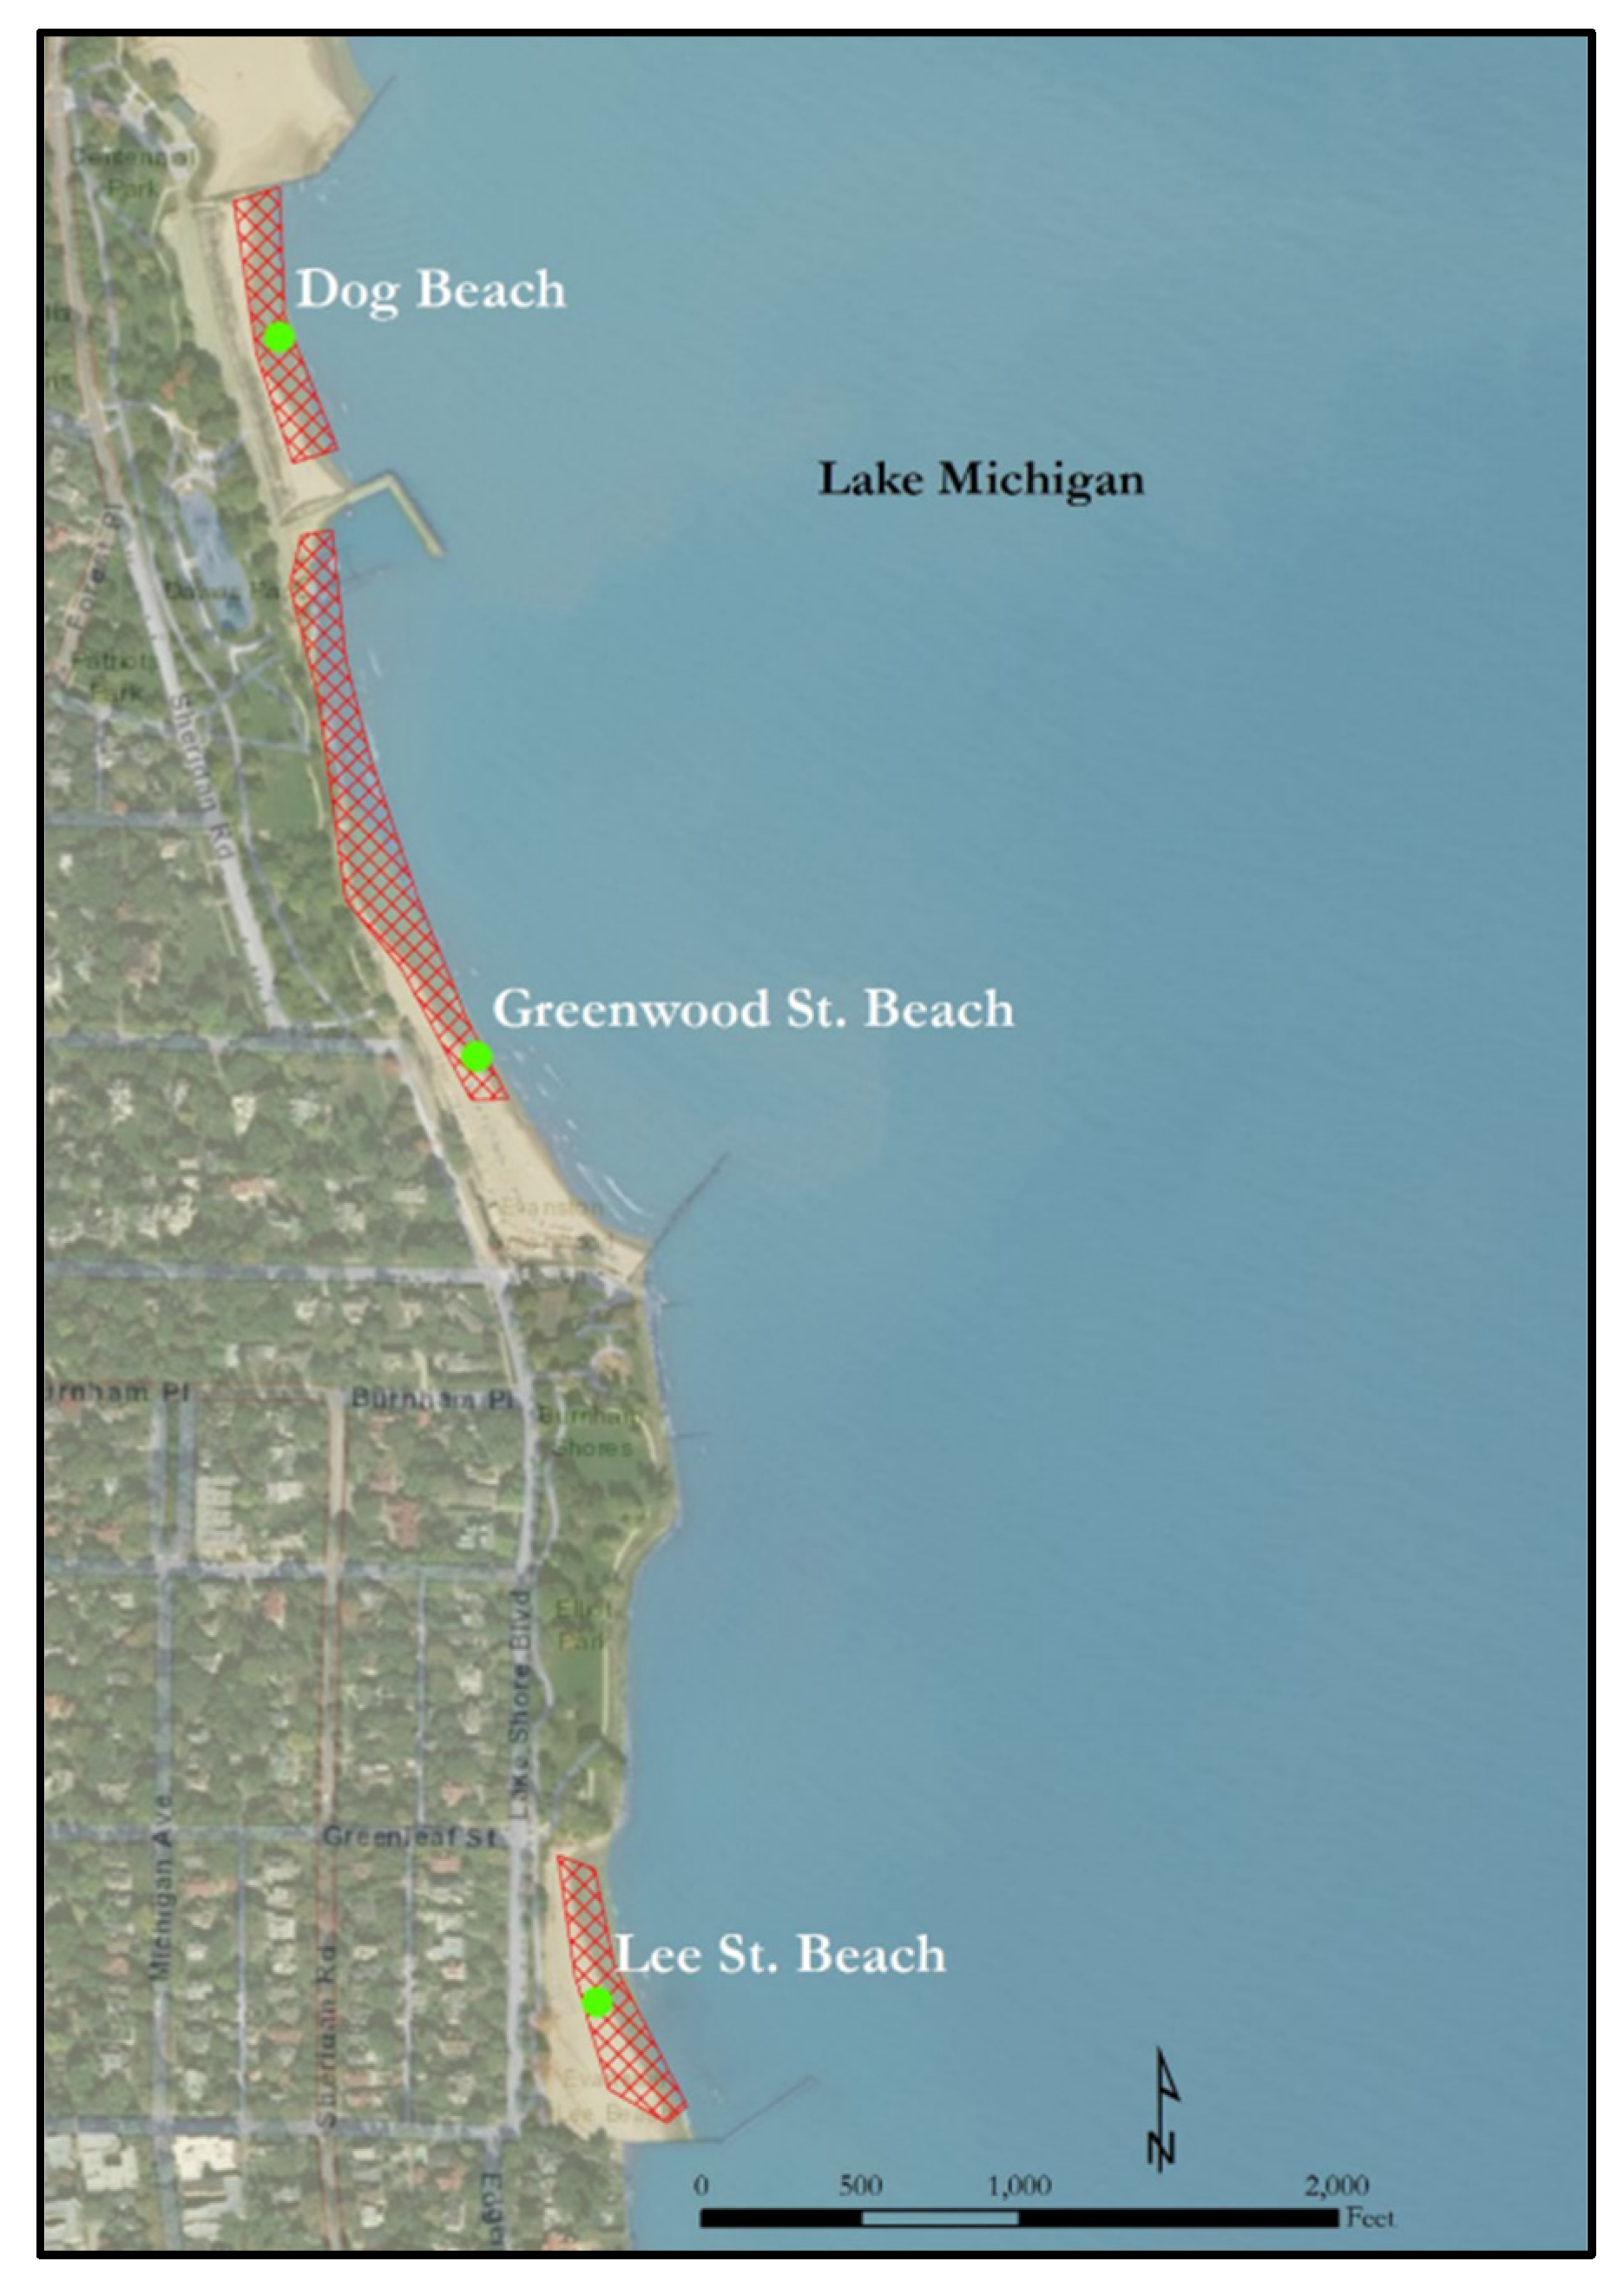
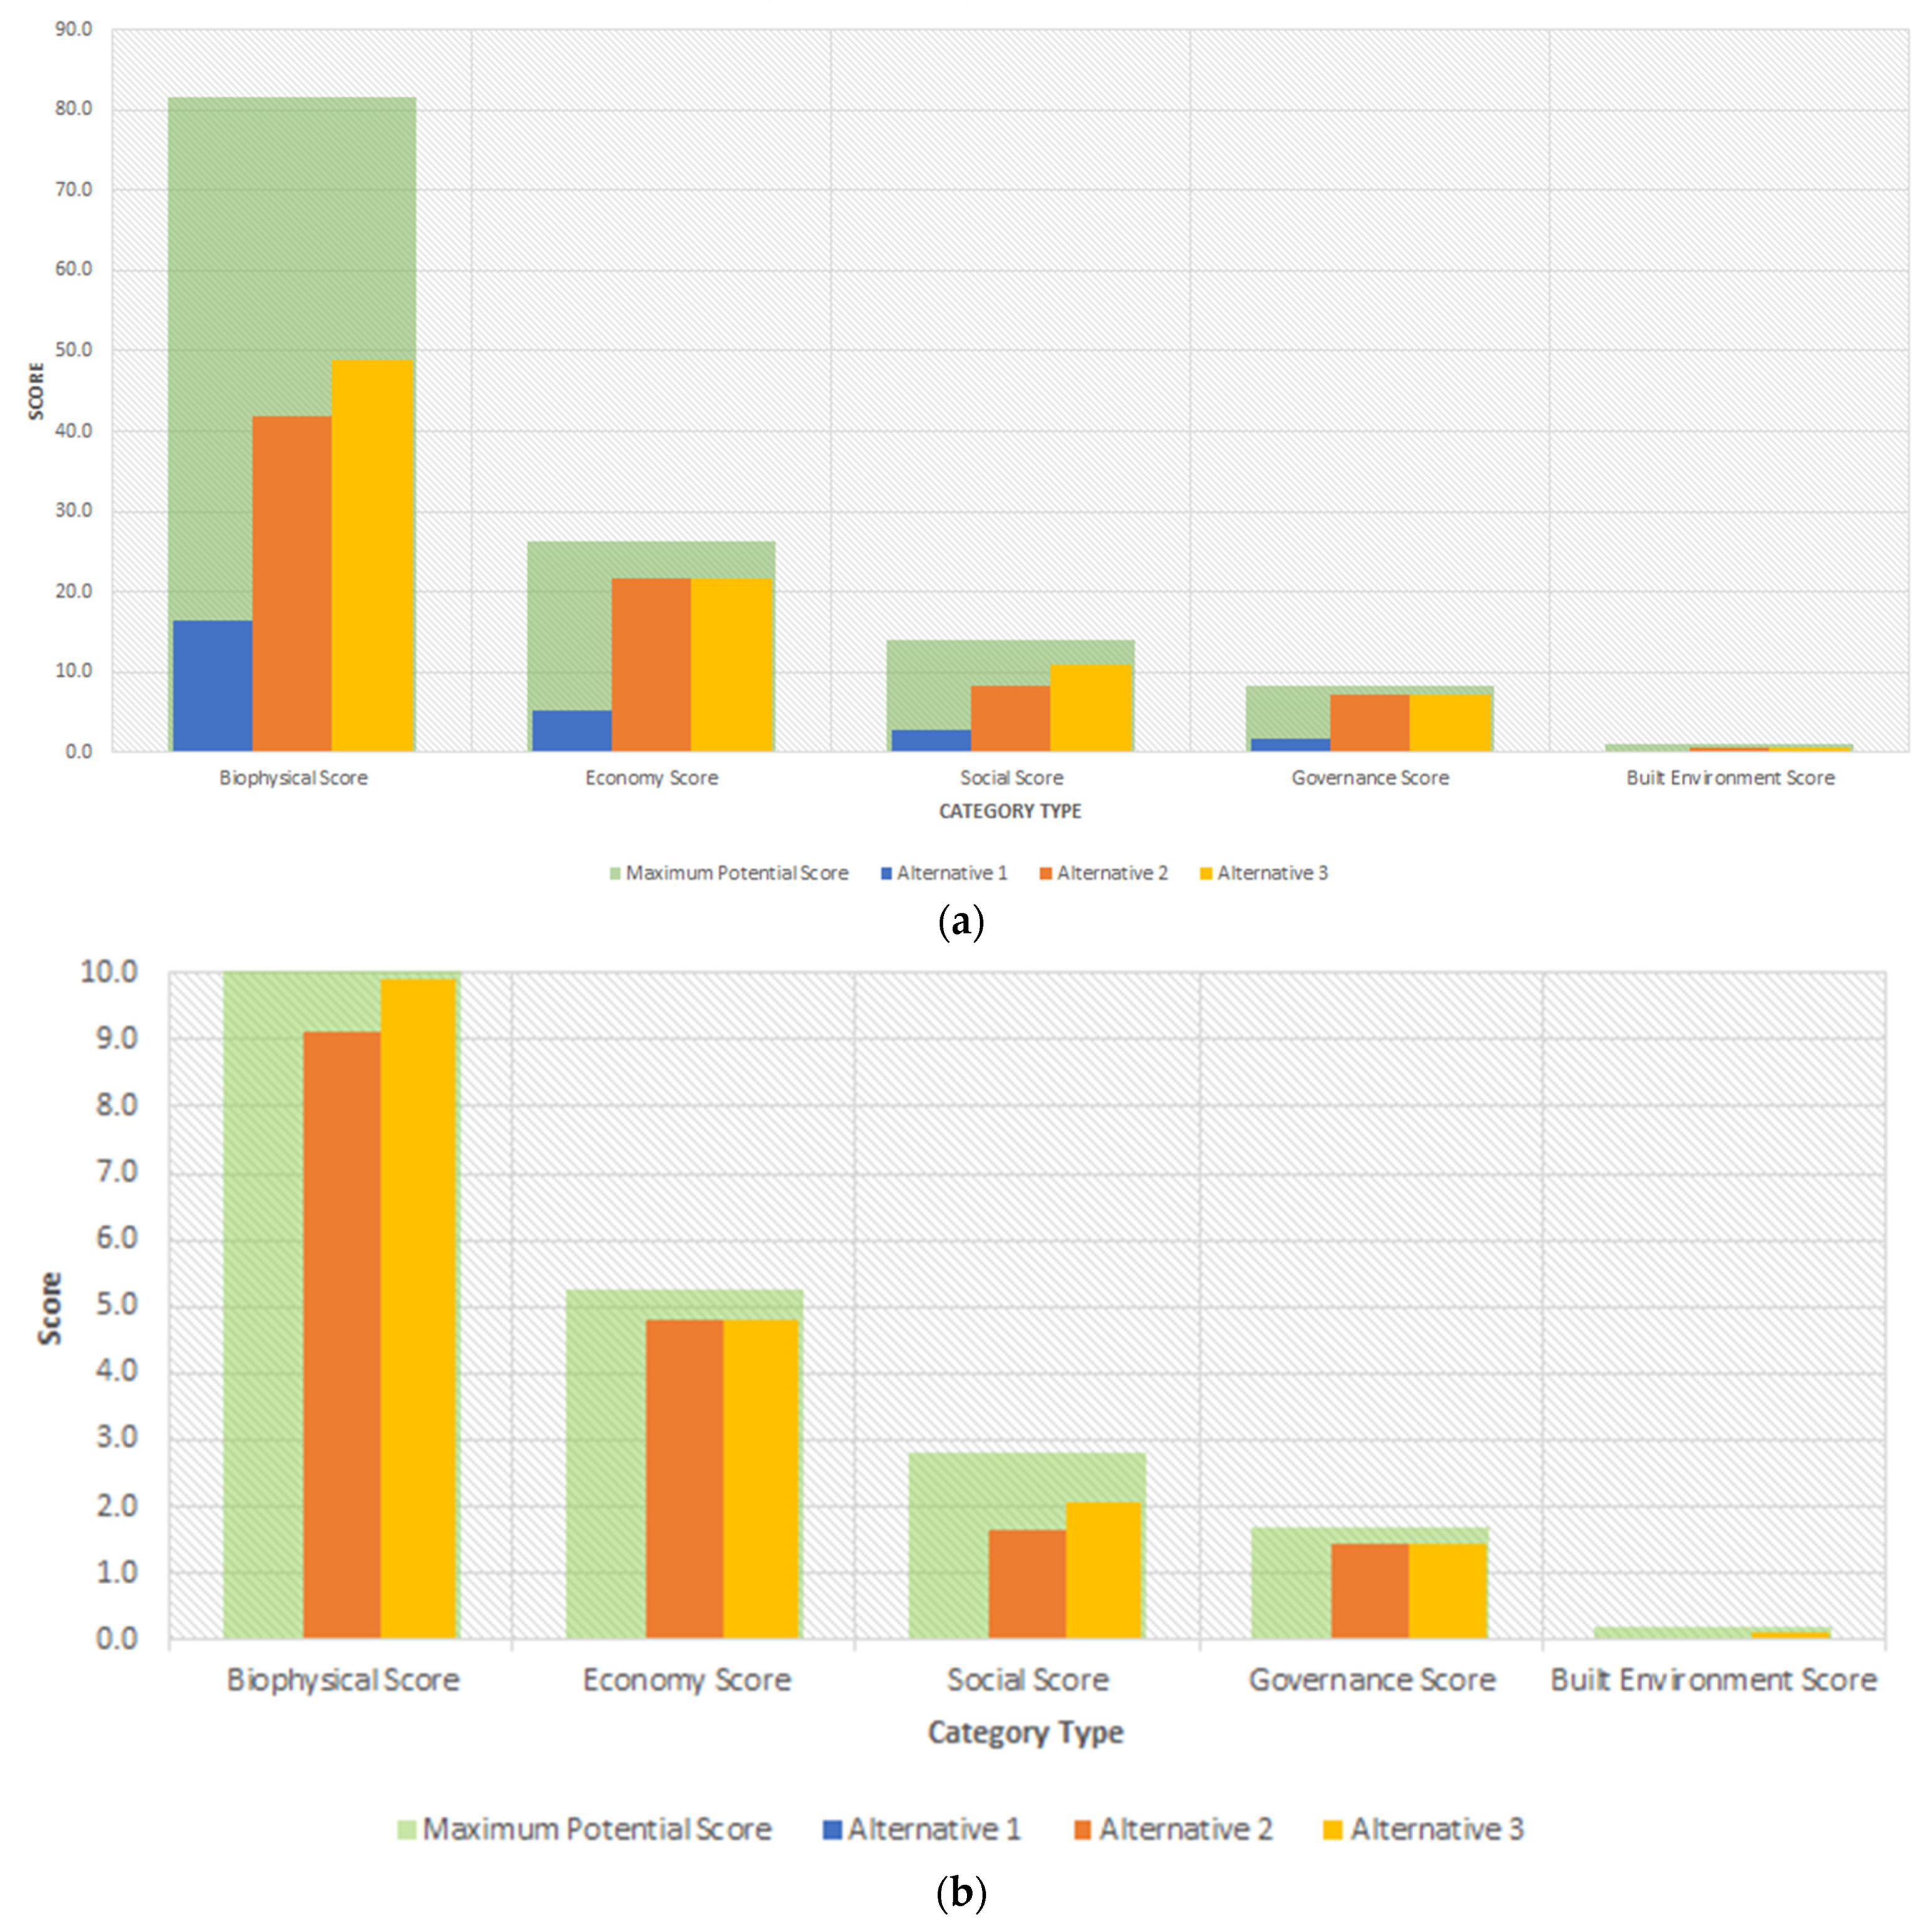
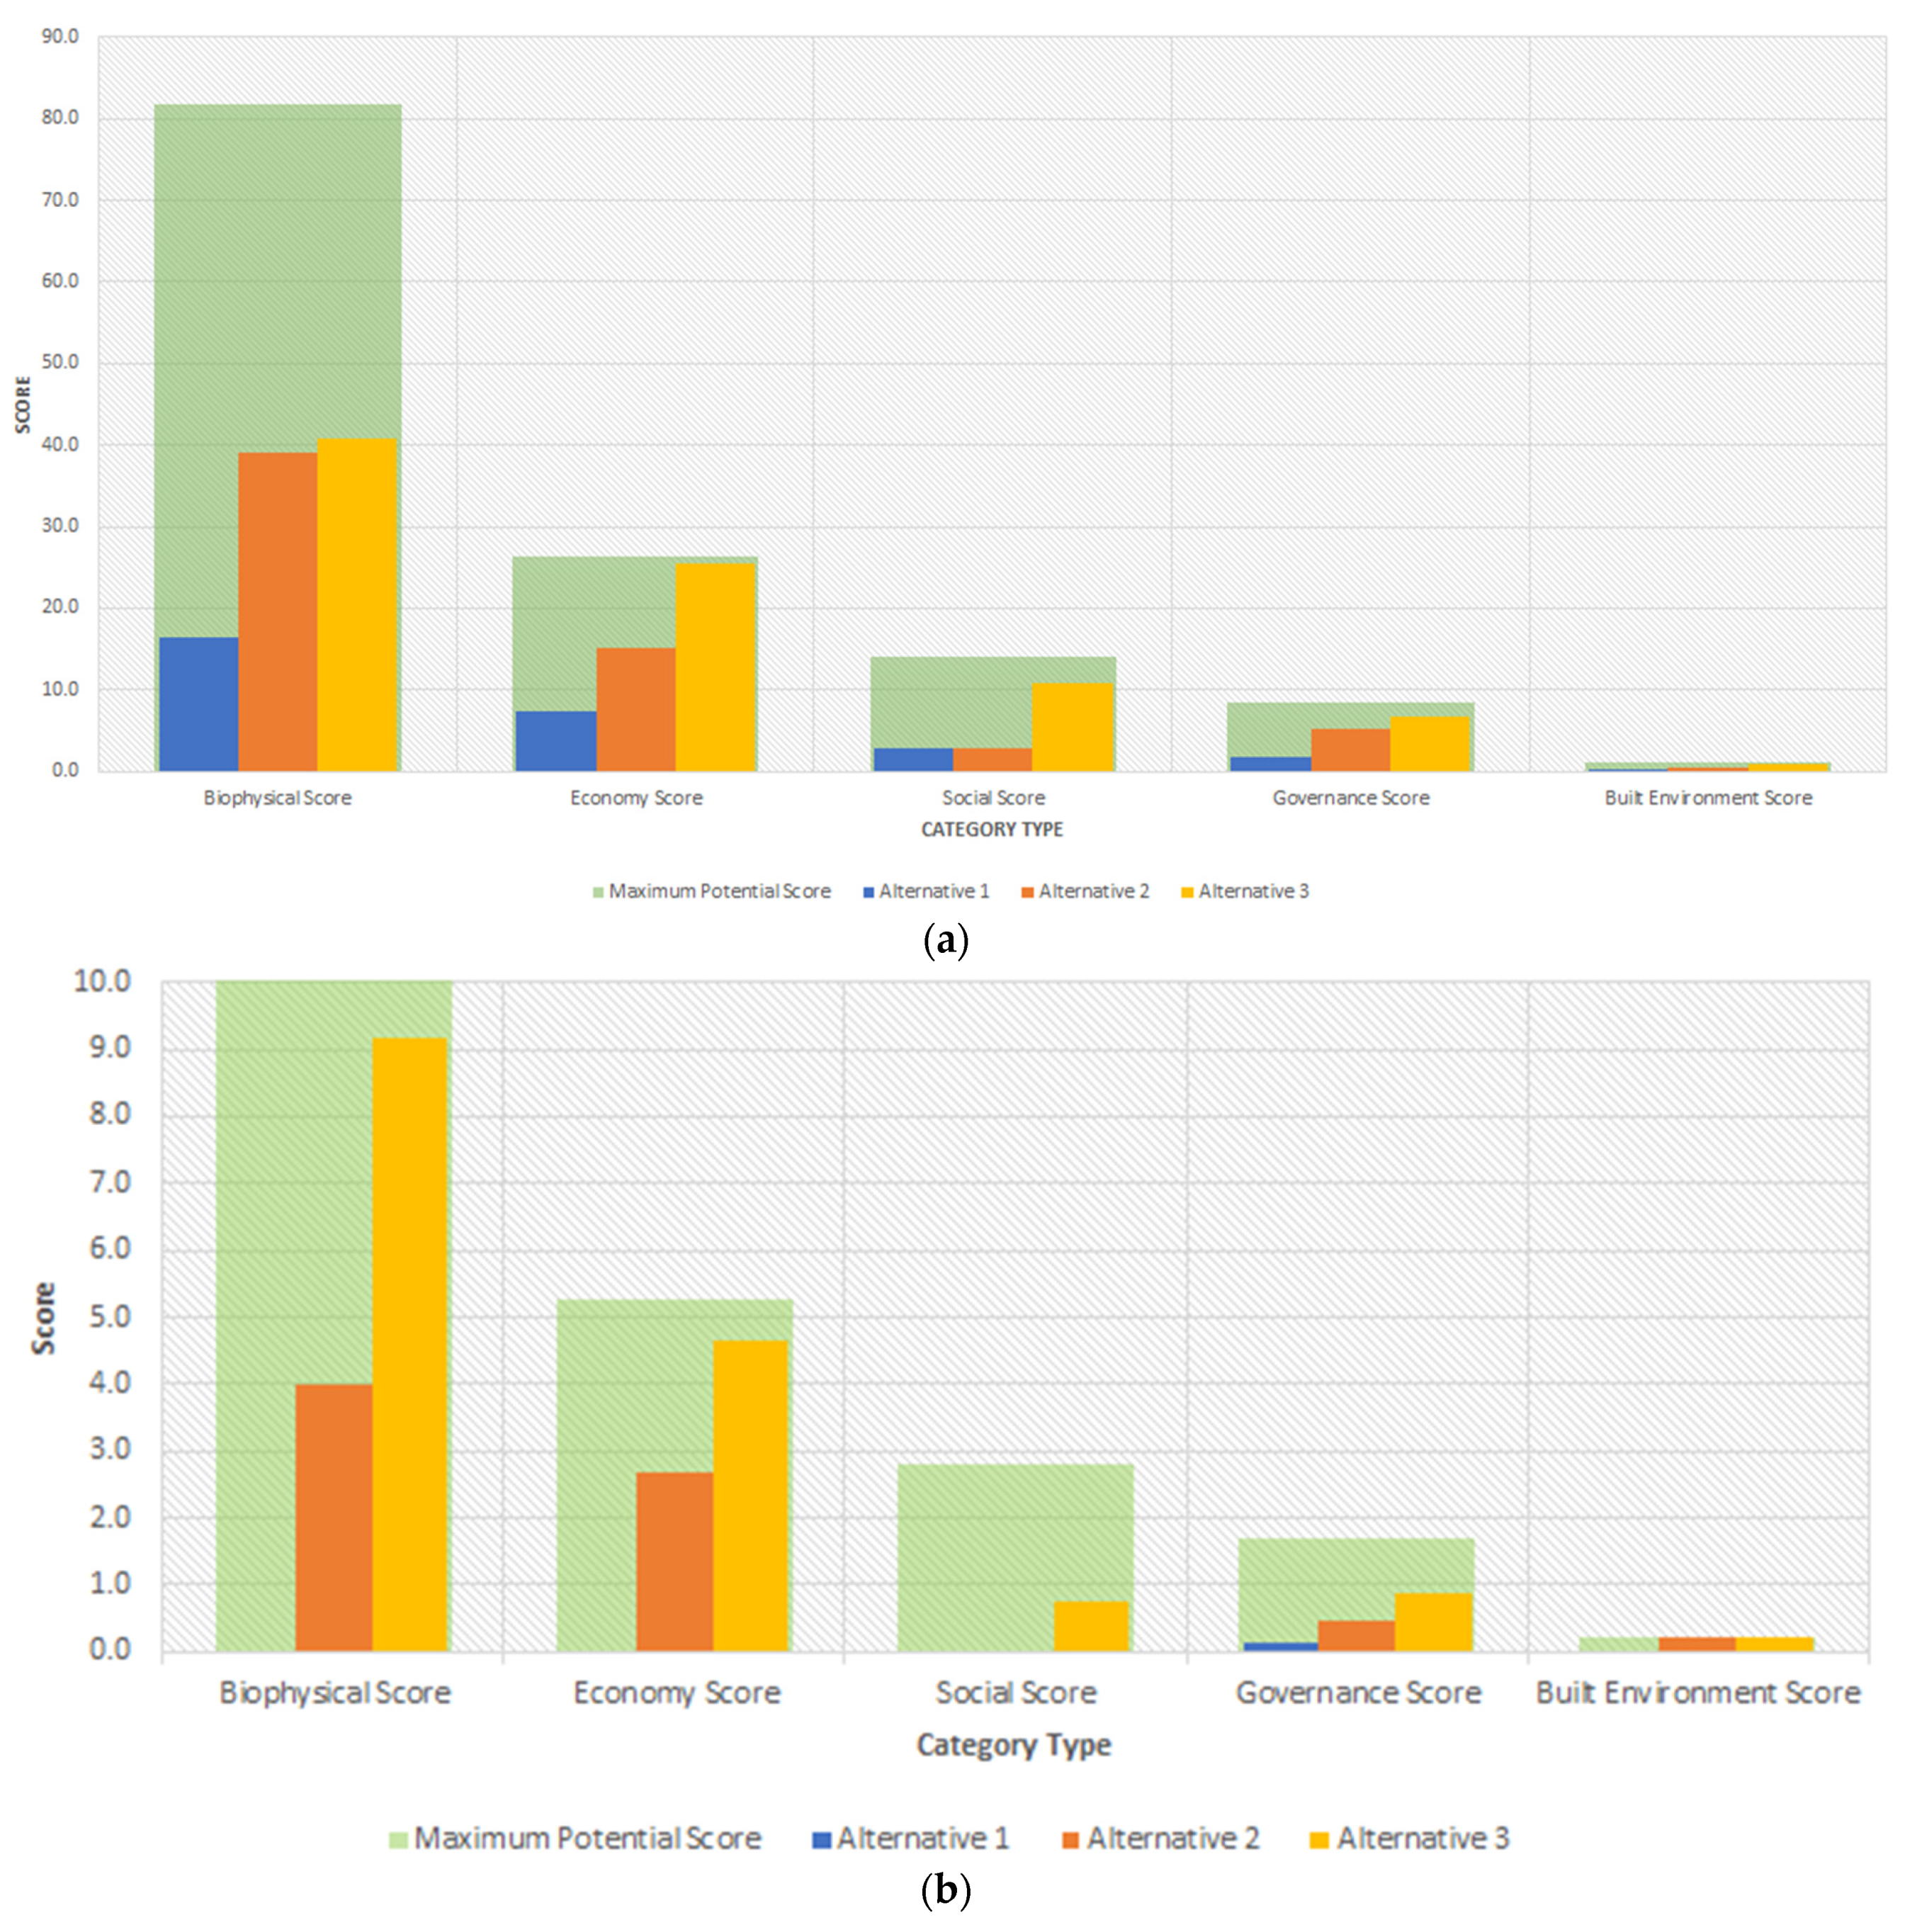
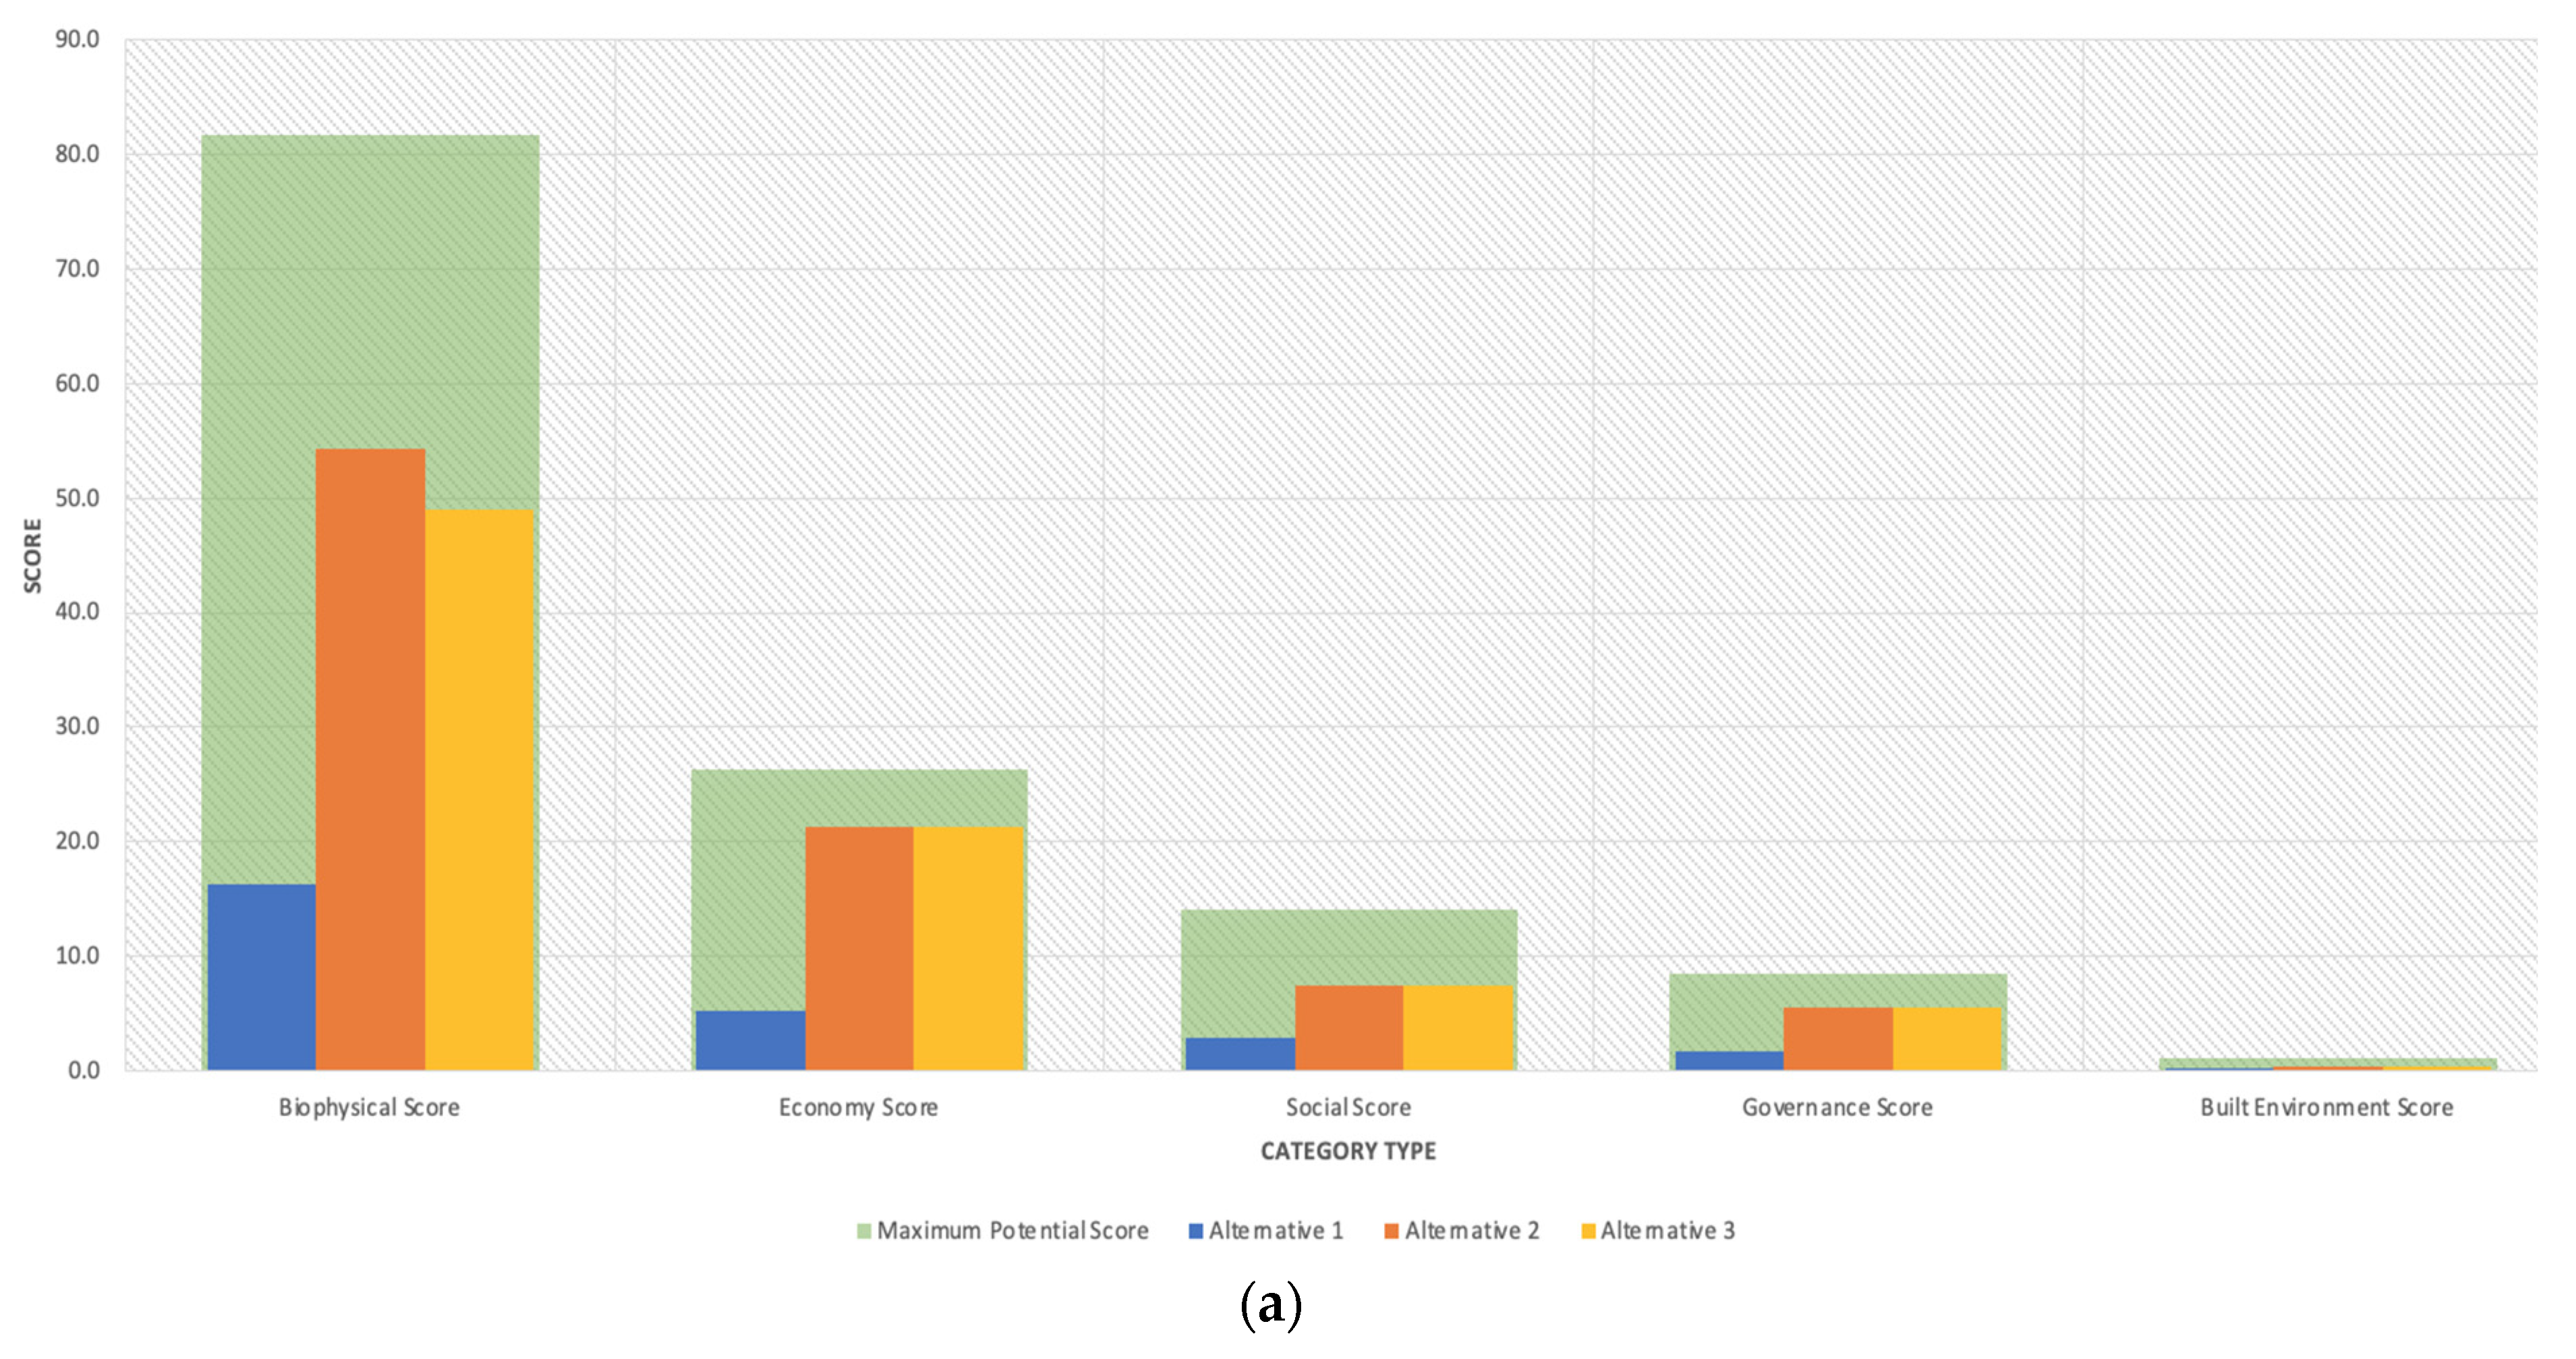
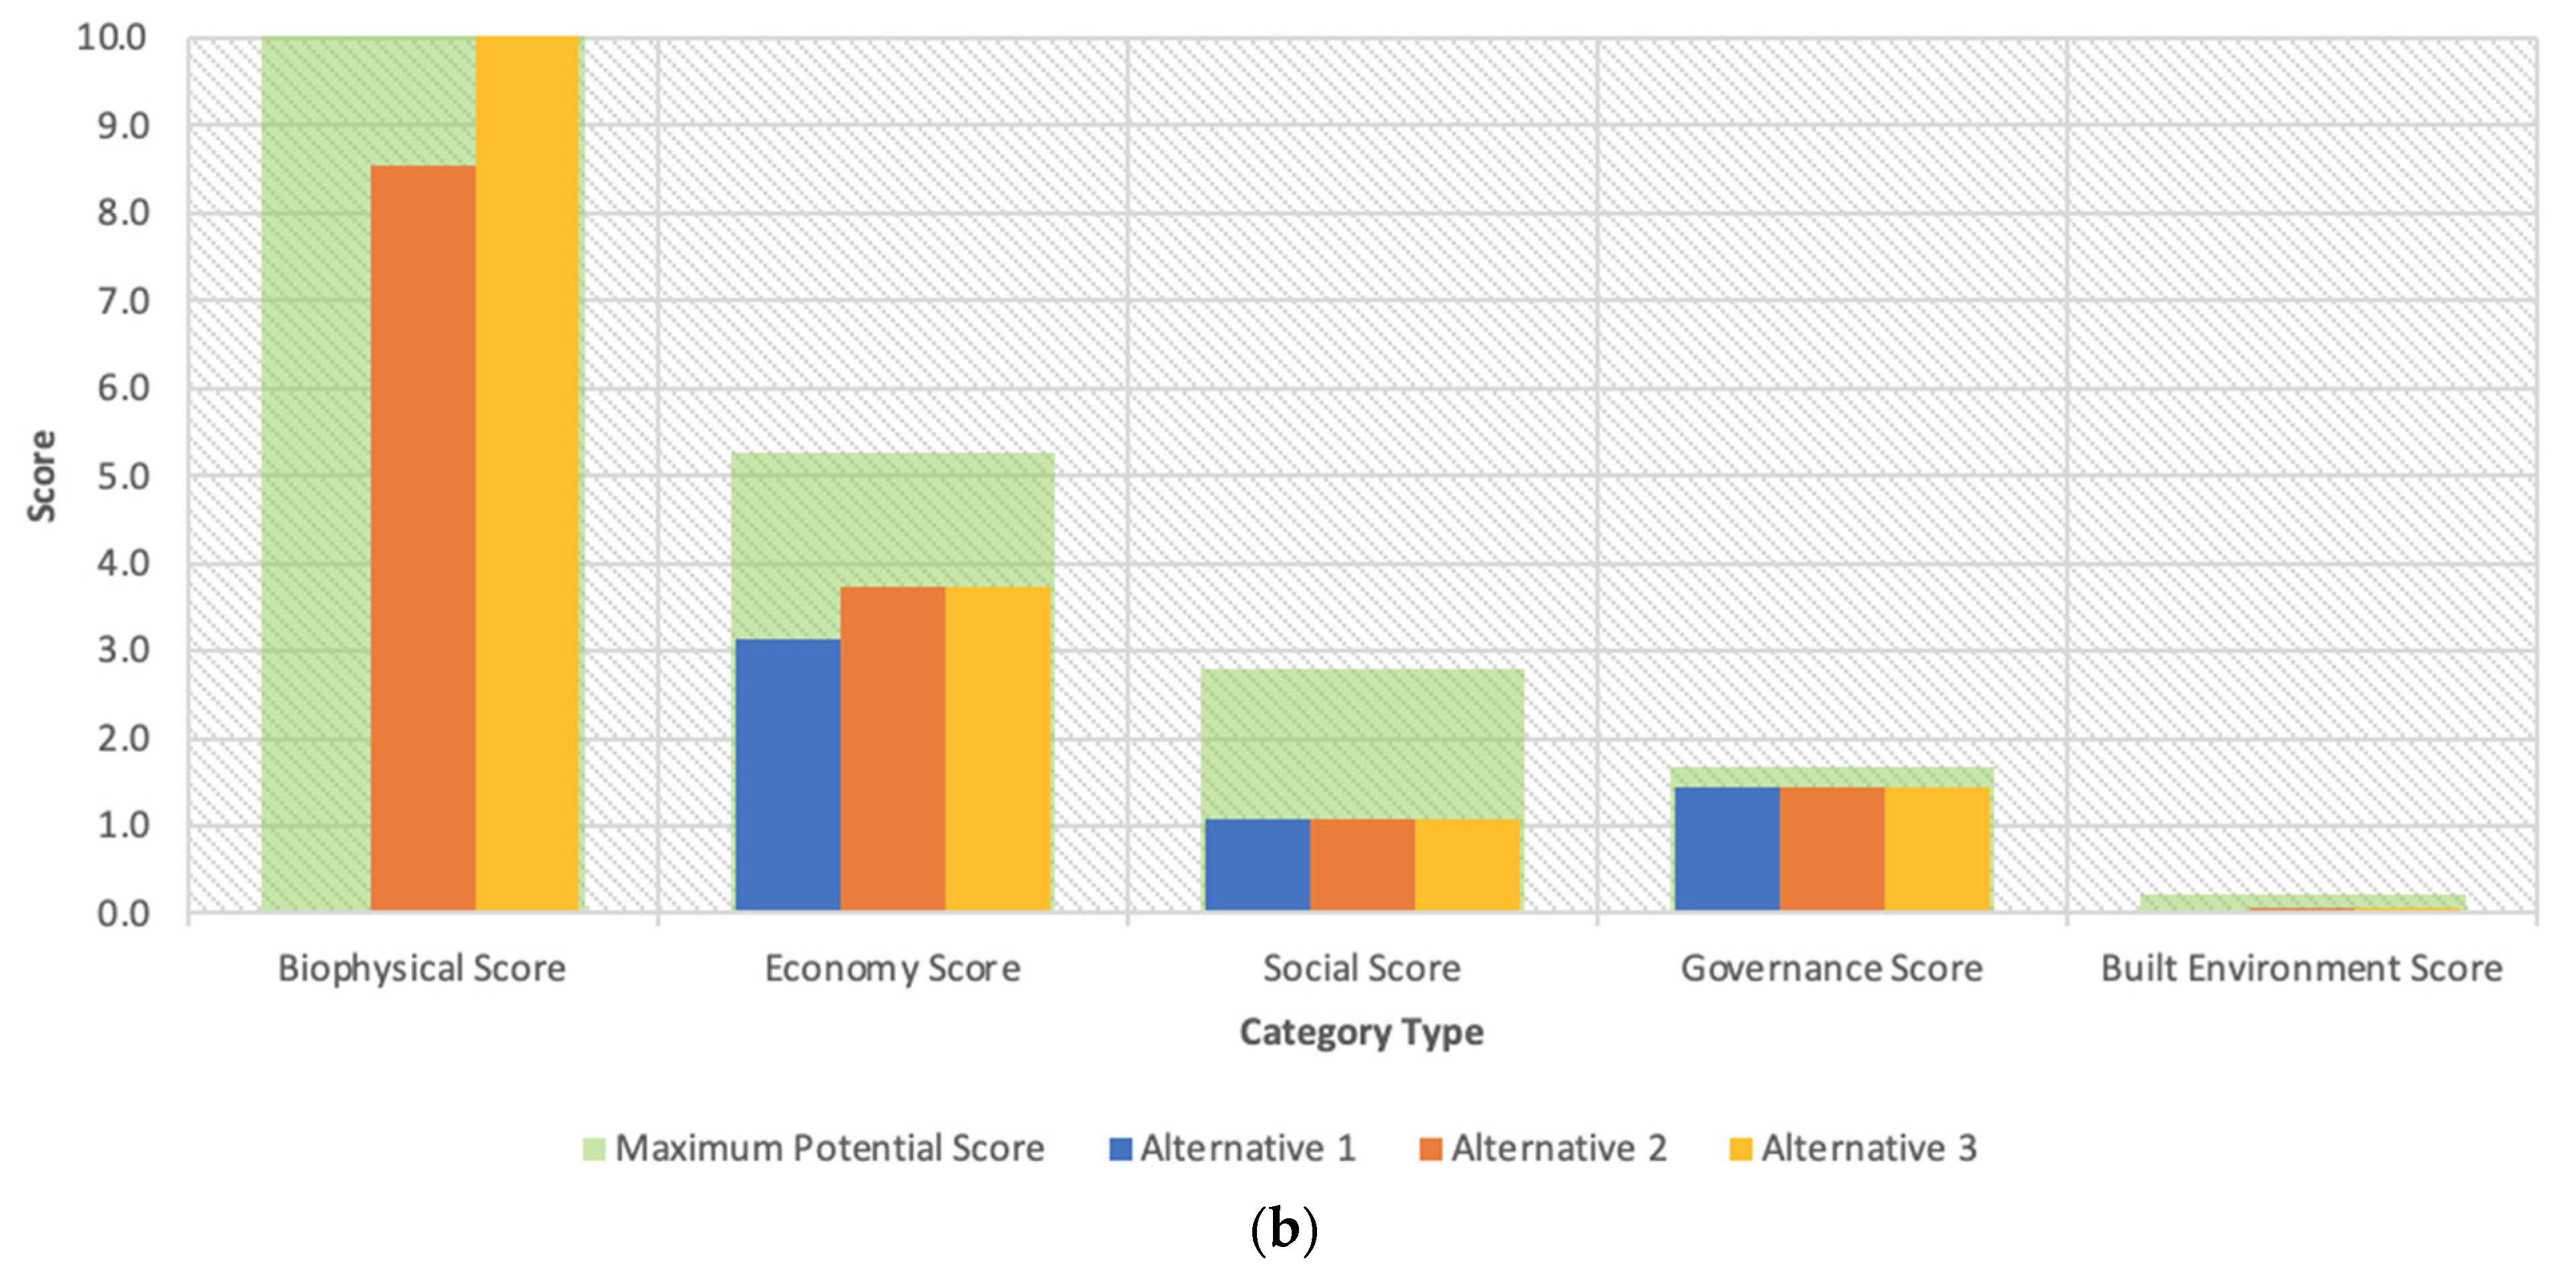
Dredged material will be placed at Lee Street Beach, Greenwood Street Beach, and Dog Beach in Evanston, IL (Figure 2). The alternatives to use the dredged material are shown in Table 1. One option is to place sand at the littoral zone to prevent shoreline erosion and another is for it to be placed on-beach with hydraulic dredging. The former will enhance nearly 54,560 square yards of the beaches, parks, and open space communities [4]. These actions can support the local economy, outdoor recreation, and key infrastructure. These beaches are typically used recreationally for swimming and sunbathing, and are available to residents and non-residents of Evanston.
There are additional opportunities for restoring and protecting critical habitat for a variety of critical species including the federally-listed Piping plover and Pitcher’s thistle. An Environmental Assessment was conducted under the Chicago District’s authority to operate and maintain the Waukegan Harbor federal navigation. The environmental assessment found that no significant adverse impacts were anticipated as a result of placing dredged sand from Waukegan Harbor upland. USACE [5] also held that there are no significant potential effects to air quality, navigation, noise levels, and water quality and all other interests such as aquatic resources, fish and wildlife, floodplains, hydrology, environmental justice, soils, and climate change would remain unaffected by the action. There were several historic fish collections made within the vicinity of these beaches and approximately 24 species of birds observed at Greenwood Street Beach. As of the 2020 census, Evanston had a racially and ethnically diverse population of 73,473 people. The median age of residents was 34.3 years, the median household income was $78,904, and the median home price in Evanston was $391,400 [6].
In terms of toxicity, the dredged material in Waukegan Harbor indicates no detectable levels of PCBs. This is because a large source of the dredged material is sand transported along the Lake Michigan shoreline rather than coming from the inner harbor. There are concerns by the surrounding population over the possibility of contamination in the dredged material from the outer harbor, approach channel, and advanced maintenance area. It is a common misconception that hydraulically dredged material is contaminated.

3.2. Case Study 2: New York/New Jersey Harbor (New York, NY, USA)

The project is located on a harbor on the east coast of the United States [7,8,
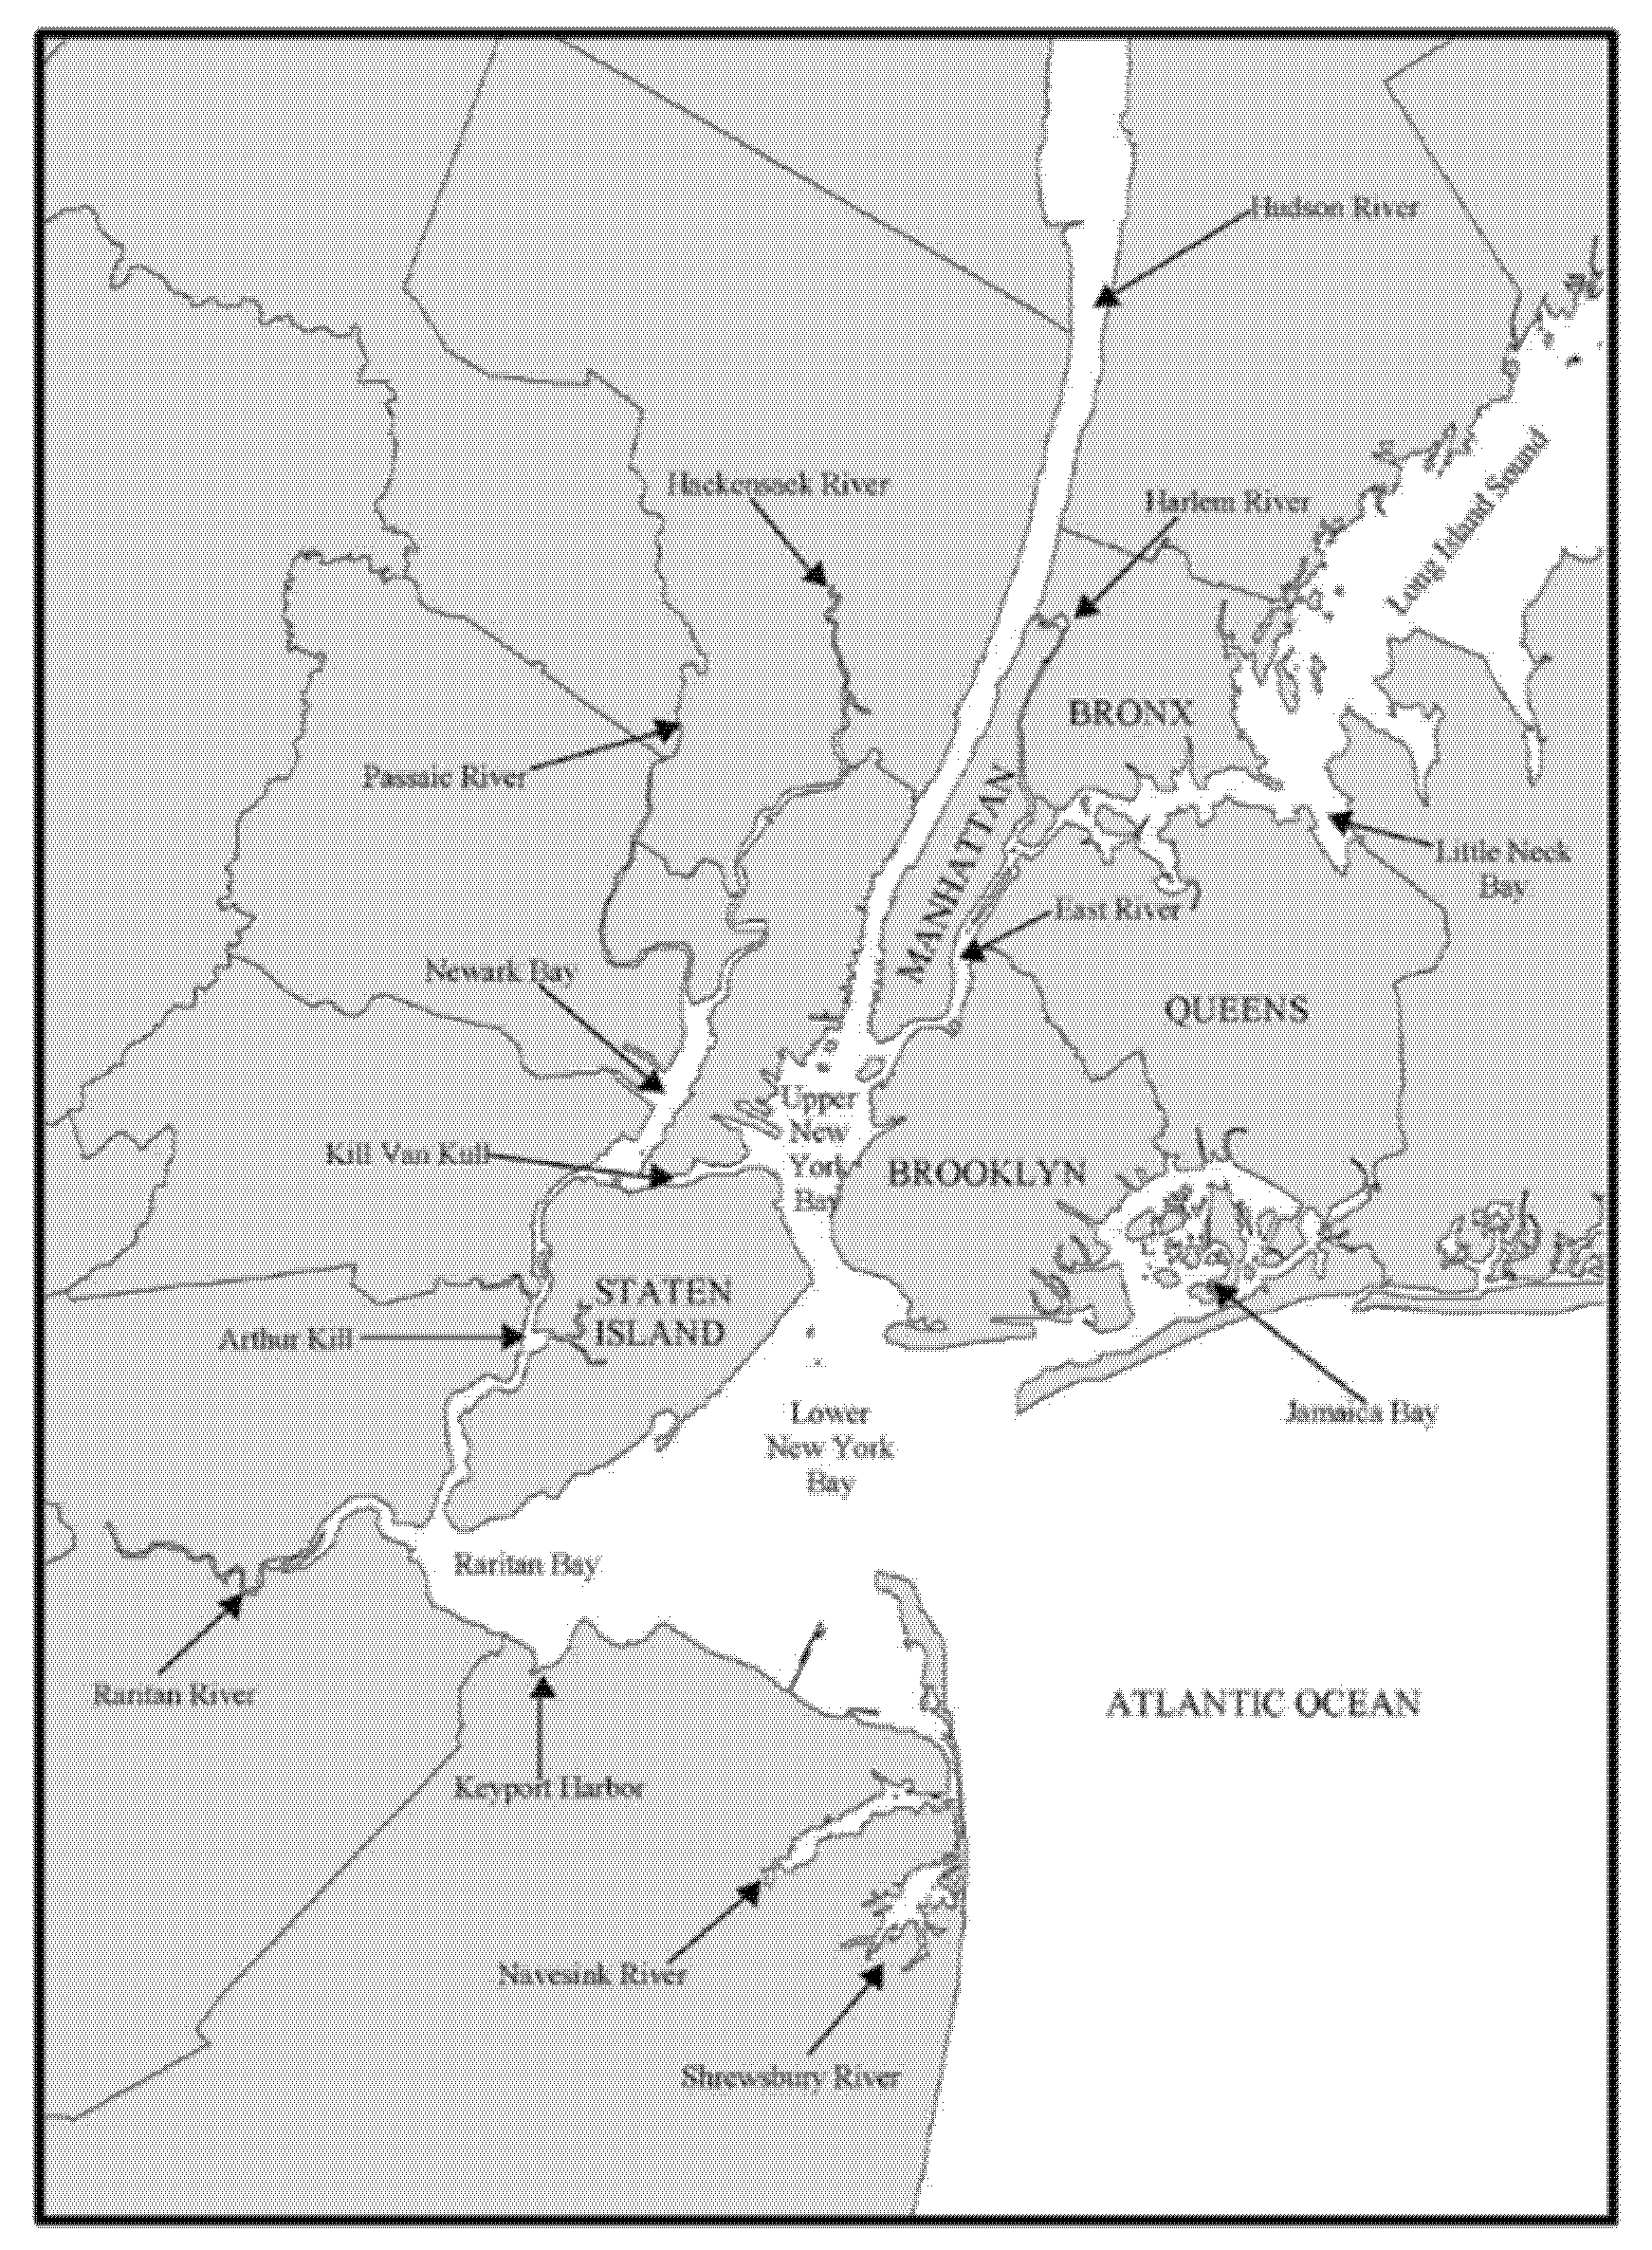
9]. The project area lies in between New York and New Jersey. The Port of New York/New Jersey (Figure 3) is extremely important to the economy, providing 229,000 jobs through industrial and commercial shipping. Annually, the port sees more than 1.7 million loaded containers a year, with that number constantly increasing every year. With all the ship activity in the harbor, it is necessary to keep the harbor from creating too much sediment buildup in the harbor floor. Therefore, dredging is a necessity to keep the cargo moving in and out of the port [7].
The Harbor Deepening Project had the depth of the harbor floor increasing from about 19 feet below the low tide water elevation to 50 feet throughout the channels connecting to the harbor and the harbor itself. This was accomplished in order to provide adequate clearance for big vessels. The total estimated volume of dredged material from the project was 42.5 million cubic yards. The plan to manage the dredged material was called the dredged material management plan (DMMP) that was developed by USACE. The plan called for testing the dredged material to determine the best place for disposal.
The dredged material was expected to be largely unacceptable for open ocean disposal due to the fact that the harbor has been utilized since before strict environmental regulations were enacted. A large portion of the dredged material from the harbor deepening project cannot be disposed of in the ocean because of the contaminants in it. These contaminants include: polychlorinated biphenyls (PCB’s), polycyclic aromatic hydrocarbons (PAHs), polychlorinated dibenzofurans (PCDFs, or furans), polychlorinated dibenzo-p-dioxins (PCDDs, or dioxins), and heavy metals. Since ocean disposal was not an option, other dredged material disposal methods were required to be considered.
Prior to the Harbor Deepening Project, the constant dredging of the harbor due to maintenance had the Port Authority of New York and New Jersey (PANY/NJ) and USACE searching for several ways to dispose of the dredged material. The estimated yearly maintenance volume was around 4–6 million cubic yards of dredged material. The material that met the requirements at the time for open ocean disposal was dumped into a 2.2 square mile area in the ocean, 7 nautical miles off the coast of Sandy Hook, New Jersey. This dumping area was named the Mud Dump. It is estimated that over 63 years (from 1914 to 1977) 200 million cubic yards were discarded in the Mud Dump.
Over the years, the effects of dioxin bioaccumulation were evident specifically in worm tissue, since most of the dredged material from the harbor was contaminated. The Mud Dump was de-authorized and covered up with dredged material that met the regulations to not surpass Category 1. Category 1 consists of allowable toxicity and bioaccumulation amounts determined by USACE and USEPA. Nineteen square miles of surrounding area was designated a historical remediation site (HARS). This is where 40 million cubic yards of suitable dredged material was used to remediate the originally dumped contaminated dredged material.
With a massive amount of dredged material contaminated and not suitable for open ocean disposal, another solution was drawn up by the Port Authority of NY/NJ. This solution consisted of moving the contaminated material across the country to Utah and dumping it on land. This solution became very short term because of the cost to transport it, costing $118 per yard of dredged material.
An alternative solution was to build a confined disposal facility to hold the contaminated dredged material in Newark Bay within the New Jersey border. The disposal facility consisted of a 17-acre area of the bay, 70 feet deep. This created a massive amount of contaminated dredged material (1.4 million cubic yards) which was disposed of in the Mud Dump before it was de-authorized. The rest of the material taken out during the construction of the Newark Bay Confined Disposal Facility (NBCDF) was used to cover the mud dump to keep the contaminated material isolated. The clay was within the Category 1 guidelines.
After the Newark Bay Confined Disposal Facility was finished, it was calculated that the disposal of dredged material was more cost efficient than sending the material to Utah. The cost of disposal came down to $29 per cubic yard. This cost was calculated solely to recover from the costs of construction.
Another solution to dredged material was the use of it with Portland cement [8]. OENJ Corporation came up with the idea to implement the dredged material with cement, this combination proved to be structurally sound. This solution to disposal of dredged material was used to create a parking lot for the Jersey Gardens Mall in Elizabeth, New Jersey (1997). This project used over 800,000 cubic yards of dredged material. This method of disposal costs about $30–$40 per cubic yard.
Dredging is a necessity for the New Jersey/New York Harbor, however the effects of dredging and its disposal are not always accepted by all. Simply disposing of the contaminated dredged material in the ocean or constructing a disposal facility may not be enough. Residents of these areas have the ‘not in my backyard’ approach to these solutions for fear of possible contamination, an unsightly view, or the effect on property values. The mud dump, before it was remediated, was affecting wildlife in the surrounding area. The NBCDF reached capacity and is still being monitored. Other uses for dredged material such as utilizing it in the mall parking lot in New Jersey created jobs, and tax revenue that ultimately benefited the community [9,10,11].
Different methods were utilized for the disposal of dredged material throughout the lifetime of the port. However, for the purpose of this study, the focus was on the following alternatives: no action, bathymetric recontouring, and landfill and brownfield remediation. The different costs for disposal utilizing these alternative methods are shown in Table 2.

3.3. Case Study 3: Poplar Island (Chesapeake Bay)

The Chesapeake Bay faces serious problems due to human activities such as polluted stormwater runoff, pollution from animal wastes, deforestation, wetland destruction from agricultural, urban, and suburban development, and sea level rise being caused by global climate change. Poplar Island is located in the Chesapeake Bay and is being affected by these issues. Back in 1847, the island occupied more than one thousand acres of land and by 1996, Poplar Island was reduced to less than four acres. With the island eroding fast, collaborative efforts by federal, state, and private organizations were initiated to restore it. This collaborative team consisted of the Maryland Port Administration (MPA), the U.S. Army Corps of Engineers (USACE), and the U.S. Fish and Wildlife Service (USFWS). Though the collaboration from various organizations initiated, it was the MPA’s Dredged Material Management Program that undertook the restoration of Poplar Island (MPA 2015).
In March 1998, Poplar Island began restoration activities with the construction of containment dikes in two phases. The first phase used 640 acres at a cost of $59 million for the first 2 years. The second phase, during the following three to five years, with 500 acres at a cost of $45 million. Since the initiation of the project, Poplar Island has been Maryland’s primary site to reuse sediment dredged from the channels leading to the Port of Baltimore. To maintain current widths and depths, MPA says nearly five million cubic yards of sediment are dredged from these channels every year. All that sediment has allowed the port administration and the US Army Corps of Engineers to restore the island back to its original size. The dredged material from the rivers that flow into the Chesapeake Bay is a source of a constant supply of sediment including fine silts, which settles into the shipping channels. Routine maintenance dredging occurs to keep the shipping channels safe for ship passage and the Port of Baltimore economically viable [12,13,14,15].
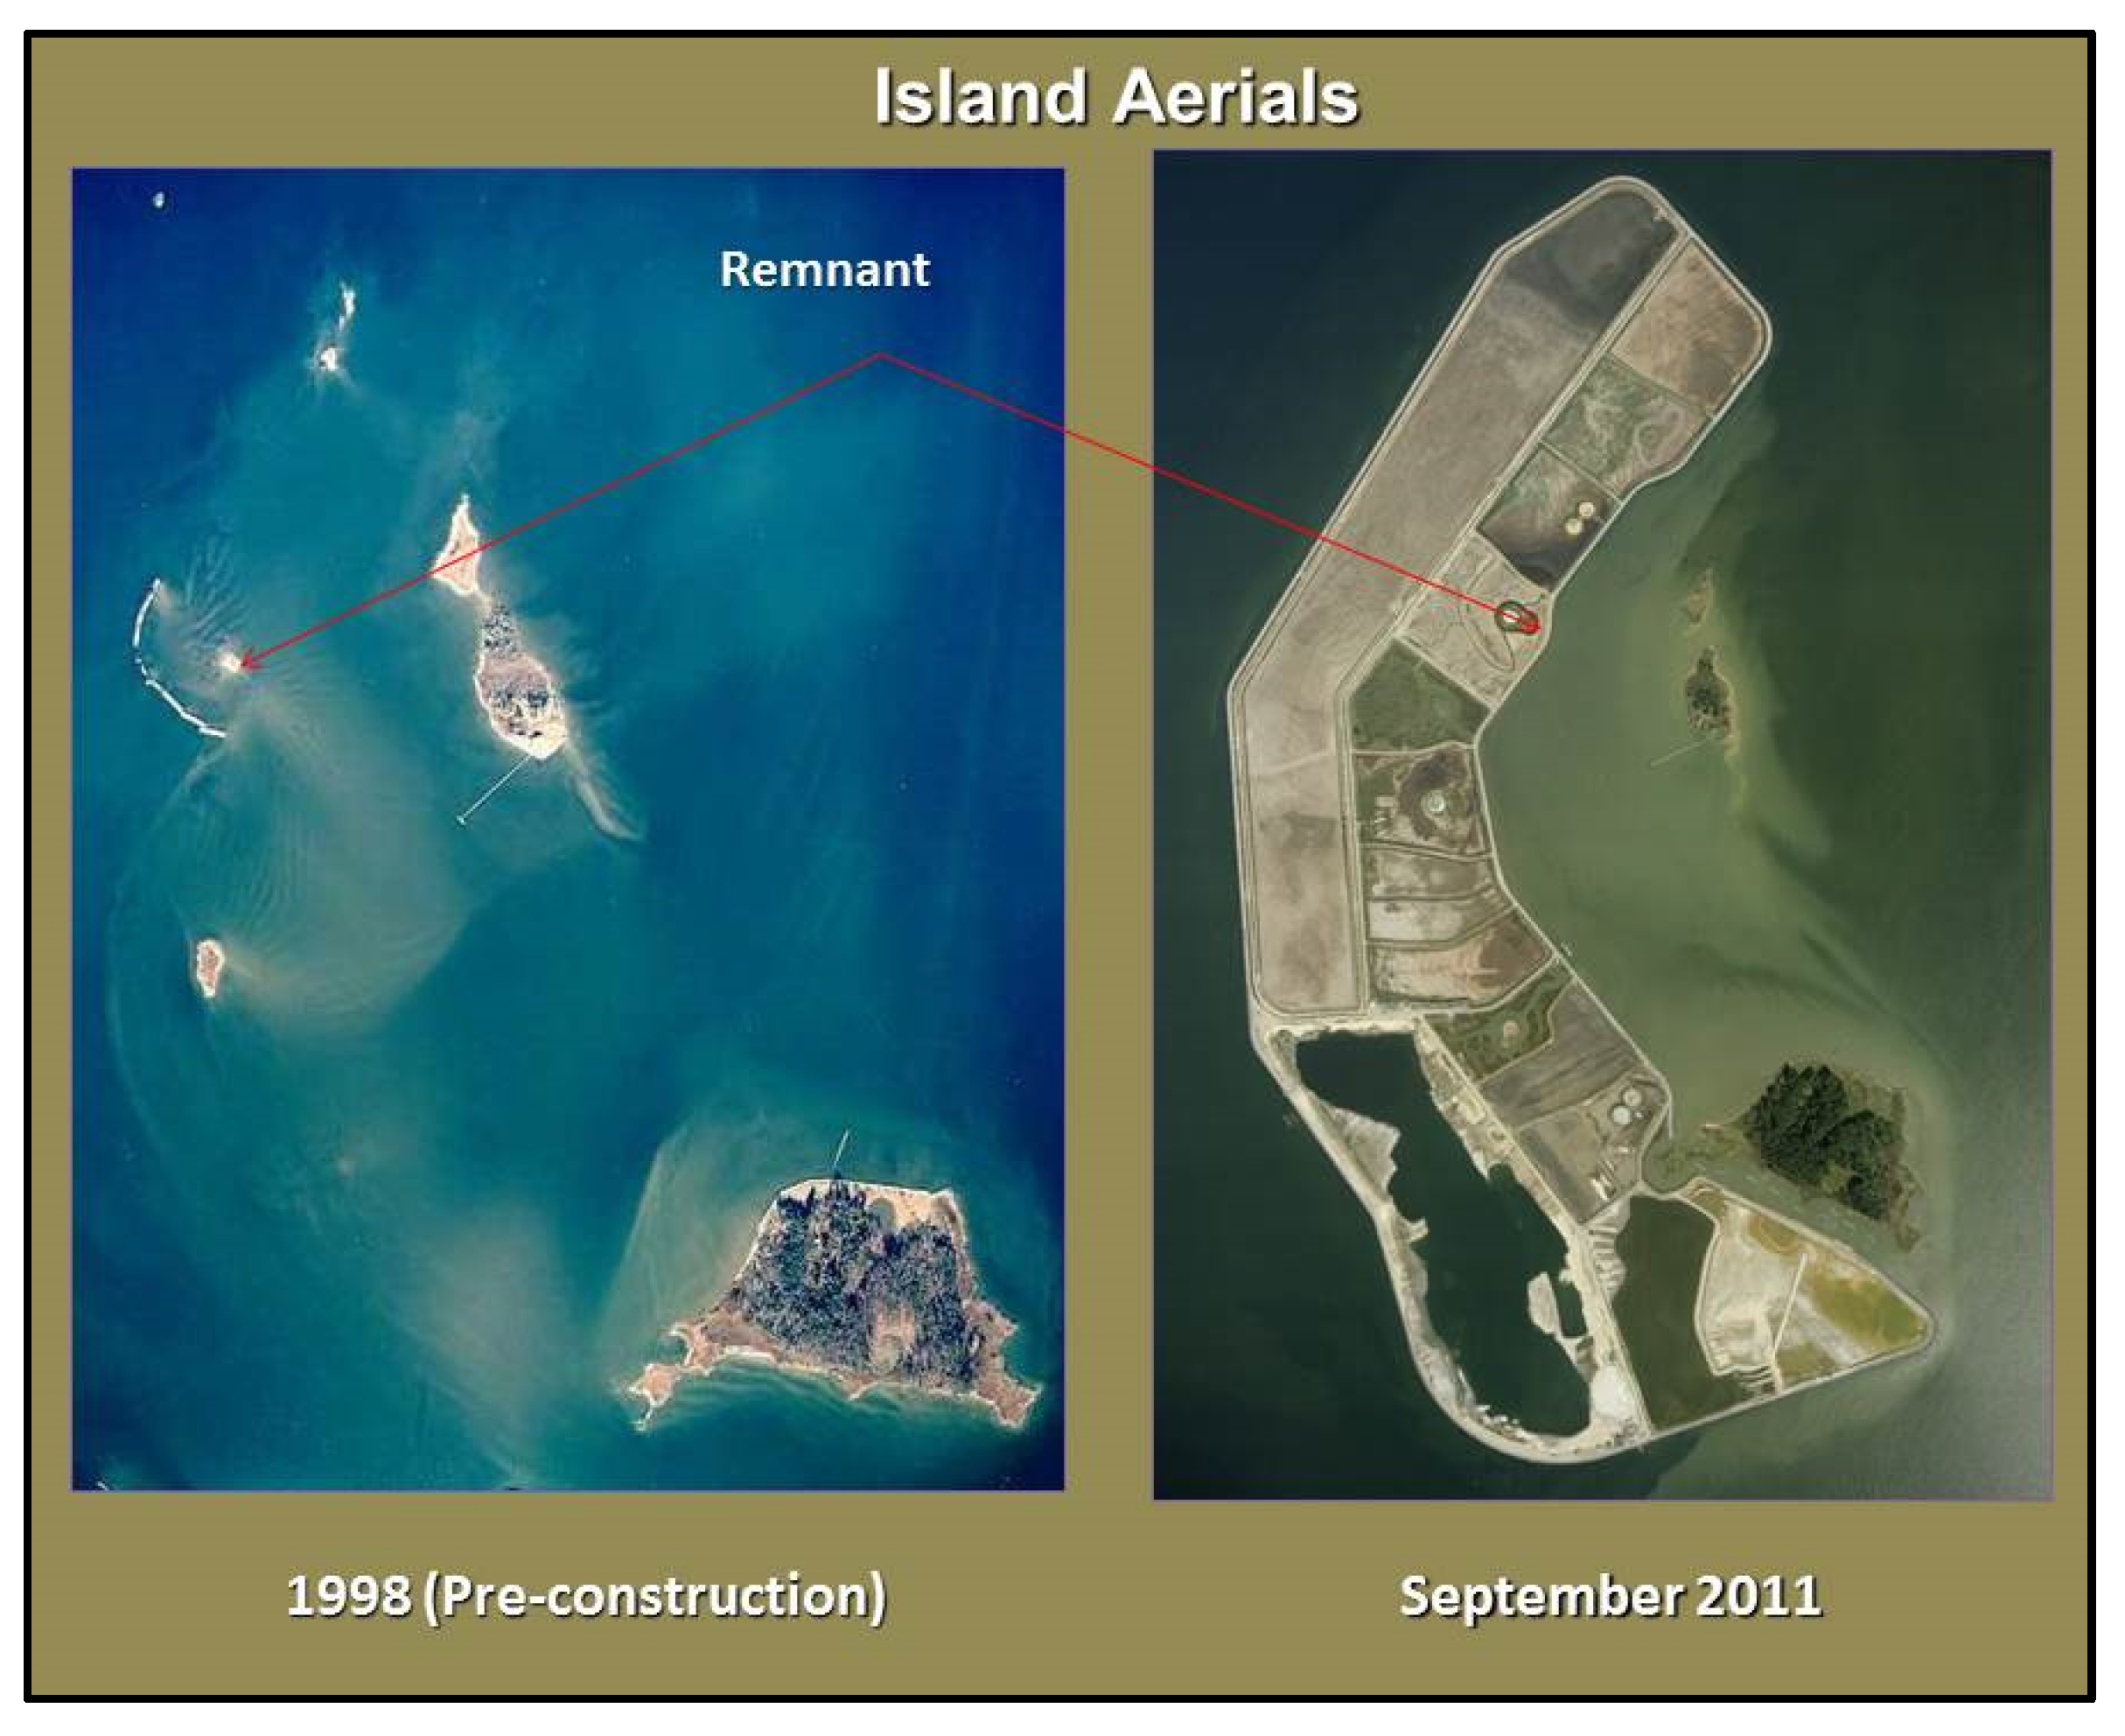
Poplar Island is now home to hundreds of species of wildlife and waterfowl. According to the USEPA, this project used 40 million cubic yards of dredged materials, which would create 1140 acres of remote wildlife habitat; half of which was wetlands, while the other half was uplands. Wildlife highlights include a total of 224 species of birds that have been identified at the project site, including 34 nesting species (Walburn 2021, USACE et al., 2021). The pre-construction and September 2011 aerial images can be seen in Figure 4.
The MPA’s Dredged Material Management Program is a 20 year long planned cycle. This planning encompasses collaboration on specific projects through three committees: execution, management, and citizens. Participants on each committee include federal and state natural resource management agencies, local governments, transportation agencies, conservation organizations, and citizens. These participants are then invited to publicly participate about specific proposals. Those proposals are then assigned to work groups encompassed by professionals from those participating agencies. The purpose of the intensive involvement by stakeholders is to identify concerns related to the project design. As planning progresses, participants discuss and negotiate project objectives. For example, with the Poplar Island project there were negotiations about the percentage of the island that should serve as wetlands.
To rank projects in order of priority, MPA and other stakeholders use structured decision making involving criteria definition, economic and environmental decision matrices, and fatal flaw analysis. Members from the three committees participate in the development and implementation of decision making tools and procedures. This process yields a short list of options. After evaluating potential projects, committees select and carry out projects that mutually fulfill beneficial goals for the involved parties as in the case of the restoration of Poplar Island.
Although the Popular Island project is completed, engineers are still planning on the next island restoration project using dredged sediment. MPA and USACE are in the process of a pre-construction phase for a new “Mid-Chesapeake Bay Island Ecosystem Restoration”. This project will restore James and Barren islands and eventually replace Poplar Island as the source for dredged sediment from Maryland’s shipping channels. The organization and decision making tools used for the Poplar will be adopted and used in similar projects in the future. MPA Secretary, Greg Slater says, “Our experience working with the Army Corps of Engineers at Poplar Island gives us great optimism for what we can accomplish together at Mid-Chesapeake Bay” (Viviano 2021). The process of having a collaborative effort developing decision making tools and procedures is beneficial to the project itself, but also the relationship between stakeholders.

4. Applications of DMDT to Case Studies: Results and Discussion

This study aims to demonstrate the application of DMDT to the three projects using the project profile data into the worksheets and scorecards. The user can complete one of two criteria scorecards (A or B). However, for the purpose of this study, results using both scorecards are assessed. The input data are divided into the following: governance, economic, biophysical, built environment, and social considerations [2].

4.1. Case Study 1: Dog Beach, Greenwood, and Lee Street Beaches (Evanston, Illinois)

The potential beneficial use alternatives were evaluated for their technical and economic feasibility, protectiveness of human health and the environment, cost effectiveness, community acceptance, implementation time frame, and overall advantages and disadvantages, to determine which option should be selected to remediate the 54,560 square yards of the beaches, parks, and open space communities on Dog Beach, Greenwood, and Lee Street Beaches. Figure 5a,b show the result of scorecards A and B, respectively, of each alternative based on the DMDT.
Alternative 1 is “No Further Action” and would involve no further remedial activities at the site, which means there is no cost and a short implementation time frame. However, since there were no environmental concerns on site, there is no negative or positive impact in selecting this option. This alternative received the lowest potential score in all categories because it did not impact the biophysical, economic, social, governance, and built environment aspects of the project.
Alternative 2 is “Littoral Placement” and would require dredged material below the water line to raise the local nearshore. It would require significant cost and a significant implementation time frame. Excavation, removal and off-site disposal would involve removing the soil from Waukegan harbor and placing it on the Evanston shore.
Alternative 3 is “On-Beach Placement” and the shore showed similar benefits compared to the littoral placement. Both alternatives ensure long term protection of human health and the environment but the shoreline placement, though it comes at a high cost, it takes a moderate amount of time to complete the work.

4.2. Case Study 2: New York/New Jersey Harbor (New York)

New York/New Jersey Harbor deepening project (2004–2016) was expected to produce about 42.5 million cubic yards of dredged material before its start. However, about 52 million cubic yards of dredged material was produced from the Harbor Deepening Project. The quantity of material meant that several disposal methods of dredged material would take place. For the purpose of this project, three dredged material options were analyzed: no action, bathymetric recontouring, and brownfield and landfill remediation. The Scoresheet A and Scoresheet B results are shown in Figure 6a,b, respectively.
Using the DMDT, the worst performing alternative was Alternative 1, or “no action”. For both, Scoresheet A and B, the no action option scored the least out of the three options for almost every single category (biophysical, economy score, social score, governance score, and built environment score). This is due to the lack of positive impact “no action” produces.
Alternative 2 was bathymetric recontouring. This option ranked two out of three overall in both Scorecards A and B. It scored as the second best option because of the lack of social impacts it would have. However, this option relatively did well under the biophysical category for both scorecards.
Alternative 3 analyzed was the use in brownfield and landfill remediation. This alternative scored the highest because of all of the impacts it could have on all the categories. This alternative could improve the biophysical condition of an area. It could also improve eyesores and create new habitats for native species to live in. Additionally, the jobs this option could create through future possible development would be greatly beneficial to the residents and economy of the area. It also scored higher than the other two options in the ‘built environment’ category, this is because the material could be used as capping or fill material.

4.3. Case Study 3: Poplar Island (Chesapeake Bay)

Popular Island has recently undergone restoration and is now being considered for expansion. From the previous 400 acres, the island was restored to its original area of 1470 acres. The additional expansion can consider three alternatives: no action, lateral and vertical expansion (50% wetlands—50% uplands), and the final alternative of lateral and vertical expansion (29% wetland—47% upland—24% open water).
Scoresheet A scores the alternatives using a numerical scale based on the DMDT. The four categories are biophysical, economy, social, governance, and built environment scores. Each alternative is scored from 1 to 5, with 5 being the maximum score. Alternative 2 scored the highest specifically in the biophysical score. Alternatives 2 and 3 are so similar and the DMDT shows how they differ (Figure 7a). Within the biophysical score, questions regarding wetlands and open water habitats were the reasons for the different biophysical scores in Scoresheet A.
Scoresheet B scores the alternatives using a “Yes” and “No” option in the DMDT. The questions are identical to those in Scoresheet A, but not ranked numerically 1–5. The tool simply requires a ‘X’ indicating “yes” or a blank indicating “no”. Alternative 1 is scored almost identically to the other two alternatives in the economy, social and governance categories. This is because if Poplar Island does not undergo expansion, the restoration project will still receive dredged material and need maintenance for another 10 years. Many of the economic, social and governance questions still applied to the restoration project. Alternative 3 scored the highest in the biophysical category (Figure 7b).

5. Conclusions

The dredged material decision tool (DMDT) is a structured decision-making process for evaluating different alternatives for beneficial reuse of dredged material [2,16]. This is a powerful tool that stands apart from other decision-making methods because of its ability to organize complex details into a simple visual output. It evaluates the decision based on the criteria that includes environmental, economic, and social costs and benefits. The results show that the highest scoring alternative as the best option that best meets a combination of priorities, and produces the most biophysical gains and social benefits for the community. Furthermore, the results of the DMDT can be used to guide action plans and outline budgets for future dredged material projects. This study demonstrated the application of DMDT for three case studies, representing typical dredged material projects. Though the DMDT includes environmental, economic, and social criteria, the benefits may not be apparent to the stakeholders. Further research is needed to identify additional community benefits associated with common beneficial uses and incorporating them in the DMDT.

Author Contributions

Conceptualization, D.A., J.H., V.V. and K.R.R.; Methodology, D.A., J.H., V.V. and K.R.R.; Formal analysis, D.A., J.H. and V.V.; Resources, K.R.R.; Writing—original draft preparation, D.A., J.H. and V.V.; Writing—review and editing, K.R.R.; Supervision, K.R.R. All authors have read and agreed to the published version of the manuscript.

Funding

No funding received for this research.

Institutional Review Board Statement

Not applicable.

Informed Consent Statement

Not applicable.

Data Availability Statement

Not applicable.

Acknowledgments

This work was performed as a part of Environmental Remediation course at the University of Illinois at Chicago, IL, USA. The authors are grateful to the comments provided by the course participants and two anonymous reviewers.

Conflicts of Interest

The authors declare no conflict of interest.

References

  1. USACE (US Army Corp of Engineers). Great Lakes Confined Disposal Facilities; USACE: Chicago, IL, USA; Environmental Protection Agency: Washington, DC, USA, 2003. [Google Scholar]
  2. USEPA (US Environmental Protection Agency). Dredged Material Decision Tool (DMDT). The United States Environmental Protection Agency’s Center for Computational Toxicology and Exposure. Dataset. 2021. Available online: https://doi.org/10.23645/epacomptox.14428328.v1 (accessed on 7 October 2021).
  3. Gillespie, T. EPA Releases Dredged Material Decision Tool to Help with Sediment Disposal Decisions. EPA, Environmental Protection Agency. 2021. Available online: https://www.epa.gov/newsreleases/epa-releases-dredged-material-decision-tool-help-sediment-disposal-decisions (accessed on 7 October 2021).
  4. USACE (US Army Corp of Engineers). Public Beach Protection in 4 Illinois Coastal Communities Beneficial Use of Dredged Material Pilot Project Program DRAFT Detailed Project Report; Illinois Public Beach Protection; USACE: Chicago, IL, USA, 2020. [Google Scholar]
  5. USACE (US Army Corp of Engineers). Dredging on the Great Lakes; Detroit District; USACE: Detroit, MI, USA, 2021. [Google Scholar]
  6. US Census Bureau (USCB). Evanston City, Illinois Census. 1 July 2019. Available online: https://www.census.gov/quickfacts/evanstoncityillinois (accessed on 12 October 2021).
  7. Douglas, W.S.; Baier, L.J.; Gimello, R.J.; Lodge, J. A Comprehensive Strategy for Managing Contaminated Dredged Materials in the Port of New York and New Jersey. J. Dredg. Eng. 2003, 5. [Google Scholar]
  8. Ali, M.; Robert, M.; Roya, N. Evaluation of Long-Term Performance of Stabilized Sediment for Beneficial Use; Rutgers University: New Brunswick, NJ, USA, 2020. Available online: https://rosap.ntl.bts.gov/view/dot/53998 (accessed on 12 October 2021).
  9. Yozzo, D.J.; Wilber, P.; Will, R.J. Beneficial Use of Dredged Material for Habitat Creation, Enhancement, and Restoration in New York–New Jersey Harbor. J. Environ. Manag. 2004, 73, 39–52. [Google Scholar] [CrossRef] [PubMed]
  10. USACE (US Army Corp of Engineers). Fact Sheet—New York and New Jersey Harbor Deepening; New York District; USACE: New York, NY, USA, 2021. [Google Scholar]
  11. Webadmin. Official Site of the State of New Jersey. New Jersey/New York Harbor, Dredged Material Management, Maritime Resources, Multimodal/Freight. 2021. Available online: https://www.state.nj.us/transportation/freight/maritime/dreharbor.shtm (accessed on 11 October 2021).
  12. USACE (US Army Corps of Engineers); MDOT (Maryland Department of Transportation). Maryland Environmental Service. Poplar Island Restoration. 2021. Available online: http://www.poplarislandrestoration.com/ (accessed on 8 October 2021).
  13. Maryland Port Administration (MPA). Water Management Administration Tidal Wetlands Division; State Wetlands Case No: 15-WL-0131; MPA: Baltimore, MD, USA, 2015. [Google Scholar]
  14. USACE (US Army Corp of Engineers). Beneficial Uses of Dredged Materials Case Study: Poplar Island, Chesapeake Bay; Environmental Protection Agency: Washington, DC, USA, 2007.
  15. Viviano, M.W. Poplar Island Construction Officially Complete. Chesapeake Bay Magzine. 8 February 2021. Available online: https://chesapeakebaymagazine.com/poplar-island-construction-officially-complete/ (accessed on 10 October 2021).
  16. Williams, K.; Margeson, K.; Paczuski, S.; Auker, K.; Hoffman, J. Beneficial Use of Dredge Material Decision Tool: RESES Project Report; U.S. Environmental Protection Agency: Washington, DC, USA, 2021.
Figure 1. Typical DMDT input data, ranking criteria, and weighting factors.
Jmse 10 00178 g001
Figure 2. Locations of dredged material placement zones at Evanston beaches (approximate project location coordinates N 42.0469, W 87.6723).
Jmse 10 00178 g002
Figure 3. Location of New York/New Jersey Harbor (Approximate Project Location Coordinates N 40.5365, W 74.0867).
Jmse 10 00178 g003
Figure 4. Pre-construction and September 2011 aerial images of Poplar Island (approximate project location coordinates N 38.7615, W 76.3842).
Jmse 10 00178 g004
Figure 5. (a) Evanston Beaches category comparison—scoresheet A. (b) Evanston Beaches category comparison—scoresheet B.
Jmse 10 00178 g005
Figure 6. (a) NY/NJ Harbor Category Comparison—Scoresheet A. (b) NY/NJ Harbor Category Comparison—Scoresheet B.
Jmse 10 00178 g006
Figure 7. (a) Poplar Island Category Comparison—Scoresheet A. (b) Poplar Island Category Comparison—Scoresheet B.
Jmse 10 00178 g007aJmse 10 00178 g007b
Table 1. Summary of costs for Evanston beach remediation.
AlternativeConstruction CostLands, Easements, ROW, Relocations, DisposalPreconstruction and DesignConstruction ManagementTotal Cost
No Action$0$0$0$0$0
Littoral Placement$82,500$0$8250$4125$95,000
On-Beach Placement w/Hydraulic Dredging$1,362,000$156,000$220,000$74,000$1,812,000
Table 2. Alternative costs for New Jersey/New York Harbor.
AlternativeCost (per Cubic Yard)Total Cost
No Action$0$0
Bathymetric Recontouring$5–$10$260,000,000–$520,000,000
Landfill and Brownfield Remediation$10–$35$520,000,000–$1,820,000,000
Publisher’s Note: MDPI stays neutral with regard to jurisdictional claims in published maps and institutional affiliations.

