Article

Chinese Cruisers’ Preference, Travel Constraints, and Behavioural Intention: Experience from the Arctic Cruise Market

1
Division of Business and Hospitality Management, College of Professional and Continuing Education, The Hong Kong Polytechnic University, Hong Kong, China
2
School of Business Administration, East China Normal University, Shanghai 200062, China
3
Faculty of Interdisciplinary Studies, Khon Kaen University, Nong Khai 43000, Thailand
*
Author to whom correspondence should be addressed.
J. Mar. Sci. Eng. 2022, 10(2), 156; https://doi.org/10.3390/jmse10020156
Submission received: 14 December 2021 / Revised: 8 January 2022 / Accepted: 14 January 2022 / Published: 26 January 2022
(This article belongs to the Special Issue Marine Policy)

Abstract

:
Global climate change accelerates ice melting in the Arctic region, making Arctic shipping possible and revealing a new door to develop cruise tourism. The rapid expansion of cruise tourism into the Arctic region has posed substantial implications for the cruise industry, including opportunities and challenges. This study investigates the Chinese cruise industry and the encounters and obstacles that have unfolded in the Arctic cruise market. The study also explores the Chinese cruisers’ travel constraints, preferences, and behavioral intention to the Arctic region. The implications of the findings are drawn to develop the entire Arctic cruise market. This study also provides invaluable insight into the cruise industry’s adaptation strategies and practices and relevant supporting business sectors.

1. Introduction

Global warming has generated significant transformation in the cruise industry in the last few decades. The sea melting of sea ice in the Arctic Ocean has created a new cruise market and the future of navigation. To this end, it is expected that cruise shipping activity in the Arctic will rise remarkably, notably in exploration activities and cruise tourism [1,2]. Over the last three winters, temperatures in the central Arctic were six degrees celsius above average, and 278 gigatonnes of ice were lost from the Greenland Ice Sheet per year [3]. In this sense, a meteorological forecast is that the decrease of Arctic Sea ice will speed up. Numerous researchers and mass media present the expectation of Arctic tourism in various phases, such as an abundance of cruises in the next few years, now entering a maturing phase, cruise industry’s inevitable growth in the Arctic, and the fast-growing market [4,5].
Nevertheless, the Arctic region is in a growth stage due to the fresh introduction of innovative cruise tourism products consisting of unexpected cultures, exciting shore excursions, exotic experiences, and attractive cruising destinations [6]. Since 2009, cruise tourism has fully covered all Arctic destinations [1]. Specifically, the critical issue in investigating Arctic tourism is in locating its boundaries. The Arctic region covers Alaska, Canada, Finland, Greenland (Denmark), Iceland, Norway, Russia, and Sweden. This region is difficult to access and remote with the lack of the ability to move across the entire Circumpolar North, is subject to human capital issues (i.e., inadequate know-how), and occurs in vulnerable natural and weak culture conditions [6].
Cruise travel to the Arctic region has arisen since 1984. The effect of global climate change enhances cruise ships’ abilities to more easily access remote Canadian Arctic communities [4,7]. The notable change in the Arctic region is due to the rise in temperatures. The cruise industry now strives towards Antarctica and Arctic regions by expanding between the poles, providing more than 200 destinations in 30 countries. As a result, Arctic cruise passengers will remarkably grow from 242,154 in 2018 to 412,153 in 2027. At the same time, the number of berths in the Arctic region will increase from 9637 in 2018 to 14,415 in 2027. To accommodate these, the number of Arctic cruise ships will increase from 73 ships in 2018 to 94 ships in 2027 [8].
Previous studies on Arctic cruise shipping have focused on tourism management rather than the maritime transport management discipline [4,9,10,11]. Only Fedi et al. [12] studied the transportation of Arctic cruising, highlighting cruise ship casualty and passenger safety. In addition, considerable works focus on economics, cruise shipping management, and day-to-day cruise shipping operational activities. Some studies have concentrated on the customer perceptions of the cruise industry, safety management, behavioral aspects of inter-firm relations, cruise ship operational efficiency, cruise shipping regulations and governance, and the portfolio analysis of the cruise shipping sector [13,14,15]. However, most studies focus on the cruise shipping market in the European, North American, and Asian regions. An emerging cruise market in the Arctic region is still an under-researched topic and seriously overlooked. Lasserre and Pelletier [16] (p. 1465) argued that stakeholders’ attitudes towards cruising in the Arctic region are blurred and confident and that “scenarios for the development of marine traffic in the Arctic remain highly speculative”. Therefore, it is expected that Chinese cruisers will be the largest cruise market in the Arctic region in 2022 [17]. In addition, the improvement of COVID-19 treatments, the introduction of a vaccination program, the commencement of vaccine passports for cruise travel, and the emergence of compensatory consumption motivate Chinese cruisers to take expedition cruises to the Arctic again. In general, Panahi et al. [5] indicated that Arctic research is scarce in academic research studies, although there is an upward trend towards international shipping activities in the Arctic region. Cai et al. [18] addressed previous studies investigating tourists’ customer value, weather perceptions, food tourism, and niche market segmentation (e.g., adventure tourism, wellness tourism) in the Arctic region. Obviously, some critical issues of Arctic cruise shipping related to Chinese cruiser’s travel constraints, preferences, and behavioral intention to the Arctic region are neglected. The Chinese cruise industry’s response to a challenge in the Arctic cruise market is overlooked. These will be addressed in the present study.
This study investigates the Chinese cruise industry’s encounters that have unfolded obstacles in the Arctic cruise market. The study also explores the Chinese cruisers’ travel constraints, preferences, and behavioral intention to the Arctic region. This study gives fundamental work and invaluable insight into the cruise industry’s adaptation strategies and practices, and other supporting business sectors.
The paper is divided into four main sections. Section 1 provides the research background, settings, and objectives. Section 2 discusses the key concept of cruiser’s travel constraints, preferences, and behavioral intention. Section 3 explains the research methodology, while Section 4 presents investigating the China cruise market in the Polar region from products and tourists’ perspectives. The conclusion is provided in Section 5.

2. Literature Reviews

Cruise tourism is a significant contributor to the local economy in different countries across various parts of the world [19,20]. Cruise tourism has experienced steady growth with an average growth rate of 8.1% per year in the number of cruisers onboard since the 1980s [21]. Due to the Arctic region including a number of new destinations, it stimulates the Chinese cruisers to visit again by enchanting destination experiences. Destination tourism creates supporting industries and increases regional economic development in the future [22]. Importantly, the unique destination image is a critical element that affects tourists’ destination preferences, satisfaction, behavioral intentions, and decision-making processes. It is practicable that the tourists’ perception of a specific destination involves exceptional measurement context and content instead of depending only on pre-determined measures drawn from various contexts [19]. To a large extent, it is useful for cruise lines to design, plan, and implement various marketing strategies into diverse market segments such as families, old-retired people, and young consumers.
Various studies have explored the associations between the destination image and tourists’ preference and visit intention [23]. Moreover, many studies have focused on the influence of prior travel experience on destination image [24], the evolution of destination image [25], and the dimensions of destination image [26]. Lee et al. [27] further elaborated intentional creation in advance due to the strength of the preference for the product. Marti [28] noted that cruisers are concerned about staying time on a cruise and each port. Sun et al. [22] further explained that most cruisers intend to spend more time and money onshore rather than offshore. Indeed, Chinese cruisers recognized the importance of visiting tourist attractions onshore to create a memorable experience [29] and obtain knowledge of cultures and history [30]. In other words, whole day stays and overnight at port enhance the competitiveness of Arctic cruise tourism.
A positive country image may be considered as a distinguishing factor for current highly competitive destinations [31,32,33]. This would determine the tourists’ decision-making process. Despite the fact that potential tourists have favorable image perceptions in the direction of a destination, they may not prefer to visit that place because of the negative perceptions of the country generally. In the Arctic region, a series of unpleasant messages consists of security, economic development, extreme weather conditions, and a vulnerable cultural problem. This is completely different in accordance with tourists’ understanding of the destination. To this end, this creates misalignment between the destination image and country image, especially in a lack of relevant experience with the destination. Nevertheless, the concept of a country image is seriously lacking in tourism literature [19].
Choi and Cai [34] and Chaulagain et al. [19] identified that there was a close relationship among tourists’ preferences, behavioral intentions, and the destination image. Gnoth [35] (p. 286) also reflected that the tourism research corresponds to the enlargement of the consumer behavior research area, including motivation and intention formation, the actual behavior and experience, and evaluation and consequences. Therefore, tourism not only considers economic and social circumstances but also concerns about psychological concepts [27]. However, a few studies have investigated the interaction between these constructs. Indeed, the country image affects the tourists’ destination image perceptions and their behavioral intention to visit that country as a tourism destination [19]. To this end, it takes into account country image in the present study.
Hung and Petrick [21] elucidated that the notion of constraints has been widely adopted in leisure activities. Cruise Lines International Association (CLIA) [36] (p. 3) reinforced “the cruise industry is the most exciting growth category in the entire leisure market”. However, the establishment of a measurement scale for constraints to cruise travel or adopting the concept of travel constraints examining the limitation of the cruisers’ decision to take a cruise vacation is under-researched. Potential travel constraints foster clarifying as intentions do not continually foresee behavior [27]. These perceived behavioral controls impact both behaviors and intentions. The establishment of leisure constraints as a multi-dimensional construct has encouraged the robust assessment of constraints to be more organized [21]. The resulting measurement scale has demonstrated acceptable reliability and validity. Lee et al. [37] explored the relationships between three inter-related concepts: Travel constraints, learned helplessness, and intention to travel. They found that the three sub-dimensions of constraints impose no significant influence on travel intentions. However, two of the three dimensions (i.e., intrinsic and environmental) are statistically significantly associated with learned helplessness.
Hung and Petrick [38] applied the Motivation Opportunity Ability (MOA) model to explain travel intentions. The MOA model suggests that motivation, opportunity, and ability are major factors influencing travel intentions. Chen et al. [39] assessed the relationship between travel constraints and the destination image of Brunei from a young travelers’ perspective. The study showed a positive relationship between travel constraints and destination during the early decision-making process. Lu et al. [40] provided the empirical examination of the seniors’ travel behavior and time perspectives. Travel motivations fully mediate the associations between time perspectives and travel intention. Petrick [41] segmented that various cruise passengers based on their price sensitivity to determine if price-sensitive markets are desirable. The results revealed that less price-sensitive visitors are more likely to spend more, while more price-sensitive visitors are more likely to evaluate their experiences positively.
Ng et al. [42] examined the effect of cultural distance on tourists’ destination choices. The perceived cultural distance measure appears to be a better predictor for cruiser intention. Wu et al. [43] proposed a multi-dimensional and hierarchical model and identified significant relationships among experiential quality, experiential value, experiential satisfaction, and behavioral intentions. Le and Arcodia [44] synthesized the existing knowledge on the role of risk perception in cruising, explored theories underpinning risk perception and its measurements, and identified key factors influencing risk perception.
Constraints are core elements that refrain people from continuing or launching to take a cruise. Recognizing the travel constraints helps to identify the inconsistency between actual and estimated cruise tourism performance and provides a useful reference for designing comprehensive marketing campaigns to investigate potential markets. The aforementioned Arctic cruise market is recognized as a fast-growing and promising cruise market in the forthcoming years [4]. In the study, a compelling research question relevant to this scenario is: Why do people not cruise even when they are interested in Arctic cruising? To respond to the research question, the three main kinds of leisure constraints (i.e., intrapersonal, interpersonal, and structural) are required to conduct a thorough analysis [45]. Intrapersonal constraints refer to the psychological conditions of an individual consisting of their attitude, interest, and personality towards Arctic cruises. Interpersonal constraints identify the interface between potential participants and others, for instance, their friends and family members. Structural constraints are classified as external factors, such as weak transportation systems and poor facilities that demotivate possible cruisers.

3. Methodology

In this study, we mainly adopt the case study approach to fill the research gap. Based on Di Vaio et al. [46], “the case study approach is a useful method for examining phenomena still unexplored. The case study allows the investigation of phenomena separately from the context examining specific variables.” Every single case study has to be precisely exhibited. Specifically, the case study method is mainly applied as a qualitative method instead of a quantitative method. Therefore, we concentrate on a rigorous case investigation of historical data and archives. The quantitative data method is generally used to assess common phenomena or situations. Eventually, the conducted case study is expected to ensure a robust interpretation and exploration of the collected data and draw the key conclusions about the Chinese cruise industry encounters and the unfolded obstacles in the Arctic cruise market, as well as Chinese cruisers’ travel constraints, preferences, and behavioral intention towards the Arctic region.

4. Chinese Cruise Market in Polar Region

With the transformation of tourism product position and the increasing tourism demand in recent years, various individualized tourism products have been developed to satisfy the current and potential tourists’ demands and preferences. In addition, local residents’ consumption level has been continuously upgraded, and with the rapid integration of culture and tourism industry, the outbound tourism system is extensively enlarged. Therefore, high-end outbound tourism has entered the most selective category of tourists. Under these circumstances, mysterious and challenging polar exploration tourism has widely raised concerns and has been praised.
In the context of global integration, tourists are allowed free access to various countries. This can speed up the development of tourist attractions and routes. Chinese tourists have gradually become an important part of the polar tourism market and are constantly expanding. Taking Antarctic tourism as an example, according to the International Association of Antarctic Tour Operators (IAATO) information, the number of Chinese tourists to Antarctica will exceed that of the United States in the Antarctic season from 2022 to 2023. China has become the largest source of tourists in Antarctic tourism [17]. Currently, a cruise is the main way to participate in polar tourism. As far as the existing cruise market situation is concerned, the cruise tourism products are getting more diversified, and the enlargement of polar routes inclines towards maturity. Accordingly, an increasing number of tourists participate in the wave of polar cruise tourism.

4.1. Cruise Products

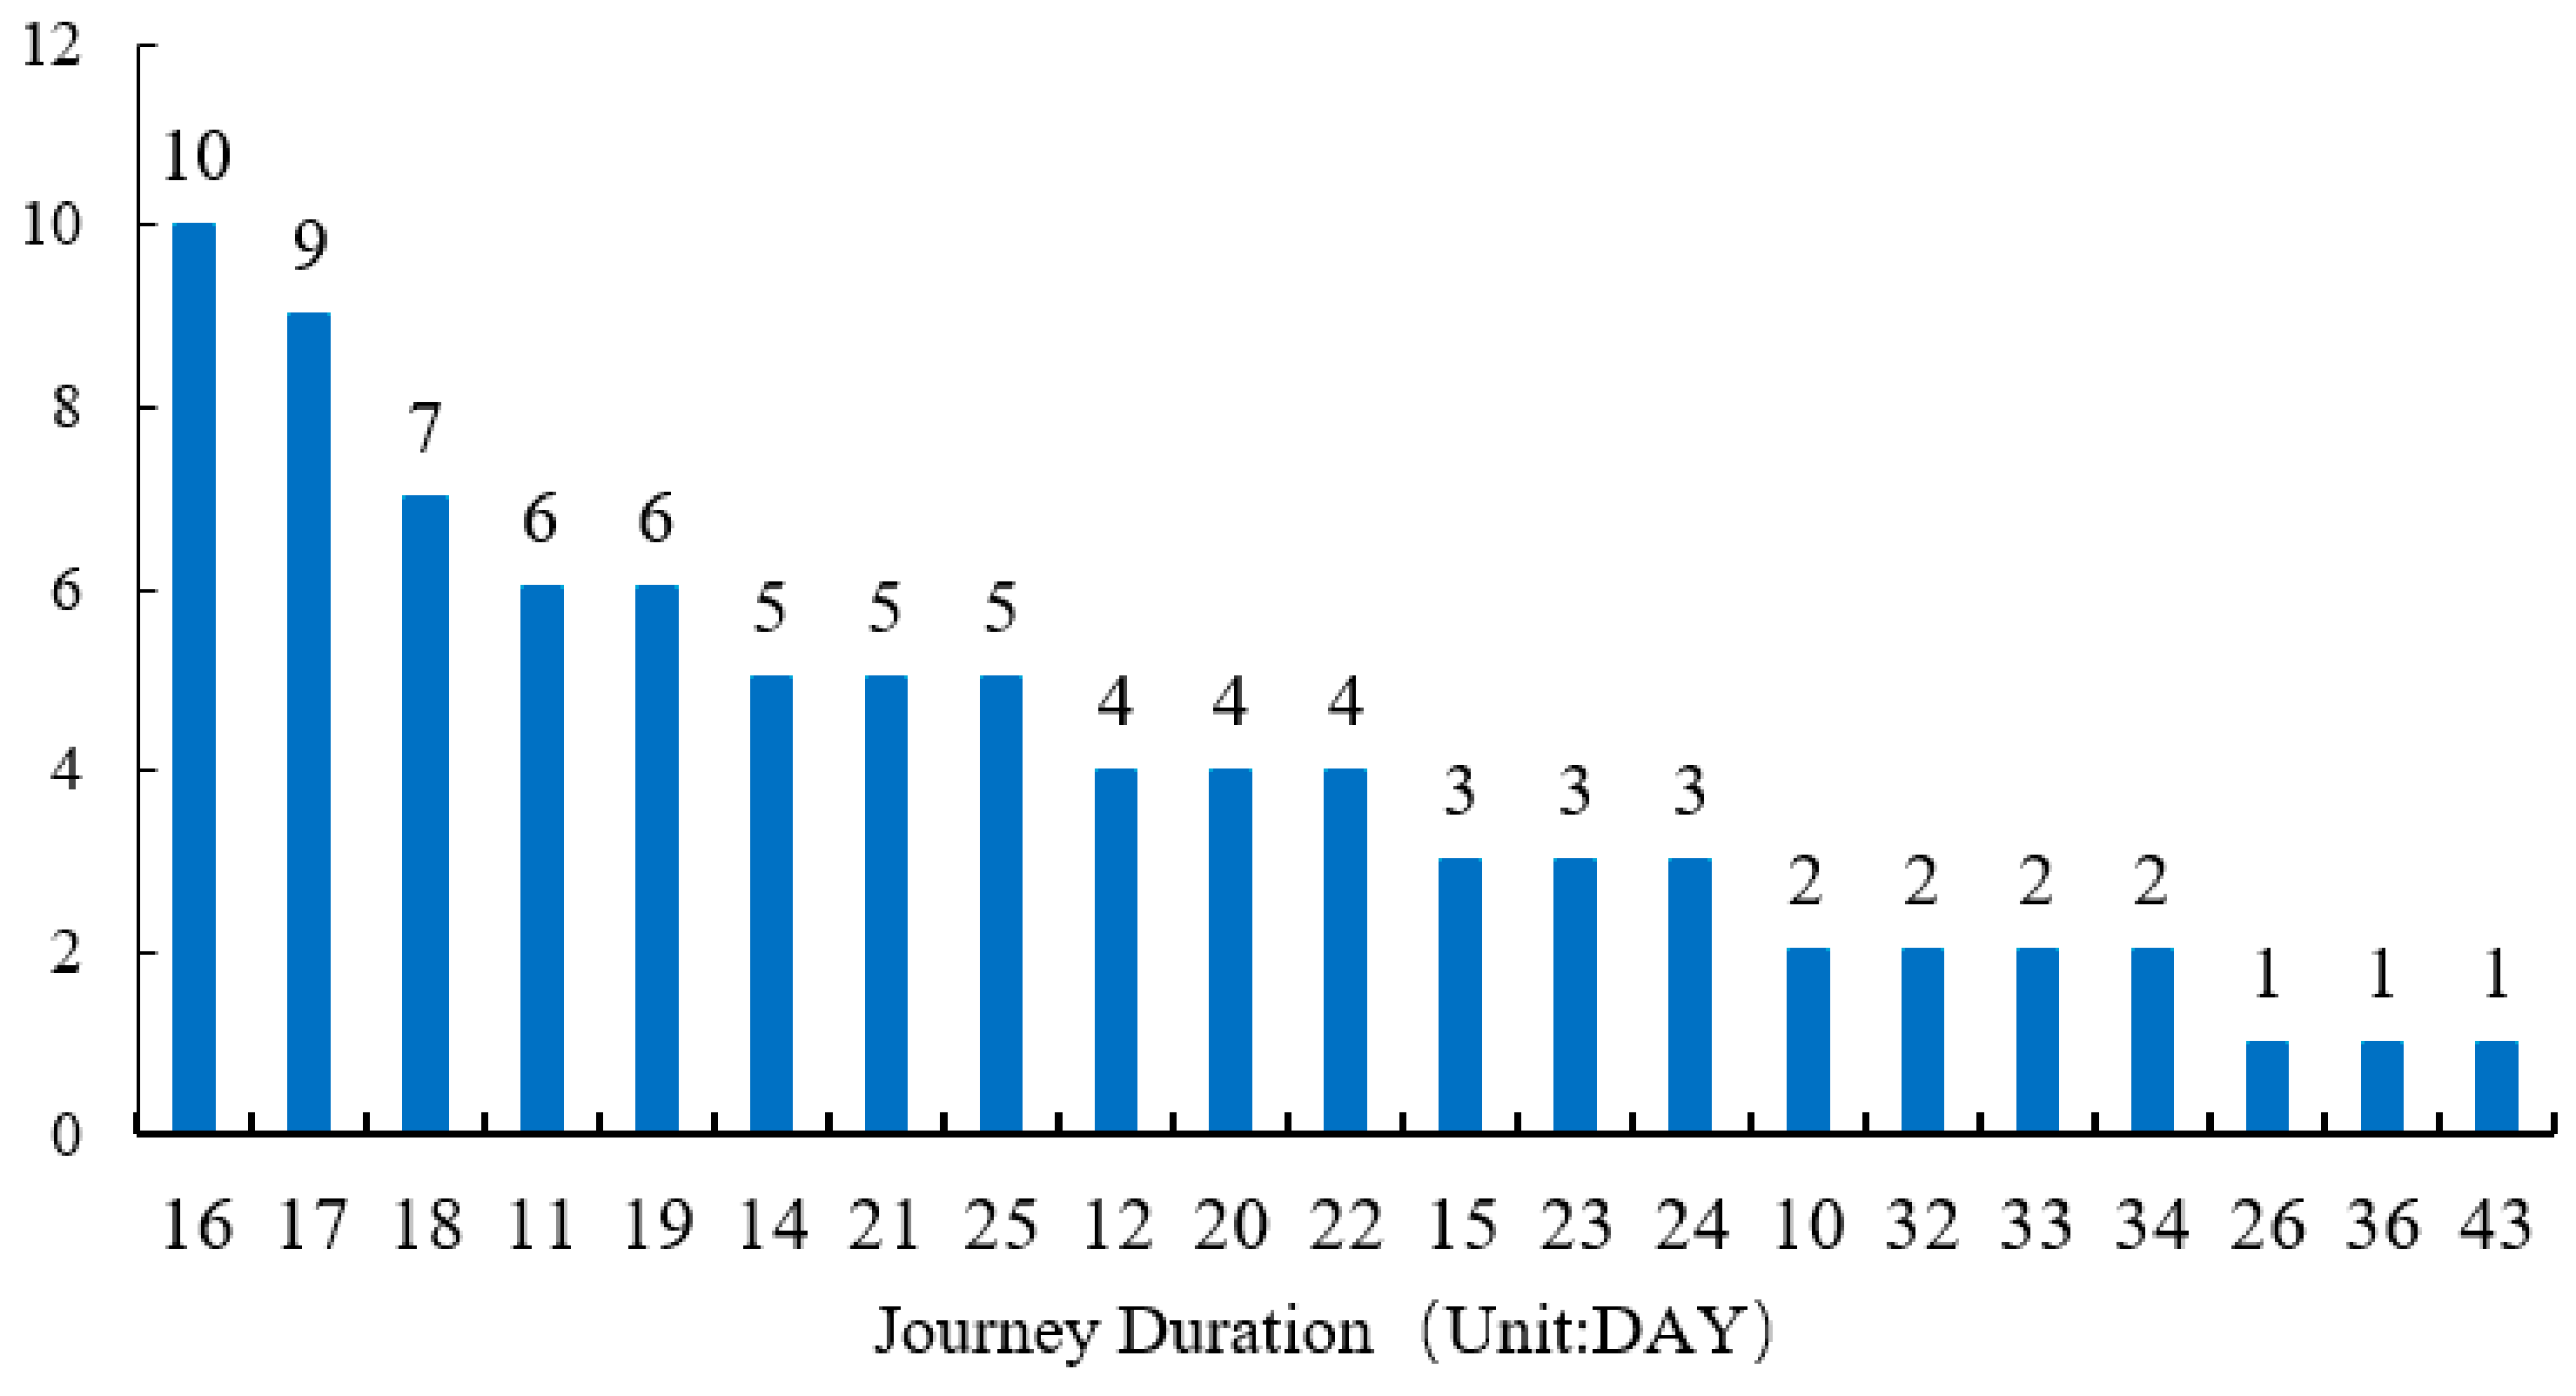
4.1.1. Characteristics of Cruise Routes

Regarding analyzing the characteristics of cruise routes, this paper obtains 85 cruise routes of 14 cruise ships from 9 cruise companies released on two well-known domestic travel websites of C-trip (The Strategies of Cruise Trip and Cruise Itineraries https://cruise.ctrip.com/, accessed on 20 December 2021) and Tongcheng (Travel Go. http://www.ly.com/, accessed on 10 December 2021). Based on this data, the study combined the key characteristics of the Chinese polar cruise tourism market: Departure port, route length, and cruise lines. General speaking, the distribution of departure ports and ports of calls of polar cruises is relatively concentrated. This is not a regional concentration, but it is distributed in the focused area.
In the Arctic routes, departure ports are Longyearbyen (Norway), Murmansk (Russia), Reykjavik (Iceland), Warnemunde (Berlin), Hamburg (Germany), and Amsterdam (Netherlands). More than 70% of the cruise routes are from Longyearbyen. For the departure ports of the Antarctic routes, most cruise routes depart from Ushuaia (Argentina), with a high proportion of 81.82%. The details of departure ports are provided in Table 1.
Table 2 and Table 3 show the details and features of ports of call. Table 2 shows that the top three ports of call of the Arctic routes are Svalbard (Norway), Spitsbergen (Norway), and Ny-Alesund (Norway). The frequency contributes 24.89%, 11.76%, and 7.69% of total calls, respectively. The Antarctic routes (Table 3) show that Antarctic Peninsula and the South Shetland Islands are called by cruise ships the most, with the frequency of calling higher than 70%.
The trip duration is between 16 and 25 days. A 16-day journey accounts for the highest proportion, followed by a 17-day journey, which accounted for 11.8%. The rest are 18-day, 11-day, and 19-day journeys generating 10.6%, 8.2%, 7.1%, and 7.1% of the total frequency, as shown in Figure 1.
Currently, the famous brand names of cruise lines operating in China’s polar cruise market are Hondius under Oceanwide expeditions, Fram under Hurtigruten, Ocean Atlantis under Albatros Expeditions, and World Explorer under Quark Expeditions, with market shares of 28.24%, 21.18%, 8.24%, and 8.24%, respectively (Table 4). Hondius has performed the highest proportion of the Polar cruise market. Hondius is also an anti-icing 1A + class and has current international recognition as one of the ships with the highest international anti-icing class.

4.1.2. Sale Pattern

The sale pattern of polar cruise products in China is basically described as a combination of ‘fly + cruise’. The domestic departure cities of ‘fly’ are mainly Beijing, Shanghai, Guangzhou, Hong Kong, and Shenzhen. Among them, Shanghai performs the highest frequency with 38.69% (Table 5). According to a report relevant to hot spots of polar tourism in China issued by Fliggy, the tourists from Shanghai account for 65% of the total tourists of the Arctic and Antarctic. This is higher than those from Beijing and Hong Kong.

4.2. Chinese Cruisers’ Travel Motivation and Restrictions

4.2.1. Travel Motivation

Compared with traditional cruise travel, ‘polar + cruise’ is a remarkable and indispensable experience segment. The characteristics of the polar cruise are more prominent. The original intention of Chinese cruisers to the Arctic is to appreciate the Aurora, polar bears, and Santa Claus Village rather than enjoy the cruise journey. Cheung et al. [47] addressed that exploring particular wildlife and experiencing nature (e.g., icebergs) are the main driving force for Chinese cruisers to the Arctic. However, cruisers are not concerned about the historical significance of the site. The factors motivating Chinese tourists to cruise in the Arctic are nature, natural reflection, place identity, joining the story, and last-chance experience [48]. However, climate change concerns will encourage cruisers’ travel motivation for a last-chance experience [49]. This implies that the effect of climate change may influence the travel patterns and planning of Chinese tourists. There will be an increasing trend for Chinese tourists visiting the Arctic in the forthcoming years.

4.2.2. Travel Restrictions

The first travel restriction is the effect of the product price on travel desire, taking the two well-known domestic tourism websites (i.e., C-trip and Tongcheng) quotations as illustrative examples. The prices of products for the Arctic and Antarctic cruise tourism range from 50,000 yuan to 250,000 yuan. This discourages tourists from polar cruise tourism. Additionally, international and national policies will contain considerations regarding rigorous environmental protection. This is difficult to balance with the supply and demand sides of the development of the polar cruise tourism market. In 2009, 28 Antarctic Treaty Consultative countries agreed to impose mandatory restrictions on the size of cruise ships and the number of cruisers in Antarctica to reduce the negative impact of human activities on the Antarctic environment. These restrictions pertaining to prohibit cruise ships carrying more than 500 cruisers from docking in Antarctica, allow one cruise ship berth at each location in Antarctica and forbid less than 100 tourists ashore each time.

5. Conclusions

The Chinese cruise market in the Arctic region is expanding. However, it still encounters potential challenges that need to be resolved in the future. The existing hierarchy of polar cruise products needs to be improved, and cruise lines require some breakthroughs. Therefore, the future polar cruise tourism market can make full use of the relevant resources, integrate and cooperate with the global cruise tourism market, improve its characteristics, and analyze the existing and potential needs of tourists. To this end, it can continuously design and implement the possible cruise routes to bring a unique cruise tourism experience in terms of polar natural landscapes and animals.
China’s polar cruise tourism market fails to perform with a clear focus. Most cruisers perceive it as an approach to realize polar tourism even if the number of Chinese engage in polar cruise tourism is not less. Additionally, current publicity strategies tend to show and market polar tourism itself. Therefore, it is necessary to expand the existing marketing efforts further and design innovative marketing methods to address the cruise attributes of the polar cruise tourism market. This can encourage cruisers to retake polar cruises.
The contradiction between the continuous expansion of the polar cruise tourism market and the threat of the polar ecological environment is a critical issue. Under this impact, the polar cruise tourism market may sway and out of global ecological considerations, the development and promotion of the polar tourism market should be carried out carefully and seriously. Therefore, various stakeholders should seek to capture the dynamic changes of relevant policies timely and follow up with the needs of the tourist group simultaneously to make adjustments in a timely and reasonable manner. As such, the interests of tourists (the demand side) and cruise lines (the supply side) are maximized accordingly.
This paper provides a general understanding of Chinese cruisers’ travel constraints, preferences, and behavioral intention to the Arctic region. However, this study did not conduct a large-scale survey to carry out a comprehensive study and thorough analysis of the Chinese cruise industry to find issues relevant to the industry and cruisers in this region. We also estimate factors of influence of the external environment by using an econometric modeling approach. This will be useful for cruise lines and industrial stakeholders to design and implement cruise shipping strategies in the Arctic region. This should be considered and conducted in future research. This will also be useful in investigating the main features of the Chinese cruise industry and designing different strategies in the Arctic cruise market. To a certain extent, more investigation is urgently demanded to completely investigate the chances and implications of keynotes as the nature and demographics of Arctic tourism change. This study did not consider the logistical chains of cruise passenger movement and cruise ships that perform corresponding cruises. Cruise shipping supply chains is crucial to improving efficient cruise operations and maximizing cruisers’ experience. As such, future research should incorporate these issues. Future research may also take into account the models to forecast the development of the sphere of the cruise market and factors of influence of the external environment that affect cruising in this region.

Author Contributions

Conceptualization, Y.-Y.L.; methodology, X.S., W.Y. and M.K.; formal analysis, X.S., W.Y.; writing-original draft preparation, Y.-Y.L., X.S., W.Y. and M.K.; writing review and editing, M.K. All authors have read and agreed to the published version of the manuscript.

Funding

The publication of this research was substantially funded by the College of Professional and Continuing Education, The Hong Kong Polytechnic University. This study was supported by grants from the National Natural Science Foundation of China (No. 71572057) and the Shanghai Art Science Planning Project (No. YB2021G04).

Institutional Review Board Statement

Not applicable.

Informed Consent Statement

Not applicable.

Data Availability Statement

Not applicable.

Acknowledgments

The authors would like to thank the College of Professional and Continuing Education, The Hong Kong Polytechnic University for the funding.

Conflicts of Interest

The authors declare no conflict of interest during preparation and publishing of this work.

References

  1. Lasserre, F.; Têtu, P.-L. The cruise tourism industry in the Canadian Arctic: Analysis of activities and perceptions of cruise ship operators. Polar Rec. 2015, 51, 24–38. [Google Scholar] [CrossRef]
  2. Bystrowska, M.; Dawson, J. Making places: The role of Arctic cruise operators in ‘creating’tourism destinations. Polar Geogr. 2017, 40, 208–226. [Google Scholar] [CrossRef]
  3. Fund, W.W. 2020. Available online: https://arcticwwf.org/ (accessed on 30 October 2021).
  4. Stewart, E.J.; Howell, S.E.; Draper, D.; Yackel, J.; Tivy, A. Sea ice in Canada’s Arctic: Implications for cruise tourism. Arctic 2007, 60, 370–380. [Google Scholar] [CrossRef] [Green Version]
  5. Panahi, R.; Ng, A.K.; Afenyo, M.; Lau, Y.-Y. Reflecting on forty years contextual evolution of arctic port research: The past and now. Transp. Res. Part A Policy Pract. 2021, 144, 189–203. [Google Scholar] [CrossRef]
  6. Rantala, O.; Maher, P.T.; Gelter, H.; Hillmer-Pegram, K.; Hovgaard, G.; Hull, J.; Þór Jóhannesson, G.; Karlsdóttir, A.; Pashkevich, A. Arctic tourism: Realities and possibilities. Arct. Yearb. 2014, 2014, 290–306. [Google Scholar]
  7. De Silva, L.W.A.; Inoue, J.; Yamaguchi, H.; Terui, T. Medium range sea ice prediction in support of Japanese research vessel MIRAI’s expedition cruise in 2018. Polar Geogr. 2020, 43, 223–239. [Google Scholar] [CrossRef]
  8. News CI. Expedition Market Report: Cruise Lines International Association. 2018. Available online: http://www.cruising.org/press/overview%202006/ind_overview.cfm (accessed on 9 March 2021).
  9. Hall, C.M. Trends in ocean and coastal tourism: The end of the last frontier? Ocean. Coast. Manag. 2001, 44, 601–618. [Google Scholar] [CrossRef]
  10. Eijgelaar, E.; Thaper, C.; Peeters, P. Antarctic cruise tourism: The paradoxes of ambassadorship, “last chance tourism” and greenhouse gas emissions. J. Sustain. Tour. 2010, 18, 337–354. [Google Scholar] [CrossRef]
  11. Stewart, E.J.; Dawson, J.; Draper, D. Cruise tourism and residents in Arctic Canada: Development of a resident attitude typology. J. Hosp. Tour. Manag. 2011, 18, 95–106. [Google Scholar] [CrossRef]
  12. Fedi, L.; Faury, O.; Gritsenko, D. The impact of the Polar Code on risk mitigation in Arctic waters: A “toolbox” for underwriters? Marit. Policy Manag. 2018, 45, 478–494. [Google Scholar] [CrossRef] [Green Version]
  13. Chira-Chavala, T.; Yoo, S. Potential safety benefits of intelligent cruise control systems. Accid. Anal. Prev. 1994, 26, 135–146. [Google Scholar] [CrossRef]
  14. Touran, A.; Brackstone, M.A.; McDonald, M. A collision model for safety evaluation of autonomous intelligent cruise control. Accid. Anal. Prev. 1999, 31, 567–578. [Google Scholar] [CrossRef]
  15. Lau, Y.-Y.; Tam, K.-C.; Ng, A.K.; Pallis, A.A. Cruise terminals site selection process: An institutional analysis of the Kai Tak Cruise Terminal in Hong Kong. Res. Transp. Bus. Manag. 2014, 13, 16–23. [Google Scholar] [CrossRef]
  16. Lasserre, F.; Pelletier, S. Polar super seaways? Maritime transport in the Arctic: An analysis of shipowners’ intentions. J. Transp. Geogr. 2011, 19, 1465–1473. [Google Scholar] [CrossRef]
  17. Finance S. Polar Tourism “Ice and Fire”: Hot Market and Ecologically Fragile. 2018. Available online: http://finance.sina.com.cn/world/gjcj/2018-09-07/doc-ihiixzkm5710938.shtml (accessed on 30 November 2021).
  18. Cai, Y.; Ma, J.; Lee, Y.-S. How do Chinese travelers experience the Arctic? Insights from a hedonic and eudaimonic perspective. Scand. J. Hosp. Tour. 2020, 20, 144–165. [Google Scholar] [CrossRef]
  19. Chaulagain, S.; Wiitala, J.; Fu, X. The impact of country image and destination image on US tourists’ travel intention. J. Destin. Mark. Manag. 2019, 12, 1–11. [Google Scholar] [CrossRef]
  20. Sun, X.; Yip, T.L.; Lau, Y.-Y. Location characteristics of cruise terminals in China: A lesson from Hong Kong and Shanghai. Sustainability 2019, 11, 5056. [Google Scholar] [CrossRef] [Green Version]
  21. Hung, K.; Petrick, J.F. Developing a measurement scale for constraints to cruising. Ann. Tour. Res. 2010, 37, 206–228. [Google Scholar] [CrossRef]
  22. Sun, X.; Xu, M.; Lau, Y.-Y.; Gauri, D.K. Cruisers’ satisfaction with shore experience: An empirical study on A China-Japan itinerary. Ocean Coast. Manag. 2019, 181, 104867. [Google Scholar] [CrossRef]
  23. Prayag, G. Tourists’evaluations of destination image, satisfaction, and future behavioral intentions—the case of mauritius. J. Travel Tour. Mark. 2009, 26, 836–853. [Google Scholar] [CrossRef]
  24. Kim, W.; Malek, K.; Kim, N.; Kim, S. Destination personality, destination image, and intent to recommend: The role of gender, age, cultural background, and prior experiences. Sustainability 2018, 10, 87. [Google Scholar] [CrossRef] [Green Version]
  25. Foroudi, P.; Akarsu, T.N.; Ageeva, E.; Foroudi, M.M.; Dennis, C.; Melewar, T. Promising the dream: Changing destination image of London through the effect of website place. J. Bus. Res. 2018, 83, 97–110. [Google Scholar] [CrossRef]
  26. Echtner, C.M.; Ritchie, J.B. The measurement of destination image: An empirical assessment. J. Travel Res. 1993, 31, 3–13. [Google Scholar] [CrossRef]
  27. Lee, C.-K.; Mjelde, J.W.; Kim, T.-K.; Lee, H.-M. Estimating the intention–behavior gap associated with a mega event: The case of the Expo 2012 Yeosu Korea. Tour. Manag. 2014, 41, 168–177. [Google Scholar] [CrossRef]
  28. Marti, B.E. Passenger perceptions of cruise itineraries: A Royal Viking Line case study. Mar. Policy 1992, 16, 360–370. [Google Scholar] [CrossRef]
  29. DiPietro, R.B.; Peterson, R. Exploring cruise experiences, satisfaction, and loyalty: The case of Aruba as a small-island tourism economy. Int. J. Hosp. Tour. Adm. 2017, 18, 41–60. [Google Scholar] [CrossRef]
  30. Sun, X.; Kwortnik, R.; Xu, M.; Lau, Y.-Y.; Ni, R. Shore excursions of cruise destinations: Product categories, resource allocation, and regional differentiation. J. Destin. Mark. Manag. 2021, 22, 100660. [Google Scholar] [CrossRef]
  31. Zhang, H.; Xu, F.; Leung, H.H.; Cai, L.A. The influence of destination-country image on prospective tourists’ visit intention: Testing three competing models. Asia Pac. J. Tour. Res. 2016, 21, 811–835. [Google Scholar] [CrossRef]
  32. Stepchenkova, S.; Shichkova, E. Country and destination image domains of a place: Framework for quantitative comparison. J. Travel Res. 2017, 56, 776–792. [Google Scholar] [CrossRef]
  33. Hahm, J.; Tasci, A.D.; Terry, D.B. Investigating the interplay among the Olympic Games image, destination image, and country image for four previous hosts. J. Travel Tour. Mark. 2018, 35, 755–771. [Google Scholar] [CrossRef]
  34. Choi, S.-H.; Cai, L.A. Dimensionality and associations of country and destination images and visitor intention. Place Branding Public Dipl. 2016, 12, 268–284. [Google Scholar] [CrossRef]
  35. Gnoth, J. Tourism motivation and expectation formation. Ann. Tour. Res. 1997, 24, 283–304. [Google Scholar] [CrossRef]
  36. CLIA. The 2006 Overview: Cruise Lines International Association. 2007. Available online: https://cruising.org/en/ (accessed on 7 January 2021).
  37. Lee, B.K.; Agarwal, S.; Kim, H.J. Influences of travel constraints on the people with disabilities’ intention to travel: An application of Seligman’s helplessness theory. Tour. Manag. 2012, 33, 569–579. [Google Scholar] [CrossRef]
  38. Hung, K.; Petrick, J.F. Testing the effects of congruity, travel constraints, and self-efficacy on travel intentions: An alternative decision-making model. Tour. Manag. 2012, 33, 855–867. [Google Scholar] [CrossRef]
  39. Chen, H.-J.; Chen, P.-J.; Okumus, F. The relationship between travel constraints and destination image: A case study of Brunei. Tour. Manag. 2013, 35, 198–208. [Google Scholar] [CrossRef]
  40. Lu, J.; Hung, K.; Wang, L.; Schuett, M.A.; Hu, L. Do perceptions of time affect outbound-travel motivations and intention? An investigation among Chinese seniors. Tour. Manag. 2016, 53, 1–12. [Google Scholar] [CrossRef]
  41. Petrick, J.F. Segmenting cruise passengers with price sensitivity. Tour. Manag. 2005, 26, 753–762. [Google Scholar] [CrossRef]
  42. Ng, S.I.; Lee, J.A.; Soutar, G.N. Tourists’ intention to visit a country: The impact of cultural distance. Tour. Manag. 2007, 28, 1497–1506. [Google Scholar] [CrossRef]
  43. Wu, H.-C.; Cheng, C.-C.; Ai, C.-H. A study of experiential quality, experiential value, trust, corporate reputation, experiential satisfaction and behavioral intentions for cruise tourists: The case of Hong Kong. Tour. Manag. 2018, 66, 200–220. [Google Scholar] [CrossRef]
  44. Le, T.H.; Arcodia, C. Risk perceptions on cruise ships among young people: Concepts, approaches and directions. Int. J. Hosp. Manag. 2018, 69, 102–112. [Google Scholar] [CrossRef]
  45. Crawford, D.W.; Godbey, G. Reconceptualizing barriers to family leisure. Leis. Sci. 1987, 9, 119–127. [Google Scholar] [CrossRef]
  46. Di Vaio, A.; Varriale, L.; Alvino, F. Key performance indicators for developing environmentally sustainable and energy efficient ports: Evidence from Italy. Energy Policy 2018, 122, 229–240. [Google Scholar] [CrossRef]
  47. Cheung, W.; Bauer, T.; Deng, J. The growth of Chinese tourism to Antarctica: A profile of their connectedness to nature, motivations, and perceptions. Polar J. 2019, 9, 197–213. [Google Scholar] [CrossRef]
  48. Groulx, M.; Lemieux, C.; Dawson, J.; Stewart, E.; Yudina, O. Motivations to engage in last chance tourism in the Churchill Wildlife Management Area and Wapusk National Park: The role of place identity and nature relatedness. J. Sustain. Tour. 2016, 24, 1523–1540. [Google Scholar] [CrossRef]
  49. Palma, D.; Varnajot, A.; Dalen, K.; Basaran, I.K.; Brunette, C.; Bystrowska, M.; Korablina, A.D.; Nowicki, R.C.; Ronge, T.A. Cruising the marginal ice zone: Climate change and Arctic tourism. Polar Geogr. 2019, 42, 215–235. [Google Scholar] [CrossRef] [Green Version]
Figure 1. Specific distribution of the trip duration of polar cruise lines.
Jmse 10 00156 g001
Table 1. List of departure ports.
AreaDeparture PortFrequencyShore of Total (%)
Arctic routesLongyearbyen (Norway)4774.6
Murmansk (Russia)711.11
Reykjavik (Iceland)57.94
Warnemunde (Berlin)34.76
Amsterdam (The Netherlands)11.59
Total63100
Antarctic routesUshuaia (Argentina)1881.82
San Antonio (Chile)14.55
Buenos Aires (Argentina)29.09
Los Angeles (USA)14.55
Total22100
Table 2. List of ports of calls (landing place) in the Arctic.
No.Port of Call (Destination)FrequencyShare of Total (%)
1Svalbard (Norway)5524.89
2Spitsbergen (Norway)2611.76
3Norway, Ny-Alesund (Norway)177.69
4Jan Mayen146.33
5Signehamna104.52
6Ísafjörður (Iceland)83.62
7Hornsund (Norway)73.17
8Franz Josef Land73.17
9Stykkishólmur62.71
10Scoresby Sound62.71
11Ilulissat (Greenland)62.71
12Reykjavik (Iceland)62.71
13Ittoqqortoormiit41.81
14Master Vig Port41.81
15Barentsburg41.81
16Disko (Greenland)31.36
17Kvalhovden (Norway)31.36
18Molde Port (Norway)31.36
19Longyearbyen (Norway)31.36
20Akureyri (Iceland)31.36
21Nuuk (Greenland)31.36
22Honningsvag port (Norway)31.36
23Qaqortoq (Greenland)31.36
24Malmo (Copenhagen)31.36
25Antarctica haven31.36
26Tromso (Norway)20.90
27Hellesylt (Norway)20.90
28Stavanger (Norway)20.90
29Cornwall (England)20.90
30Eidfjord Port10.45
31Bergen (Norway)10.45
32Kirkwall (England)10.45
Total221100
Table 3. List of ports of calls (landing place) in Antarctica.
No.Port of Call (Destination)FrequencyShare of Total (%)
1Antarctic Peninsula4754.02
2South Shetland Islands (Antarctica)1517.24
3Montevideo (Uruguay)44.60
4Falkland Islands44.60
5Punta Arenas (Chile)33.45
6Puerto Montt (Chile)22.30
7Cape Horn (Chile)22.30
8Cabo San Lucas (Mexico)11.15
9San Antonio (Chile)11.15
10Puntarenas (Costa Rica)11.15
11Chacabuco (Chile)11.15
12Manta (Ecuador)11.15
13Punta Arenas (Chile)11.15
14Callao (Peru)11.15
15Pisco (Peru)11.15
16Ushuaia (Argentina)11.15
17Puerto Madryn (Argentina)11.15
Total87100
Table 4. List of polar cruise ships in the Chinese market.
RankShip NameFrequencyShare of Total (%)
1Oceanwide Expeditions Hondius2428.24
2Hurtigruten Fram1821.18
3Albatros Expeditions Ocean Atlantis78.24
4Quark Expeditions World Explorer78.24
5Quark Expeditions Fifty Years of Victory55.88
6G Adventuresm G Expedition55.88
7Poseidon Expeditions Sea Spirit44.71
8Hurtigruten ms Fridtj of Nansen44.71
9Princess Cruises Coral Princess33.53
10MSC Poesia33.53
11MSC Preziosa22.35
12Holland America Cruises Westerdam11.18
13Holland America Cruises ms Veendam11.18
14Poseidon Expeditions Fifty Years of Victory11.18
Total85100
Table 5. List of departure cities.
Departure CityFrequencyShare of Total (%)
Beijing6236.90
Shanghai6538.69
Hong Kong3319.64
Shenzhen21.19
Guangzhou63.57
Total168100
Publisher’s Note: MDPI stays neutral with regard to jurisdictional claims in published maps and institutional affiliations.

