Article

Prediction of the Influence of Runner Tip Clearance on the Performance of Tubular Turbine

1
College of Water Resources and Civil Engineering, China Agricultural University, Beijing 100083, China
2
State Key Laboratory of Hydro-Power Equipment, Harbin 150046, China
3
Harbin Electric Machinery Company Limited, Harbin 150046, China
4
Harbin Institute of Large Electric Machinery, Harbin 150046, China
5
Power Generation Co., Ltd. of China Southern Power Grid, Guangzhou 510445, China
6
College of Engineering, China Agricultural University, Beijing 100083, China
7
Beijing Engineering Research Center of Safety and Energy Saving Technology for Water Supply Network System, China Agricultural University, Beijing 100083, China
*
Author to whom correspondence should be addressed.
J. Mar. Sci. Eng. 2022, 10(2), 136; https://doi.org/10.3390/jmse10020136
Submission received: 23 December 2021 / Revised: 14 January 2022 / Accepted: 17 January 2022 / Published: 20 January 2022
(This article belongs to the Special Issue Experiments and Numerical Analysis of Flow)

Abstract

:
Tubular turbine is a type of turbine with low-head. Due to the fact that the runner of a tubular turbine is of axial-flow type, there will be a certain width of blade tip between the blade and the chamber. In order to explore the influence of tip clearance width on the flow inside the turbine, taking the model tubular turbine as the research object, six different tip clearance widths were compared and analyzed. The research shows that the increase in blade tip clearance width affects the performance of the turbine, reduces the minimum pressure at blade tip and causes cavitation in advance. Larger tip clearance width significantly increases pressure pulsation intensity inside the turbine, especially in the vaneless region between the runner and guide vane and the area of the runner tip. However, the increase in tip clearance width can greatly reduce the axial force for about 100 N and radial excitation force for about 50% of rotating parts. Therefore, during the design and processing of tubular turbines, the blade tip clearance width should be carefully selected to ensure safe and stable operation of the unit.

1. Introduction

Tubular turbines are used for low-head hydropower stations. It has a large size and suits large flow rate and low rotational speeds [1,2,3]. Therefore, the tubular turbine is currently adopted as the turbine type for marine energy utilization. Due to the fact that bladed turbomachinery is reversible, the tubular turbine can operate in different modes. It can generate electricity at rising and falling tides in turbine modes. The pump modes are also feasible for energy storage. The highest efficiency condition is the turbine mode when a reservoir’s water level is higher than seawater levels. Water flows through upstream passage, guide vane, runner and downstream passage. High efficiency and good stability are required [4,5,6].
The runner of a tubular turbine is of the axial-flow type, and the runner blade is in cantilever form. Therefore, there are always two problems. One is stress and structural strength of runner blade: When the tubular turbine is operating, the runner blade suffers alternate forces. It will cause s variation in stress on the blade and may cause fatigue failure [7,8,9,10]. With the development of the finite element method, numerical simulation analysis has gradually replaced experiments and has become the main means for studying the dynamic stress of turbo machinery. In recent years, researchers have not performed much research on the dynamic stress analysis of blades of tubular turbine, but have conducted research on similar cantilever blade rotating machinery [11,12,13,14]. Pan et al. [15] conducted numerical simulation calculation and analysis on the operation of the blades of axial flow pumps under different rotating speed conditions and found that the cantilever blade root is prone to fracture, and the deformation of the blade tip is large and can easily occur, which is not conducive to the safe and stable operations of the unit. Another problem includes unstable tip leakage flow. The tip clearance width between the runner blade and runner chamber is small. There will be high speed vortical tip leakage flow. It will cause cavitation due to local low pressure. It will also cause flow field pulsation and induce the pulsation of turbine performance [16]. For the flow loss and flow field state caused by a tip leakage vortex, early research mainly focused on the hydrofoil. Due to spatial limitations of clearance flow fields, hydrofoils are simplified models of the blade. The study of hydrofoil tip clearance flow field can provide a theoretical basis for the design of turbo machinery blade tip clearance [17,18,19,20]. Dreyer and Decaix et al. [21,22] analyzed the tip leakage vortex (TLV) structure and strength of hydrofoil flow field with different tip clearance widths by using an experimental method and numerical simulation, respectively. The research shows that the larger the leakage vortex strength, the lower the vortex center pressure, and the tip leakage vortex has an obvious impact on the surrounding flow field structure. Therefore, the tip clearance width corresponding to the maximum vortex strength of hydrofoil tip flow field is obtained. It provides a reference for the design of blade tip clearance width of the unit. According to the relevant research results of hydrofoil, researchers have conducted in-depth research on blade-tip clearance and tip leakage vortex (TLV) of a tubular turbine unit [23,24,25]. It was found that tip clearance flow field is affected by many factors [26,27,28], such as blade geometry, internal flow characteristics, operating conditions and so on. Similarly, because the tip clearance position is special and the space is narrow, it is very difficult to test. Therefore, the application of numerical simulation technology in the study of tip leakage vortex (TLV) can effectively make up for the difficulties and shortcomings of the experiment. Li et al. [29] analyzed the physical characteristics of the leakage flow of the tip clearance of the tubular turbine by means of numerical simulation. The results show that the tip clearance width is directly proportional to the axial velocity, momentum and flow of the tip leakage vortex and inversely proportional to turbulent flow energy. Therefore, the blade-tip clearance of the tubular turbine should be reduced as much as possible in order to reduce the strength of the leakage vortex.
Due to the difficulties in manufacturing and installation, the runner-tip clearance width of tubular turbine is very crucial [30,31,32,33,34,35]. Starting from conventional thinking, a relatively small gap is conducive for reducing loss and improving efficiency. However, it causes local low pressure, which is undesirable for anti-cavitation. It will also increase the risk of collisions between the runner and chamber if installation eccentricity is high. On the contrary, a relatively large tip clearance can cause a drop in efficiency and power. This is because the blade working area is smaller. Flow can become out of control, which is a potential risk in inducing strongly pulsating flows.
Currently, research mainly focuses on the mechanism of tip leakage vortex, and its applications in engineering and the impact of practical engineering have not been clearly explained. In order to have produce improved operation performance, stability and security of the tubular turbine in the turbine mode, it is necessary to evaluate the influence of runner tip leakage widths. In this study, the influence of different blade tip clearance widths on the internal flow of tubular turbine is analyzed in detail. In order to reduce financial costs, computational fluid dynamics (CFD) can be used in evaluating runner torque, flow rate, forces on runner and the surrounding turbulent flow field. This study is based on both CFD simulations and model experiments, and the influence of the runner tip leakage width in the high efficiency turbine mode is in-depth discussed; the visualization of internal flow characteristics of a tubular turbine is realized, which has a clear guiding significance for engineering.

2. Research Object

This study takes a model turbine of tubular turbine as the research object and analyzes the influence of different blade tip clearance widths (hTC) on internal flow characteristics of the turbine. Figure 1 is the flow passage of tubular turbine studied in this paper. Figure 1a,b, respectively, show the three-dimensional flow passage and radial flow passage of the turbine. Coordinate Z represents the axial direction, and coordinate R represents the radial direction. Water enters the flow passage through the inlet and flows through two parts, guide vane (number of blades is 16) and runner (number of blades is 4), and finally flows out of the outlet flow passage. Figure 1c shows the tip clearance position between the runner and the chamber concerned in this study.
The main parameters of the tubular turbine are shown in Table 1, including rated rotation speed nr, rated head Hr, rated power Pr and rated efficiency hr, where the specific speed ns is a dimensionless number, and the expression is described as follows.
n s = n r P r H r 5 / 4
Unit flow rate q11 and unit rotation speed n11 are introduced to ensure the accuracy of the model turbine. The expressions are respectively expressed as follows:
q 11 = Q r D 2 H r
n 11 = n r D H r
where nr represents the design rotation speed, r/min, Pr represents the design shaft power, kW, Hr represents the design head, m, and D represents the runner diameter of the turbine, m.

3. Computational Domain Discretization and CFD Settings

In this study, the ANSYS platform commonly used in the numerical simulation of hydraulic machinery in fluid engineering is used to carry out the numerical simulation.

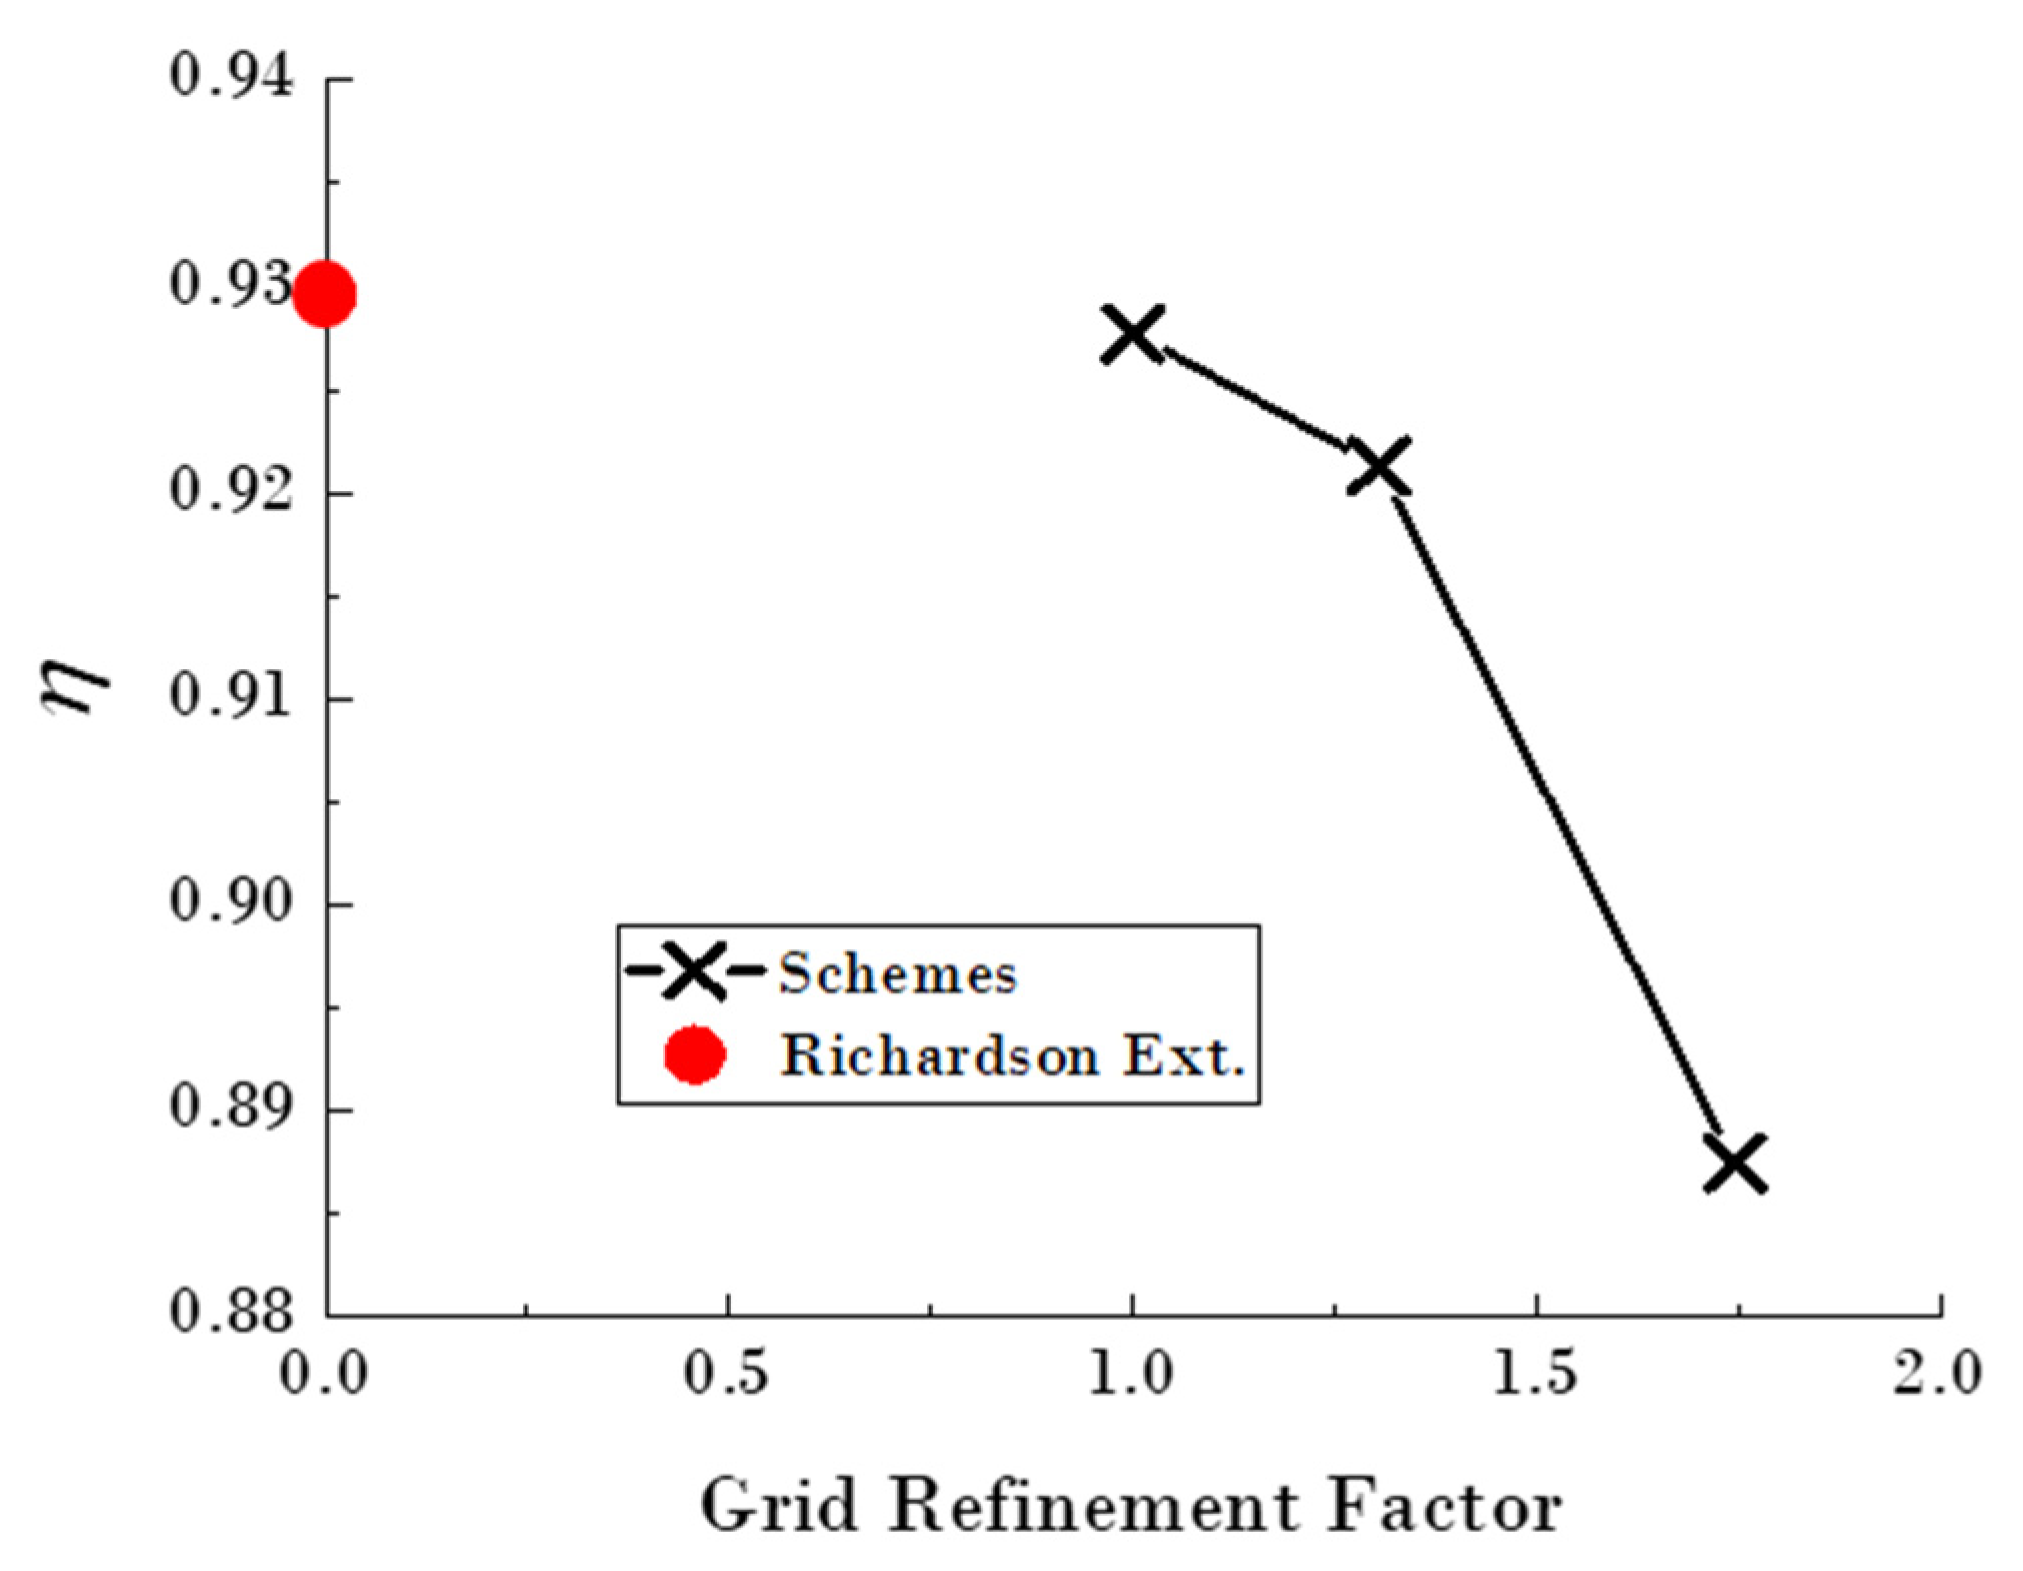
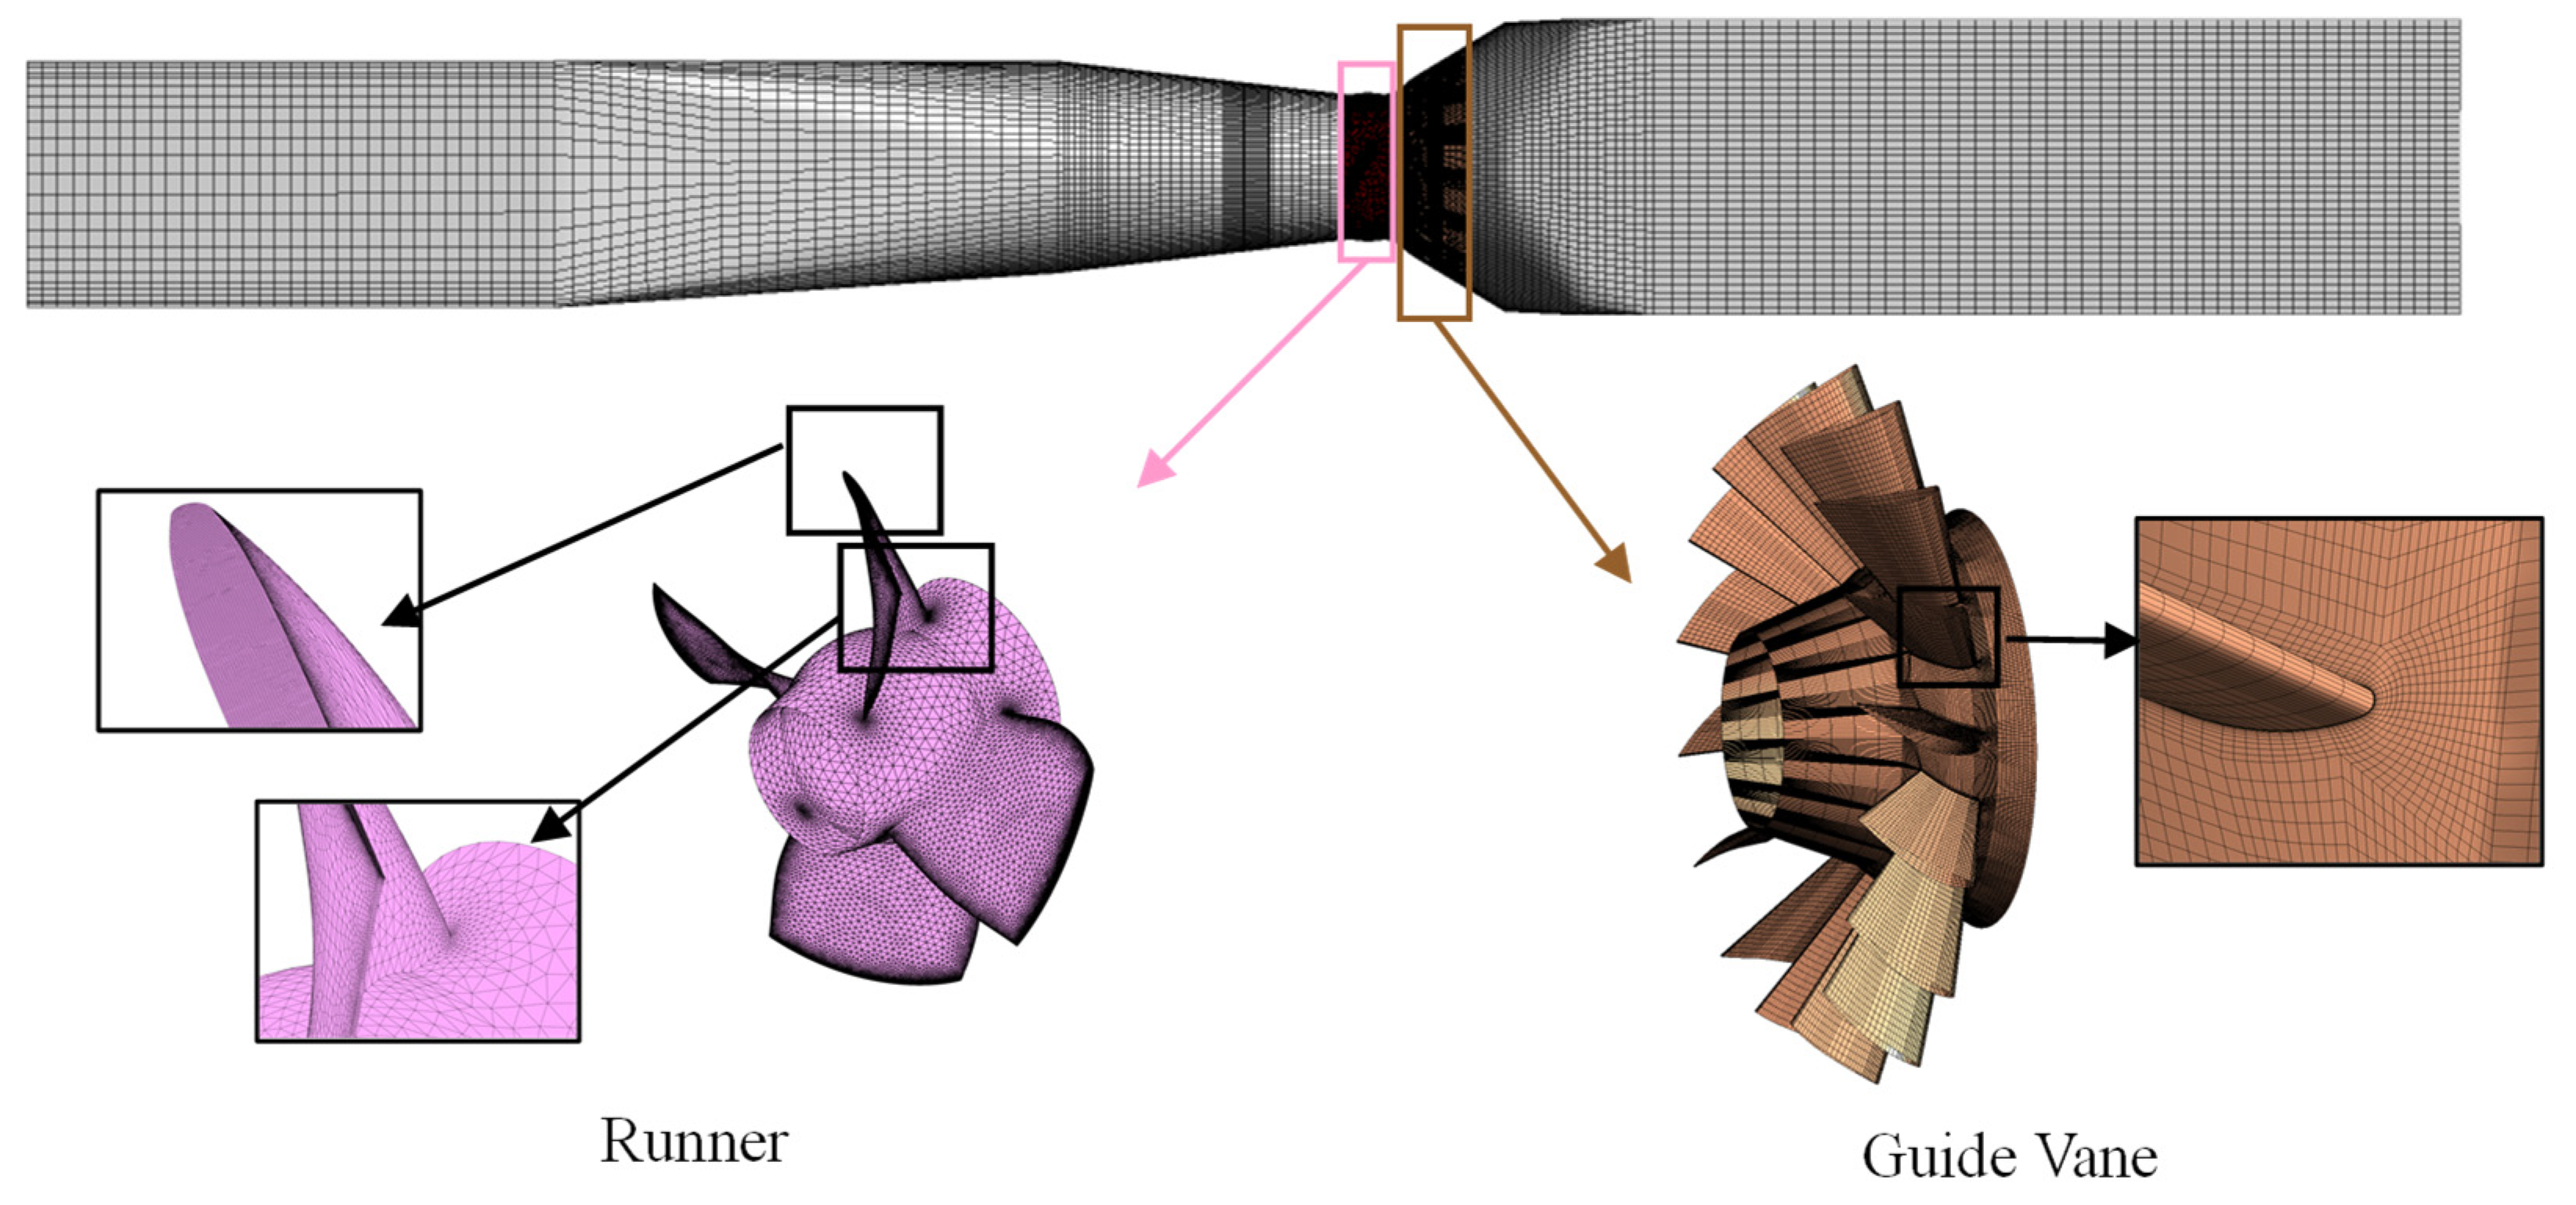
3.1. Grid Division and Validation

Before numerical simulation, firstly, the fluid domain of turbine is discretized. A hexahedral structure grid is adopted in the inlet section, guide vane section and outlet section. Due to the need to consider the clearance at the blade tip of the runner, the fluid domain is much more complex; thus, a tetrahedral unstructured grid is used to mesh the runner. Local densification shall be carried out at a location with small area and large curvature, and densification shall be set for the blade-tip clearance of the blade.
Due to the fact that the number and quality of grids are important reasons affecting the solution time and accuracy of CFD simulation, too many grids will consume too many computing resources and too few grids cannot meet the requirements of solution accuracy. Therefore, the grid convergence index (GCI) method [36,37] recommended by the American Society of Mechanical Engineers (ASME) was used to analyze grid convergence. Three different grid schemes of coarse, medium and fine are obtained by using different encryption strategies. The number of grid nodes is shown in Table 2. The efficiency η of turbine under rated working condition is selected as the key variable for error evaluation, and the safety factor is Fs = 1.33. Finally, GCI values between coarse grid and medium grid and between medium grid and fine grid are obtained (see Table 2 for specific results). Figure 2 shows efficiency η value predicted by the three grid schemes and the η value obtained by Richardson extrapolation in which the grid refinement factor of fine grid is set as 1.0. Combined with the results in Figure 2 and Table 2, it can be observed that the above grid schemes can meet the convergence requirements in internal flow analysis and calculation of the tubular turbine. Therefore, in order to better simulate the internal flow of tubular turbines, the medium grid scheme with 3,740,402 grid nodes is selected. The specific grid division results are shown in Figure 3.

3.2. Setup of Numerical Simulation

For both steady and unsteady numerical simulation settings, the Shear Stress Transfer (SST) k-ω model was used as the turbulence model. The fluid material is set as water at 25 °C, and the reference pressure is set to 1 atm. For boundary conditions, the settings are as follows: The inlet of the calculation domain is set as total pressure, the outlet is set as static pressure and the pressure is set as 0 Pa. All solid wall boundaries are set as non-slip walls. The calculation domains are connected by an interface, a multi-reference frame model (MRF) is adopted and the dynamic–static interface is set between rotating parts and fixed parts. In steady calculation, the maximum iteration steps are set to 2000, and the convergence residual is set to 10−5 to ensure the accuracy of the steady calculation results.
In the unsteady calculation setting, a total of 20 rotation periods were simulated, each rotation period is set to 360 timesteps, the maximum iteration number of each time step is set to 20 and the convergence residual is also set to 10−5.

3.3. Experimental-Numerical Verification

The CFD numerical simulation results of tubular turbine under rated working condition are compared with the experimental results, which is a model test on a hydraulic test rig shown in Figure 4a. The photo of the experiment is shown in Figure 4b, which mainly shows the pipeline part of the test rig. The comprehensive efficiency test accuracy of the model test carried out on the test-rig is ±0.25%. Table 3 lists the name and accuracy of the experimental equipment.
The head, flowrate, torque and efficiency are four main parameters of the tested turbine. Head H is measured by pressure difference sensors installed at the inlet and outlet of turbine. Flowrate Q is measured based on the electromagnetic flowmeter. Torque M is measured by torque meter for calculating shaft power P by P = M·rω where rω is the rotational angular speed. Efficiency η can be calculated by η = P/ρgQH. For a better comparison, experimental results ΦE are recognized by 1.0. Numerical simulation results ΦN are the ratio between them and the experimental results RNE, which can be expressed as RNE = ΦN/ΦE.
The comparison results are shown in Table 4. It can be observed from the table that the relative error between the results obtained by the grid division scheme and numerical simulation setting scheme adopted in this study and the experiment is small. Simulation accuracy can meet the engineering requirements, which provides a reliable calculation scheme for subsequent analysis.

4. Influence of Different Tip Clearance Widths (hTC) on Internal Flow

4.1. Influence of Different Tip Clearance Widths (hTC) on Turbine Performance

In view of the influence of hTC of the runner blade on the performance of tubular turbine, numerical simulation calculation and analysis are carried out four hTC of 0 mm, 0.2 mm, 0.4 mm, 0.6 mm, 0.8 mm and 1.0 mm, respectively. The performance results of turbines corresponding to each clearance condition are shown in Figure 5.
It can be observed from the figure that hTC of runner blade has a prominent impact on the external characteristics of a tubular turbine unit. Under the rated working condition, with the gradual increase in hTC, the shaft power and efficiency of tubular turbine decrease first and then increase. When hTC reaches 0.8 mm, the shaft power and efficiency of the unit reach the lowest value. However, with a further decrease in hTC, when hTC reaches 1.0 mm, shaft power and efficiency increase significantly, which shows that under rated working conditions, hTC greatly affects the flow field structure in the turbine, resulting in more complex flow. Therefore, it is necessary to further analyze the internal flow state of the turbine in order to understand the influence of tip clearance on the internal flow of the turbine.
Generally, the blade tip clearance of tubular units may reduce the efficiency by about 0.5% [34,35]. It can be observed from Figure 5 that in the process of hTC changing from 0 mm to 1.0 mm, the lowest efficiency occurs at hTC = 0.8 mm. At this time, the efficiency of the turbine decreases by about 1% compared with the efficiency of the model test. Meanwhile, when hTC = 0 mm, the efficiency of the turbine increases significantly compared with the model test with tip clearance because flow loss caused by clearance leakage vortex (TLV) is not considered. It can be observed that in the CFD numerical simulation, for the tubular unit, the existence of tip clearance needs to be considered in calculating the performance to ensure the accuracy of prediction.

4.2. Influence of Different Tip Clearance Widths(hTC) on Flow Pattern

In order to further explore the characteristics of hTC flow field of tubular turbine, the above six conditions of hTC are analyzed, and the effects of different hTC on the internal flow of tubular turbine and the flow field in runner are compared.

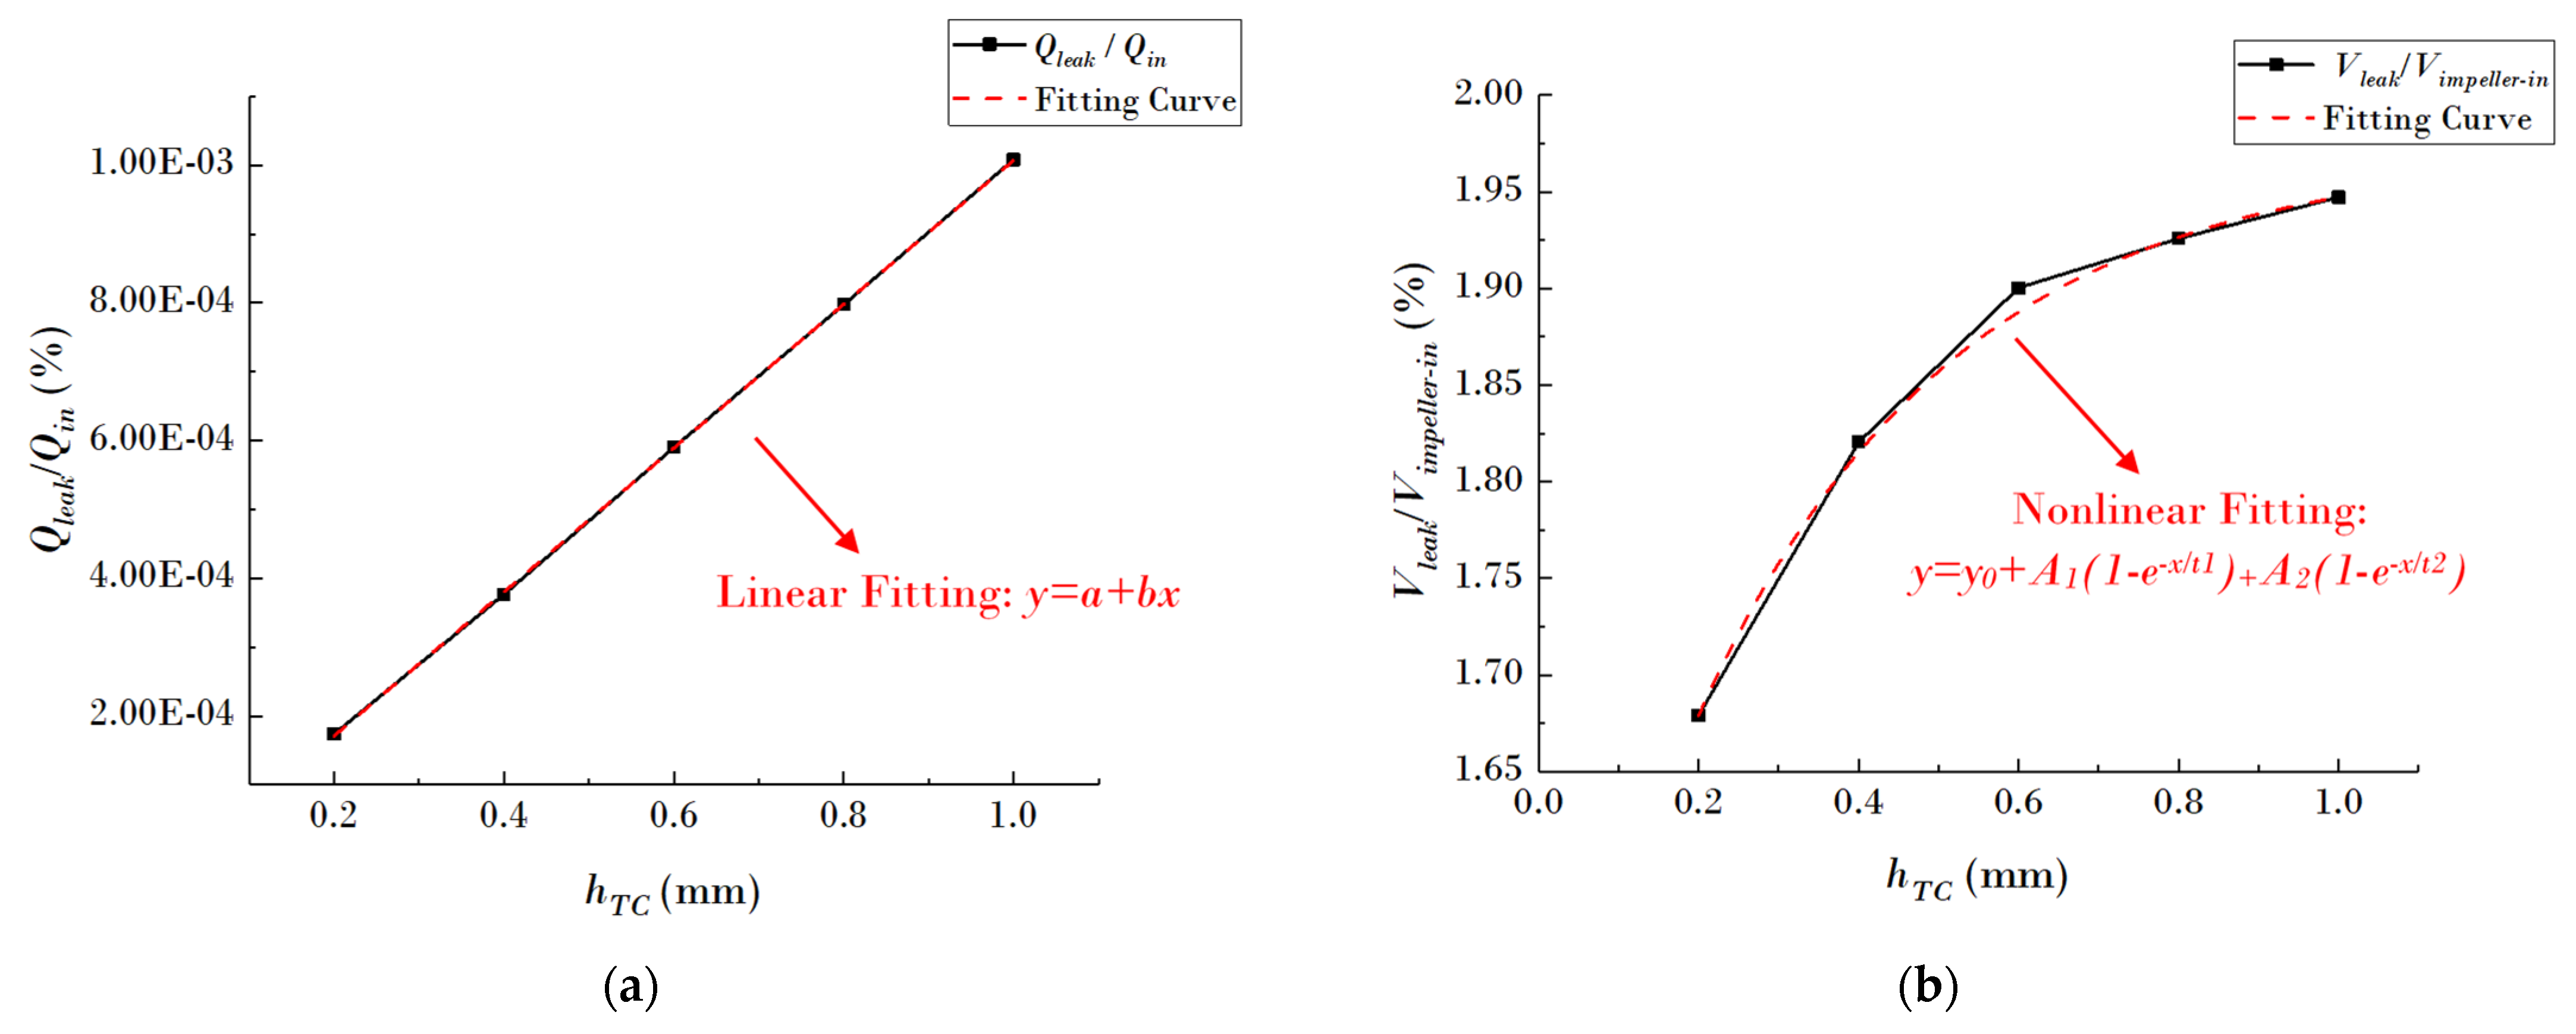
4.2.1. Analysis of Leakage Flowrate and Average Leakage Velocity Caused by Tip Clearance

In order to analyze the influence of different hTC on runner leakage flowrate Qleak and average leakage velocity Vleak, the ratio of the leakage flowrate Qleak corresponding to different hTC to the total inlet flowrate Qin under various hTC conditions and the ratio of the average leakage velocity Vleak to the average velocity Vin-runner at the inlet of the turbine runner are used as dimensionless treatment, as shown in Figure 6. The selection method of flow passage section in the tip clearance is the closed section formed by the chord line of blade tip airfoil profile and its projection line on the inner wall of chamber, as shown in Figure 7.
With the gradual increase in hTC, dimensionless number Qleak/Qin increases linearly. The functional relationship between hTC and clearance leakage flowrate can be obtained by fitting the curve. Similarly, the dimensionless number Vleak/Vin-runner and hTC also show a continuous rise. Compared with the leakage flowrate, the rising condition is more complex and nonlinear. The functional relationship between hTC and the average leakage velocity can also be obtained by curve fitting. The relationship between the two groups of functions is shown in the Table 5 below.

4.2.2. Comparison of Leakage Vortex Morphology

In order to compare and analyze the pressure distribution of suction sides under different hTC conditions and compare the morphological changes of tip leakage vortex at each hTC, it is necessary to normalize pressure data and express the results with the pressure coefficient Cp, which can be expressed as follows:
C p = p ρ g H
where p represents the pressure at the suction side, Pa; ρ represents the density of the medium, m3/s; and H represents the water head under this working condition, m.
Due to similar flow field characteristics between blade passages, Figure 8 takes a single blade as an example and uses the contour surface of λ2 = − 1.714 × 10⁵ s−2 to show the vortex shape near the blade tip as well as the pressure coefficient distribution contour map on the suction side of the blade and the blade tip (there is no Cp distribution on the blade tip when hTC is 0 mm).
It can be observed from Figure 8 that when there is a clearance at the tip of the runner blade, there is an obvious tip leakage vortex on the suction side of the blade tip. When hTC is small (hTC = 0.2 mm), tip leakage vortex is relatively weak. Meanwhile, the tip leakage vortex at the tip of the blade suction side is divided into two parts, namely, the main vortex area generated from the tip of the leading edge of the blade leading-edge and the vortex area at the tip of the blade trailing edge. With the continuous increase in hTC, both vortices gradually strengthen and develop forward and backward, respectively. Finally, at the blade tip, when hTC reaches 0.8 mm, two vortices are connected into one, forming an entire tip leakage vortex shape. Similarly, for the pressure distribution on the suction side and tip of the blade, it can be observed that tip clearance has a weak impact on the pressure distribution on the suction side of the blade. During the process of hTC from 0 mm to 1.0 mm, the pressure distribution on the suction side of the blade maintains a similar distribution state; that is, there are obvious low-pressure areas in the second half of the blade tip and the middle part of the bottom of the blade.

4.2.3. Comparison of Streamline and Turbulent Kinetic Energy

In order to further analyze the influence of hTC on the tip leakage of tubular turbine, one circumferential section is intercepted at the chord length of turbine runner blade of 90% from the blade leading-edge, which is named Section 0.9, as shown in Figure 9. By using numerical simulation, the turbulent kinetic energy (k) distribution and streamline distribution of the section of tubular turbine under different hTC are obtained. With the help of the streamline on the circumferential section, the vortex motion state in the rotating plane can be reflected, as shown in Figure 10.
According to the research before, the existence of tip clearance will affect about 20% of the area in the flow channel. Moreover, the turbulent kinetic energy at the tip clearance will appear in an obvious high value area in the low-pressure area of the blade. It will increase significantly with the increase in the blade tip clearance width at the blade tip [18,35]. Combined with this study, it can be observed from the figure that, under the rated working condition, the leakage flow passes through the blade tip from the pressure side to the suction side of the blade under the action of the pressure difference between the pressure side (PS) to the suction side (SS) of the blade and forms a separation vortex structure at the blade tip on the suction side of the blade. On the Section 0.9, which is 90% away from the leading edge of the blade, due to the full development of turbulence, the intensity of turbulent kinetic energy (k) is significantly enhanced, and a large area of high turbulent kinetic energy (k) area appears at the chamber, which has a great impact on the mainstream in the runner passage. According to Figure 10, the influence of different hTC on the circumferential section of Section 0.9 is analyzed. It can be observed that with the continuous increase in hTC, the high turbulent kinetic energy (k) area increases significantly, mainly extending upstream of the blade suction side, forming a narrow and long high turbulent kinetic energy (k) zone, which is consistent with existing relevant research conclusions. Meanwhile, when hTC is small, the separation vortex structure in the passage at the suction side of the blade does not develop completely on the Section 0.9 section, and the streamline in this area does not show a more obvious vortex structure. However, with the increase in hTC, after hTC reaching 0.6 mm, the vortex structure near the suction side of the blade becomes clear, and the separation vortex develops completely. Therefore, the increase in hTC is conducive to the development of the tip separated vortex, and a larger hTC will significantly affect the mainstream flow in the runner. Generally, the enhancement of tip leakage vortex (TLV) mainly affects the flow state at the chamber, and its influence range on the overall flow is strongly related to the strength of tip leakage vortex (TLV).

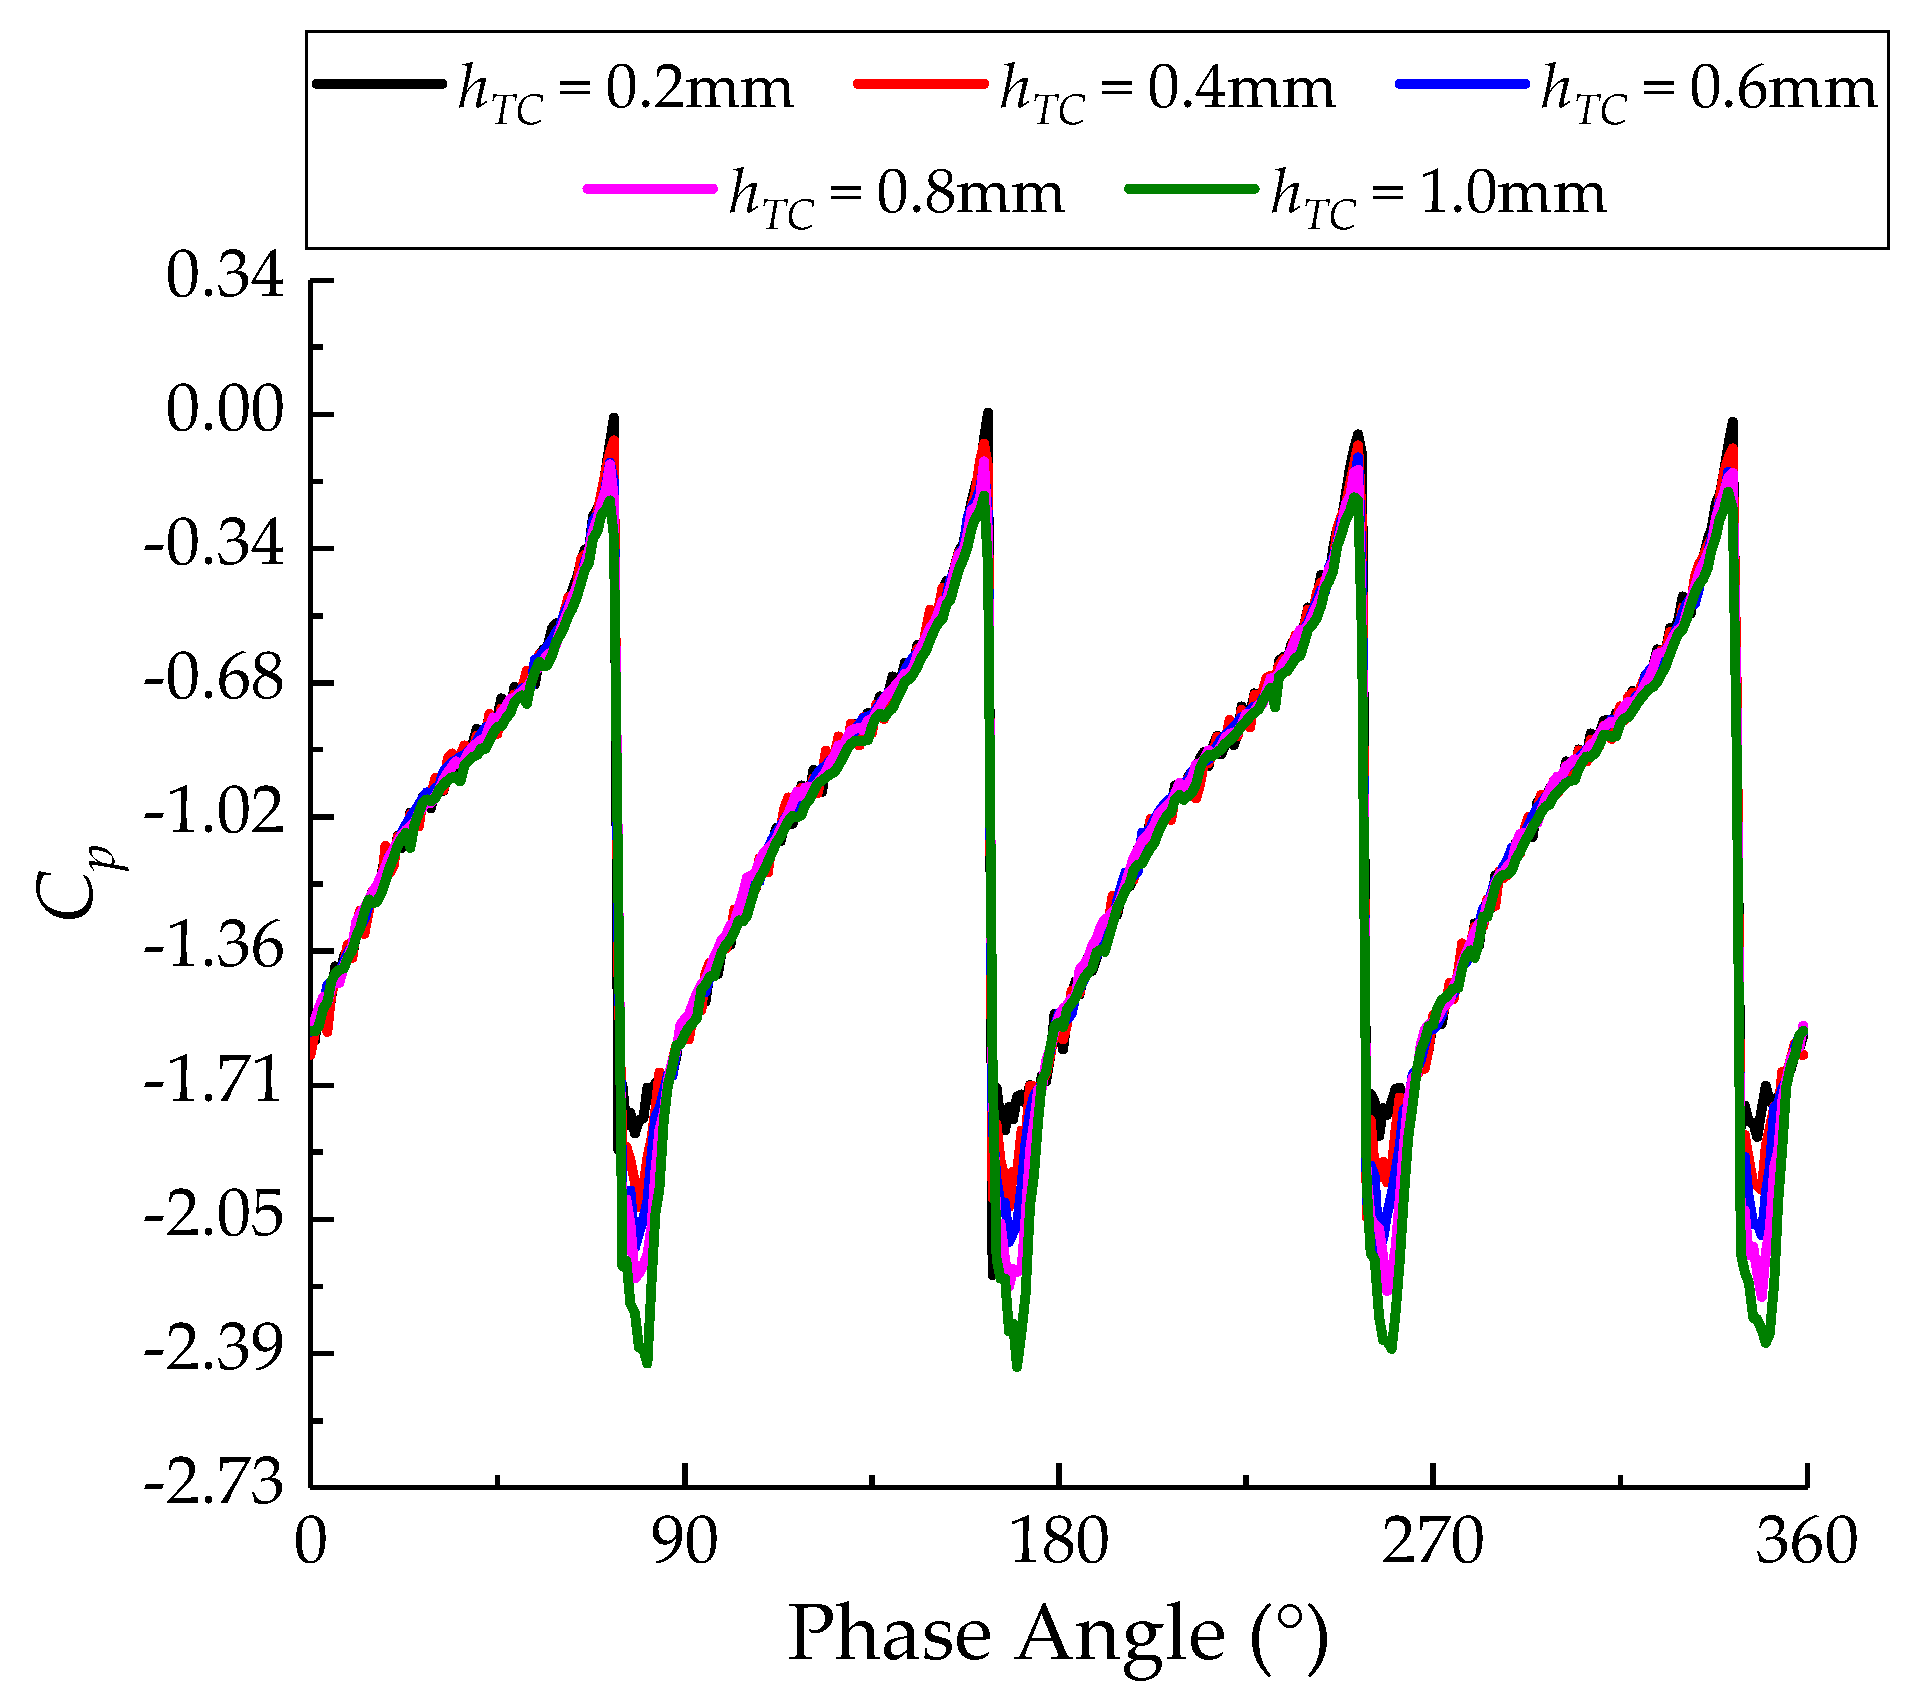
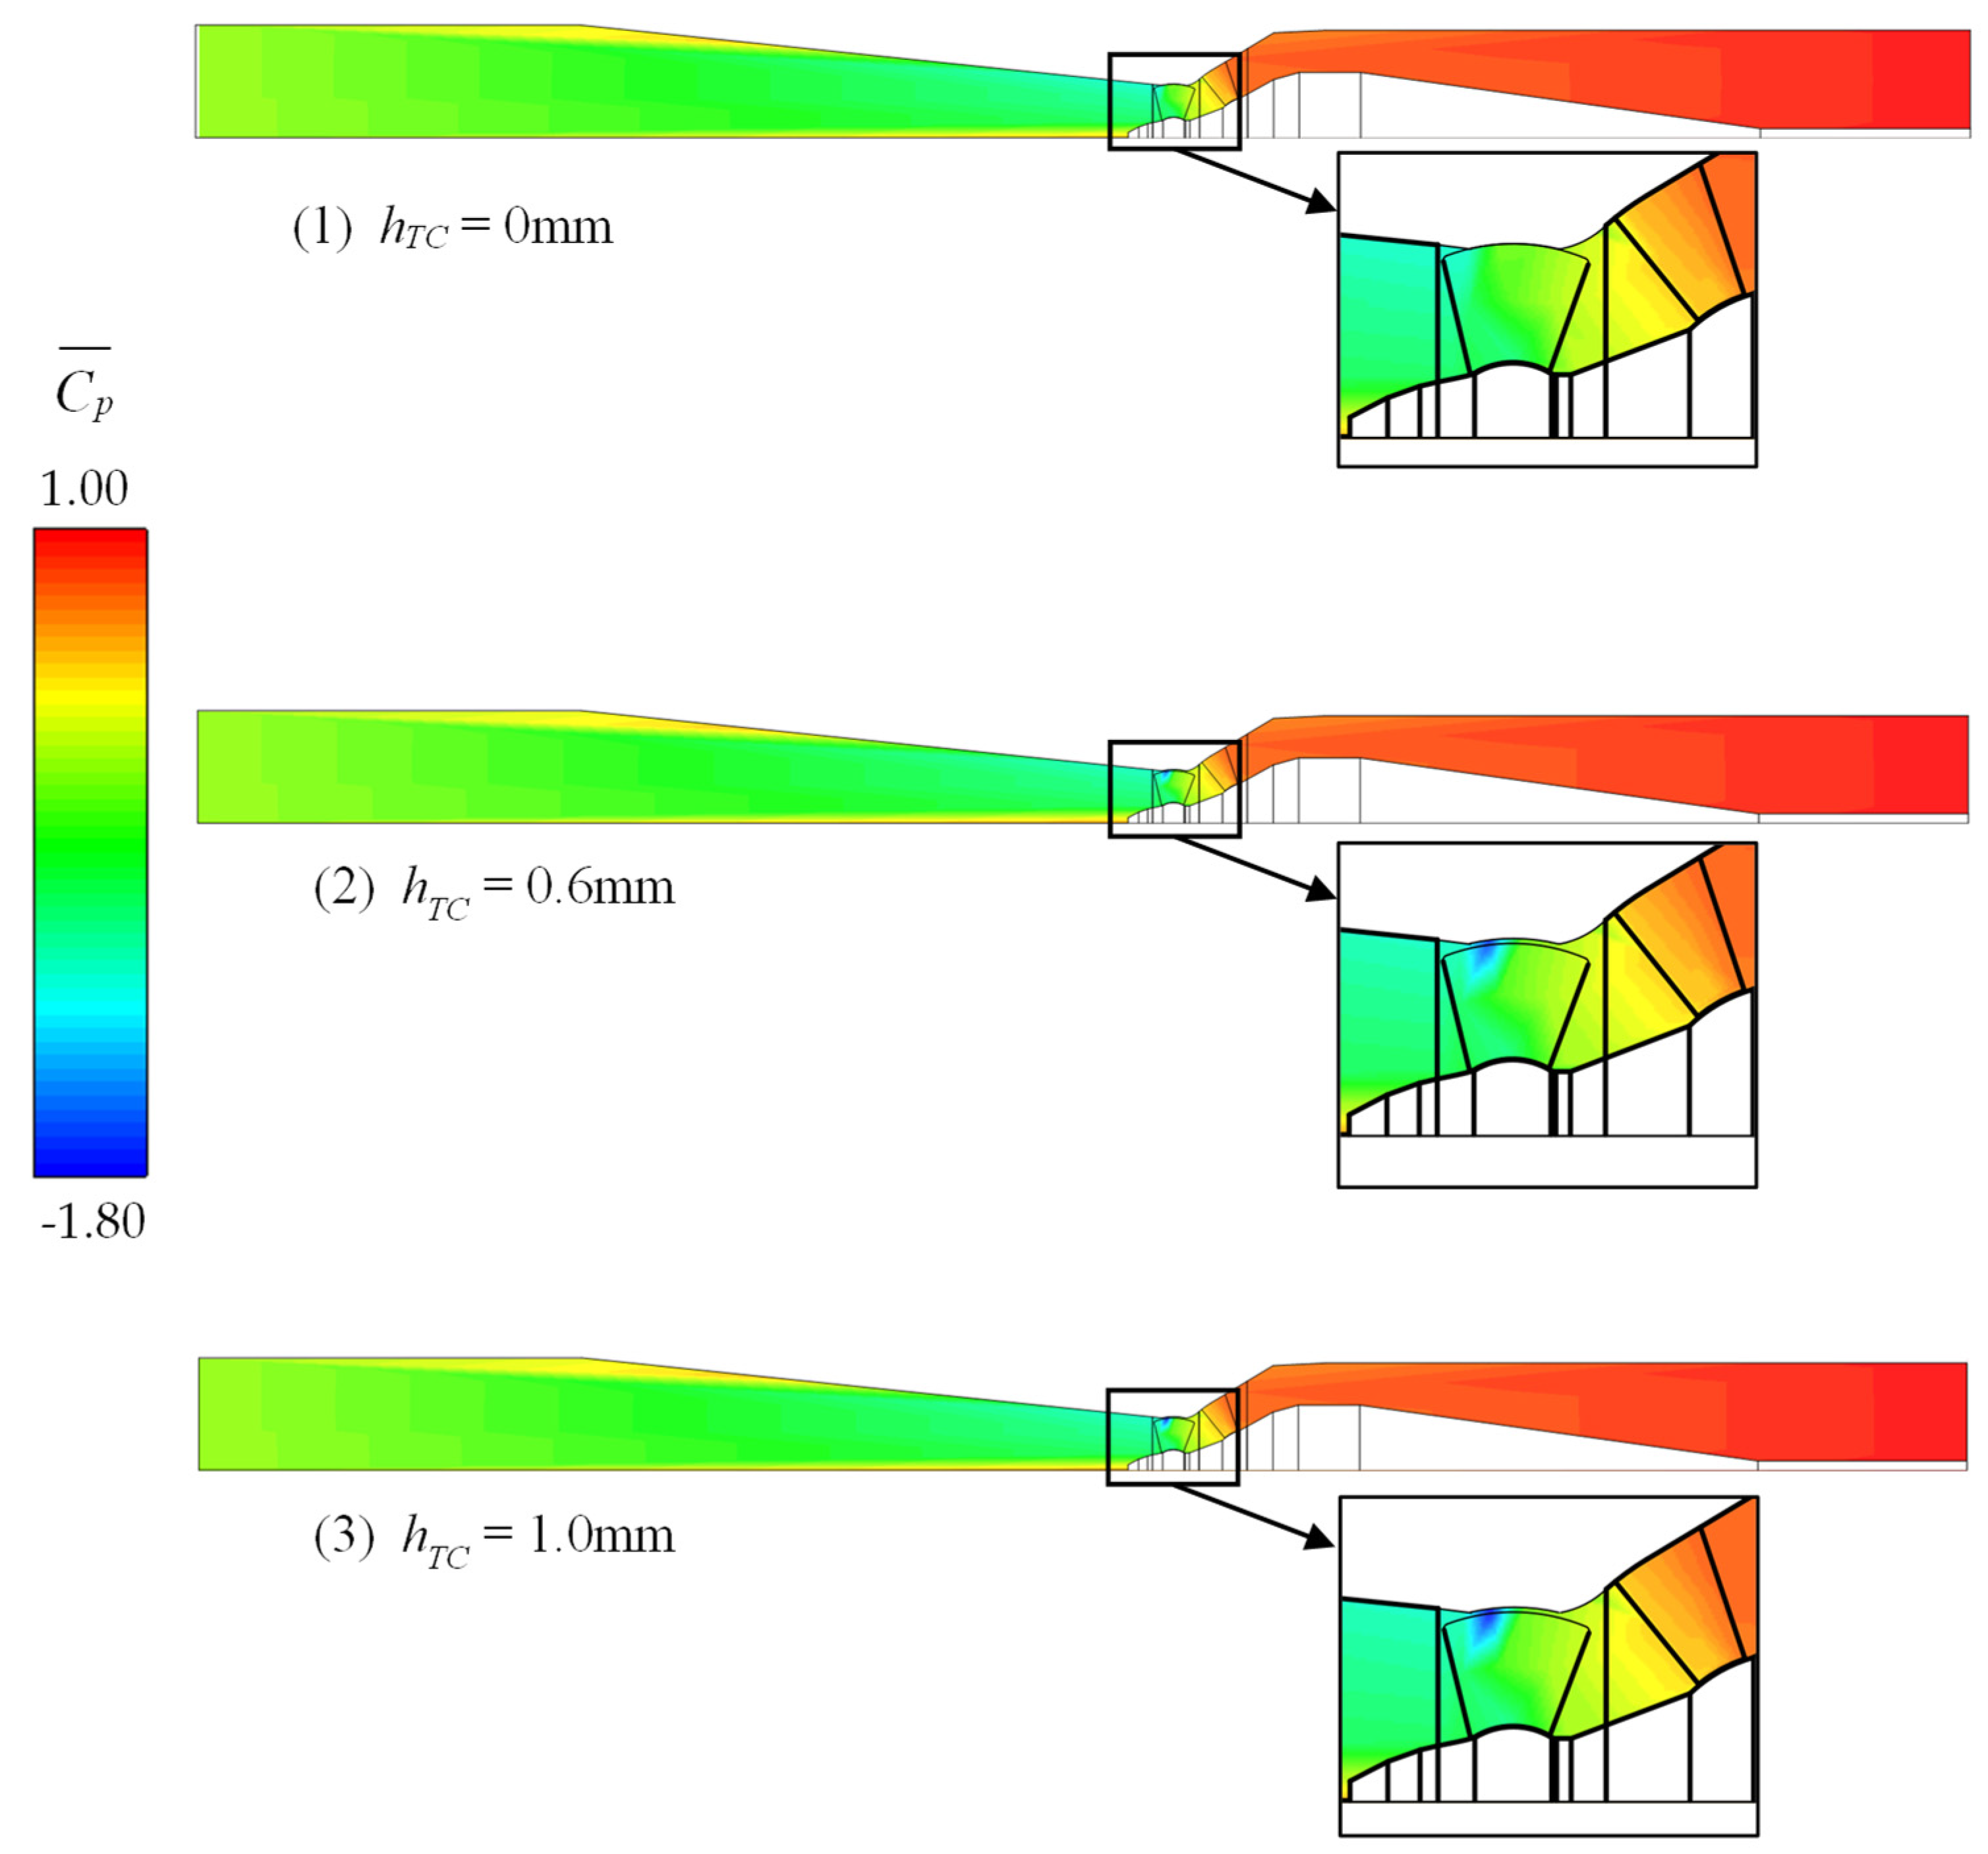
4.2.4. Comparison of the Pressure Distribution, Turbulent Kinetic Energy and Turbulence Eddy Frequency

In order to further quantify and analyze the flow field of tip clearance under different hTC, a monitoring line is intercepted at the chord length of turbine runner blade of 90% from the leading edge of blade for analysis, which corresponds to the location of Section 0.9 and named Monitoring Line 0.9. The location of the monitoring line varies slightly according to different hTC, which is mainly reflected in the fact that the monitoring line is arranged in the middle of the tip clearance, and the location of the monitoring line is shown in Figure 11. Monitoring Line 0.9 takes the positive X direction as the zero point and rotates one circle along the circumference according to the rotation direction of the runner.
1.
Circumferential pressure distribution
The circumferential pressure distribution of Monitoring Line 0.9 is obtained, as shown in Figure 12, which takes the positive X direction as the zero point and rotates one circle along the circumference according to the rotation direction of the runner. It can be observed from the figure that the circumferential pressure distribution of the four blade chambers with different hTC is basically the same. In one rotation of the runner, the circumferential pressure of the monitoring line shows four obvious periods corresponding to the number of runner blades. The pressure starts to rise gradually in the flow channel at the suction side of the blade and reaches the highest when entering the blade tip clearance. After leaving the tip clearance, the pressure rapidly decreases to the lowest point of the period, and then starts a new round of rise so as to go back and forth.
The main influence of different hTC on circumferential pressure distribution of the chamber is shown in the lowest circumferential pressure at Monitoring Line 0.9, which is mainly shown as that with the continuous increase in hTC. The minimum axial pressure at Monitoring Line 0.9 (i.e., blade tip) decreased significantly. When hTC increased from 0 mm to 1.0 mm, the minimum circumferential pressure Cpmin decreased from −2 to about −2.4, greatly increasing the risk of tip vortex cavitation.
2.
Distribution of Circumferential Turbulent Kinetic Energy
The circumferential turbulent kinetic energy (k) distribution on Monitoring Line 0.9 is obtained, as shown in Figure 13, which takes the positive X direction as the zero point and rotates one circle along the circumference according to the rotation direction of the runner. The overall form of turbulent kinetic energy (k) at the chamber is much simpler than that of pressure. It only rises significantly at the blade tip clearance, and then decreases to about 0.3 m2/s2 after leaving the gap. Similarly, for different hTC, it can be observed that the size of hTC has little effect on the peak value of turbulent kinetic energy (k) at blade tip.
3.
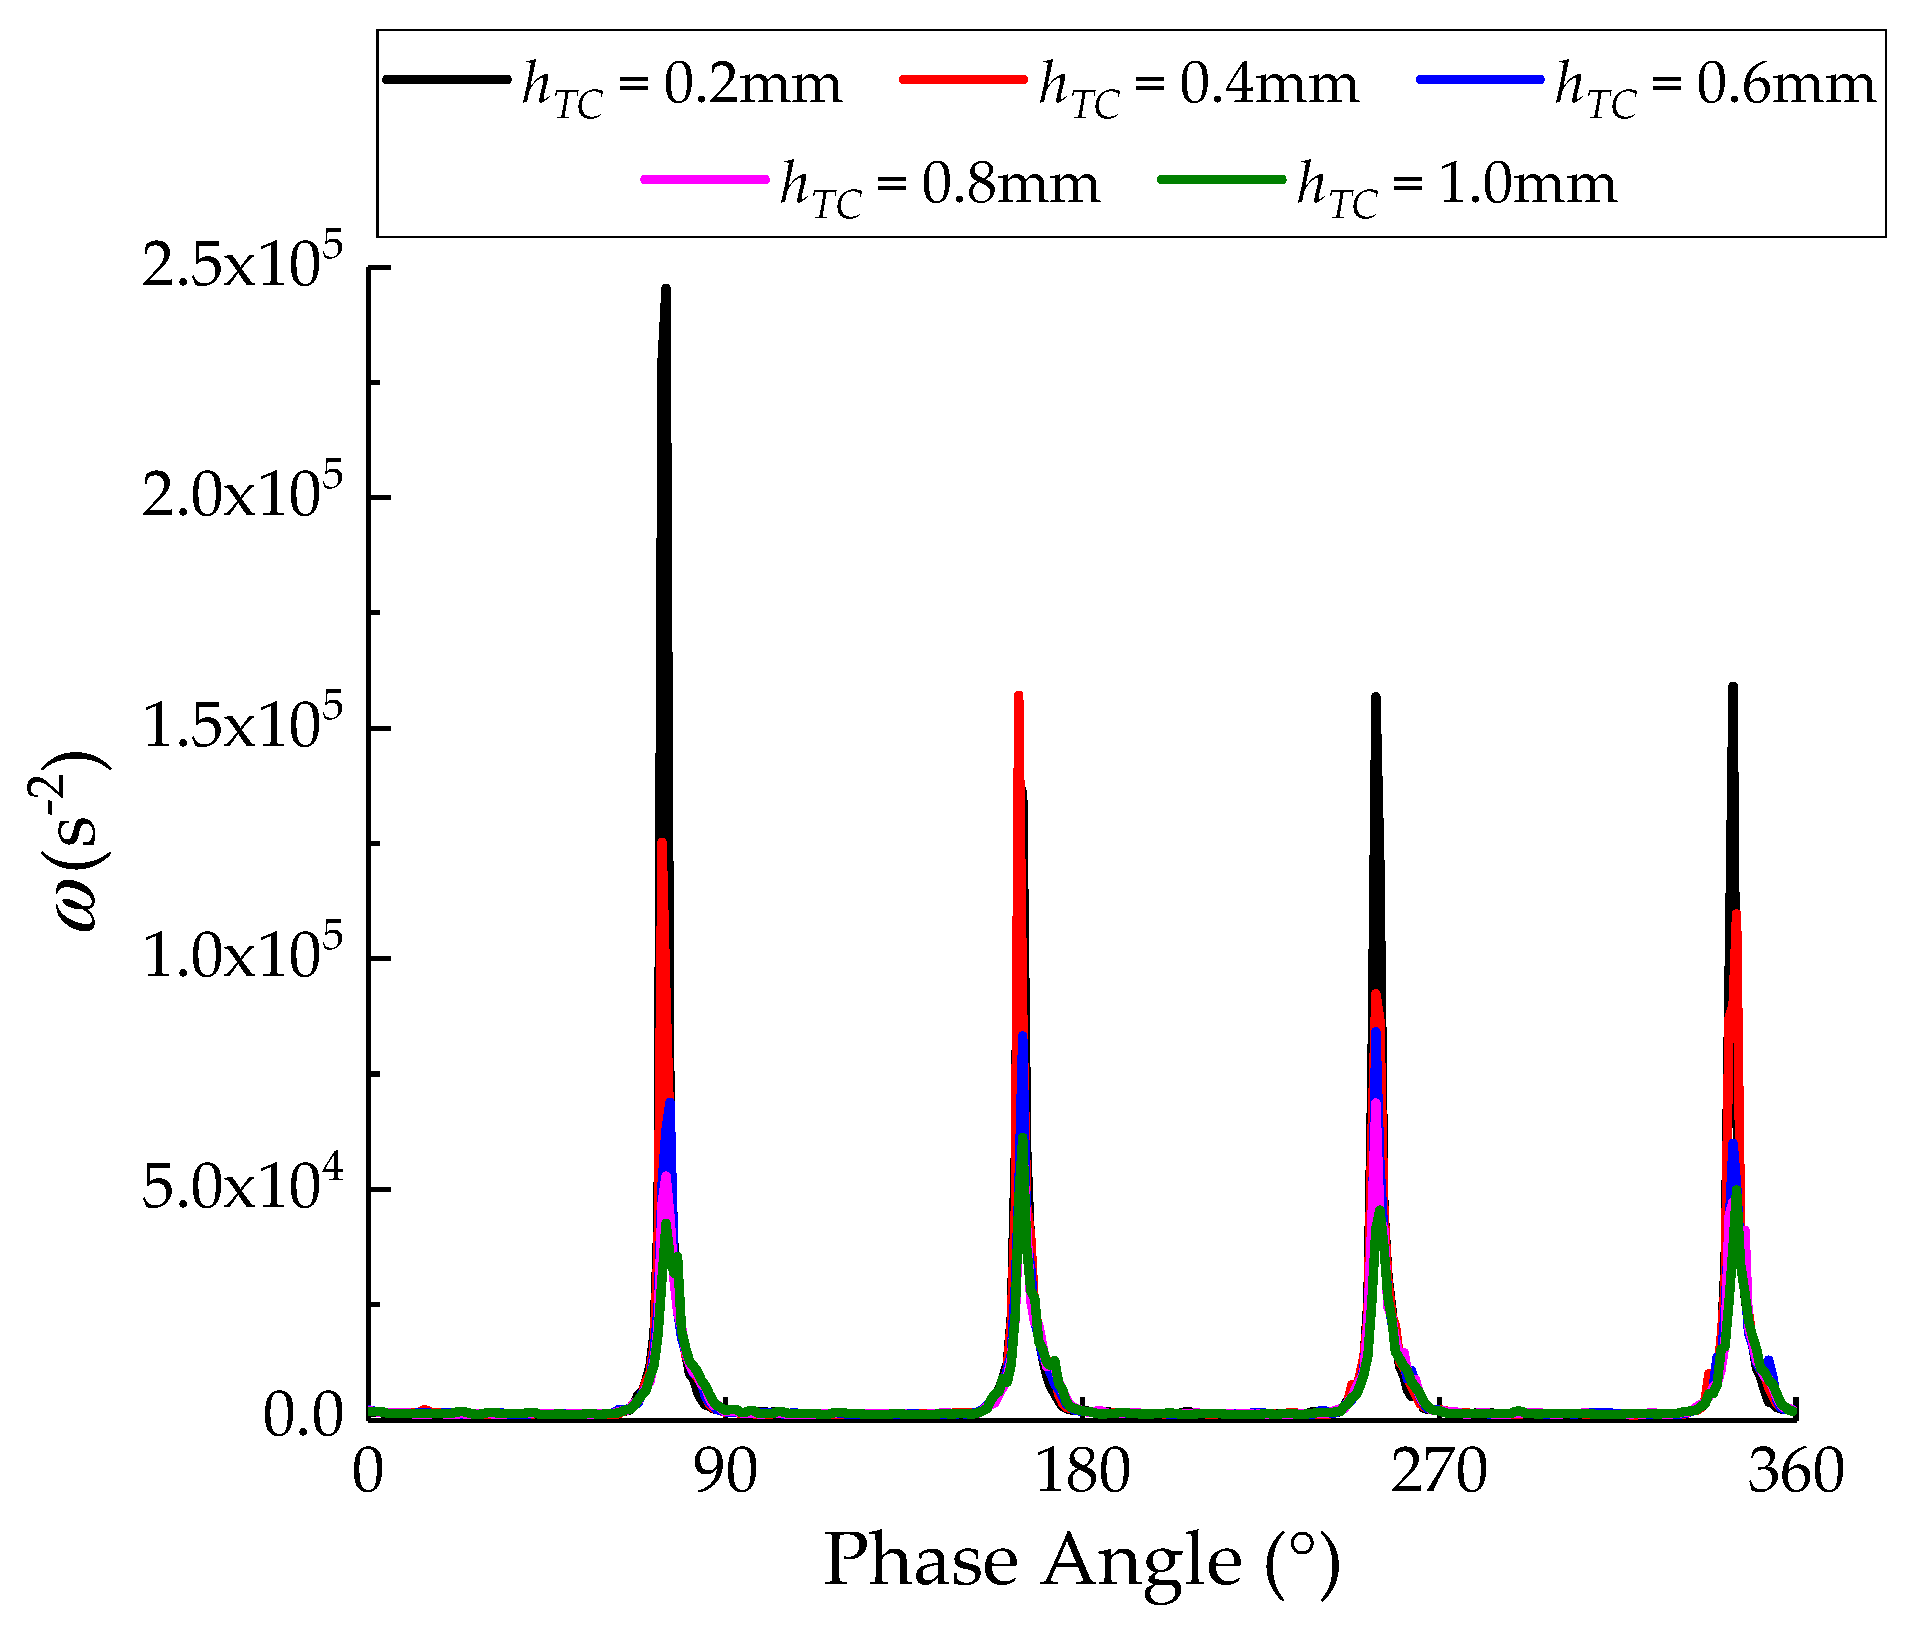
Distribution of Circumferential Turbulence Eddy Frequency
A circumferential turbulence eddy frequency (ω) distribution on the Monitoring Line 0.9 is obtained, as shown in Figure 14, which takes the positive X direction as the zero point and rotates one circle along the circumference according to the rotation direction of the runner. The distribution of turbulence eddy frequency (ω) of the monitoring line is consistent with that of turbulent kinetic energy (k). However, different hTC conditions have a great impact on the turbulence eddy frequency (ω). In the process of hTC increasing from 0 mm to 1.0 mm, the turbulence eddy frequency (ω) of Monitoring Line 0.9 decreased significantly, and the turbulence eddy frequency (ω) of Monitoring Line 0.9 decreased from 2 × 10⁵ to 5 × 10⁴, which decreased by about 80%. Based on the above analysis of the separated vortex structure and turbulent flow field, it can be observed that the energy losses and dissipation of the blade tip are very serious when hTC is small; thus, it is impossible to form a stable and separated vortex at the blade tip. However, after hTC increases, the turbulence eddy frequency (ω) near the blade tip decreases significantly, and the energy loss and dissipation near the blade tip clearance also decreases significantly, Therefore, the separated vortex structure at the blade tip is cannot be easily damaged, resulting in a very obvious vortex structure.

5. Influence of Different Tip Clearance Widths (hTC) on Unsteady Flow Characteristics

5.1. Influence of Different Tip Clearance Widths (hTC) on Internal Pressure Pulsation

Unsteady numerical simulation calculation and analysis of the internal flow of tubular turbine are carried out for different hTC. Unsteady numerical simulation is carried out for three different clearance conditions of 0 mm, 0.6 mm, and 1.0 mm.
In order to analyze internal flow transient characteristics of the rotating parts, fixed parts and blade tip clearance of the turbine, a series of monitoring points is set in the flow passage of each part in the turbine. The location arrangement of the monitoring points is shown in Figure 15, in which Figure 15a is the location of the monitoring points at the inlet and outlet section, Figure 15b is the three-dimensional location of the monitoring points at the runner and guide vane and Figure 15c is the two-dimensional projection position of the monitoring points of the runner and guide vane. In the figure, Pij represents the name of the monitoring point, i from 1 to 11, representing the axial position sequence of the monitoring point from the inlet through the guide vane and runner to the outlet; j from 1 to 3 represents the radial position sequence from the chamber to the hub. P71 is a special monitoring point, which is located in the middle of the blade tip clearance of the runner blade. Therefore, there is no P71 monitoring point under the calculation condition with an hTC of 0 mm.

5.2. Pressure Pulsation Analysis of Different Tip Clearance Widths (hTC)

5.2.1. Time Domain Analysis of Pressure Pulsation

This study focuses on the analysis of pressure pulsation from the guide vane to the runner section; that is, the pressure pulsation changes of all monitoring points. Data of the last five periods of numerical simulation calculation are selected as the analysis object.
For different tip clearance conditions, the mean value of pressure pulsation at the monitoring points and the peak-to-peak values of pressure pulsation in the 97% confidence interval are calculated and analyzed, and the contour map of the internal pressure pulsation of the entire turbine from the inlet to the outlet is drawn. Figure 16 is the contour map of the mean value of pressure pulsation in the turbine, and Figure 17 is the contour map of the peak-to-peak value of pressure pulsation change in the turbine.
It can be observed from Figure 16 and Figure 17 that, under different hTC, the mean value distribution of pressure pulsation in the turbine is relatively close, and the overall distribution law is that pressure pulsation decreases first and then increases from inlet to outlet. Pressure pulsation decreases slowly in the inlet section. When the flow enters the guide vane, the decline speed of the mean value of pressure pulsation accelerates. From the inlet of guide vane to the middle of the runner, the average value of the overall relative pressure in the turbine is above 0. Only in the vaneless region from the guide vane outlet to the runner inlet is there a special area near the chamber where the average value of the pressure pulsation first decreases sharply and then rises suddenly, and the average value of the relative pressure is only about −0.1. After entering the runner, the mean value of pressure pulsation further decreases. Finally, the lowest point of the mean value of pressure pulsation in the turbine is reached at the blade tip clearance of the runner blade (under the condition of hTC = 0 mm, the mean value of the lowest pressure pulsation in the turbine appears at the trailing edge of the runner blade). When the fluid reaches the outlet section through the rotating parts, the mean value of pressure rises gradually and finally returns to about 0. By using analysis from the chamber to the hub, it can be observed that the mean value of the pressure pulsation in the turbine with different hTC from the chamber to the hub is an overall downward trend.
Similarly, for the change of pressure pulsation peak-to-peak value in the turbine, the change law of pressure pulsation peak-to-peak value in the turbine under different hTC is basically the same. Contrary to the change of mean value of pressure pulsation, the peak-to-peak value of pressure pulsation in the entire flow range from inlet to outlet first increases and then decreases, and the change of peak-to-peak value in the inlet section is relatively slow. After the fluid passes through the bulb body, the peak-to-peak value amplitude of pressure pulsation begins to rise. When the blade tip clearance width is hTC = 0 mm and 0.6 mm, the peak-to-peak value of pressure pulsation in the turbine reaches the highest near the chamber at the trailing edge of the guide vane and the vaneless region between the runner and the guide vane near the chamber. When hTC reaches 1.0 mm, the peak-to-peak value of pressure pulsation in the turbine appears at two heights, in addition to the position of the vaneless region close to the chamber as the condition when hTC = 0 mm and 0.6 mm. There is also a very high peak-to-peak value condition near the blade tip clearance. Then, the amplitude changes of the peak-to-peak value of the pressure pulsation in the runner decreases gradually and finally reaches a more stable pressure pulsation change at the outlet. It can be observed from the time domain of pressure pulsation that the appropriate hTC can effectively weaken the peak value of pressure pulsation in the turbine. When hTC = 0.6 mm, the maximum peak-to-peak value is ΔCp = 0.22, while when hTC = 0 mm, the peak-to-peak value is ΔCp = 0.24. Excessive hTC will cause a development intensity in flow turbulence in the turbine, cause a violent change in pressure pulsation and make multiple violent vibration positions in the turbine. At the same time, the pulsation amplitude increases greatly, and the peak value of the highest pressure pulsation is ΔCp = 0.38.

5.2.2. Frequency Domain Analysis of Pressure Pulsation

The time domain signal of pressure pulsation at each monitoring point is subjected to fast Fourier transform (FFT) in order to obtain the frequency domain of pressure pulsation at different monitoring points in the runner and guide vane under different hTC, as shown in Figure 18. The shaft frequency fs of the main shaft of the rotating part is 17.38 Hz, the blade passage frequency fr = Nrfs of the rotating part is about 69.54 Hz and the blade passage frequency fv = Nvfs of the fixed part is about 278.15 Hz.
For different hTC conditions, the frequency domain signals of pressure pulsation at all monitoring points are obtained according to FFT transformation, and three characteristic frequency signals are extracted: shaft frequency fs, the blade passage frequency of the rotating part fr (four times fs) and the blade passage frequency of the fixed part fv (16 times fs). The contour map of each frequency distribution in the entire turbine from the inlet to the outlet is drawn. Figure 18 is the contour map of the distribution of fs in the turbine under different hTC conditions. It can be observed from Figure 18 that under different hTC conditions, the amplitude of fs in the turbine passage is small as a whole, and the distribution of fs shows a trend of firstly increasing and then decreasing, and the highest fs location appears in the second half of the runner. It can be observed from the figure that hTC has a great impact on the characteristic frequency fs of the turbine. With the continuous increase in hTC, characteristic frequency fs increases. When hTC = 1.0 mm, the amplitude of fs increases to about Cp = 0.0015. At the same time, due to the occurrence of tip clearance, there is a significant difference in fs of pressure pulsation at the blade tip when hTC = 0 mm and hTC = 1.0 mm. When hTC = 1.0 mm, the flow at the blade tip loses the control of the blade due to the excessive tip clearance width. Due to the occurrence of clearance leakage vortex, the flow at the blade tip clearance changed significantly and a peak of amplitude of fs appears. When hTC = 0 mm, the characteristic frequency fs performance at the blade tip clearance is not strong because the flow is controlled by the blade. However, when hTC = 0.6 mm, the amplitude of fs at the blade tip clearance is not very obvious, indicating that a reasonable blade tip clearance width cannot result in large changes in the internal pressure pulsation of the turbine.
Figure 19 shows the distribution of fs in the turbine under different hTC conditions. It can be observed from the figure that compared with the distribution of fs, the distribution of fr inside the turbine passage is more regular. The distribution of fr inside the turbine shows two peaks: One in the vaneless region between the guide vane and the runner, which is mainly caused by the rotor–stator interaction between the fixed parts and the rotating parts. Another peak appears at the tip clearance of the blade. The same is observed for the distribution of fs: When hTC = 0 mm and 0.6 mm, the characteristic frequency fr at the blade tip clearance does not change much and remains at a small amplitude. However, when hTC increases to 1.0 mm, the characteristic frequency fr at the blade tip clearance increases significantly, indicating that the flow at the runner tip clearance is obviously disordered. At the same time, compared with the distribution of fs, the two peaks of the distribution of fr in the passage significantly increased, and the overall Cp value increased to more than 0.009, indicating that the rotation of rotating parts has a great impact on the internal pressure pulsation of the turbine.
Figure 20 is a contour map of the distribution of fv inside the turbine under different hTC conditions. It can be observed from the figure that the distribution of fv in the turbine is closer to that of fr, and there are obvious peaks in the vaneless region and blade tip clearance. Different from fr, the peak value and influence range of fv are larger. This shows that the appearance of the characteristic frequency fv is obviously related to the mixing and dissipation in the fluid. Another difference is that with the increase in hTC, the amplitude and peak range of characteristic frequency fv gradually decrease.
In conclusion, the existence and width of blade tip clearance significantly affect the amplitude and distribution of characteristic frequency of pressure pulsation in tubular turbines. With reasonable and moderate blade tip clearance width, the amplitude of characteristic frequency at blade tip clearance can be effectively avoided, and the amplitude of characteristic frequency caused by rotor–stator interaction in a vaneless region can be reduced so as to provide guarantee for safe and stable operation of the unit.

6. Influence of Different Tip Clearance Widths (hTC) on the Forces of Tubular Turbine

During the operation of tubular turbine, the fluid will produce a large force on the unit. The force on the rotating part of the unit mainly includes axial and radial directions, and the leakage flow in the blade tip clearance is the source of radial excitation force. The existence of these two forces will have a certain impact on the safety and stability of the unit during operation.
In this study, schematic diagrams of axial force and radial force on the runner are shown in Figure 21, where the axial force is Fz, as shown in the figure, while the radial force Fr is the resultant force of the runner’s hydrodynamic force Fx in the X direction and Fy in the Y direction. The expression of radial force Fr is as follows:
F r = F x 2 + F y 2
where Fr represents the radial force received by the runner, N; Fx and Fy represent the hydrodynamic forces acting on the two vertical directions of the runner, respectively, N.

6.1. Influence of Different Tip Clearance Widths (hTC) on Axial Force

In order to analyze the axial force on the runner of tubular turbine under rated working conditions, select the last period of data to analyze the change of axial force on tubular turbine runner under different hTC at rated working conditions. The time domain is shown in Figure 22. It can be observed from the figure that when blade hTC increases from 0 mm to 1.0 mm, the axial force of the runner shows a downward trend as a whole. There are two stages of changes in the process of axial force decline. From 0 mm to 0.6 mm, the axial force of the runner decreases greatly, overall axial force decreases from 4325 N to about 4025 N, and from 0.6 mm to 1.0 mm, the axial force of the runner decreases slowly, the axial force is about 4025 N. It can be observed from the time domain diagram that under different hTC, the variation amplitude of axial force in one cycle is similar, and the peak-to-peak values are about 25 N. It can be observed that considering hTC has a significant impact on the axial force of the rotating parts of the tubular turbine, the existence of hTC will result in a significant decrease in the axial force, but the change of hTC will not have a significant impact on the axial force of the rotating parts.

6.2. Influence of Different Tip Clearance Widths (hTC) on Radial Force

In order to analyze the radial force on the runner of tubular turbine under rated working conditions, select the last period of data to analyze the change of radial force on tubular turbine runner under different hTC at rated working conditions. The time domain is shown in Figure 23. It can be observed from the figure that under the rated working condition, the radial force of runner blades with different clearances is different. Overall, when hTC increases from 0 mm to 1.0 mm, the radial force decreases to a certain extent. At 0 mm, the radial force is the largest, and the overall mean value of pulsation amplitude is more than 4 N. After considering tip clearance, when hTC is 0.6 mm, the overall amplitude of radial force decreases to about 2 N. When hTC increases to 1.0 mm, the radial force on the rotating parts increase to about 3 N. It can be observed that the existence of hTC will result in an decrease in radial force. And, the decrease value is large, almost 50% of hTC = 0 mm. Therefore, the tip clearance width has effect on the radial excitation force of rotating parts.

7. Conclusions

In this study, six different tip clearance widths are deeply studied, and the influence of tip clearance width of tubular turbine is analyzed in detail. Conclusions can be drawn as follows:
(1)
With the increase in tip clearance width, the performance of tubular turbine firstly decreases and then increases. When tip clearance width increases from 0 to 1.0 mm, tip leakage vertical flow becomes stronger. The internal flow in runner becomes more turbulent and disordered. The hydraulic loss in leakage is strong. As the tip clearance width increases, the minimum pressure in the tip clearance decreases gradually, and the turbulence eddy frequency decreases significantly, which is prone to the risk of tip vortex cavitation. The internal flow in runner will be more complex.
(2)
The tip clearance width has strong influence on pressure pulsation. A reasonable width will reduce pressure pulsation intensity. However, excessive tip clearance width (for example 1.0 mm) will cause severe pressure pulsation in the turbine, especially in the vaneless region between the runner and guide vane and the blade tip clearance of the runner because the flow is out of control, and the amplitude of pressure pulsation is extremely strong.
(3)
The force on a runner is affected by tip clearance width. If the width is larger, the average value of axial force is smaller. When tip clearance width increases from 0 to 1.0 mm, the average value of axial force decreases from 4325 N to 4025 N for about 7%. However, the pulsation amplitude of axial force does not strongly change with the variation of tip clearance width, the peak-to-peak values are about 25 N. However, the change in tip clearance width has great influence on the radial excitation force, with the increase of tip clearance width, the radial force decreases for about 50%.
The determination of blade tip clearance width of tubular turbine is a complex comprehensive problem. A tip clearance width that is too large enhances the leakage vortex in the clearance and the pressure pulsation in the unit. Tip clearance that is too small will result in a significant increase in the axial force on the runner and affects the safe and stable operation of the unit. For the reasons above, the influence of tip clearance should be considered in the design process of tubular turbine. A reasonable tip clearance width is required because the efficiency, stability and security of turbine unit is very sensitive to it. Therefore, in the future research, it is still necessary to combine actual production and consider enough influencing factors to reasonably determine the appropriate tip clearance width range.

Author Contributions

Methodology: Y.W., X.Y. and X.W.; validation: Y.W., X.W., X.Y., J.D., D.Z., H.W. and R.X.; formal analysis: Y.W., X.Y., R.T., H.W., J.D., D.Z., H.W. and R.X.; investigation: Y.W., R.T. and D.Z.; data curation; Y.W., X.Y., X.W., J.D., D.Z., H.W. and R.X.; writing—original draft preparation: Y.W., X.W. and R.T.; writing—review and editing: X.Y.; J.D., D.Z., H.W. and R.X.; funding acquisition: R.T., X.W., J.D., H.W. and R.X. All authors have read and agreed to the published version of the manuscript.

Funding

This research was funded by the Open Research Fund of State Key Laboratory of Hydro-Power Equipment (Grant No. SKLHE-ORF-202102), Chinese Universities Scientific Fund (Grant No. 2021TC107) and National Natural Science Foundation of China (Grant No. 51836010).

Institutional Review Board Statement

Not applicable.

Informed Consent Statement

Not applicable.

Data Availability Statement

Not applicable.

Acknowledgments

We acknowledge the technical support of Puxi Li for supporting us in grid discretization.

Conflicts of Interest

The authors declare no conflict of interest.

References

  1. Weitemeyera, S.; Kleinhan, D.; Vogta, T.; Agerta, C. Integration of Renewable Energy Sources in Future Power Systems: The Role of Storage. Renew. Energy 2015, 75, 14–20. [Google Scholar] [CrossRef] [Green Version]
  2. Chang, X.; Liu, X.; Zhou, W. Hydropower in China at Present and Its Further Development. Energy 2010, 35, 4400–4406. [Google Scholar] [CrossRef]
  3. Falcao, A.F.D. Wave Energy Utilization: A Review of the Technologies. Renew. Sustain. Energy Rev. 2010, 14, 899–918. [Google Scholar] [CrossRef]
  4. Jacobson, M.Z.; Delucchi, M.A. Providing All Global Energy with Wind, Water, and Solar Power, Part I: Technologies, Energy Resources, Quantities and Areas of Infrastructure, and Materials. Energy Policy 2011, 39, 1154–1169. [Google Scholar] [CrossRef]
  5. Guney, M.S. Solar Power and Application Methods. Renew. Sustain. Energy Rev. 2016, 57, 776–785. [Google Scholar] [CrossRef]
  6. Tao, R.; Wang, Z. Comparative numerical studies for the flow energy dissipation features in a pump-turbine in pump mode and turbine mode. J. Energy Storage 2021, 41, 102835. [Google Scholar] [CrossRef]
  7. Kan, K.; Zheng, Y.; Fu, S.; Liu, H.; Yang, C.; Zhang, X. Dynamic Stress of Impeller Blade of Shaft Extension Tubular Pump Device Based on Bidirectional Fluid-Structure Interaction. J. Mech. Sci. Technol. 2017, 31, 1561–1568. [Google Scholar] [CrossRef]
  8. Zheng, X.; Wang, L.; Weng, K. Dynamic Characteristics Analysis of Tubular Turbine Based on Bidirectional Fluid-Solid Coupling. Trans. Chin. Soc. Agric. Eng. 2016, 32, 78–83. [Google Scholar]
  9. Zheng, Y.; Wu, C.; Mu, M.; Yang, C. Research on Energy Characteristics of New-Type Bidirectional Shaft Tubular Turbine. South North Water Divers. Water Sci. Technol. 2013, 11, 66–70. [Google Scholar]
  10. Xiao, R.; Wang, Z.; Luo, Y. Dynamic Stress Analysis of Francis Turbine with Partial Load. J. Hydroelectr. Eng. 2007, 26, 130–134. [Google Scholar]
  11. Campbell, R.L.; Paterson, G. Fluid-Structure Interaction Analysis of Flexible Turbomachinery. J. Fluids Struct. 2011, 27, 1376–1391. [Google Scholar] [CrossRef]
  12. Jiang, Y.Y.; Yoshimura, S.; Imai, R.; Katsura, H.; Yoshida, T.; Kato, C. Quantitative Evaluation of Flow-Induced Structural Vibration and Noise in Turbomachinery by Full-Scale Weakly Coupled Simulation. J. Fluids Struct. 2007, 23, 531–544. [Google Scholar] [CrossRef]
  13. Kim, B.S.; Bae, S.Y.; Kim, W.J.; Lee, S.L.; Kim, M.K. A Study on the Design Assessment of 50 kW Ocean Current Turbine using Fluid Structure Interaction Analysis. In Proceedings of the 26th IAHR Symposium on Hydraulic Machinery and Systems, Beijing, China, 19–23 August 2012. [Google Scholar]
  14. Schmucker, H.; Flemming, F.; Coulson, S. Two-Way Coupled Fluid Structure Interaction Simulation of a Propeller Turbine. In Proceedings of the 25th IAHR Symposium on Hydraulic Machinery and Systems, Politehnica University Timisoara, Timisoara, Romania, 20–24 September 2010. [Google Scholar]
  15. Pan, X.; Li, C.; Tie, Y.; Zhang, W. Strength Analysis of Fluid-Solid Coupling of Axial Flow Pump Blades. J. Hydroelectr. Eng. 2012, 31, 222–226. [Google Scholar]
  16. Booth, T.C.; Dodge, P.R.; Hepworth, H.K. Rotor-Tip Leakage: Part I—Basic Methodology. J. Eng. Power 1982, 104, 154–161. [Google Scholar] [CrossRef]
  17. Rains, D.A. Tip Clearance Flows in Axial Compressors and Pumps, 2nd ed.; California Institute of Technology: Pasadena, CA, USA, 1954. [Google Scholar]
  18. Guo, Q.; Zhou, L.; Wang, Z. Numerical Evaluation of the Clearance Geometries Effect on the Flow Field and Performance of a Hydrofoil. Renew. Energy 2016, 99, 390–397. [Google Scholar] [CrossRef]
  19. Xiao, X.; McCarter, A.A.; Lakshminarayana, B. Tip Clearance Effects in a Turbine Rotor: Part I—Pressure Field and Loss. J. Turbomach. 2001, 123, 296–304. [Google Scholar] [CrossRef]
  20. Chitrakar, S.; Thapa, B.S.; Dahlhaug, O.G.; Neopane, H.P. Numerical and Experimental Study of the Leakage Flow in Guide Vanes with Different Hydrofoils. J. Comput. Des. Eng. 2017, 4, 218–230. [Google Scholar] [CrossRef]
  21. Dreyer, M.; Decaix, J.; Münch-Alligné, C.; Farhat, M. Mind the Gap: A New Insight into the Tip Leakage Vortex using Stereo-PIV. Exp. Fluids 2014, 55, 1849. [Google Scholar] [CrossRef]
  22. Decaix, J.; Balarac, G.; Dreyer, M.; Farhat, M.; Munch, C. RANS and LES Computations of the Tip-Leakage Vortex for Different Gap Widths. J. Turbul. 2015, 16, 309–341. [Google Scholar] [CrossRef]
  23. Chen, G. Vortical Structures in Turbomachinery Tip Clearance Flows; Massachusetts Institute of Technology: Cambridge, UK, 1991. [Google Scholar]
  24. Li, Y.; Tan, D.; Chen, H.; Katz, J. Effects of Tip Gap Size on the Flow Structure in the Tip Region of an Axial Turbomachine. In Proceedings of the ASME-JSME-KSME Joint Fluids Engineering Conference, Seoul, Korea, 26–31 July 2015. [Google Scholar]
  25. Liu, Y.; Han, Y.; Tan, L.; Wang, Y. Blade Rotation Angle on Energy Performance and Tip Leakage Vortex in a Mixed Flow Pump as Turbine at Pump Mode. Energy 2020, 206, 118084. [Google Scholar] [CrossRef]
  26. Pichler, R.; Michelassi, V.; Sandberg, R.; Ong, J. Highly Resolved Large Eddy Simulation Study of Gap Size Effect on Low-Pressure Turbine Stage. J. Turbomach. 2018, 140, 021003. [Google Scholar] [CrossRef]
  27. Liu, Y.; Tan, L. Tip Clearance on Pressure Fluctuation Intensity and Vortex Characteristic of a Mixed Flow Pump as Turbine at Pump Mode. Renew. Energy 2018, 129, 606–615. [Google Scholar] [CrossRef]
  28. You, D.; Wang, M.; Moin, P.; Mittal, R. Effects of Tip-Gap Size on the Tip-Leakage Flow in a Turbomachinery Cascade. Phys. Fluids 2006, 18, 105102. [Google Scholar] [CrossRef] [Green Version]
  29. Li, X.; Li, Z.; Zhu, B.; Wang, W. Effect of Tip Clearance Size on Tubular Turbine Leakage Characteristics. Processes 2021, 9, 1481. [Google Scholar] [CrossRef]
  30. Luo, X.; Ji, B.; Tsujimoto, Y. A Review of Cavitation in Hydraulic Machinery. J. Hydrodyn. 2016, 28, 335–358. [Google Scholar] [CrossRef]
  31. Cheng, H.; Bai, X.; Long, X.; Ji, B.; Peng, X.; Farhat, M. Large Eddy Simulation of the Tip-Leakage Cavitating Flow with an Insight on How Cavitation Influences Vorticity and Turbulence. Appl. Math. Model. 2020, 77, 788–809. [Google Scholar] [CrossRef]
  32. Zhang, D.; Shi, L.; Shi, W.; Zhao, R.; Wang, H.; van Esch, B.B. Numerical Analysis of Unsteady Tip Leakage Vortex Cavitation Cloud and Unstable Suction-side-perpendicular Cavitating Vortices in an Axial Flow Pump. Int. J. Multiph. Flow 2015, 77, 244–259. [Google Scholar] [CrossRef]
  33. Gaggero, S.; Tani, G.; Viviani, M.; Conti, F. A Study on the Numerical Prediction of Propellers Cavitating Tip Vortex. Ocean Eng. 2014, 92, 137–161. [Google Scholar] [CrossRef]
  34. Zhao, D.; Ma, W.; Liang, W.; Liao, W.; Wan, T. On 3D Flow Numerical Simulation of Bulb Tubular Turbine Considering and not Flange Clearance. Large Electr. Mach. Hydraul. Turbine 2007, 3, 31–35. [Google Scholar]
  35. Li, H.; Xu, J.; Liu, W. The Analysis of Gap Simulation Technology on Tubular Turbine. Large Electr. Mach. Hydraul. Turbine 2011, 2, 31–36. [Google Scholar]
  36. Celik, I.B.; Ghia, U.; Roache, P.J.; Freitas, C.J.; Coleman, H.; Raad, P.E. Procedure for Estimation and Reporting of Uncertainty due to Discretization in CFD Applications. J. Fluids Eng. Trans. ASME 2008, 130, 078001. [Google Scholar]
  37. Oberkampf, W.L.; Roy, C.J. Verification and Validation in Scientific Computing; Cambridge University Press: Cambridge, UK, 2010. [Google Scholar]
Figure 1. Passage and blade tip clearance of tubular turbine. (a) represents the three-dimensional flow passage of the turbine. (b) represents the radial flow passage of the turbine. (c) represents the tip position between the runner and the chamber.
Jmse 10 00136 g001
Figure 2. Index values in the GCI check of grid schemes with the Richardson extrapolation value.
Jmse 10 00136 g002
Figure 3. The final scheme of grid division.
Jmse 10 00136 g003
Figure 4. Schematic map of the hydraulic test rig. (a) represents the schematic map of the hydraulic test rig and (b) represents the photo of the hydraulic test rig.
Jmse 10 00136 g004
Figure 5. Influence of different hTC conditions on turbine performance.
Jmse 10 00136 g005
Figure 6. Leakage flowrate and average leakage velocity under different hTC conditions. (a) represents the leakage flowrate of different hTC. (b) represents the average leakage velocity of different hTC.
Jmse 10 00136 g006
Figure 7. Schematic map of tip clearance location. (a) represents the front view of blade tip clearance. (b) represents the vertical view of blade tip clearance.
Jmse 10 00136 g007
Figure 8. Tip leakage vortex patterns under different hTC conditions (LE-leading edge; TE-trailing edge; SS-suction side; PS-pressure side; TLV-tip leakage vortex). (a) represents hTC = 0 mm, (b) represents hTC = 0.2 mm, (c) represents hTC = 0.4 mm, (d) represents hTC = 0.6 mm, (e) represents hTC = 0.8 mm, (f) represents hTC = 1.0 mm.
Jmse 10 00136 g008
Figure 9. Location of Section 0.9.
Jmse 10 00136 g009
Figure 10. Streamline and turbulent kinetic energy(k) distribution of circumferential section in front of blade tip at Section 0.9 under different hTC conditions. (a) represents hTC = 0 mm, (b) represents hTC = 0.2 mm, (c) represents hTC = 0.4 mm, (d) represents hTC = 0.6 mm, (e) represents hTC = 0.8 mm, (f) represents hTC = 1.0 mm.
Jmse 10 00136 g010
Figure 11. Location of Monitoring Line 0.9.
Jmse 10 00136 g011
Figure 12. Circumferential pressure distribution under different hTC conditions at Monitoring Line 0.9.
Jmse 10 00136 g012
Figure 13. Circumferential turbulent kinetic energy (k) of different hTC conditions at Monitoring Line 0.9.
Jmse 10 00136 g013
Figure 14. Circumferential turbulence eddy frequency (ω) under different hTC conditions at Monitoring Line 0.9.
Jmse 10 00136 g014
Figure 15. Layout of monitoring points for unsteady calculation. (a) The layout position of monitoring points at the inlet and outlet section, (b) the three-dimensional position of monitoring points at the runner and guide vane part and (c) the two-dimensional projection position of monitoring points at the runner and guide vane part.
Jmse 10 00136 g015
Figure 16. Contour map of mean value of pressure pulsation under different hTC conditions.
Jmse 10 00136 g016
Figure 17. Contour map of peak-to-peak value of pressure pulsation under different hTC conditions.
Jmse 10 00136 g017
Figure 18. Contour map of the distribution of fs inside the turbine under different hTC conditions.
Jmse 10 00136 g018
Figure 19. Contour map of the distribution of fr inside the turbine under different hTC conditions.
Jmse 10 00136 g019
Figure 20. Contour map of the distribution of fv inside the turbine under different hTC conditions.
Jmse 10 00136 g020
Figure 21. Schematic diagram of axial force and radial force.
Jmse 10 00136 g021
Figure 22. Time domain of axial force of runner under different hTC conditions.
Jmse 10 00136 g022
Figure 23. Time domain of radial force of runner under different hTC conditions. (a) represents hTC = 0 mm, (b) represents hTC = 0.6 mm, (c) represents hTC = 1.0 mm.
Jmse 10 00136 g023
Table 1. Main parameters of model tubular turbine.
Main ParametersValueUnit
Rated Rotation Speed nr1043(r/min)
Rated Flow Rate Qr1.07(m3/s)
Rated Shaft Power Pr58.53(kW)
Rated Head Hr6(m)
Rated Efficiency ηr91.85%(-)
Runner Diameter D0.4(m)
Tip Clearance Width hTC1(mm)
Unit Rotation Speed n112.733(-)
Unit Flow Rate q11170.33(-)
Specific Speed of Runner ns854.63(-)
Table 2. The number of grid nodes and error evaluation results of GCI method.
Grid SchemesNodesGrid Refinement FactorFine-Grid Convergence Index
Coarse Grid
Medium Grid
Fine Grid
1,449,192
3,470,402
7,696,901
1.3381.127%
1.3040.255%
Table 3. Device name and precision of test rig.
Tested ParametersDevice NamePrecision
Flow RateElectromagnetic Flowmeter±0.18%
Rotation SpeedRotary Encoder±0.02%
Shaft PowerTorque Meter±0.05%
PressurePressure Sensor±0.1%
Table 4. Comparison of experimental results and CFD results.
ParametersExperimental ValueCFD ValueError
Flow Rate (m3/s)1.071.024.91%
Shaft Power (kW)58.5355.385.38%
Efficiency (%)91.8592.130.3%
Table 5. Fitting functions of leakage flow and average leakage velocity for different hTC.
yxFunction
Qleak/Qin (%)hTC (mm)y = −3.118 × 10⁻⁵ + 0.001x
Vleak/Vin-runner (%)hTC (mm)y = 1.424 + 0.274(1-ex/0.318) + 0.274(1-ex/0.318)
Publisher’s Note: MDPI stays neutral with regard to jurisdictional claims in published maps and institutional affiliations.

