Article

Microplastics Dynamics in the Bathing Seawater Affected by the Ebb Tide in Zhanjiang Bay, China

1
College of Chemistry and Environmental Science, Guangdong Ocean University, Zhanjiang 524088, China
2
Research Center for Coastal Environmental Protection and Ecological Resilience, Guangdong Ocean University, Zhanjiang 524088, China
*
Author to whom correspondence should be addressed.
J. Mar. Sci. Eng. 2022, 10(12), 1947; https://doi.org/10.3390/jmse10121947
Submission received: 6 November 2022 / Revised: 30 November 2022 / Accepted: 3 December 2022 / Published: 8 December 2022
(This article belongs to the Special Issue Marine Ecology and Water Quality Monitoring)

Abstract

:
At present, microplastics (MPs) pollution has attracted people’s attention, and MPs in seawater have caused great harm to the marine environment. Taking Yugang Park Beach (YPB) in Zhanjiang Bay (ZJB) as the research object, we studied the spatial and temporal distribution, composition, and inventory of MPs in the bathing seawater affected by the ebb tide by filtering the bathing seawater with a 45 μm stainless steel sieve. The results showed that the average abundance of MPs in the bathing seawater was 201.3 ± 183.0 items·m−3, with the highest at mid-tide, followed by high and low tides. The size of MPs in the bathing seawater was mainly 1–2 mm, with most being white (23.5%) and green (29.8%) MPs, and the largest proportion being foam (27.5%) and fiber (29.5%). The main polymer types were polypropylene (PP), polystyrene (PS), and cellulose (CE). Correlation analysis between MP abundance and their sizes showed that the abundance of 0.33–5 mm MPs was significantly and positively correlated with their sizes (p < 0.05). The average MP inventory was 3.2 × 10⁶ items, with the largest at high tide, followed by mid and low tides. In conclusion, these results highlighted that tidal variations were the main factor causing the uneven distribution of MPs in the bathing seawater at YPB. This study provides theoretical support for future study of MP pollution in bathing waters, and the effect of tidal variations on MPs.

1. Introduction

Plastics are synthetic organic polymers formed by the polymerization of monomers derived from petroleum or natural gas [1,2,3]. As a result of their versatility, small mass, strength, and low price, plastics are widely used [4,5,6]. The good durability and poor recycling rate of plastics have led to the accumulation of plastic debris in the environment, which has been detected from the poles to the equator, and from the oceans to mountain tops [7]. It is estimated that between 4 and 12 million pieces of trash enter the ocean from land per year [8]. Ocean plastic pollution has become a global ecological problem [9,10].
Plastics are prevalent in all marine environments, due to their different physical mechanisms of transport, particularly ocean currents and tides [11]. Plastic pollution includes macroplastics, mesoplastics, and microplastics (MPs) [12,13]. MPs are generally defined as plastics that are less than 5 mm in diameter [14]. MPs in seawater can be obtained from the macroscopic fragmentation of large and intermediate plastics, as well as from microbeads in everyday products that enter the marine ecosystem through domestic and industrial drainage systems and sewage treatment plant discharges [15,16,17,18]. In tidally dominated marine ecosystems, hydrodynamic tidal factors control the transport of suspended matter [19]. Previous studies have shown that the abundance of MPs is susceptible to human activities and tidal variations, exhibiting significant variability [20,21]. For example, the abundance of MPs may be overestimated if the sampling station is located on the high tide line of an ocean beach [22]. Therefore, the influence of the field sampling strategy (station location and sampling depth) on the abundance of MPs is critical, and tidal variations should be considered. Since MPs are a suspended material, we hypothesize that tidal hydrodynamics also have an important influence on the distribution and occurrence of MPs in bathing seawater. Moreover, due to their chemical properties, plastics are difficult to decompose by microorganisms, which leads them to remain in the marine environment for a long time and break into MPs or nanoplastics [23,24,25]. Therefore, exploring the relationship between the abundance and size of MPs is necessary. Understanding this relationship will help gather information on the distribution and abundance of MPs.
Zhanjiang Bay (ZJB), with a sea area of 270 km2 and a bathymetric line of 67 km, has low water runoff, low sand content in the water column, and stable bay bed topography (Figure 1a) [26]. In addition, its high tidal capacity (mean tidal difference of about 4.8 × 10⁸ m3), long and narrow bay, and high tidal rise and fall flow velocities have created a high flow field in the bay [27]. Under the effect of this flow field and the residual flow field, the bay has good self-purification ability for a water body. Yugang Park Beach (YPB) is located at the northern end of the Zhanjiang Central Marine Observation Corridor, with an area of about 0.2 km2 (Figure 1b) [25]. This geographic area was chosen because it faces ZJB to the north, and has excellent natural conditions as a coastal recreation site in the city. In addition, there are almost no studies on the pollution of MPs in the bathing seawater area at YPB.
Therefore, samples of MPs in the bathing seawater at different tides in this study were collected at YPB along ZJB on 20 September 2021. The objectives of this study were the following: (1) to check variations in the spatial distribution of MPs in the bathing seawater affected by the ebb tide; (2) to check variations in the composition of MPs in the bathing seawater affected by the ebb tide; (3) to analyze the relationship between the abundance and size of MPs in the bathing seawater affected by the ebb tide; and (4) to check variations in the inventory of MPs in the bathing seawater affected by the ebb tide. This study contributes to understanding the impact of human activities on the pollution of MPs in the bathing seawater at YPB, and the current state of MP pollution in the seawater along ZJB.

2. Materials and Methods
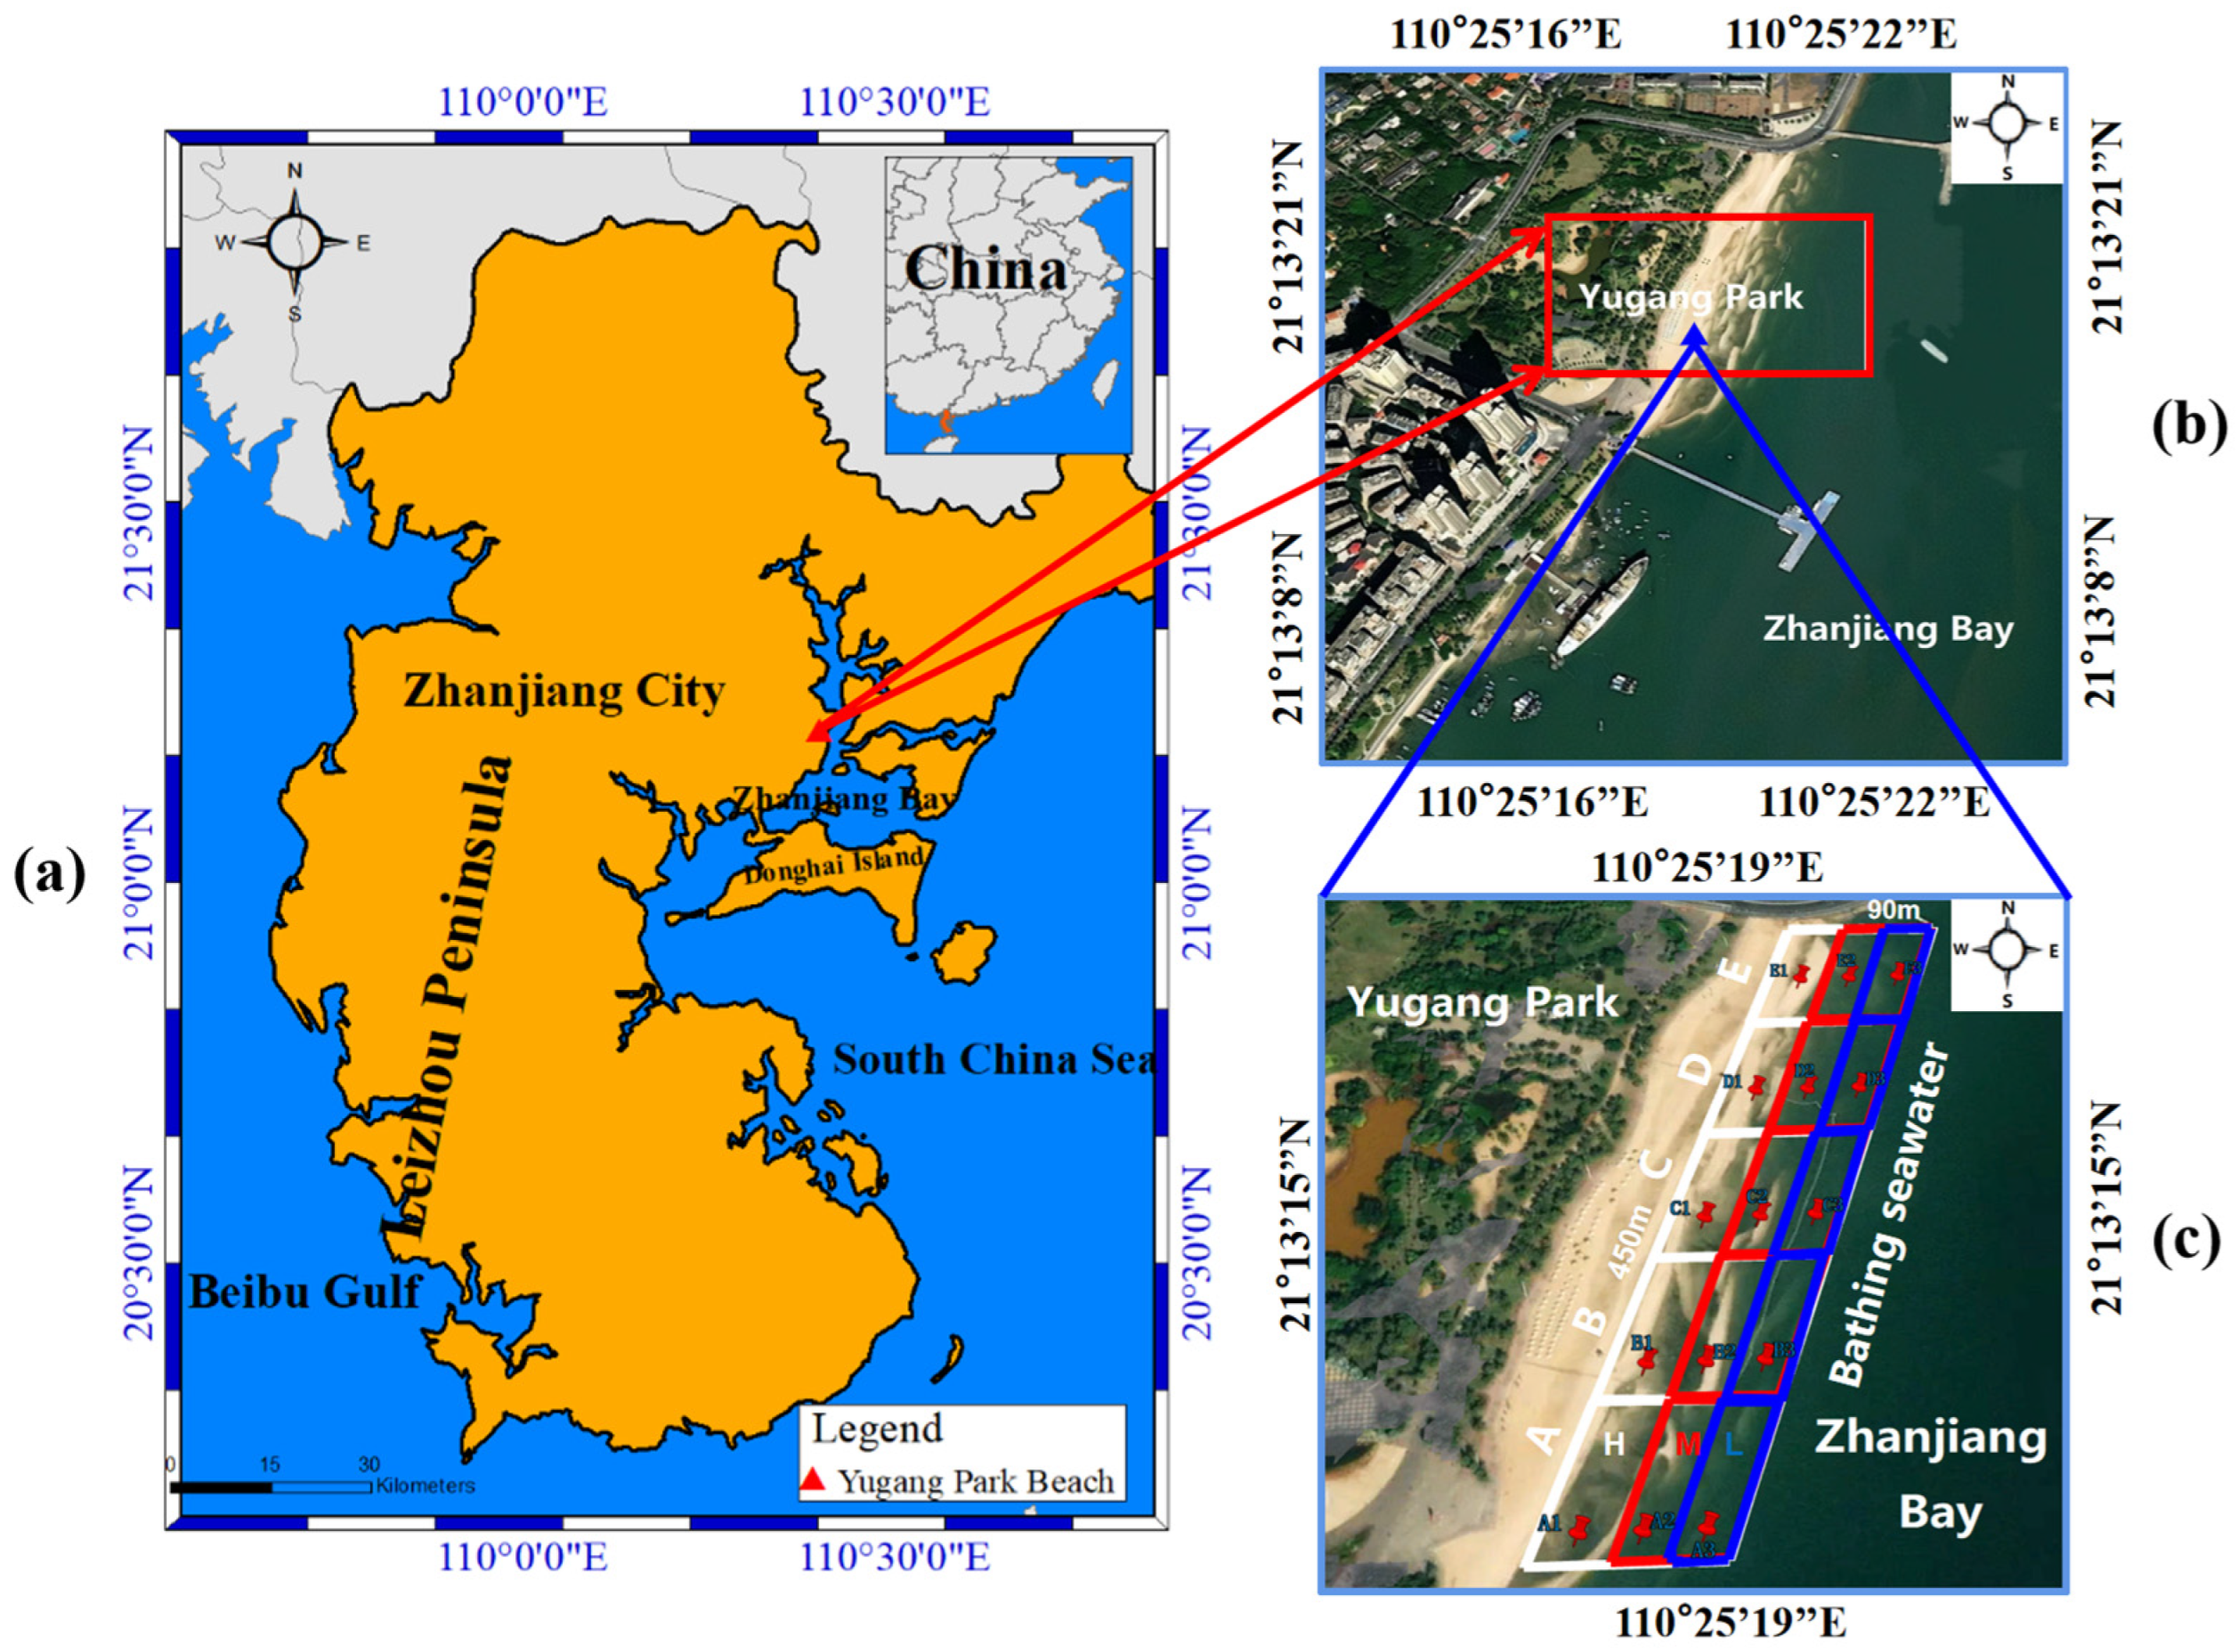
2.1. Study Area

ZJB is 24 km wide, and covers 193 km2 with a small 1.9 km estuary [27]. As a semi-enclosed bay with a small interface with the South China Sea, the bay is deep, has poor hydrodynamics, and is well-developed for shipping. The water quality of ZJB has deteriorated due to industrial wastewater discharge, ship navigation, and mariculture in previous years [28]. As the central urban area of Zhanjiang, the resident population of Xiashan District is 536,000 people (according to the communiqué of the seventh national census of Zhanjiang City (Guangdong Province)). The beautiful environment and easy access to YPB in Xiashan District mean that many tourists from surrounding residential areas as well as other areas are attracted to the location for recreational activities every year [25]. During the past Spring Festival holiday in 2021, Zhanjiang received 3.2 million visitors, and achieved a tourism revenue of CNY 1.6 billion [29]. While tourism resources bring economic benefits to the local area, they also put a lot of pressure on the environmental pollution in ZJB. MPs can still be found at YPB despite regular daily beach cleanup by workers [25]. In addition, recreational activities on the beach may pose a threat to the surrounding water quality as well as the marine environment through plastic pollution, due to the lack of marine environmental awareness and education [30].

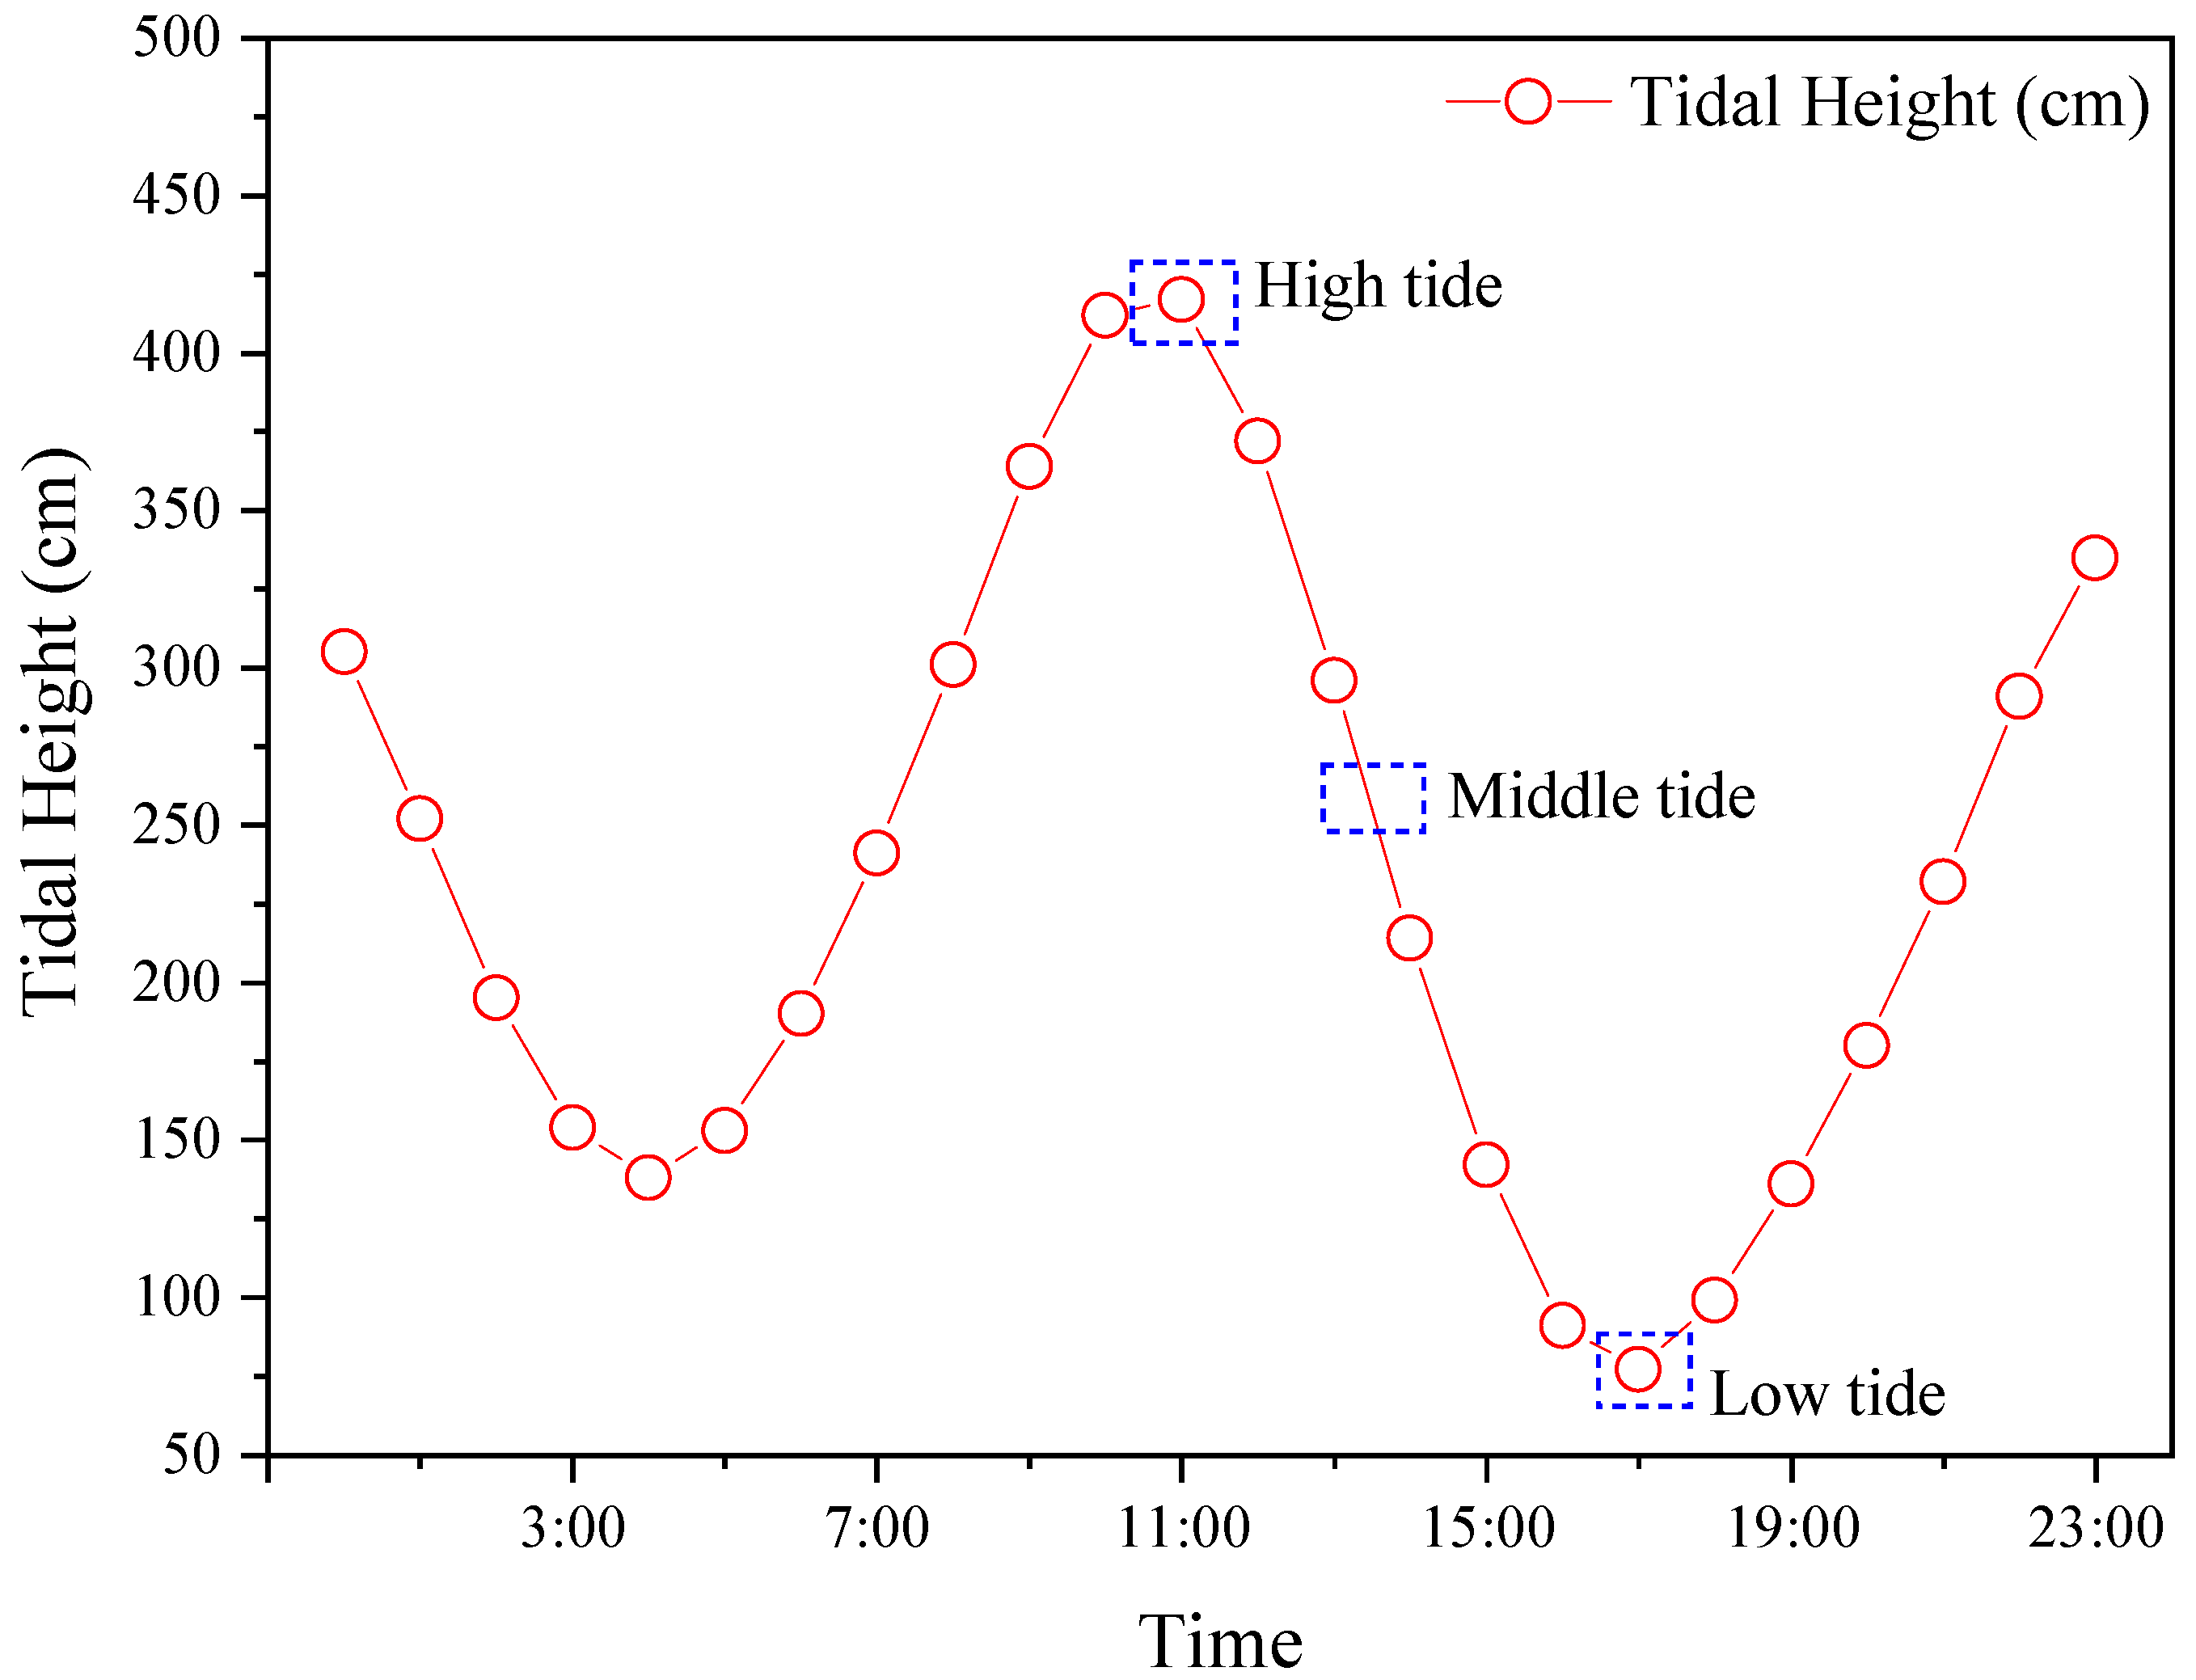
2.2. Sampling and Analysis Method

To understand the spatial distribution, composition, and quantity of MPs in the bathing seawater at YPB affected by tidal variations along the coast of ZJB, five sections were designed along the coastline on 20 September 2021, namely A, B, C, D, and E, where B, C, and D were within the bathing area of YPB. The samplers were divided into five groups corresponding to the five sections on YPB (Figure 1C). Sampling was conducted 3 times at each of the five stations, in three tidal periods (high, mid, and low tides), for a total of 15 times (Table S1).
First, surface seawater samples (at a depth of approximately 2 m) were collected simultaneously at each station, according to the three tidal periods marked in Figure 2. Using the simultaneous collection and filtration method, a 5 L metal container was filled with seawater, and the seawater was filtered through a stainless steel sieve with a mesh size of 45 μm, 10 times during the 10 min before and after high, mid, and low tides in ZJB. That is, a total of 50 L of seawater samples were collected for filtration. The residue on the filter was then completely flushed into 500 mL glass bottles, which were repeatedly rinsed with distilled water, and a total of 30 glass bottles were collected. All bottles were sampled and transferred to the laboratory [31]. In this study, the size range of plastics was limited to 0.045–5 mm.
The samples were promptly transported back to the laboratory, and no plastics were used during the laboratory analysis to avoid plastic contamination. Each sample in a glass vial was rinsed into a 250 mL beaker with distilled water, and the rinsing was repeated until all solids in the glass vial were rinsed into the beaker. Added sequentially to the beaker were 20 mL 98% Fe (II) solution and 20 mL 30% H2O2 solution. After the organic matter was digested, the remaining solid particles were dried and placed under a microscope (SMZ1270, Nikon, Tokyo, Japan) for quantitative analysis [31,32]. Micro-Fourier transform infrared spectroscopy (Frontier, PerkinElmer, Waltham, MA, USA) was used to determine the composition of the MPs. The spectra obtained were compared with the library spectra on the instrument. Only when particles matched the spectral library by 70% were they identified as MPs [9].

2.3. Estimation of the Inventory of MPs in the Bathing Seawater

The bathing seawater area was divided into 15 sub-blocks using Google Earth, with each sampling station serving as the center point of the sub-block. Assuming that the high tidal level was 90 m away from the sea, and that the total distance between sampling blocks A and E was 450 m, the average tidal height of the five squares at high, middle, and low tides were measured as 7754 m2, 4600 m2, and 2403 m2, respectively. According to Figure 2, the high, mid, and low tidal heights were 4.25 m, 2.5 m, and 0.75 m, respectively. Therefore, the volume of the three tides at each station could be calculated. The abundances of MPs at these 15 sampling stations were analyzed mathematically and statistically to quantify the total inventory of MPs present in the bathing seawater. Thus, the total MP inventory in the bathing seawater could be estimated using Equation (1) below [25,33].
I = n = 1 15 ( V n · i n )
where Vn was the volume in the bathing seawater at each of the three tidal heights, the sampling station was its center (m3), in was the abundance of MPs at each sampling station (items·m−3), and I represented the inventory of MPs in the bathing seawater (items).

2.4. Quality Assurance and Control

Cotton lab coats were worn during all experimental steps, such as sampling, sample pretreatment, and testing, in order to reduce the possibility of synthetic fiber contamination [34]. During the experiments, glass/metal containers and instruments were covered with aluminum foil when not in use, to prevent secondary contamination. Before sample processing, all solutions were filtered through a glass fiber filter membrane (47 mm diameter, 10 µm pore size) to prevent interference from external MPs. In addition, a laboratory blank set was prepared during sample pretreatment [35]. The same volume of ultrapure water was used to replace the seawater samples, and was treated as the other samples were throughout the procedure. The results showed that no MPs were detected in the laboratory blank set.

2.5. Statistical Analysis

Data on the abundance, size, color, and shape of MPs were processed using Microsoft Excel 2019, then plotted using Origin 2023 and expressed as mean plus standard deviation. Analysis of the normal distribution was first used in SPSS 27, and if significance was less than 0.05, a non-parametric test (Kruskal–Wallis test) was performed; if significance was greater than 0.05, this was consistent with a normal distribution, and one-way analysis of variance (ANOVA) was used to determine spatial tidal areas and station differences. All MP correlations were significant at p < 0.05, p < 0.01, and p < 0.001. Location maps were plotted using Google Earth.

3. Results

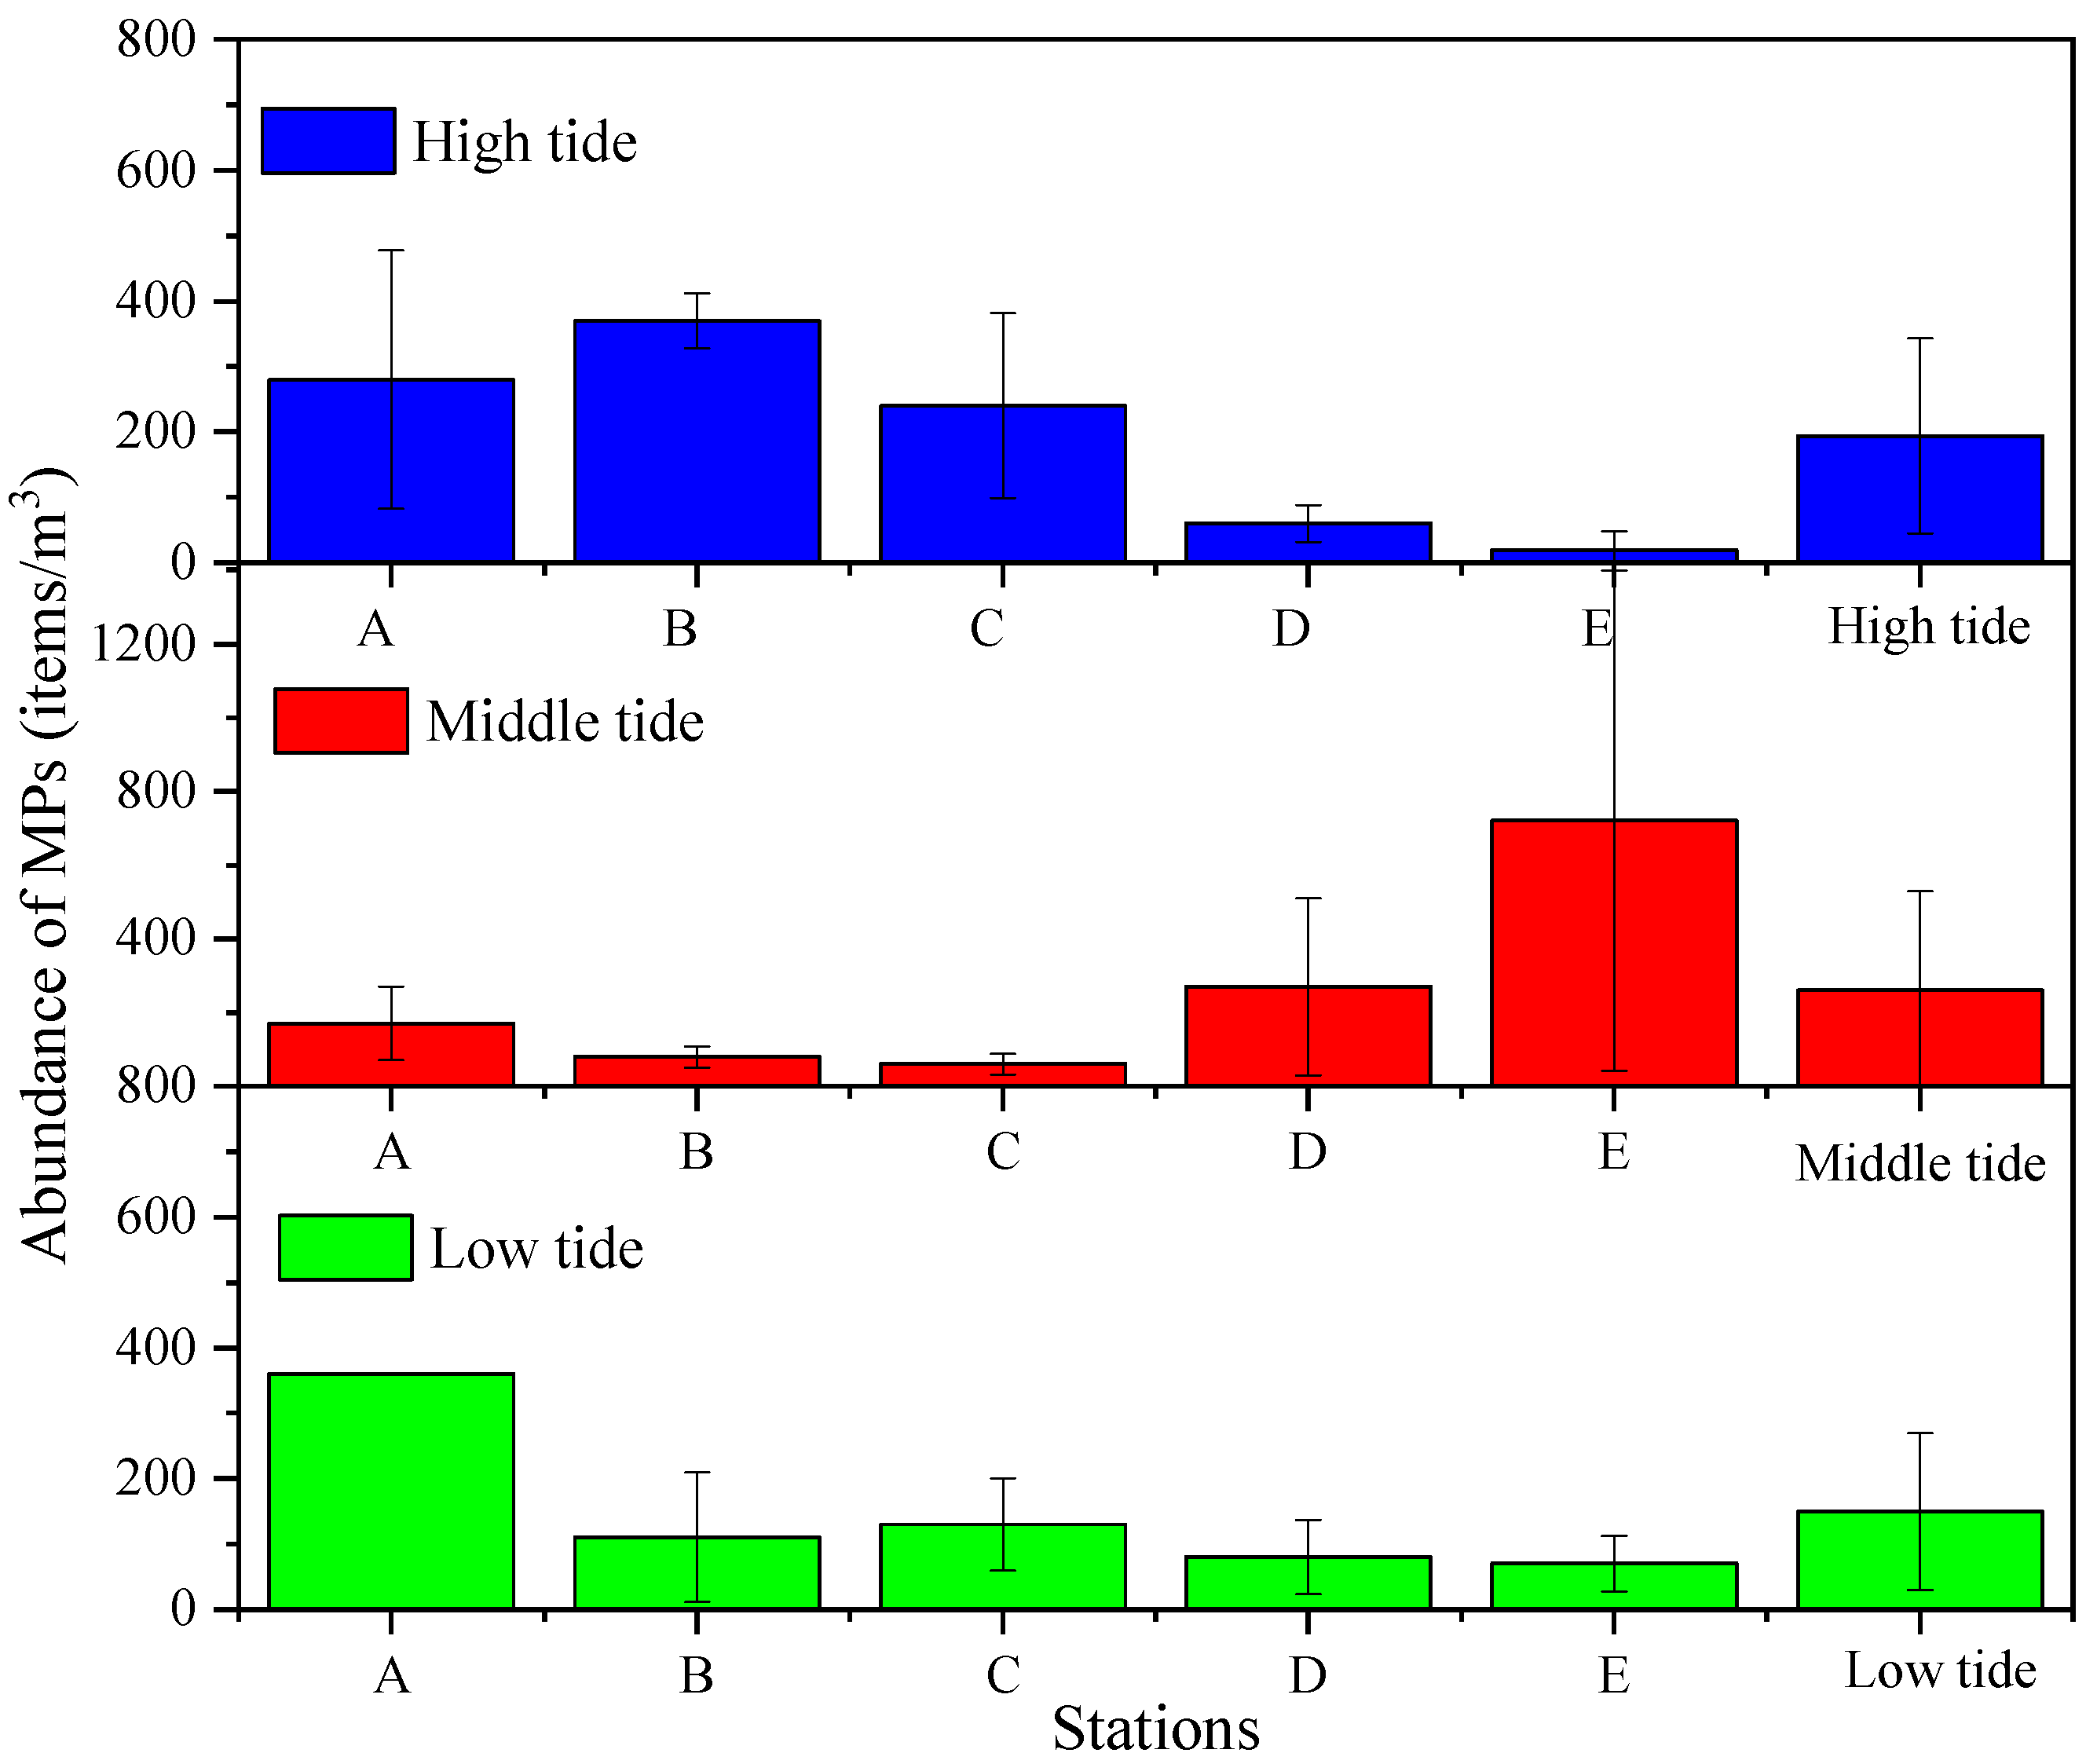
3.1. Abundance of MPs in the Bathing Seawater Affected by the Ebb Tide

The spatial distribution of MPs in the bathing seawater is shown in Figure 3. The mean abundance of MPs in the bathing seawater was 210.3 ± 183.0 items·m−3. The abundance of MPs was a maximum at mid tide and a minimum at low tide, with 194.0 ± 148.9 items·m−3 at high tide, 260.0 ± 270.3 items·m−3 at mid tide, and 150.0 ± 119.8 items·m−3 at low tide. In addition, the abundance of MPs detected at station A was in the middle to upper level among the three tidal periods, no less than 150.0 items·m−3. The abundances of MPs detected at stations B and C were highest at high tide, while the abundances of MPs detected at stations D and E were highest at mid tide. The MP abundance at station E was the most variable among the three tidal periods; it was the lowest at high tide, with only 20.0 items·m−3, but the highest at mid tide, with 720.0 items·m−3, accounting for 55.4% of the total at mid tide.

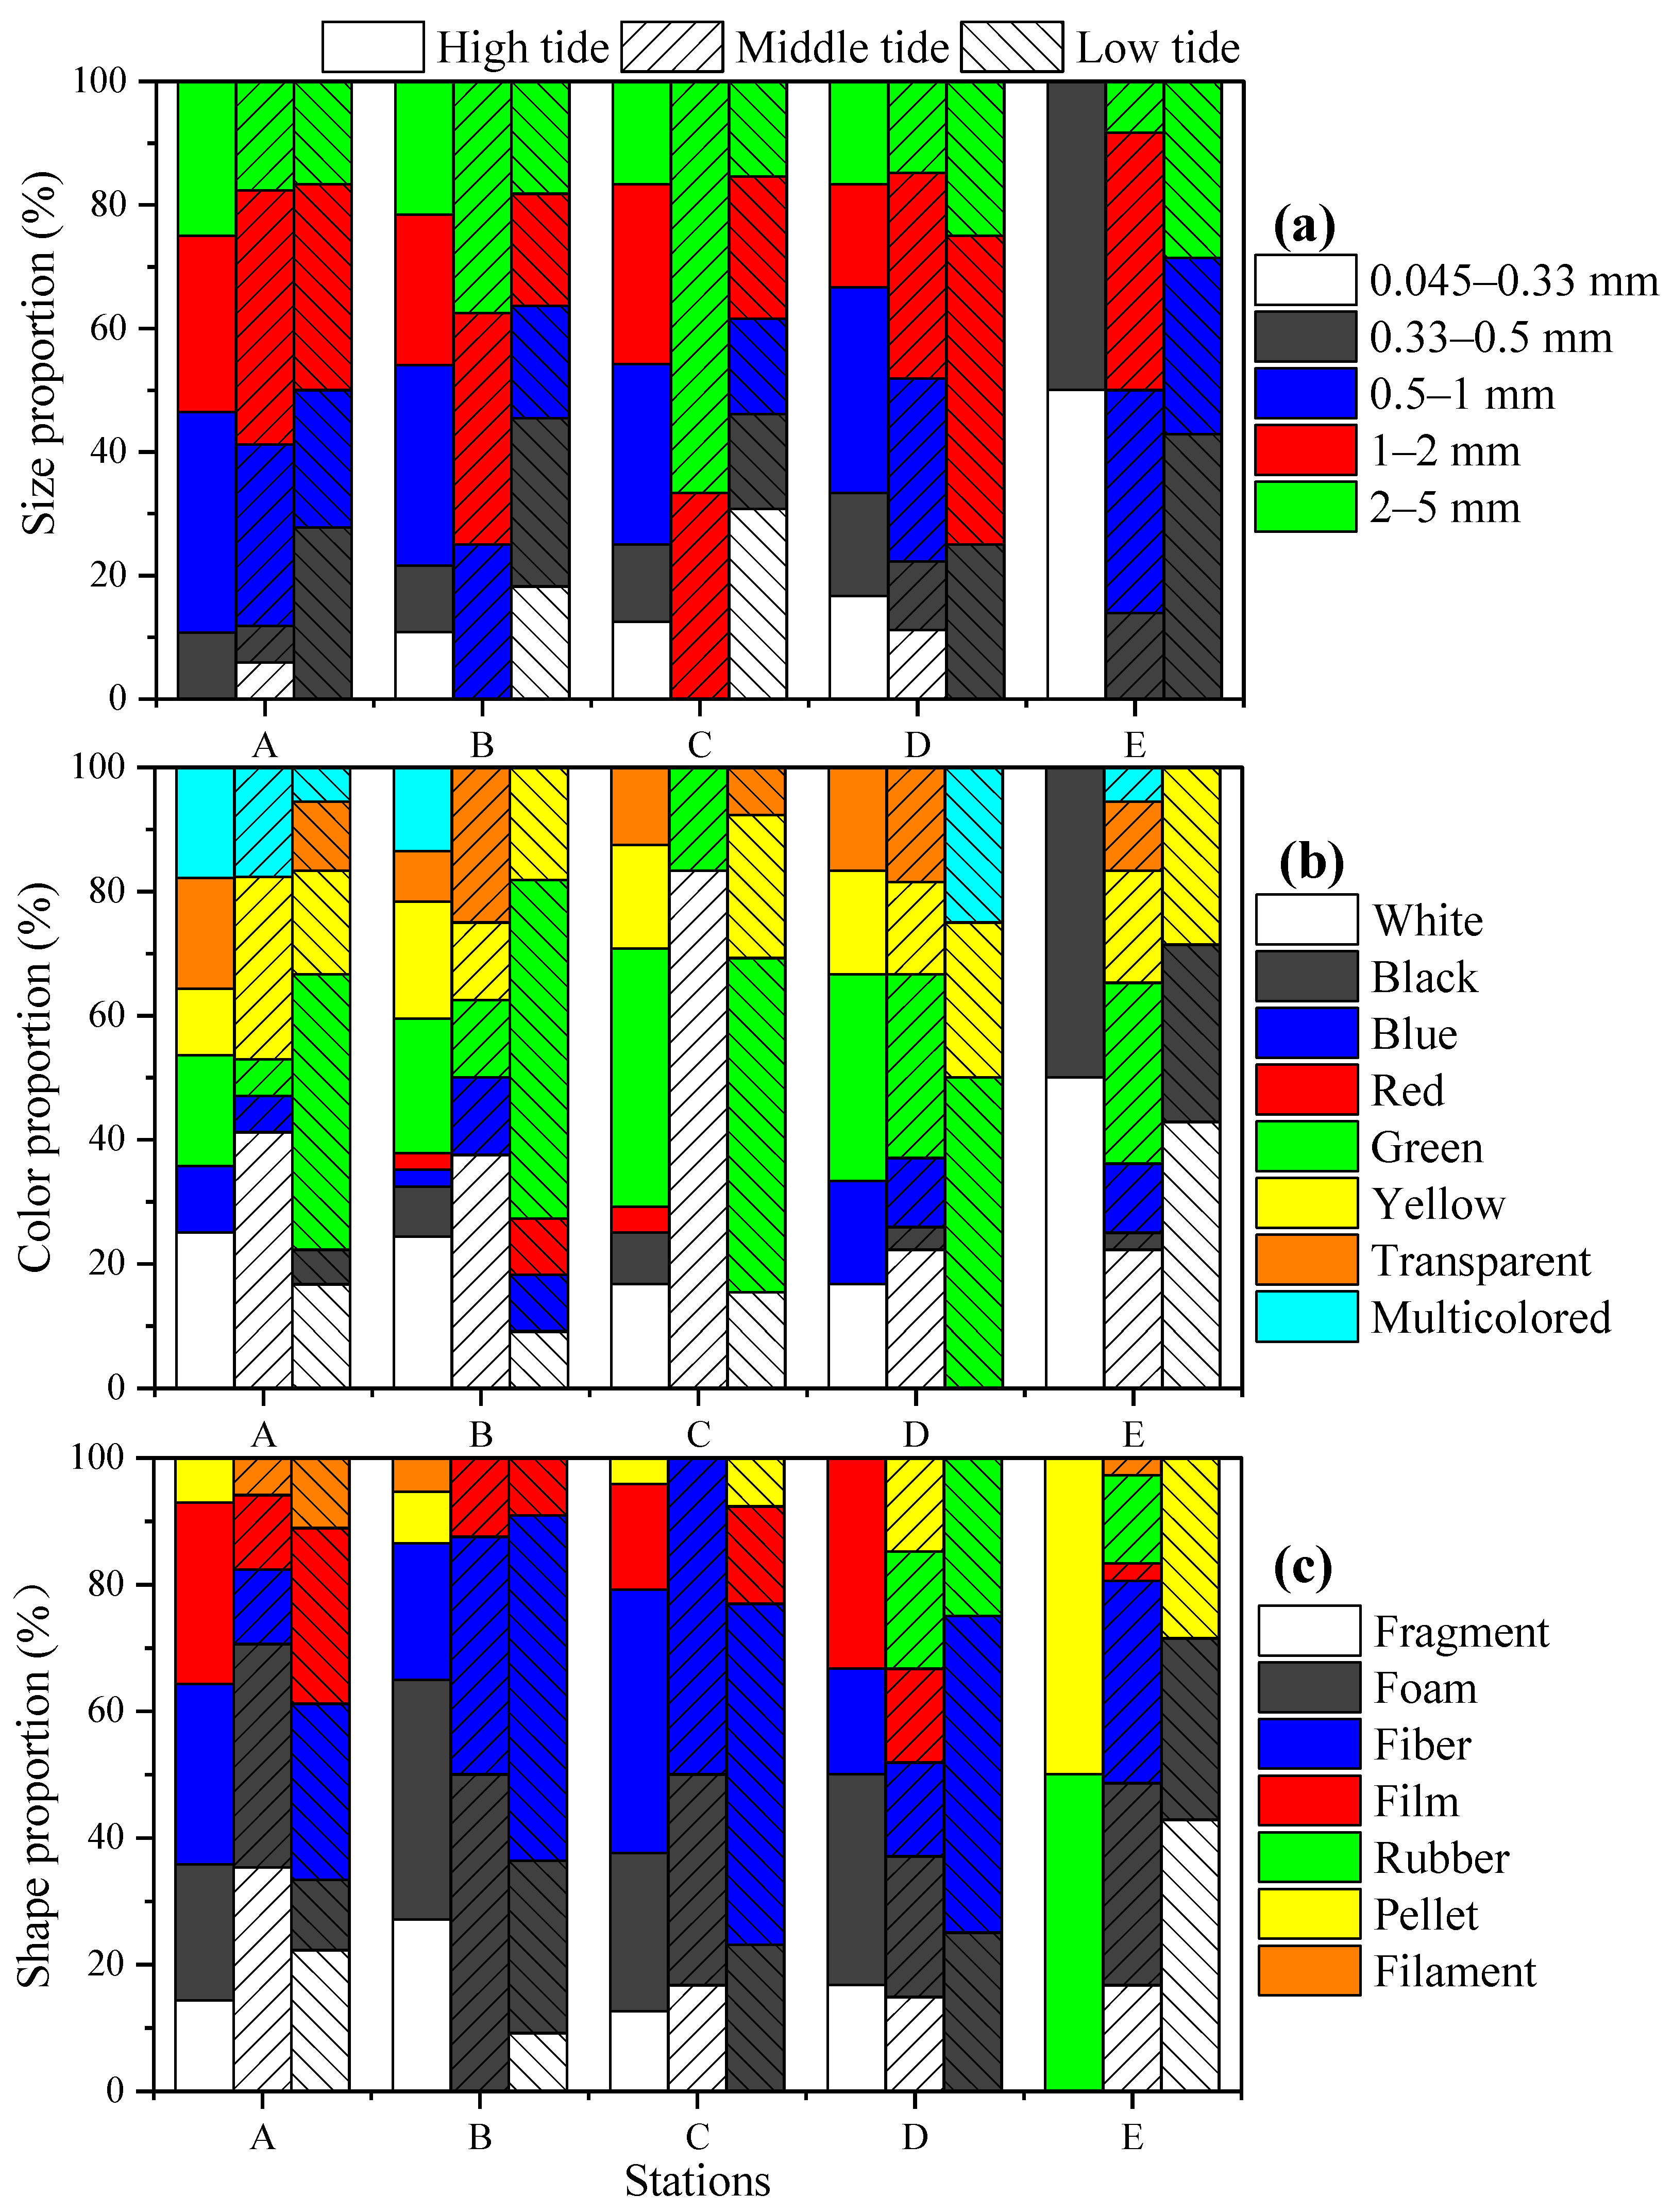
3.2. Sizes, Colors, Shapes, and Polymer Types of MPs in the Bathing Seawater Affected by the Ebb Tide

The results showed no difference in MP size among the three tidal periods and stations (p > 0.05) (Figure 4a). The most detected MPs were 1–2 mm (32.1%), and the least detected MPs were 0.045–0.33 mm (6.3%). At high tide, there were five sizes of MPs at stations B, C, and D in the bathing area, and the proportions of 0.5–1 mm MPs were all greater than 25.0%. At mid tide, five MP sizes were detected simultaneously at stations A and D. MPs of 1–5 mm were detected at station C, and MPs of 1–2 mm and 2–5 mm at station C both accounted for more than 30.0%. At low tide, the proportions of 0.33–0.5 mm and 1–2 mm MPs were both greater than 25.0% at stations A and D, and the proportions of 0.5–1 mm and 2–5 mm MPs were equal at stations B (18.2%), C (15.4%), and E (28.6%).
Additionally, the results of the survey showed a difference in the multicolored MPs among the three tidal periods (p < 0.05) (Figure 4b). The most detected MP colors were green (29.8%) and white (23.5%), while red (1.0%) was the least detected. At high tide, eight colors were detected at station B. Only two colors were detected at station E, white (50.0%) and black (50.0%). At mid tide, seven colors were detected at station E. Only white (83.3%) and green (16.7%) were detected at station C. At low tide, station E had the most white MPs (42.9%), and the other stations had the most green MPs, with 44.4%, 54.5%, 53.8%, and 50.0%.
Moreover, there was no difference in MP shape among the three tidal periods and stations in the results (p > 0.05) (Figure 4c). Fibers accounted for the largest percentage of all samples (29.5%), and filaments represented the smallest (3.0%). At high tide, only rubber and pellets were present at station E, accounting for half of each (50.0%). Only filaments were detected at station B (5.4%). At mid tide, except for station C, the other four stations had the largest proportion of foam, accounting for 35.3%, 50.0%, 22.2%, and 31.9%. At low tide, except for station E, the other stations had the largest proportion of fibers, with 27.8%, 54.5%, 53.8%, and 50.0%.
Different main polymers were found in selected samples of green fragments (a), white foam (b), transparent fiber (c), and blue film (d), with the main types including polypropylene (PP), polystyrene (PS), cellulose (CE), and PP (Figure S1).

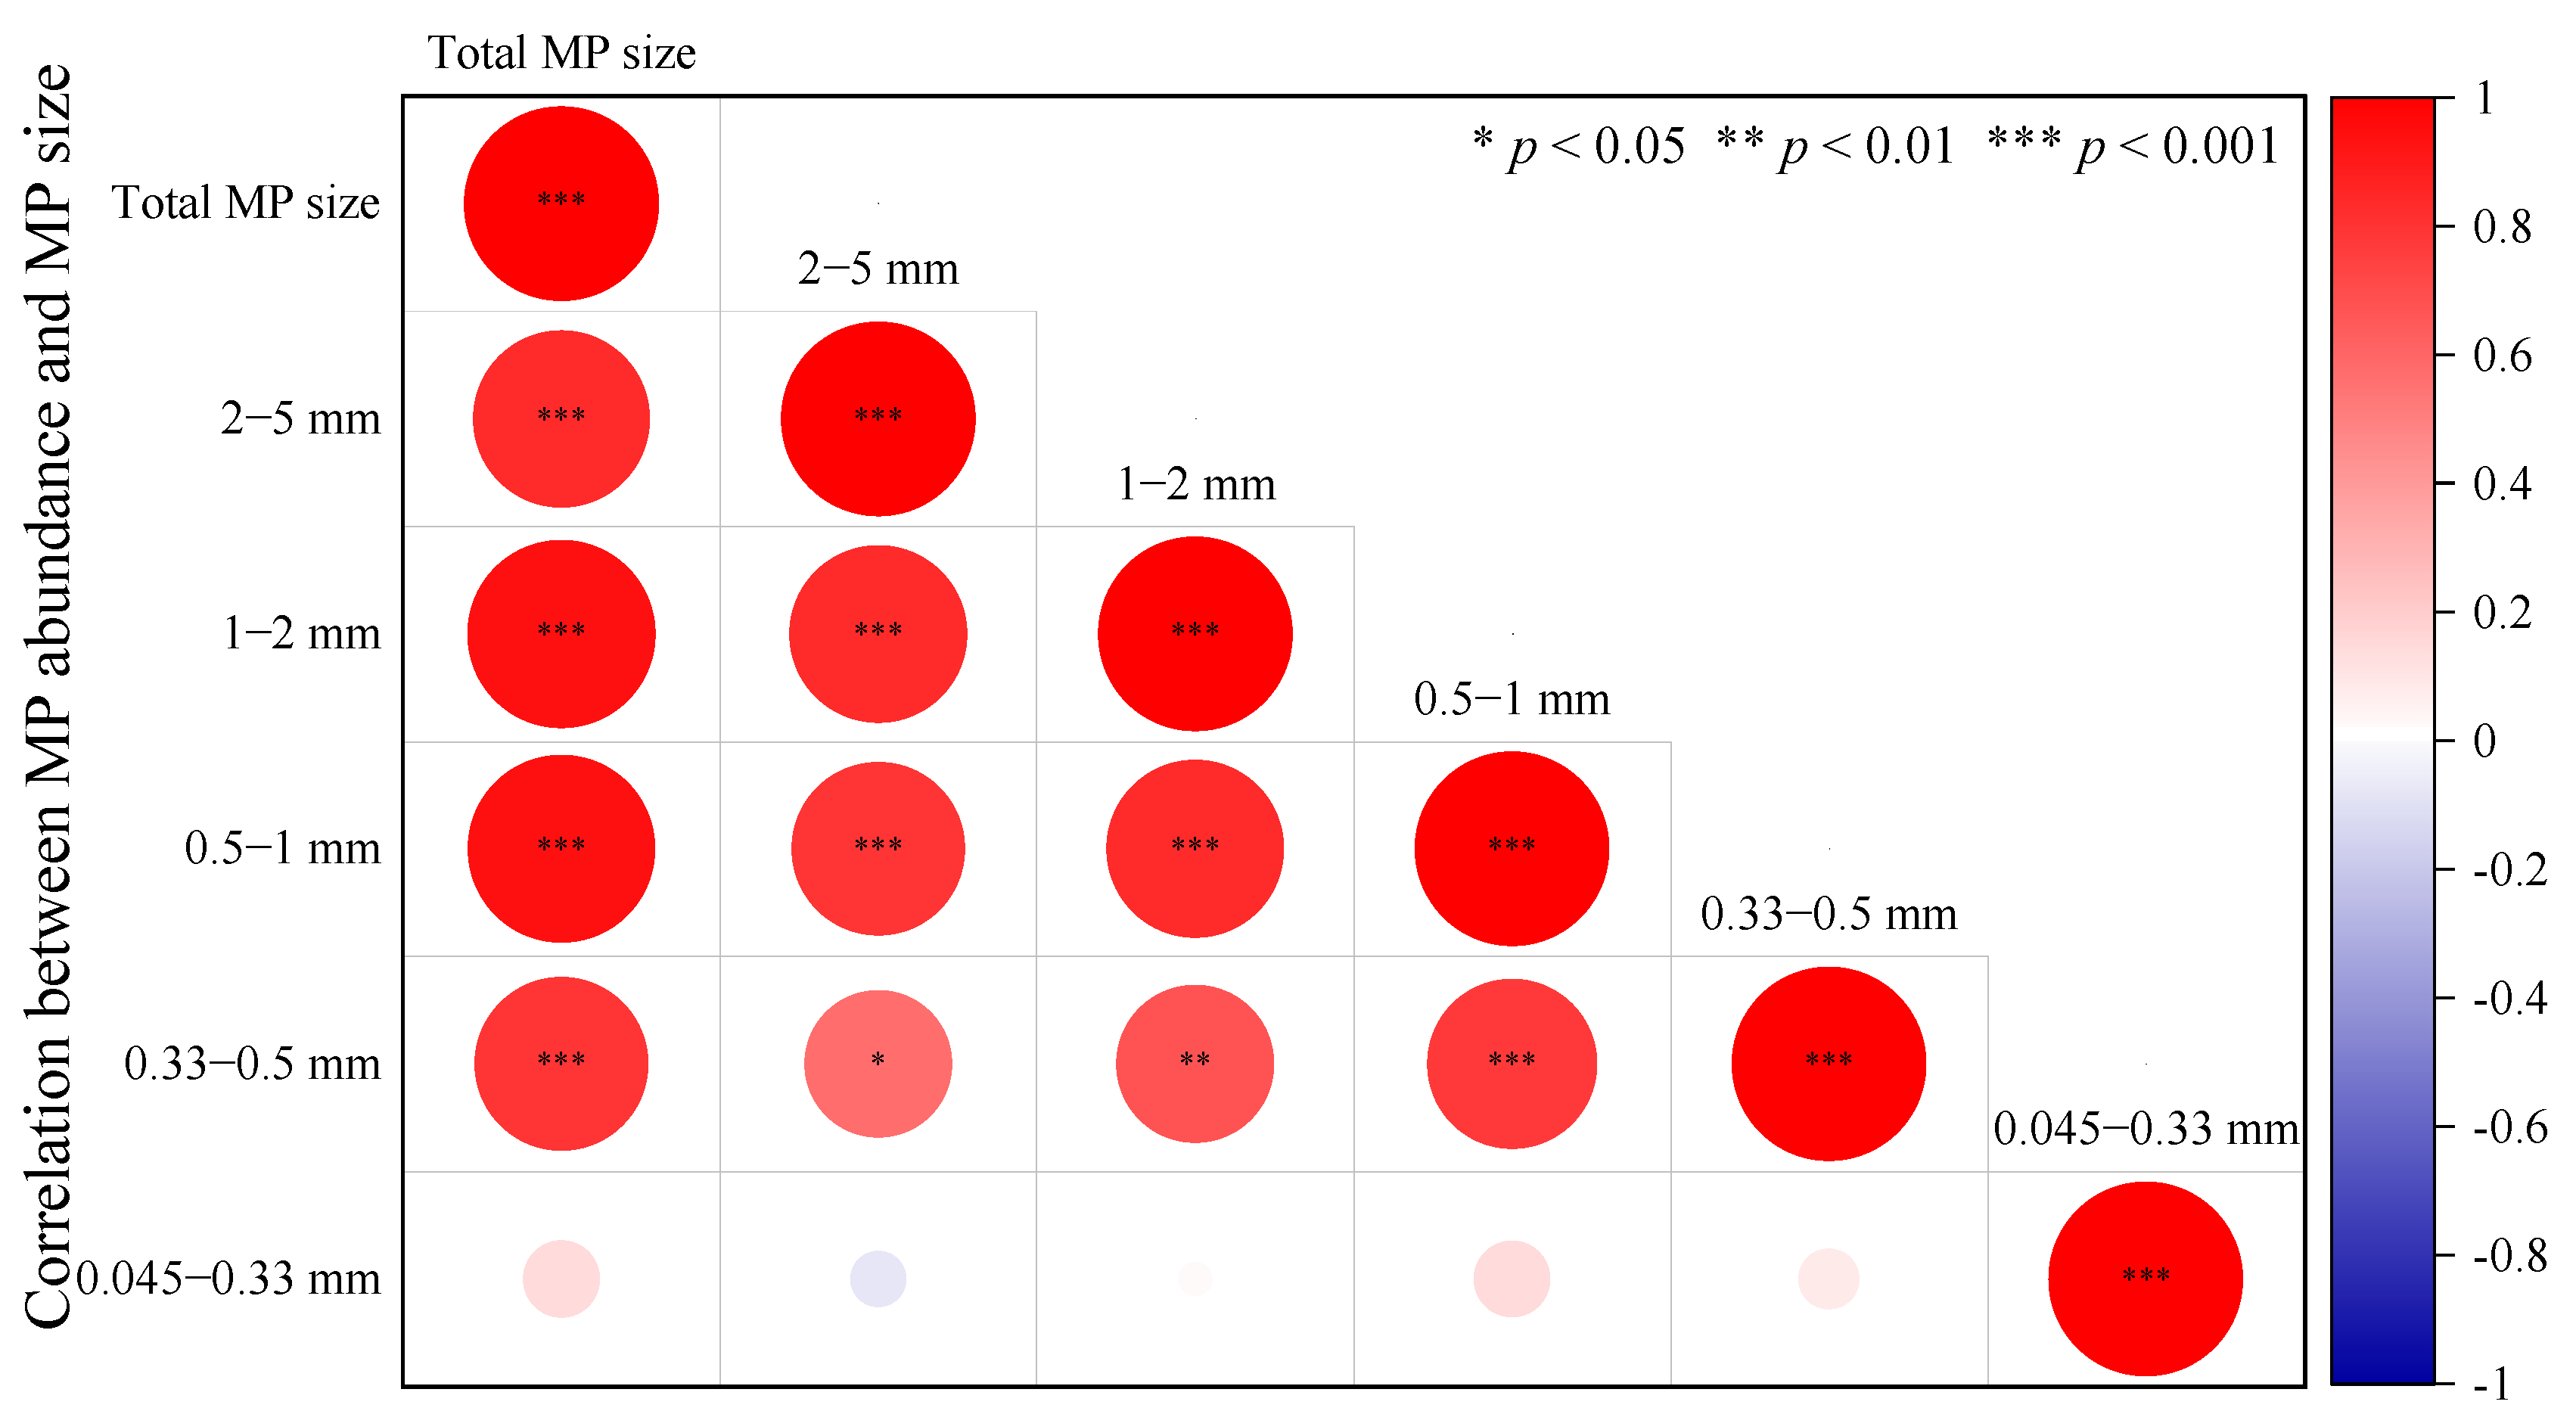
3.3. Relationships between MP Abundance and the Different Sizes of MPs in the Bathing Seawater Affected by the Ebb Tide

Correlation analysis of the abundance of MPs and MP size is shown in Figure 5. MPs that were 0.045–0.033 mm had no significant correlation with all other MP sizes (p > 0.05). Total MP size was significantly positively correlated with MPs of grain size 0.33–5 mm (p < 0.001). MPs that were 2–5 mm were extremely significantly correlated with 0.5–2 mm MPs (p < 0.001), and correlated highly with MPs of 0.33–0.5 mm (p < 0.05). MPs of 1–2 mm were extremely significantly correlated with MPs of 0.5–1 mm (p < 0.001), and significantly correlated with MPs of 0.33–0.5 mm (p < 0.01). MPs of 0.5–1 mm were significantly correlated with MPs of 0.33–0.5 mm (p < 0.001).

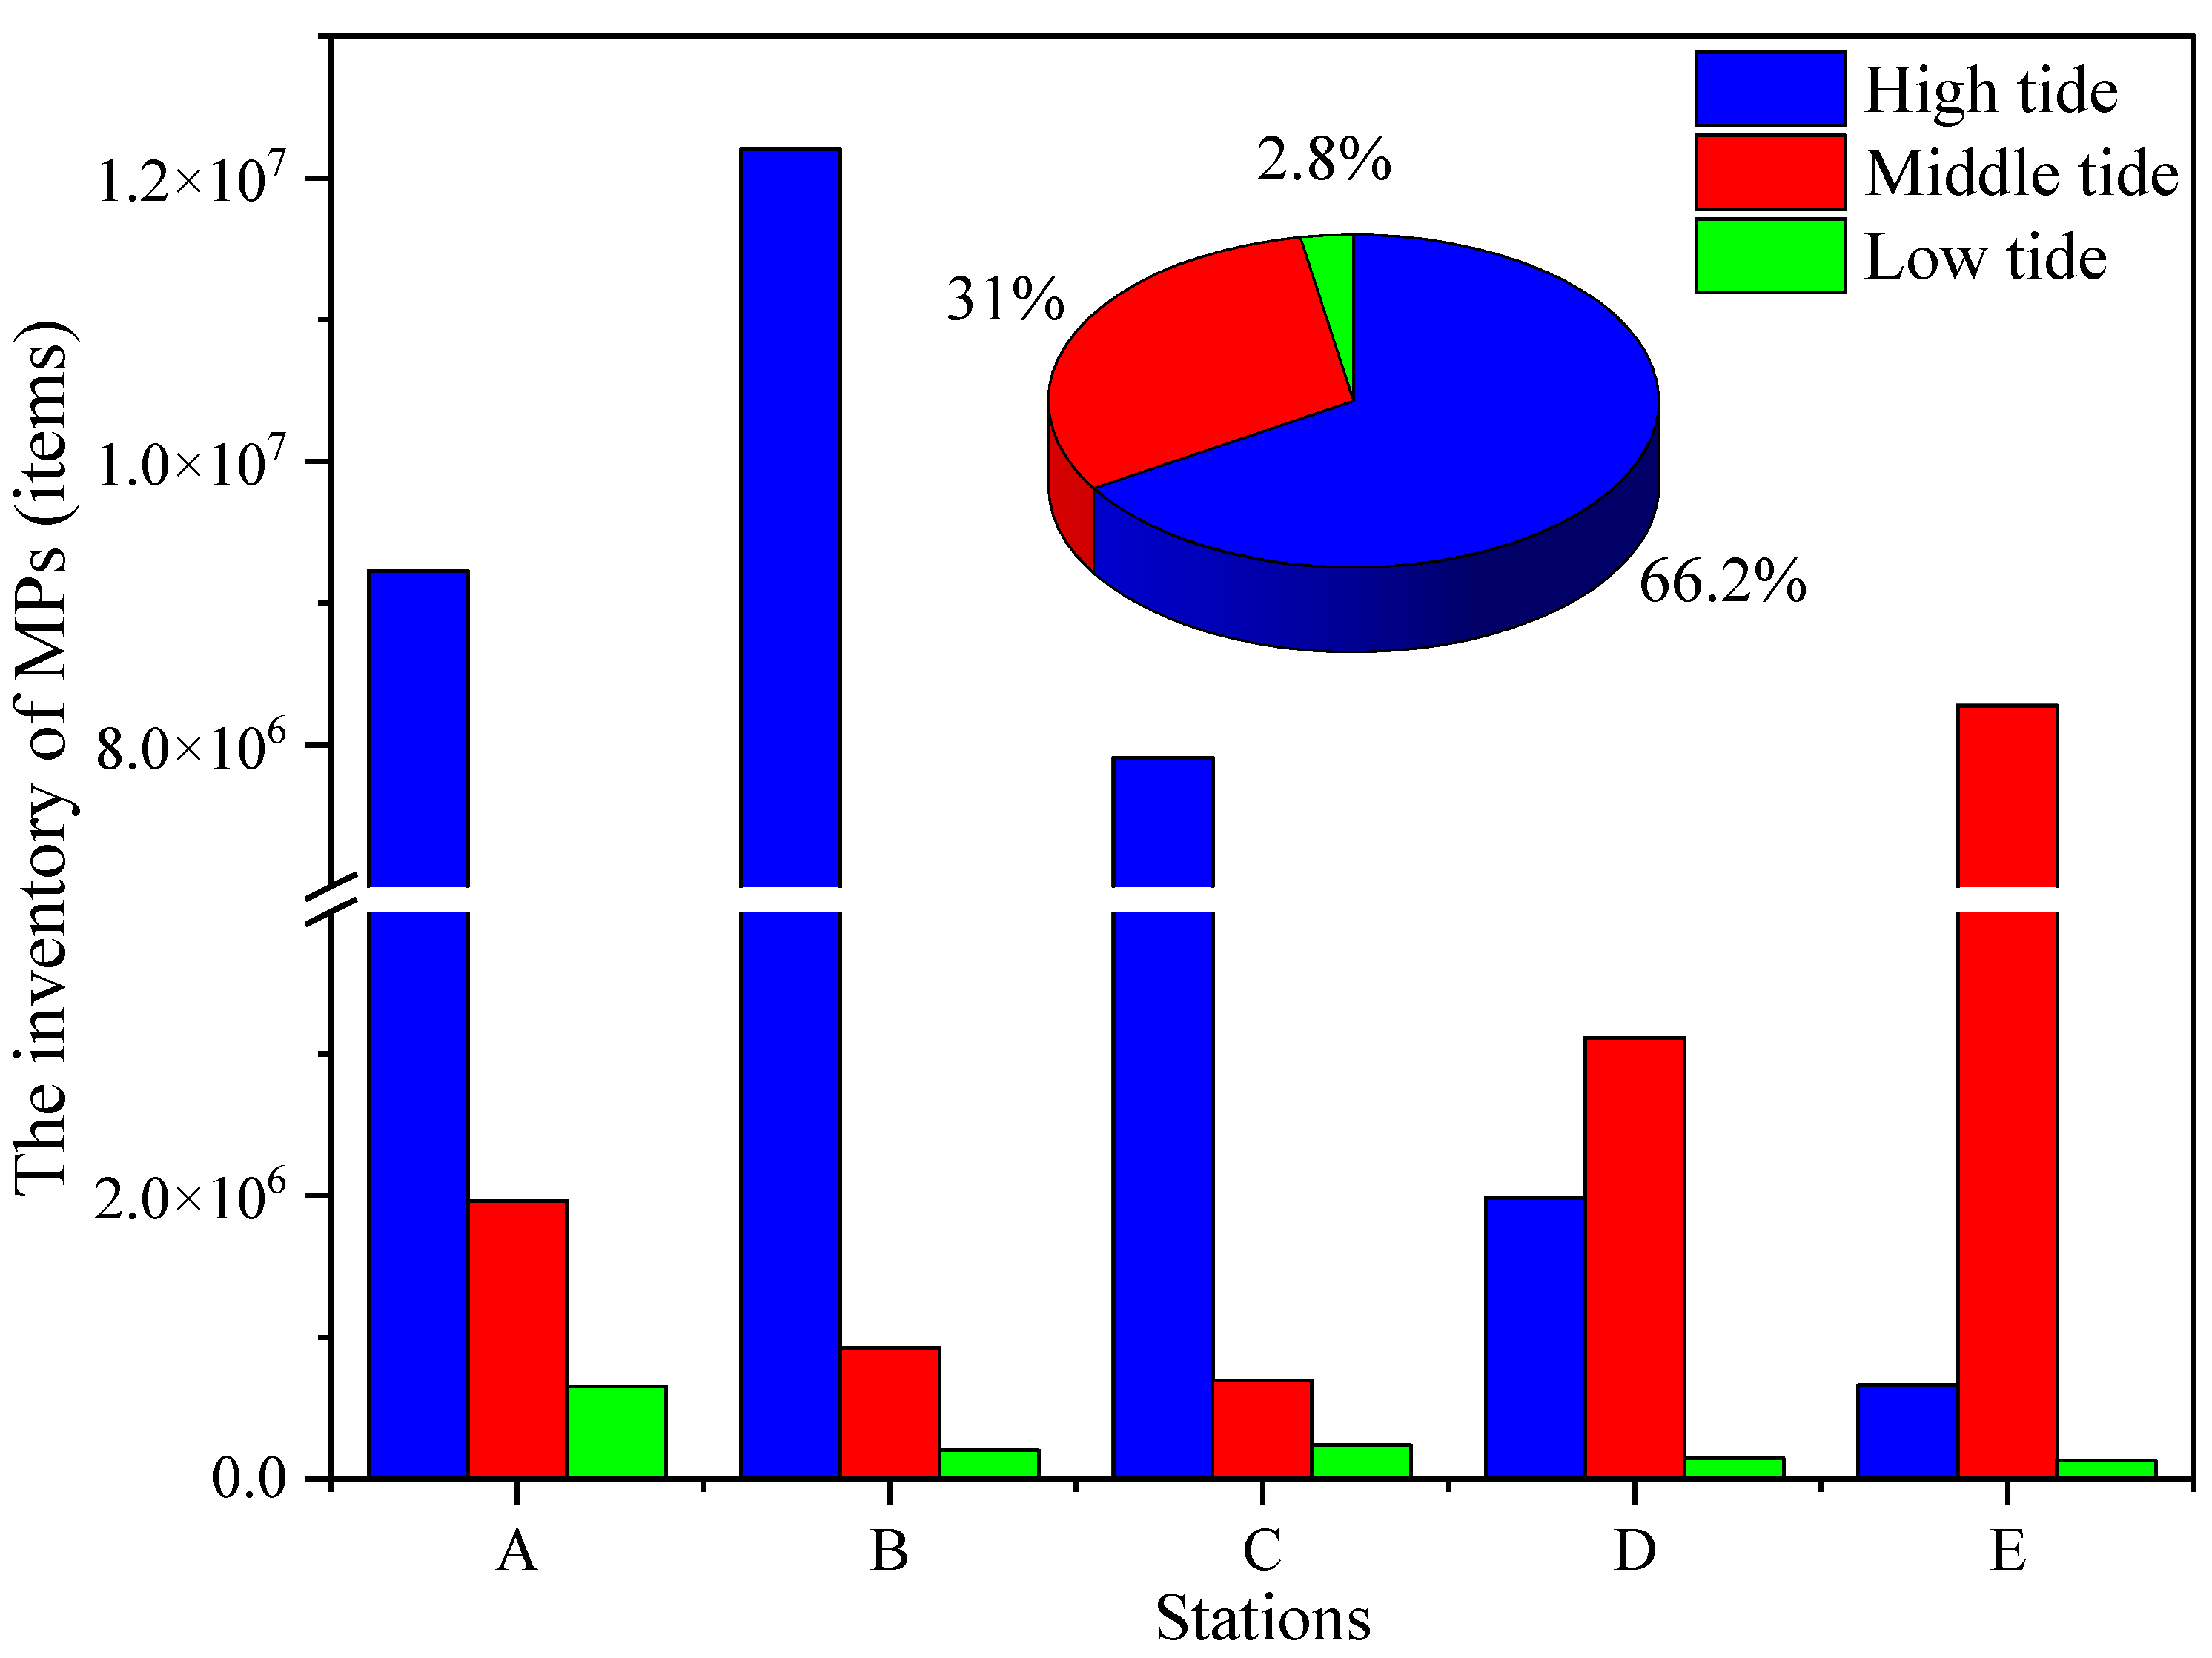
3.4. Quantifying the Inventory of MPs in the Bathing Seawater Affected by the Ebb Tide

The inventory of MPs present in the bathing seawater for each tide was quantified on the basis of the individual area of each block using Equation (1) (Figure 6). The average MP inventory was 3.2 × 10⁶ items, ranging from 1.3 × 10⁵ to 1.2 × 10⁷ items. Overall, the MP inventory was the largest during high tide (66.2%), followed by middle (31.0%), and low tide (2.8%). The MP inventory was distributed differently among different stations under different tidal influences. At stations A, B, and C, the MP inventory was the highest at high tide, accounting for 78.0%, 91.6%, and 89.5%, respectively. The second was the MP inventory at mid tide, and the last was at low tide. The MP inventory at stations D and E was the highest at mid tide, accounting for 59.4% and 91.3%, respectively, followed by the MP inventory at high tide, and the MP inventory at low tide.

4. Discussion

4.1. MP Pollution Levels in the Bathing Seawater

The results of this study indicated that MP contamination occurred in the bathing seawater at YPB in ZJB at a low level compared to other seawater or bays worldwide. As data on MPs in bathing waters in freshwater ecosystems were still limited, we compared our results with some other findings in marine environments [36,37,38,39,40] and freshwater [41,42,43,44,45] (Table 1). However, direct comparisons remained complex, due to differences in sampling methods, size limitations, and selected ecosystems [36,40,41]. For other environmental analyses related to MPs, sampling homogenization and data processing were required [46]. Given these limitations, our data appeared to be largely consistent with those reported in other studies [37,39,41]. However, MPs in the bathing water were lower compared to Xiamen [36], South China Sea [38], Longjiao Bay [43], Xiangshan Bay [44], and Rayong Province, Thailand [45], but much higher than the Black Sea [40] and Jiaozhou Bay [42]. The pollution levels of MPs in different sea areas can reflect local economic development and marine conservation. In Xiamen [36], MP abundance in surface seawater was determined using 330-micrometer trawl sampling methods. The MP abundance in this study was higher than that on the marine beach of Yugang Park, possibly because different sampling methods were used, and the abundance was more influenced by population density [47]. Other studies have used smaller size stainless steel sieves or buckets ranging from 20–75 μm. The lower size limit in our study was 45 μm. MP pollution in the South China Sea, Longjiao Bay, and Rayong Province, Thailand, were all an order of magnitude higher than in our study; this was likely due to harbors, recreational activities [48,49], surface currents [38], mariculture [42], and sewage discharges from urban and industrial areas, as well as tourist and marine activities on beaches [45,50]. The low abundance of MPs in the Black Sea may be due to the dilution of MP concentrations, low industrial and human activities, and high rainfall [40]. Jiaozhou Bay was consistent with our sampling volume; both results were based on 50 L of seawater in bulk, and the errors of the sample size ambassador results were small; however, its abundance was less than ours, probably resulting from differences in sampling methods and treatment identification methods [43]. YPB had a beautiful landscape, a pleasant climate, many tourists, and well-developed shipping. Based on the above comparison, the cause of MP contamination at YPB may be influenced by environmental factors (marine physical–chemical–biological processes), as well as beach recreational activities.

4.2. Interactions between MP Abundance and Their Different Sizes

The correlation analysis between MPs of 0.045–5 mm and their corresponding abundance is shown in Figure 5. The abundance of 0.33–5 mm MPs in the bathing seawater was significantly correlated with their size (p < 0.05), which was similar to findings of previous studies on YPB [25]. However, the authors studied the relationship between MP abundance and grain size of sand samples, while we studied the relationship between MP abundance and their sizes. MPs of these sizes were from the same source, possibly due to river discharge from domestic land, ship spills, or foreign currents [51], while 0.045–0.33 mm MPs were from multiple sources, possibly produced by the weathering of macro-, meso-, and large microplastics on the beach [52], and possibly in part by ocean stranding [53,54]. In this study, the sampling time coincided with the Mid-Autumn Festival holiday in China; there were frequent tourist activities at YPB. Human activities increased the number of large MPs. Large MPs (2–5 mm) were decomposed into medium MPs (0.5–2 mm), and medium MPs were further degraded into small MPs (0.045–0.5 mm) due to physical–chemical–biological effects [55,56]. The results showed that the highest number of MPs with size 0.5–2 mm was followed by 0.33–0.5 mm and 2–5 mm, while 0.045–0.33 mm represented the lowest in number. This was because MPs from distant waters were carried into shallow areas, while MPs from beaches entered shallow waters due to tidal movements (experiencing long-term surface churning from wave upwelling/backwash and internal backwash due to infiltration), resulting in the highest number of medium-sized MPs detected, and a lower number of small MPs [57].

4.3. Controlling Factors of MP Dynamics in the Bathing Seawater

The production and release of MPs are indisputably dependent on human activities, socioeconomic conditions, etc.; however, their distribution in the marine environment is highly dependent on several environmental and physical processes and features such as particle shape [20], particle density [58], tidal variations [59], surface currents, and wind-induced drift [60,61].
Tidal variation was the main factor contributing to the uneven distribution of MPs in the bathing seawater affected by the ebb tide. From the results, it was clear that MP abundance gradually decreased from south to north at high tide, while at mid tide, MP abundance showed an opposite trend to that at high tide. At low tide, the abundance of MPs was similar in the bathing seawater. The variation trend in MP inventory was the same as that of MP abundance. This may be because the north side (station E) was higher and the water level was lower at high tide compared to the south, so it could accumulate more MPs. The velocity of water flow at mid tide was greater compared that at high and low tides, which diluted the concentration of MPs; thus, the concentration of MPs showed a decreasing trend. The low tide water velocity was slow and the water level was the lowest; MPs may have been deposited on the bottom, so that the MPs became uniformly distributed. In addition, human activities were a significant cause of MP accumulation in seawater [62,63]. The coastal areas of ZJB were mostly tourist attractions, with substantial mariculture and corporate production and shipping [64]. Various shapes of MPs were detected in the bathing seawater area. By observation, except for station E, the other four stations in the bathing area all had the largest proportion of foam and fiber content at high, mid, and low tides; this indicated that offshore fishing and tourism in ZJB promote the production of foam and fibers [25]. The results showed that the distribution of foam was mid tide > high tide > low tide; the distribution of fragments was mid tide > low tide > high tide; and the distribution of fibers was low tide > mid tide > high tide. Furthermore, the polymer compositions of foam, fragments, and fibers were PS, PP, and CE, respectively, with the former two having lower densities than the seawater density in ZJB (which was heavily eutrophic and saline [27]); the latter had higher densities, indicating a predominant accumulation of lightweight polymers on the beach whose source was longitudinal transport from the water surface [46]. As a side note, more inventory of MPs was detected at the two stations outside the bathing seawater area (stations A and E) than inside the bathing seawater area (stations B, C, and D), suggesting that the baths may play a dual role of intercepting beach MPs into the ocean and ocean MPs into the beach [65]. Moreover, multicolored MPs were significantly different among tides (p < 0.05), and were only detected at stations B1 and D3 at the interception boundary among the nine stations within the bathing area; this may be the result of regular trash removal by workers. Also, ZJB is subject to the southwest monsoon year-round, and heavy rainfall in the bay usually occurs in the fall and summer (75% of the annual rainfall) [66]. The time of sampling in this study coincided with autumn, and the low abundance of MPs in the bathing seawater corroborated with a large amount of rainfall runoff that washed away the MPs and diluted their concentration [67].

4.4. Mitigation Strategy for MP Pollution in the Bathing Seawater

To develop targeted mitigation actions, a better understanding of the combined causes of regional variability in MP density, weight, composition, and sources in the bathing seawater is needed. Therefore, establishing monitoring programs is essential to facilitate an understanding of changes in MP pollution [68,69]. The abundance of MPs at different tidal periods indicated that relatively large amounts of MPs were found in coastal seawater [70]. The seawater carried MPs from the beaches into the sea at high tide; they appeared in shallow water at low tide, and then were carried into deep water. In the results, the number of MPs gradually increased and then decreased with increasing size, indicating that larger waste plastic fragments mostly split from weathering, oxidation, and into medium plastic fragments, which then continued to split into MPs [71,72]. Therefore, scenic areas should increase cleaning of the small, medium, and large debris, and also strictly control the hygiene of vendors in public places [62,73,74]. The mariculture industry in ZJB was well developed, and plastic materials used in its rapid development were widely used. MPs from lower nutrient levels may ultimately affect human health [75], as human consumption of whole marine organisms in large quantities increases the risk of human exposure to MPs [76]. Therefore, rationed or reduced use of macro-, meso-, and microplastic materials can reduce the impact on the ocean and organisms [77]. Moreover, studies have shown that MPs were mostly white and green in color, foam and fiber in shape, and PS and CE in polymer type, which may be caused by the widespread use of MPs for cleaning products [78], and by the impact of domestic sewage and corporate wastewater discharge on water quality [79]. In addition, CEs could flow with sewage discharge pipes to rivers, and then to the ocean because of their higher density than seawater and their lighter weight. Therefore, the government should control the discharge of domestic sewage, and strictly monitor the discharge of corporate wastewater. In addition, their low density and light weight lead to a great amount of PP and PS floating on the surface of seawater, so it is important to control plastic pollution from the development of the travel and fishing industry.

5. Conclusions

This study collected water samples from the bathing seawater during high, mid, and low tidal periods, respectively. The mean abundance of MPs in bathing seawater was at a low level compared to other areas of seas and bays, and was greatest at mid tide, followed by high and low tides. MPs detected in the bathing seawater were mainly 1–2 mm; white and green colors were the most common; foam and fiber shapes were the most abundant; and PE, PP, and CE were the dominant polymer types. The relationship between MPs of 0.045–5 mm and their abundance was simulated, and MPs of 0.33–5 mm were significantly different from their abundance (p < 0.05). Due to limitations of the survey method, there may have been an over- or underestimation of MP inventory. The inventory of MPs in the bathing seawater was estimated to be 66.2% at high tide, 31.0% at mid tide, and 2.8% at low tide. The results showed that tidal variations greatly impacted MP pollution in the bathing seawater. During the study of tidal variability, relatively few physical parameters were studied, no observations of currents and wind speeds were made, and the time scales of the observations were short. In the future, long-term and large-scale studies should be conducted to further investigate the effects of currents and wind speeds on the fate of MPs in marine ecosystems.

Supplementary Materials

The following supporting information can be downloaded at: https://www.mdpi.com/article/10.3390/jmse10121947/s1.

Author Contributions

Conceptualization, P.Z. and J.Z.; methodology, P.Z. and J.Z.; software, H.Z. and S.W. (Shujia Wang); validation, S.W. (Shanshan Wei) and Q.J.; formal analysis, P.Z., H.Z. and S.W. (Shujia Wang); investigation, H.Z. and S.W. (Shanshan Wei); resources, P.Z. and J.Z.; data curation, H.Z., S.W. (Shujia Wang), S.W. (Shanshan Wei) and Q.J.; writing—original draft preparation, H.Z., S.W. (Shujia Wang), and P.Z.; writing—review and editing, H.Z., P.Z. and J.Z.; visualization, S.W. (Shanshan Wei) and Q.J.; supervision, P.Z. and J.Z.; project administration, P.Z. and J.Z.; funding acquisition, P.Z. and J.Z. All authors have read and agreed to the published version of the manuscript.

Funding

This research was funded by the Research and Development Projects in Key Areas of Guangdong Province (2020B1111020004), Guangdong Basic and Applied Basic Research Foundation (2020A1515110483), Guangdong Ocean University Fund Project (R18021); Science and Technology Special Project of Zhanjiang City (2019B01081); First-class Special Fund (231419018); Innovation Strong School Project of Guangdong Ocean University (230420007), and Guangdong Province College Student Innovation and Entrepreneurship Plan (S202210566007).

Institutional Review Board Statement

Not applicable.

Informed Consent Statement

Not applicable.

Data Availability Statement

Data sharing is not applicable to this article.

Acknowledgments

Thanks for the financial support provided by the Research and Development Projects in Key Areas of Guangdong Province (2020B1111020004); Guangdong Basic and Applied Basic Research Foundation (2020A1515110483); Guangdong Ocean University Fund Project (R18021); Science and Technology Special Project of Zhanjiang City (2019B01081); First-class Special Fund (231419018); Innovation Strong School Project of Guangdong Ocean University (230420007), and Guangdong Province College Student Innovation and Entrepreneurship Plan (S202210566007). Special thanks to reviewers for their careful review and constructive suggestions. Thanks to all members of the research team and others involved in this study.

Conflicts of Interest

The authors declare no conflict of interest.

References

  1. Derraik, J.G.B. The pollution of the marine environment by plastic debris: A review. Mar. Pollut. Bull. 2002, 44, 842–852. [Google Scholar] [CrossRef] [PubMed]
  2. Rios, L.M.; Moore, C.; Jones, P.R. Persistent organic pollutants carried by synthetic polymers in the ocean environment. Mar. Pollut. Bull. 2007, 54, 1230–1237. [Google Scholar] [CrossRef] [PubMed]
  3. Thompson, R.C.; Moore, C.J.; vom Saal, F.S.; Swan, S.H. Plastics, the environment and human health: Current consensus and future trends. Phil. Trans. R. Soc. B Biol. Sci. 2009, 364, 2153–2166. [Google Scholar] [CrossRef] [PubMed]
  4. Geyer, R.; Jambeck, J.R.; Law, K.L. Production, use, and fate of all plastics ever made. Sci. Adv. 2017, 3, e1700782. [Google Scholar] [CrossRef] [PubMed] [Green Version]
  5. Singh, P.; Sharma, V.P. Integrated plastic waste management: Environmental andimproved health approaches. Procedia Environ. Sci. 2016, 35, 692–700. [Google Scholar] [CrossRef]
  6. Lee, J.; Hong, S.; Song, Y.K.; Hong, S.H.; Jang, Y.C.; Jang, M.; Heo, N.W.; Han, G.M.; Lee, M.J.; Kang, D.; et al. Relationships among the abundances of plastic debris in different size classes on beaches in South Korea. Mar. Pollut. Bull. 2013, 77, 349–354. [Google Scholar] [CrossRef]
  7. Barnes, D.K.A.; Galgani, F.; Thompson, R.C.; Barlaz, M. Accumulation and fragmentation of the plastic debris in global environments. Phil. Trans. R. Soc. B Biol. Sci. 2009, 364, 1985–1998. [Google Scholar] [CrossRef] [Green Version]
  8. Jambeck, J.R.; Geyer, R.; Wilcox, C.; Siegler, T.R.; Perryman, M.; Andrady, A.; Narayan, R.; Law, K.L. Plastic waste inputs from land into the ocean. Science 2015, 347, 768–771. [Google Scholar] [CrossRef]
  9. Hidalgo-Ruz, V.; Gutow, L.; Thompson, R.C.; Thiel, M. Microplastics in the marine environment: A review of the methods used for identification and quantification. Environ. Sci. Technol. 2012, 46, 3060–3075. [Google Scholar] [CrossRef]
  10. Hidalgo-Ruz, V.; Thiel, M. Distribution and abundance of small plastic debris on beaches in the SE Pacifific (Chile): A study supported by a citizen science project. Mar. Environ. Res. 2013, 87–88, 12–18. [Google Scholar] [CrossRef]
  11. Cutroneo, L.; Reboa, A.; Besio, G.; Borgogno, F.; Canesi, L.; Canuto, S.; Dara, M.; Enrile, F.; Forioso, I.; Greco, G.; et al. Microplastics in seawater: Sampling strategies, laboratory methodologies, and identification techniques applied to port environment. Environ. Sci. Pollut. Res. 2020, 27, 8938–8952. [Google Scholar] [CrossRef] [PubMed]
  12. GESAMP. Sources, fate and effects of microplastics in the marine environment: A global assessment. Rep. Stud. 2015, 90, 96. [Google Scholar]
  13. Esiukova, E. Plastic pollution on the Baltic beaches of Kaliningrad region, Russia. Mar. Pollut. Bull. 2016, 114, 1072–1080. [Google Scholar] [CrossRef] [PubMed]
  14. Arthur, C.; Baker, J.; Bamford, H. International Research Workshop on the Occurance, Effects, and Fate of Microplastic Marine Debris; NOAA Tech. Memo. NOS-OR & R-48; National Oceanic and Atmospheric Administration: Tacoma, WA, USA, 2019. [Google Scholar]
  15. Cole, M.; Lindeque, P.; Halsband, C.; Galloway, T.S. Microplastics as contaminants in the marine environment: A review. Mar. Pollut. Bull. 2011, 62, 2588–2597. [Google Scholar] [CrossRef] [PubMed]
  16. Zhang, K.; Shi, H.H.; Peng, J.P.; Wang, Y.H.; Xiong, X.; Wu, C.X.; Paul, K.S.L. Microplastic pollution in China’s inland water systems: A review of findings, methods, characteristics, effects, and management. Sci. Total Environ. 2018, 630, 1641–1653. [Google Scholar] [CrossRef]
  17. Cheung, P.K.; Fok, L. Characterization of plastic microbeads in facial scrubs and their estimated emissions in Mainland China. Water Res. 2017, 122, 53–61. [Google Scholar] [CrossRef]
  18. Fendall, L.S.; Sewwll, M.A. Contributing to marine pollution by washing your face: Microplastics in facial cleansers. Mar. Pollut. Bull. 2009, 58, 1225–1228. [Google Scholar] [CrossRef]
  19. Zhang, L.L.; Zhang, S.P.; Guo, J.; Yu, K.F.; Wang, Y.H.; Li, R.L. Dynamic distribution of microplastics in mangrove sediments in Beibu Gulf, South China: Implications of tidal current velocity and tidal range. J. Hazard. Mater. 2020, 399, 122849. [Google Scholar] [CrossRef]
  20. Zhang, L.; Wang, S.J.; Jian, Q.Y.; Zhang, P.; Lu, Y.J.; Liu, H.Q. Tidal variation shaped microplastic enrichment patterns in mangrove blue carbon ecosystem of northern Beibu Gulf, China. Front. Mar. Sci. 2022, 9, 927884. [Google Scholar] [CrossRef]
  21. Wu, Y.; Wang, S.Q.; Wu, L.B.; Yang, Y.J.; Yu, X.X.; Liu, Q.X.; Liu, X.L.; Li, Y.Y.; Wang, X.H. Vertical distribution and river-sea transport of microplastics with tidal fluctuation in a subtropical estuary, China. Sci. Total Environ. 2022, 822, 153603. [Google Scholar] [CrossRef] [PubMed]
  22. Zhang, P.; Wei, S.S.; Zhang, J.B.; Zhong, H.F.; Wang, S.J.; Jian, Q.Y. Seasonal distribution, composition, and inventory of plastic debris on the Yugang Park Beach in Zhanjiang Bay, South China Sea. Int. J. Environ. Res. Public Health 2022, 19, 4886. [Google Scholar] [CrossRef] [PubMed]
  23. Andrady, A.L. Microplastics in the marine environment. Mar. Pollut. Bull. 2011, 62, 1596–1605. [Google Scholar] [CrossRef] [PubMed]
  24. Ivar do Sul, J.A.; Costa, M.F. The present and future of microplastic pollution in the marine environment. Environ. Pollut. 2014, 185, 352–364. [Google Scholar] [CrossRef] [PubMed]
  25. Wang, J.D.; Tan, Z.; Peng, J.P.; Qiu, Q.X.; Li, M.M. The behaviors of microplastics in the marine environment. Mar. Environ. Res. 2016, 113, 7–17. [Google Scholar] [CrossRef]
  26. Chen, D.S.; Yan, J.H. Characteristics of flow field in Zhanjiang Bay marine area and its influence on water environment. Sci. Technol. Eng. 2006, 2100–2103. [Google Scholar]
  27. Zhang, P.; Peng, C.H.; Zhang, J.B.; Zou, Z.B.; Shi, Y.Z.; Zhao, L.R.; Zhao, H. Spatiotemporal urea distribution, sources, and indication of DON bioavailability in Zhanjiang Bay, China. Water 2020, 12, 633. [Google Scholar] [CrossRef] [Green Version]
  28. Zhang, J.B.; Zhang, Y.C.; Zhang, P.; Li, Y.; Li, J.X.; Xu, J.L.; Luo, X.Q.; Zhao, L.R. Seasonal phosphorus variation in coastal water affected by the land-based sources input in the eutrophic Zhanjiang Bay, China. Estuar. Coast. Shelf Sci. 2021, 252, 107277. [Google Scholar] [CrossRef]
  29. Zhanjiang Municipal People’s Government. Zhanjiang Daily News—The City Received 3.168 Million Visitors. 2021. Available online: https://www.zhanjiang.gov.cn/yaowen/content/post_1419015.html (accessed on 20 November 2022). (In Chinese)
  30. Taïbi, N.E.; Bentaallah, M.E.A.; Alomar, C.; Compa, M.; Deudero, S. Micro-and macro-plastics in beach sediment of the Algerian western coast: First data on distribution, characterization, and source. Mar. Pollut. Bull. 2021, 165, 112168. [Google Scholar] [CrossRef]
  31. Gago, J.; Filgueiras, A.; Pedrotti, M.L.; Caetano, M.; Frias, J. Standardised Protocol for Monitoring Microplastics in Seawater. JPI-Oceans BASEMAN Project. 2018. Available online: https://www.researchgate.net/publication/331936034 (accessed on 15 September 2021).
  32. Masura, J.; Baker, J.; Foster, G.; Arthur, C. Laboratory Methods for the Analysis of Microplastics in the Marine Environment: Recommendations for Quantifying Synthetic Particles in Waters and Sediments; NOAA Tech. Memo. NOS-OR & R-48; National Oceanic and Atmospheric Administration: Silver Spring, MD, USA, 2015. [Google Scholar]
  33. Xia, B.; Sui, Q.; Sun, X.M.; Zhu, L.; Wang, R.Y.; Cai, M.G.; Chen, B.J.; Qu, K.M. Microplastic pollution in surface seawater of Sanggou Bay, China: Occurrence, source and inventory. Mar. Pollut Bull. 2021, 162, 111899. [Google Scholar] [CrossRef]
  34. Nuelle, M.T.; Dekiff, J.H.; Remy, D.; Fries, E. A new analytical approach for monitoring microplastics in marine sediments. Environ. Pollut. 2014, 184, 161–169. [Google Scholar] [CrossRef]
  35. Lu, H.C.; Ziajahromi, S.; Neale, P.A.; Leusch, F.D.L. A systematic review of freshwater microplastics in water and sediments: Recommendations for harmonisation to enhance future study comparisons. Sci. Total Environ. 2021, 781, 146693. [Google Scholar] [CrossRef]
  36. Tang, G.W.; Liu, M.Y.; Zhou, Q.; He, H.X.; Chen, K.; Zhang, H.B.; Hu, J.H.; Huang, Q.H.; Luo, Y.M.; Ke, H.W.; et al. Microplastics and polycyclic aromatic hydrocarbons (PAHs) in Xiamen coastal areas: Implications for anthropogenic impacts. Sci. Total Environ. 2018, 634, 811–820. [Google Scholar] [CrossRef] [PubMed]
  37. Zhu, L.; Bai, H.Y.; Chen, B.J.; Sun, X.M.; Qu, K.M.; Xia, B. Microplastic pollution in North Yellow Sea, China: Observations on occurrence, distribution and identification. Sci. Total Environ. 2018, 636, 20–29. [Google Scholar] [CrossRef] [PubMed]
  38. Cai, M.G.; He, H.X.; Liu, M.Y.; Li, S.W.; Tang, G.W.; Wang, W.M.; Huang, P.; Wei, G.; Lin, Y.; Chen, B.; et al. Lost but can’t be neglected: Huge quantities of small microplastics hide in the South China Sea. Sci. Total Environ. 2018, 633, 1206–1216. [Google Scholar] [CrossRef] [PubMed]
  39. Gao, F.L.; Li, J.X.; Hu, J.; Sui, B.L.; Wang, C.X.; Sun, C.J.; Li, X.G.; Ju, P. The seasonal distribution characteristics of microplastics on bathing beaches along the coast of Qingdao, China. Sci. Total Environ. 2021, 783, 146969. [Google Scholar] [CrossRef]
  40. Terzi, Y.; Gedik, K.; Eryaşar, A.R.; Öztürk, R.Ç.; Şahin, A.; Yılmaz, F. Microplastic contamination and characteristics spatially vary in the southern Black Sea beach sediment and sea surface water. Mar. Pollut. Bull. 2022, 174, 113228. [Google Scholar] [CrossRef]
  41. Xu, P.; Peng, G.Y.; Su, L.; Gao, Y.Q.; Gao, L.; Li, D.J. Microplastic risk assessment in surface waters: A case study in the Changjiang Estuary, China. Mar. Pollut. Bull. 2018, 133, 647–654. [Google Scholar] [CrossRef]
  42. Zheng, Y.F.; Li, J.X.; Cao, W.; Liu, X.H.; Jiang, F.H.; Ding, J.F.; Yin, X.F.; Sun, C.J. Distribution characteristics of microplastics in the seawater and sediment: A case study in Jiaozhou Bay, China. Sci. Total Environ. 2019, 674, 27–35. [Google Scholar] [CrossRef]
  43. Chen, B.; Fan, Y.P.; Huang, W.; Sadique Rayhan, A.B.M.; Chen, K.; Cai, M.G. Observation of microplastics in mariculture water of Longjiao Bay, southeast China: Influence by human activities. Mar. Pollut. Bull. 2020, 160, 111655. [Google Scholar] [CrossRef]
  44. Yin, M.C.; Cao, H.J.; Zhao, W.L.; Wang, T.; Huang, W.; Cai, M.G. Tide-driven microplastics transport in an elongated semi-closed bay: A case study in Xiangshan Bay, China. Sci. Total Environ. 2022, 846, 157374. [Google Scholar] [CrossRef]
  45. Prarat, P.; Hongsawat, P. Microplastic pollution in surface seawater and beach sand from the shore of Rayong province, Thailand: Distribution, characterization, and ecological risk assessment. Mar. Pollut. Bull. 2022, 174, 113200. [Google Scholar] [CrossRef] [PubMed]
  46. Bellasi, A.; Binda, G.; Boldrocchi, G.; Pozzi, A.; Bettinetti, R. What are lake beaches made of? An assessment of plastic beach litter on the shores of Como Bay (Italy). Appl. Sci. 2022, 12, 5388. [Google Scholar] [CrossRef]
  47. Browne, M.A.; Crump, P.; Niven, S.J.; Teuten, E.; Tonkin, A.; Galloway, T.; Thompson, R. Accumulation of microplastic on shorelines woldwide: Sources and sinks. Environ. Sci. Technol. 2011, 45, 9175–9179. [Google Scholar] [CrossRef] [PubMed]
  48. Hengstmann, E.; Gr€awe, D.; Tamminga, M.; Fischer, E. Marine litter abundance and distribution on beaches on the Isle of Rügen considering the influence of exposition, morphology and recreational activities. Mar. Pollut. Bull. 2017, 115, 297–306. [Google Scholar] [CrossRef]
  49. Jayasiri, H.B.; Purushothaman, C.S.; Vennila, A. Quantitative analysis of plastic debris on recreational beaches in Mumbai, India. Mar. Pollut. Bull. 2013, 77, 107–112. [Google Scholar] [CrossRef] [PubMed]
  50. Gregory, M.R. Plastics and South Pacific Island shores: Environmental implications. Ocean Coast. Manag. 1999, 42, 603–615. [Google Scholar] [CrossRef]
  51. Eo, S.; Hong, S.H.; Song, Y.K.; Lee, J.; Lee, J.; Shim, W.J. Abundance, composition, and distribution of microplastics larger than 20 μm in sand beaches of South Korea. Environ. Pollut. 2018, 238, 894–902. [Google Scholar] [CrossRef]
  52. Andrady, A.L. The plastic in microplastics: A review. Mar. Pollut. Bull. 2017, 119, 12–22. [Google Scholar] [CrossRef]
  53. Ryan, P.G.; Weideman, E.A.; Perold, V.; Moloney, C.L. Toward balancing the budget: Surface macro-plastics dominate the mass of particulate pollution stranded on beaches. Front. Mar. Sci. 2020, 7, 575395. [Google Scholar] [CrossRef]
  54. Lefebvre, C.; Rojas, I.J.; Lasserre, J.; Villette, S.; Lecomte, S.; Cachot, J.; Morin, B. Stranded in the high tide line: Spatial and temporal variability of beached microplastics in a semi-enclosed embayment (Arcachon, France). Sci. Total Environ. 2021, 797, 149144. [Google Scholar] [CrossRef]
  55. Wagner, M.; Scherer, C.; Alvarez-Mu~noz, D.; Brennholt, N.; Bourrain, X.; Buchinger, S.; Fries, E.; Grosbois, C.; Klasmeier, J.; Marti, T.; et al. Microplastics in freshwater ecosystems: What we know and what we need to know. Environ. Sci. Eur. 2014, 26, 12. [Google Scholar] [CrossRef] [PubMed] [Green Version]
  56. Bayo, J.; Rojo, D.; Olmos, S. Abundance, morphology and chemical composition of microplastics in sand and sediments from a protected coastal area: The Mar Menor lagoon (SE Spain). Environ. Pollut. 2019, 252, 1357–1366. [Google Scholar] [CrossRef] [PubMed]
  57. Chubarenko, I.; Efimova, I.; Bagaeva, M.; Bagaev, A.; Isachenko, I. On mechanical fragmentation of single-use plastics in the sea swash zone with different types of bottom sediments: Insights from laboratory experiments. Mar. Pollut. Bull. 2020, 150, 110726. [Google Scholar] [CrossRef] [PubMed]
  58. Thompson, R.C.; Olsen, Y.; Mitchell, R.P.; Davis, A.; Rowland, S.J.; John, A.W.G.; McGonigle, D.; Russell, A.E. Lost at sea: Where is all the plastic? Science 2004, 304, 838. [Google Scholar] [CrossRef]
  59. Balthazar-Silva, D.; Turra, A.; Moreira, F.T.; Camargo, R.M.; Oliveira, A.L.; Barbosa, L.; Gorman, D. Rainfall and tidal cycle regulate seasonal inputs of microplastic pellets to sandy beaches. Front. Environ. Sci. 2020, 8, 123. [Google Scholar] [CrossRef]
  60. Critchell, K.; Lambrechts, J. Modelling accumulation of marine plastics in the coastal zone; what are the dominant physical processes? Estuar. Coast. Shelf Sci. 2016, 171, 111–122. [Google Scholar] [CrossRef]
  61. Reinold, S.; Herrera, A.; Hernández-González, C.; Gómez, M. Plastic pollution on eight beaches of Tenerife (Canary Islands, Spain): An annual study. Mar. Pollut. Bull. 2020, 151, 110847. [Google Scholar] [CrossRef]
  62. Zhou, P.; Huang, C.G.; Fang, H.D.; Cai, W.X.; Li, D.M.; Li, X.M.; Yu, H.S. The abundance, composition and sources of marine debris in coastal seawaters or beaches around the northern South China Sea (China). Mar. Pollut. Bull. 2011, 62, 1998–2007. [Google Scholar] [CrossRef]
  63. Kuo, F.J.; Huang, H.W. Strategy for mitigation of marine debris: Analysis of sources and composition of marine debris in northern Taiwan. Mar. Pollut. Bull. 2014, 83, 70–78. [Google Scholar] [CrossRef]
  64. Wang, S.J.; Jian, Q.Y.; Zhang, P.; Zhang, J.B.; Zhao, L.R.; Liu, D.; Kang, X.H. Tracing land-based microplastic sources in coastal waters of Zhanjiang Bay, China: Spatiotemporal pattern, composition, and flux. Front. Mar. Sci. 2022, 9, 934707. [Google Scholar] [CrossRef]
  65. Fok, L.; Cheung, P.K. Hong Kong at the Pearl River Estuary: A hotspot of microplastic pollution. Mar. Pollut. Bull. 2015, 99, 112–118. [Google Scholar] [CrossRef]
  66. Chen, F.J.; Lao, Q.B.; Jia, G.D.; Chen, C.Q.; Zhu, Q.M.; Zhou, X. Seasonal variations of nitrate dual isotopes in wetdeposition in a tropical city in China. Atmos. Environ. 2019, 196, 1–9. [Google Scholar] [CrossRef]
  67. Liu, S.; Chen, H.; Wang, J.; Su, L.; Wang, X.; Zhu, J.; Lan, W. The distribution of microplastics in water, sediment, and fish of the Dafeng River, a remote river in China. Ecotoxicol. Environ. Saf. 2021, 228, 113009. [Google Scholar] [CrossRef] [PubMed]
  68. Schuyler, Q.; Wilcox, C.; Lawson, T.; Ranatunga, R.R.M.K.P.; Hu, C.S.; Hardesty, B. Human population density is a poor predictor of debris in the environment. Front. Environ. Sci. 2021, 9, 583454. [Google Scholar] [CrossRef]
  69. van Gool, E.; Campbell, M.; Wallace, P.; Hewitt, C.L. Marine debris on New Zealand Beaches—Baseline data to evaluate regional variances. Front. Environ. Sci. 2021, 9, 700415. [Google Scholar] [CrossRef]
  70. Alvarez-Hernandez, C.; Cairos, C.; Lopez-Darias, J.; Mazzetti, E.; Hernandez-Sanchez, C.; Gonzalez-Salamo, J.; Hernandez-Borges, J. Microplastic debris in beaches of Tenerife (Canary Islands, Spain). Mar. Pollut. Bull. 2019, 146, 26–32. [Google Scholar] [CrossRef] [PubMed]
  71. Rochman, C.M.; Browne, M.A.; Halpern, B.S.; Hentschel, B.T.; Hoh, E.; Karapanagioti, H.K.; Rios-Mendoza, L.M.; Takada, H.; Teh, S.; Thompson, R.C. Policy: Classify plastic waste as hazardous. Nature 2013, 494, 169–171. [Google Scholar] [CrossRef] [PubMed]
  72. Corcoran, P.L.; Biesinger, M.C.; Grififi, M. Plastics and beaches: A degrading relationship. Mar. Pollut. Bull. 2009, 58, 80–84. [Google Scholar] [CrossRef]
  73. Zhao, S.Y.; Zhu, L.X.; Li, D.J. Characterization of small plastic debris on tourism beaches around the South China Sea. Reg. Stud. Mar. Sci. 2015, 1, 55–62. [Google Scholar] [CrossRef]
  74. Tavares, D.C.; Moura, J.F.; Ceesay, A.; Merico, A. Density and composition of surface and buried plastic debris in beaches of Senegal. Sci. Total Environ. 2020, 737, 139633. [Google Scholar] [CrossRef]
  75. Miranda, D.A.; Carvalho-Souza, G.F. Are we eating plastic-ingesting fish? Mar. Pollut. Bull. 2016, 103, 109–114. [Google Scholar] [CrossRef] [PubMed]
  76. Fred-Ahmadu, O.H.; Bhagwat, G.; Oluyoye, I.; Benson, N.U.; Ayejuyo, O.O.; Palanisami, T. Interaction of chemical contaminants with microplastics: Principles and perspectives. Sci. Total Environ. 2020, 706, 135978. [Google Scholar] [CrossRef] [PubMed]
  77. Krishnakumar, S.; Srinivasalub, S.; Saravanana, P.; Vidyasakarc, A.; Magesh, N.S. A preliminary study on coastal debris in Nallathanni Island, Gulf of Mannar Biosphere Reserve, Southeast coast of India. Mar. Pollut. Bull. 2018, 131, 547–551. [Google Scholar] [CrossRef] [PubMed]
  78. Yu, X.B.; Peng, J.P.; Wang, J.D.; Wang, K.; Bao, S.W. Occurrence of microplastics in the beach sand of the Chinese inner sea: The Bohai Sea. Environ. Pollut. 2016, 214, 722–730. [Google Scholar] [CrossRef]
  79. Nguyen, Q.A.T.; Nguyen, H.N.Y.; Strady, E.; Nguyen, Q.T.; Trinh-Dang, M.; Vo, V.M. Characteristics of microplastics in shoreline sediments from a tropical and urbanized beach (Da Nang, Vietnam). Mar. Pollut. Bull. 2020, 161, 111768. [Google Scholar] [CrossRef]
Figure 1. Geographical location of Zhanjiang Bay (ZJB) (a), Yugang Park Beach (YPB) (b), and detailed information of the bathing seawater sampling stations (H: high tide, M: mid tide, L: low tide) (c).
Jmse 10 01947 g001
Figure 2. Tidal variations in ZJB coastal water during the investigation period.
Jmse 10 01947 g002
Figure 3. Abundance of MPs in the bathing seawater affected by the ebb tide.
Jmse 10 01947 g003
Figure 4. Sizes (a), colors (b), and shapes (c) of MPs in the bathing seawater affected by the ebb tide.
Jmse 10 01947 g004
Figure 5. Spearman correlation coefficients between MP abundance and MP size (n = 15). Note: * refers to correlations significant at p < 0.05 (two-tailed), ** refers to correlations significant at p < 0.01 (two-tailed), and *** refers to correlations significant at p < 0.001 (two-tailed).
Jmse 10 01947 g005
Figure 6. Inventory of MPs in the bathing seawater affected by the ebb tide.
Jmse 10 01947 g006
Table 1. Comparison of the abundance of MPs worldwide.
RegionSampling MethodSizeAverage AbundanceReference
Xiamen, China Manta trawl0.33–5 mm514.3 ± 520.0 items·m−3[36]
North Yellow Sea, China Steel sieve0.03–5 mm545 ± 282 items·m−3 [37]
South China SeaPump0.044–5 mm2569 ± 1770 items·m−3[38]
Qingdao, ChinaStainless steel bucket0.02–5 mm446.8 ± 75.0 items·m−3[39]
The southern coast of the Black SeaPlankton net0.025–5 mm18.7 ± 3.0 items·m−3[40]
Changjiang Estuary, ChinaStainless steel sieve0.07–5 mm231 ± 182 items·m−3[41]
Jiaozhou Bay, ChinaSieve0.02–5 mm46 ± 28 items·m−3[42]
Longjiao Bay, ChinaPump0.02–5 mm1594.2 ± 1352.2 items·m−3[43]
Xiangshan Bay, ChinaStainless Steel bucket 0.045–5 mm890.6 ± 419.4 items·m−3[44]
The shore of Rayong province, ThailandStainless steel sieve 0.075–5 mm1781.5 ± 1598.4 items·m−3[45]
Zhanjiang Bay, ChinaStainless steel sieve 0.045–5 mm210.3 ± 183.0 items·m−3This study
Publisher’s Note: MDPI stays neutral with regard to jurisdictional claims in published maps and institutional affiliations.

