Article

Experimental Performance Analysis of a Hybrid Wave Energy Harvesting System Combining E-Motions with Triboelectric Nanogenerators

1
Department of Civil Engineering, Faculty of Engineering of the University of Porto, Rua Dr. Roberto Frias, s/n, 4200-465 Porto, Portugal
2
Interdisciplinary Centre of Marine and Environmental Research (CIIMAR), Leixões Cruise Terminal, Av. General Norton de Matos s/n, 4450-208 Matosinhos, Portugal
3
IFIMUP, Faculty of Sciences of the University of Porto, Rua do Campo Alegre, 4169-007 Porto, Portugal
4
InanoEnergy, Edifício FC6, Rua do Campo Alegre, 1021 Porto, Portugal
5
Portuguese Navy, Ministry of National Defence, Naval School, Alfeite, 2810-001 Almada, Portugal
*
Author to whom correspondence should be addressed.
J. Mar. Sci. Eng. 2022, 10(12), 1924; https://doi.org/10.3390/jmse10121924
Submission received: 28 October 2022 / Revised: 29 November 2022 / Accepted: 1 December 2022 / Published: 6 December 2022
(This article belongs to the Section Ocean Engineering)

Abstract

:
This paper discusses a disruptive approach to wave energy conversion, based on a hybrid solution: the E-Motions wave energy converter with integrated triboelectric nanogenerators. To demonstrate it, a physical modelling study was carried out with nine E-Motions sub-variants, which were based on three original hull designs (half-cylinder (HC), half-sphere (HS) and trapezoidal prism (TP)). A unidirectional lateral tribo-device was incorporated within the E-Motions’ hull during the experiments. The physical models were subjected to eight irregular sea-states from a reference study on the Portuguese coastline. Results point towards a significant hydrodynamic roll response, with peaks of up to 40 °/m. Three peaks were observed for the surge motions, associated with slow drifting at low frequencies. The response bandwidth of the HC sub-variants was affected by the varying PTO mass-damping values. By comparison, such response was generally maintained for all HS sub-variants and improved for the TP sub-variants, due to ballast positioning adjustments. Maximum power ratios ranged between 0.015 kW/m3 and 0.030 kW/m3. The TENGs demonstrated an average open-circuit voltage and power per kilogram ratio of up to 85 V and 18 mW/kg, respectively, whilst exhibiting an evolution highly dependent upon wave excitation, surge excursions and roll oscillations. Thus, TENGs enable redundant dual-mode wave energy conversion alongside E-Motions, which can power supporting equipment with negligible influence on platform hydrodynamics.

1. Introduction

Albeit being at the forefront of the global energy transition, renewable energy sources (RES) such as wind, solar and hydro face several challenges. These include spatial limitations [1], since they are mostly deployed on land. For instance, about 1.6 ha of land area are required per MW of installed photo-voltaic capacity [2]. Consequently, not only are they limited by the available local resource (e.g., rivers/waterways for hydroelectric power), but they must contend with other uses and address potential environmental impacts [3,4]. RES are also expected to support ambitious objectives regarding hydrogen generation: for instance, increase the share of hydrogen in Europe’s energy mix from the current 2% to 13–14%, by 2050 [5,6]. Hence, alternative RES approaches will have to be considered, with the ocean being a promising option since it covers most of the Earth’s surface. Though wind and, to some extent, solar energy can make the transition towards nearshore/offshore deployment sites, several practical adaptations are required (e.g., submerged cables to transport electricity to shore) that can lead to an increase of the total energy cost. Resource intermittency is another issue (e.g., daylight/nighttime cycles for solar). Alternatively, Ocean Energy Sources (OES) can be considered, a statement supported by the greater resource density, overall availability (spatial and temporal), predictability and unexplored abundance of the inherent resources [7,8]. Even so, pertinent obstacles are currently hindering the commercial deployment of OES technologies.
Looking at the particular case of wave energy, the available theoretical resource is estimated at an order of magnitude capable of matching the present global electricity consumption [9,10]. Additionally, many niche markets/applications can provide demonstration opportunities for wave energy converter (WEC) concepts, namely desalination plants [11,12], remote community supply [13], oil and gas industry [14], floating platforms/systems [15,16], coastal defence [17,18], internet of underwater things [19] and even the aforementioned hydrogen production [20,21]. Despite these prospects and the vast number of existing concepts, there is an absence of a standardized solution capable of reaching a commercial stage, which impairs the relatively low level of maturity of WEC technologies [22,23]. Conceptual simplicity, cost mitigation, adaptability and resilience to the ocean environment are some of the identified milestones to be surpassed, which requires disruptive approaches [24].
An innovative hybrid solution is proposed and analysed in this paper: the combination of the E-Motions concept with triboelectric nanogenerators (TENGs), Figure 1. While E-Motions is a WEC based on the roll oscillations of multipurpose offshore floating platforms [25,26], TENGs are a versatile technology capable of harnessing energy from mechanical motions, even if they are characterized by relatively low frequency and/or low amplitude, as is the case of those induced by ocean waves in some floating platforms [27,28]. This disruptive combination enables dual wave energy conversion, sharing of the same floating platform, protection of sensitive equipment from the ocean environment and adaptability to a wide range of nearshore/offshore applications. The feasibility of this approach was studied via an experimental study with geometrically scaled physical models, which were subjected to irregular wave action based on reference case studies [29]. This study followed on the example of other wave energy technologies [30,31,32,33], as well as preceding experimental studies on the individual technologies that compose the hybrid solution [25,34]. This yielded data on the hydrodynamic response of the physical models and the power output from the E-Motions’ PTO and TENGs. Moreover, the experimental campaign provided crucial data for future studies, namely by supporting numerical modelling stages.
Aside from the specific experimental results inherent to each individual technology of this hybrid solution, from hydrodynamic analysis to power output, this paper seeks to address the following knowledge gaps:
  • WEC development: several categories of WECs exist [8], including rotating mass concepts (RMC). Despite not being one of the most representative types, RMCs commonly provide numerous advantages, ranging from protection of sensitive equipment within the hull to versatility of application. Examples of such RMC technologies include gyroscopic [35,36], drive-train [37] or pendulum-based [38,39] systems, which can operate either in single-mode [40] (pitch or roll) or multi-mode [41]. However, a sliding system such as that applied in E-Motions’ PTO is uncommon, at best. Furthermore, the time-varying inclined plane problem it presents, in conjugation with platform hydrodynamics, has little to no equivalent in the literature, especially when considering that stacking multiple PTO rows is a possibility. Lastly, devices such as E-Motions—Salter’s Duck, TALOS and SEAREV [39,42,43], for instance—transform the problem/risk of large roll/pitch oscillations into a means of producing renewable electricity. If installed onto floating vessels, they may also act as an inertial counter balance to such motions, as considered in [44] with regard to roll dampening in fishing vessels. Even so, it is prudent to consider that dampened oscillations may imply a reduction of the converter wave energy, which implies a cost–benefit assessment prior to installation onto floating vessels.
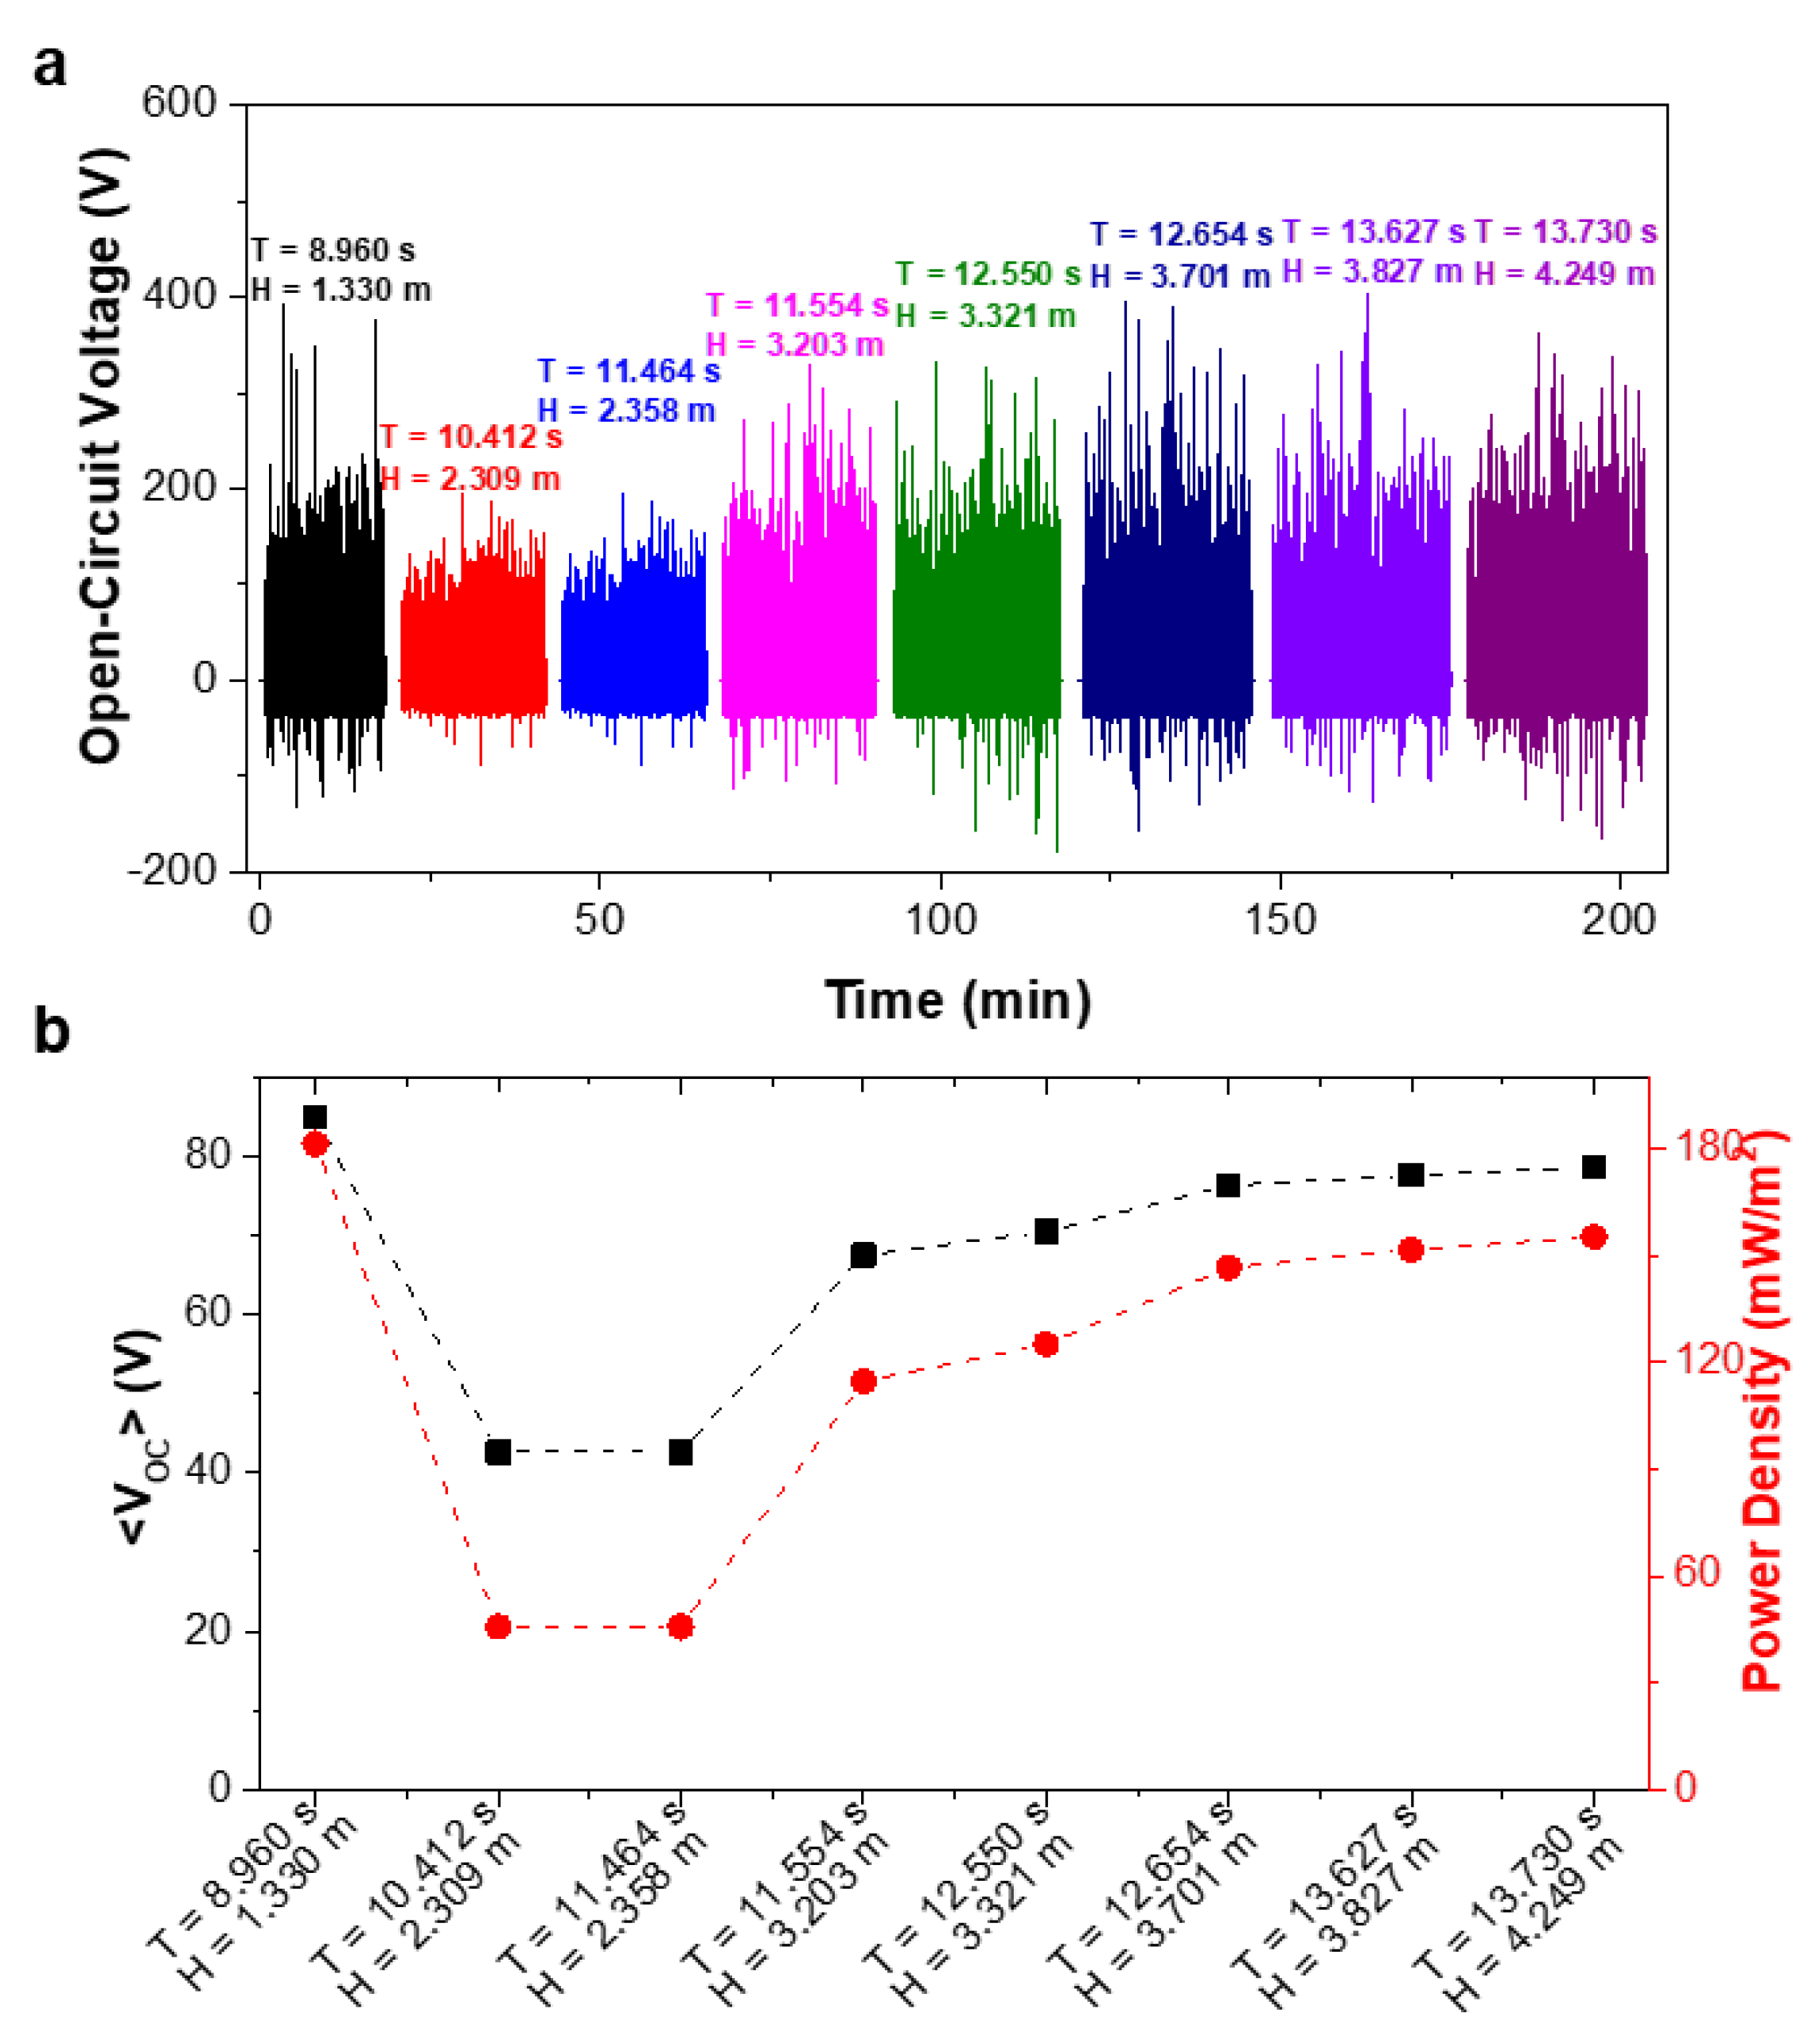
  • Triboelectric nanogenerators for wave energy conversion: much research can be found, in the literature, with regard to TENG development and application, being ocean energy one of the most promising opportunities for this type of energy conversion technology [45,46]. Case studies range from powering marine buoys [28] to sensors [47] or LEDs [42], but there are important limitations. For instance, and safe from some exceptions found in the literature [48], most experiments were conducted in water tanks [49] or under dry conditions [50]. These were often under controlled forced motions and/or fixed wave heights and wave periods, unlike those found at sea. In this paper, the proposed TENG solution is studied under irregular wave action within a sizeable wave basin, thus providing a more realistic demonstration of this emerging technology.
  • Hybridization: aimed at equipment sharing, cost reduction and multi-mode energy conversion, several researchers have proposed a combination between marine energy systems, such as co-location between offshore wind and wave energy [51]. Few have proposed hybridization within the wave energy sector. Exceptions include the HWEC [33] and even the Salter’s Duck with integrated TENGs [42]. As such, the disruptive proposition of E-Motions with integrated TENGs provides pertinent experimental information, including a power output comparison. Therefore, the study found along this paper is capable of contributing towards greater scientific knowledge whilst fostering the opportunities inherent to hybridization within the wave energy sector.
This paper has the following structure: Section 2 describes, in detail, the two combined wave energy technologies—E-Motions and TENGs—and the procedures required for their hybridization, within the scope of the experimental study; Section 3 provides an overview on the combined technologies, as well as remarks regarding the hybridization procedures and potentialities; Section 4 focuses on outlining the experimental setup, equipment, characteristics of the physical models, reproduction of the E-Motions’ PTO and the TENGs, selected wave conditions and limitations inherent to the physical modelling stage; Section 5 presents and discusses the main outcomes of the experimental study, with a thorough analysis of the hydrodynamic response of the physical models, a comparison between PTO and platform motions and the power output of E-Motions and the TENGs; lastly, Section 6 summarizes the key results of this study and proposes future developments for the combined E-Motions/TENGs as a versatile and adaptable WEC.

2. Conceptualization of the Hybrid Wave Energy Technology
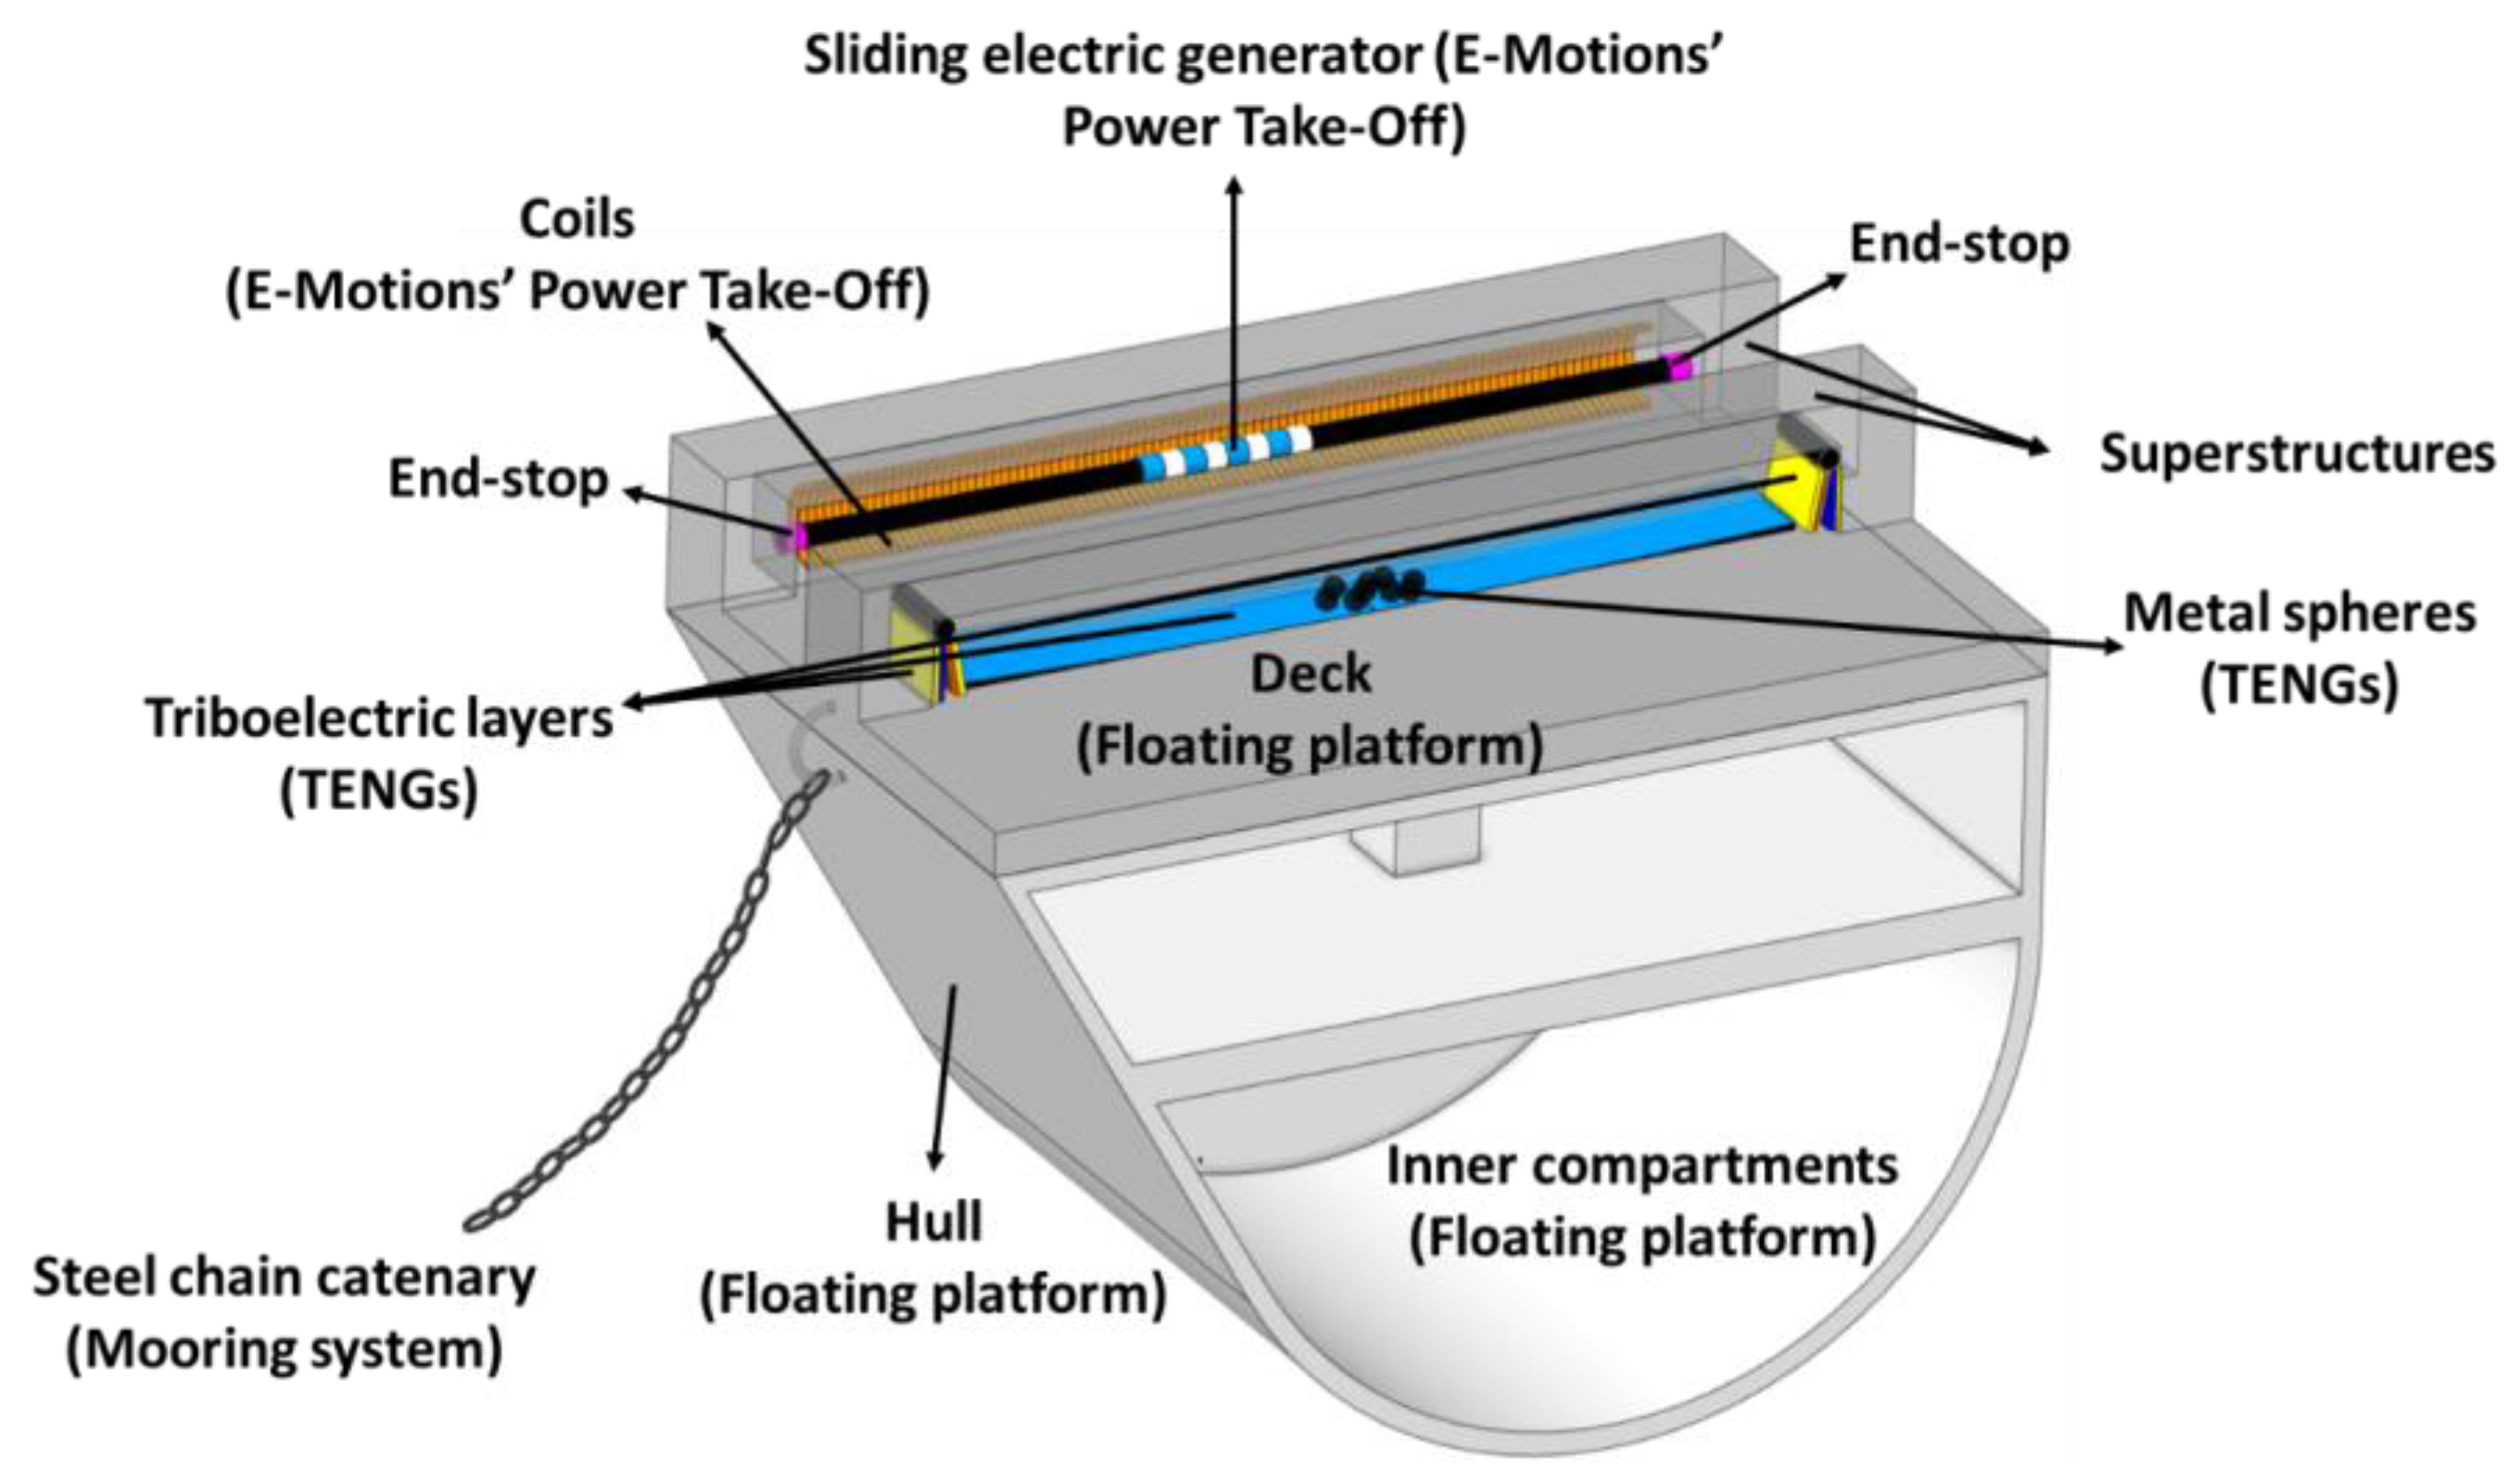
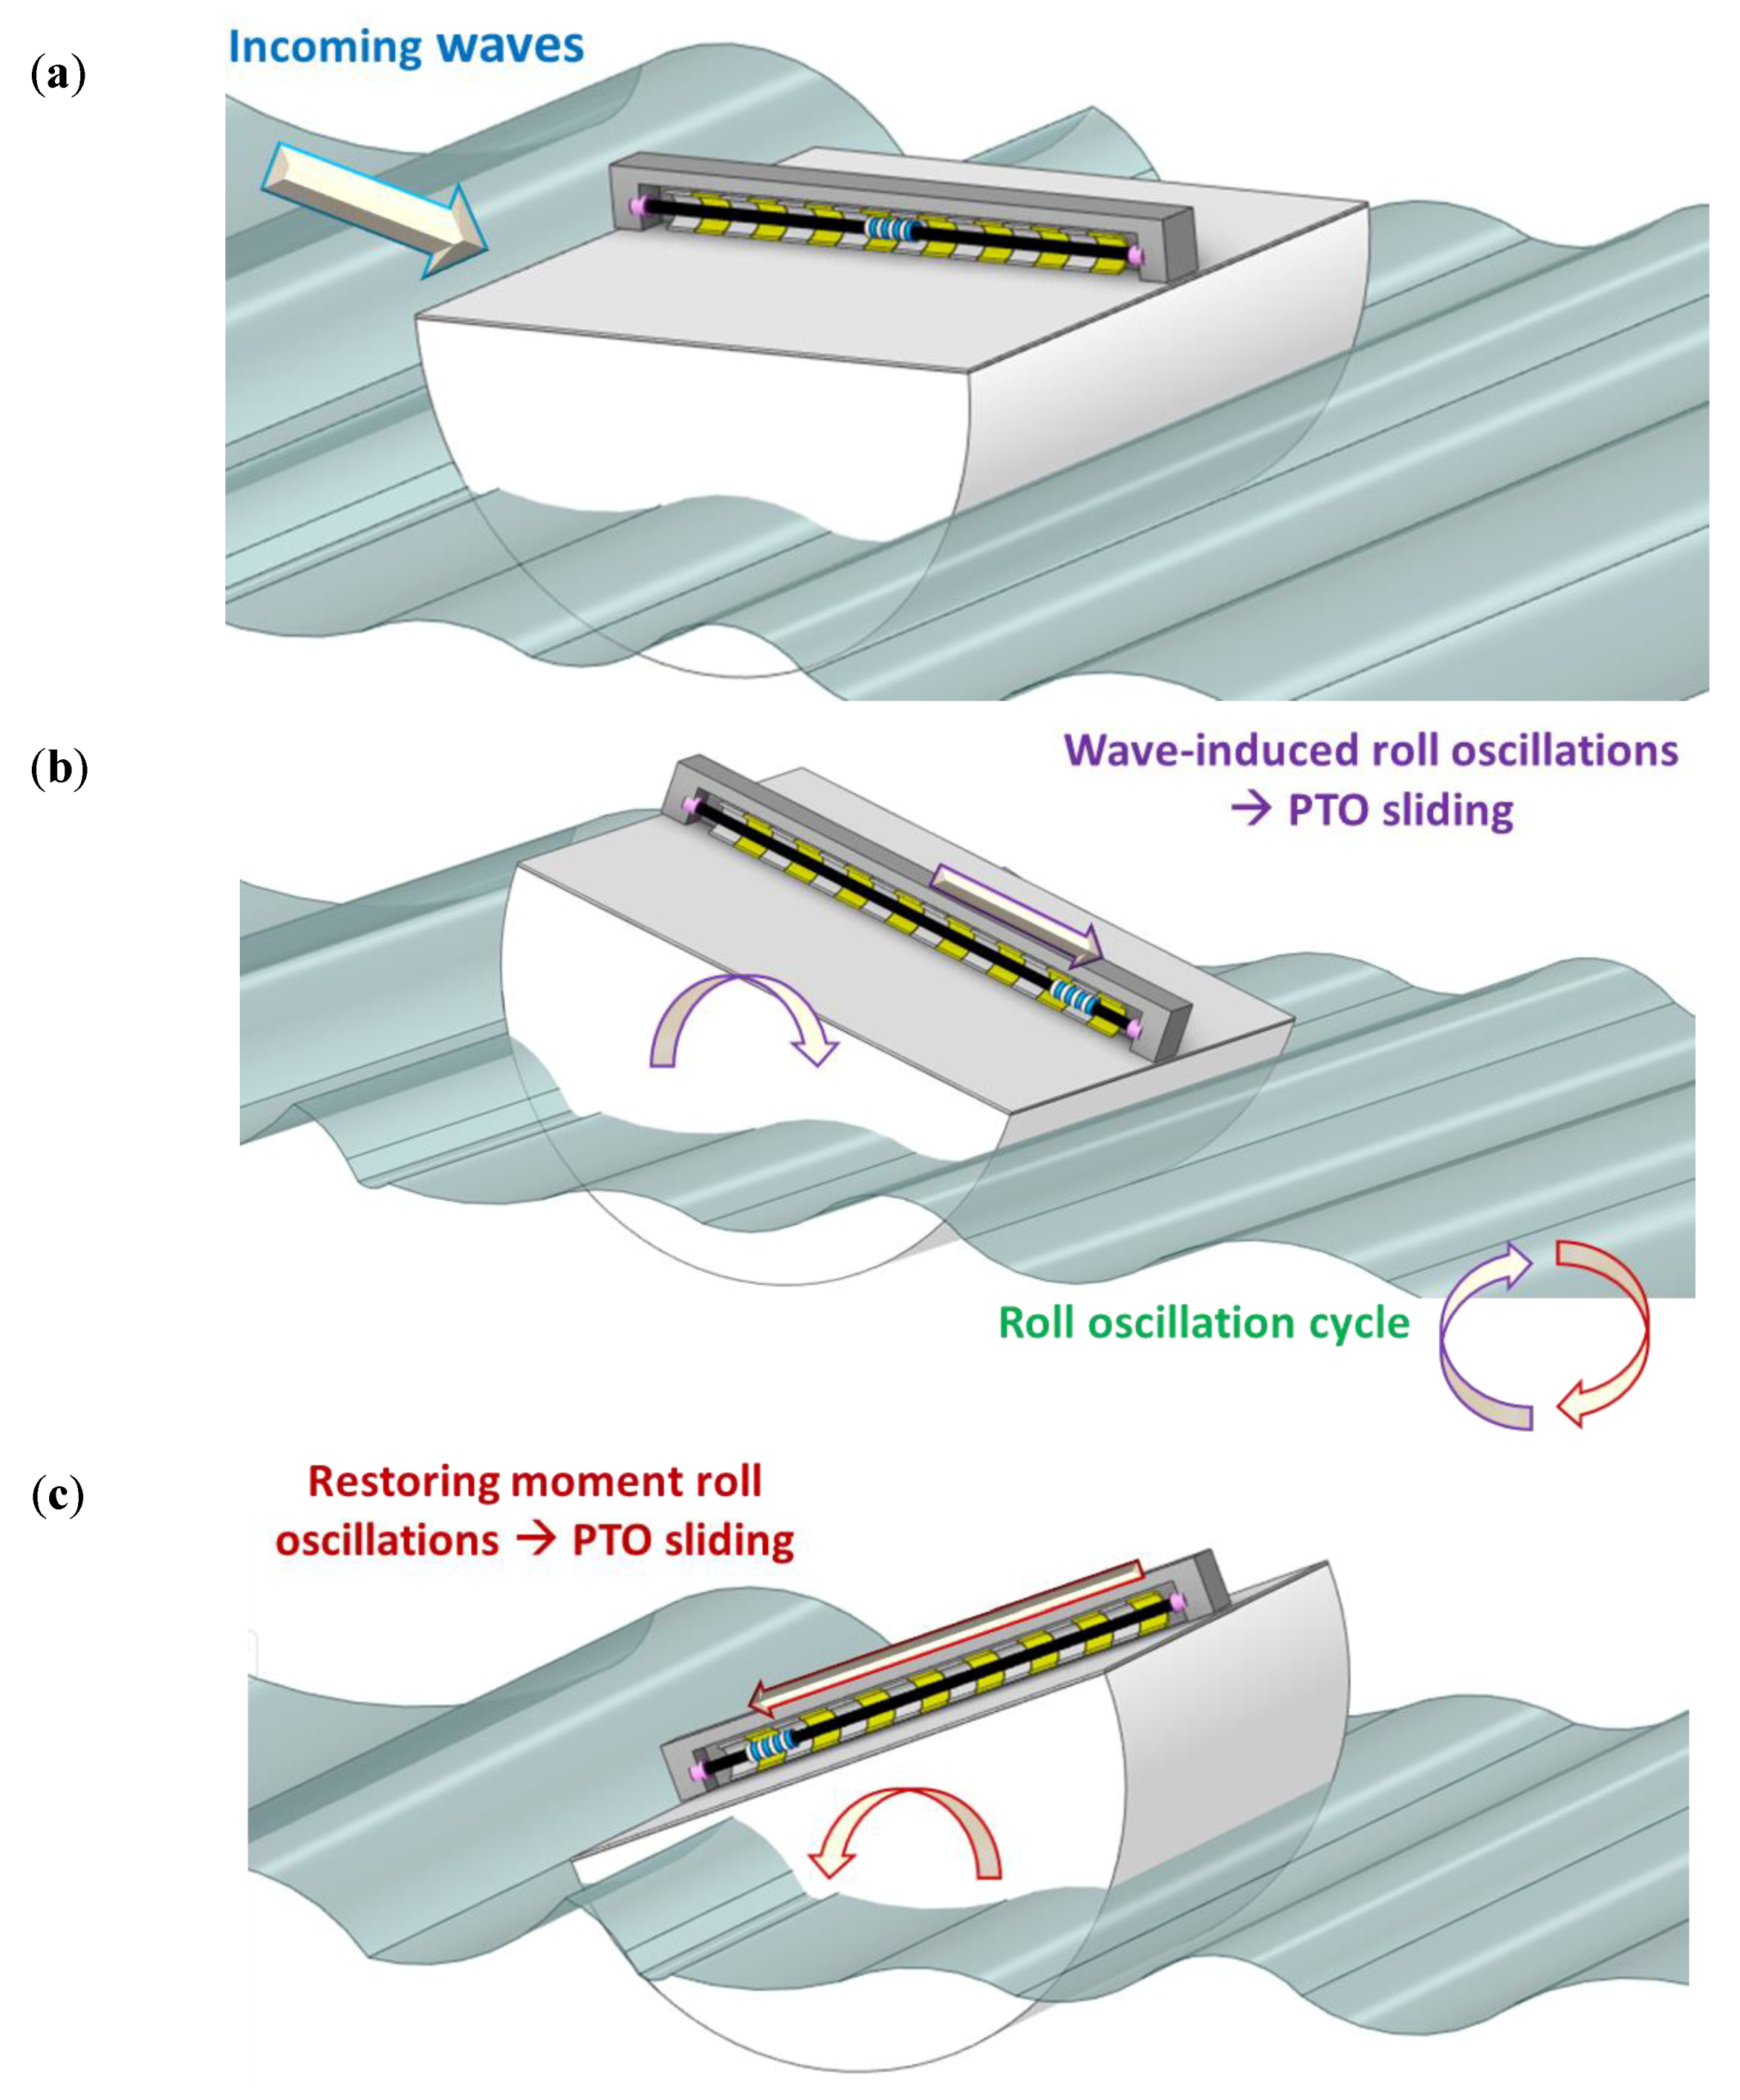
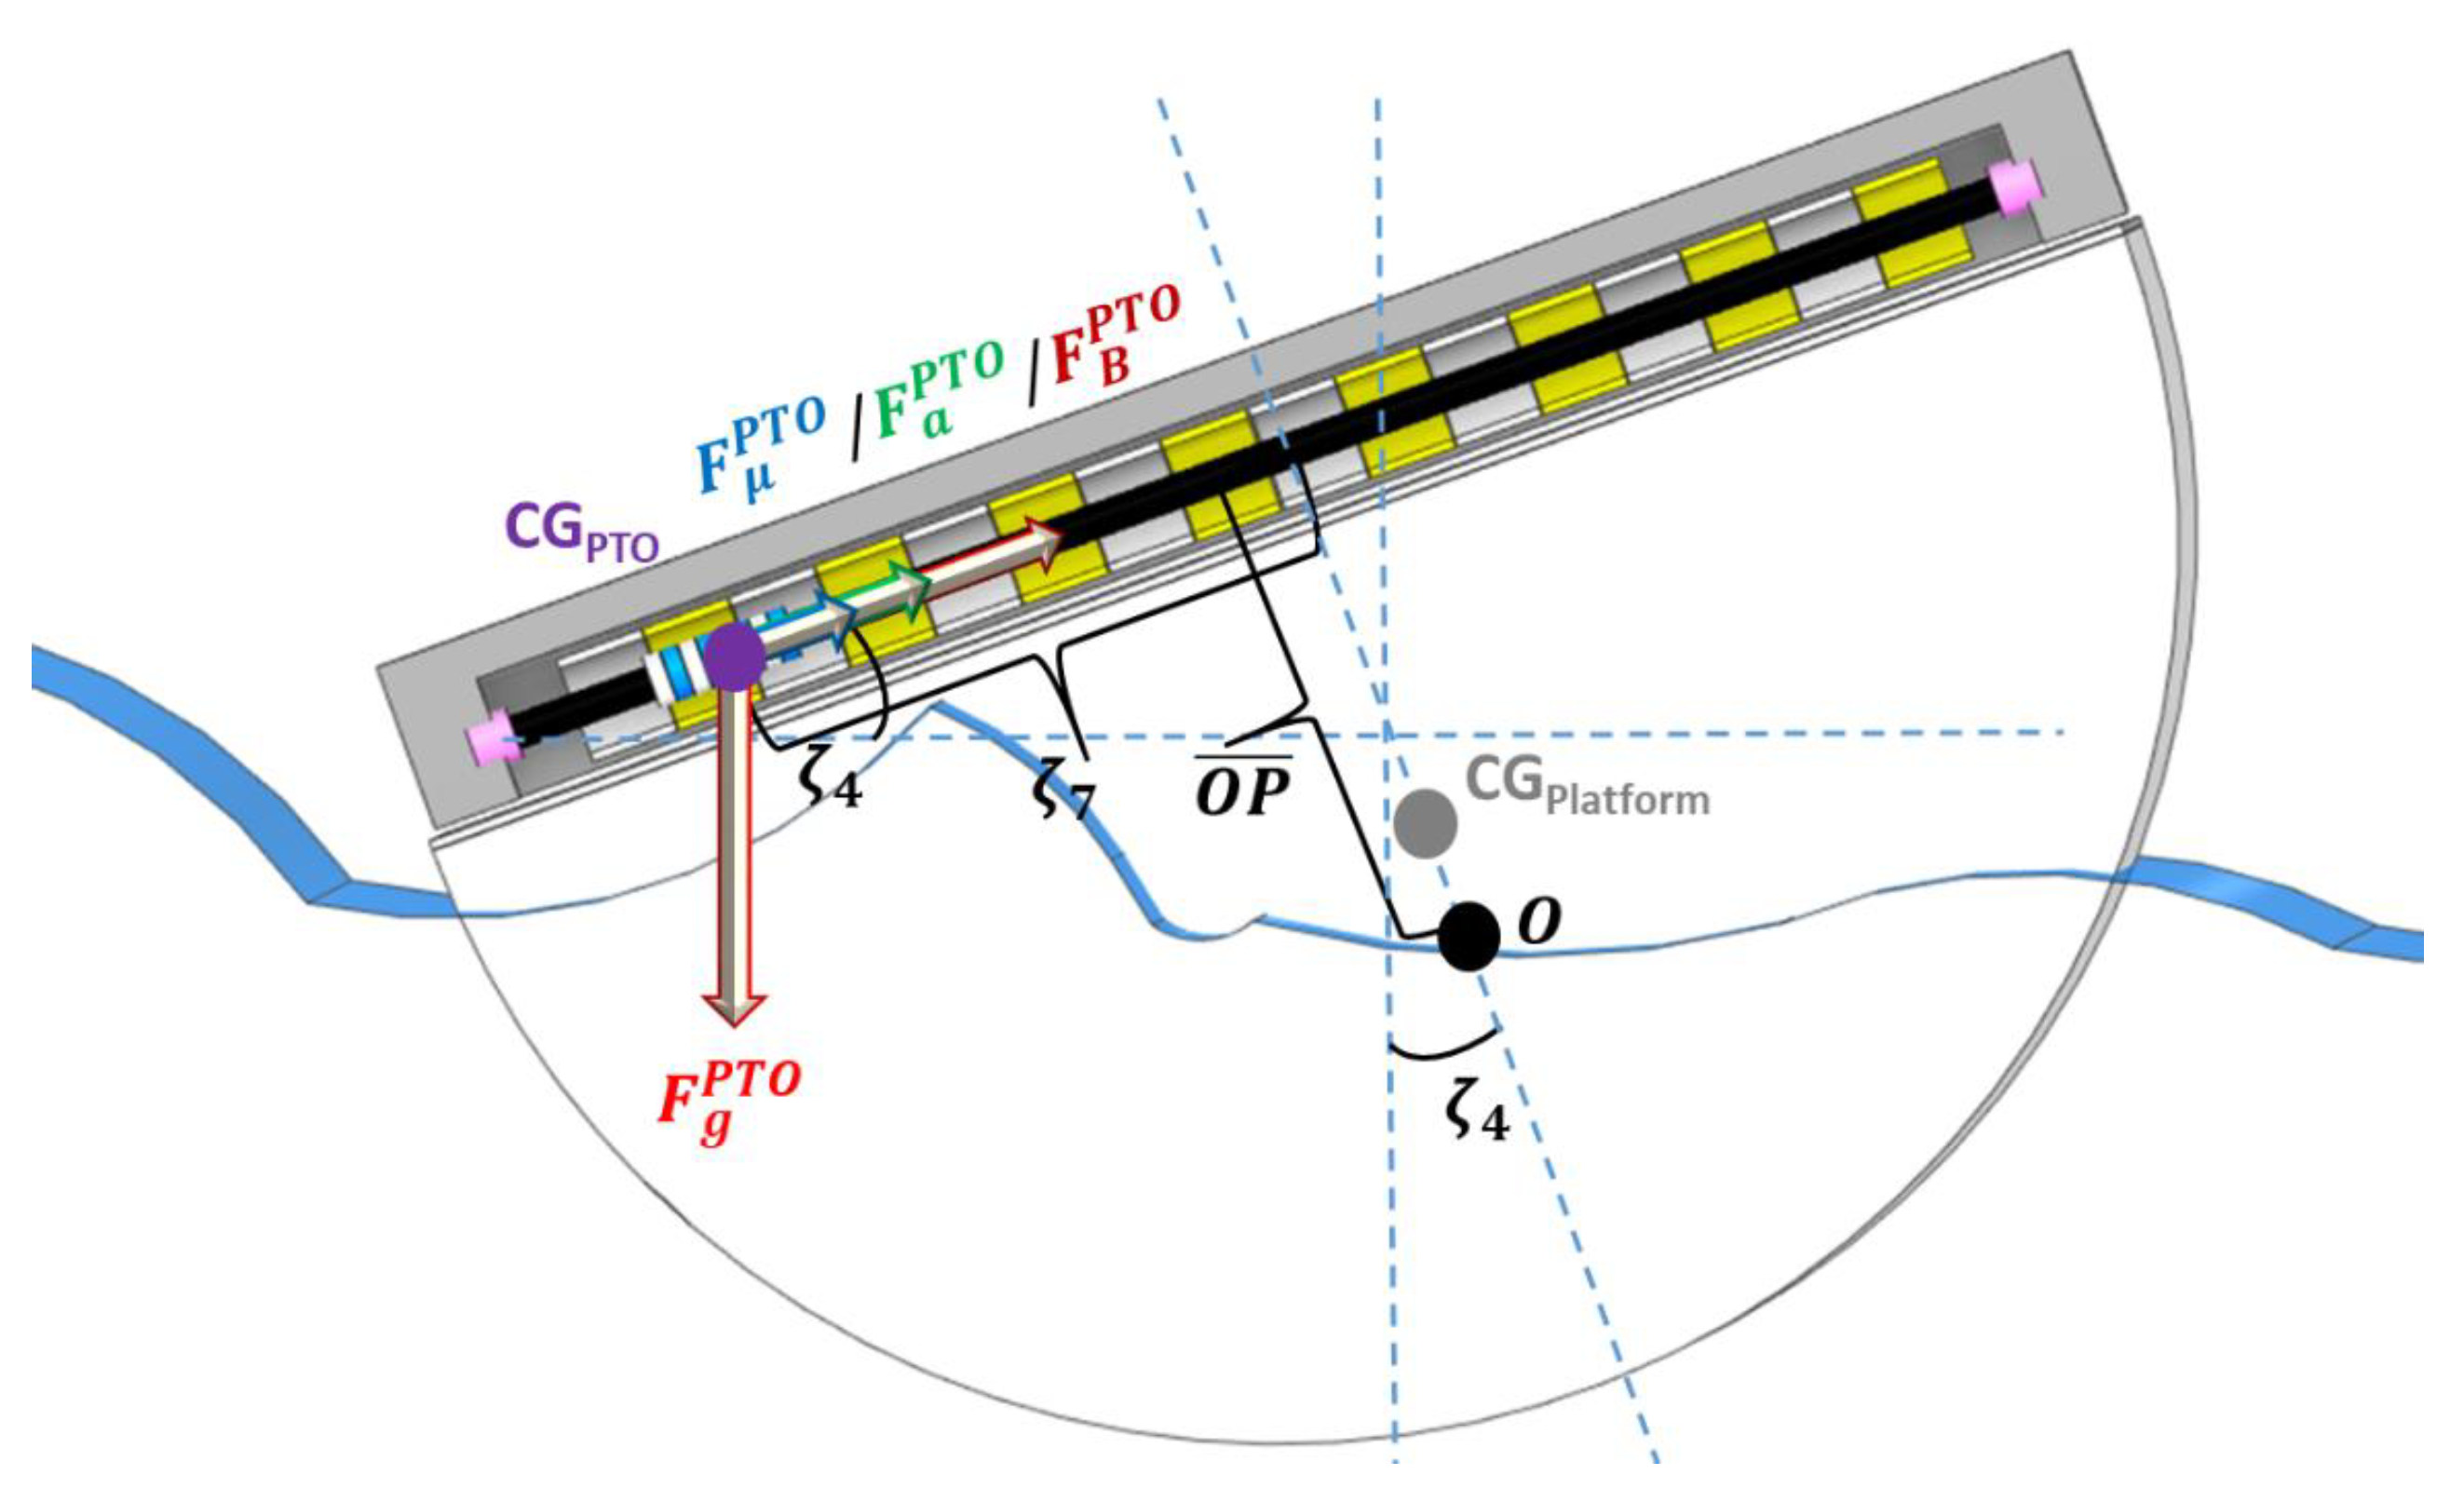
2.1. E-Motions

Devised from the direct observation of ship behaviour at sea and demonstrated experimentally in [25], E-Motions is a WEC concept of simple design. Nonetheless, it exhibits a high potential of adaptability to numerous marine applications and integration into various types of floating structures. Furthermore, the layout of the PTO inside an encasing superstructure, either at deck level or within the hull of the platform (Figure 2), ensures protection of the electromechanical components from the surrounding sea environment, namely from corrosion and direct wave impact. When subjected to wave (or wind) action, Figure 2a, the floating platform will tend to roll, creating a height differential between the superstructure’s end-stops. Due to gravity, the PTO will slide towards the lower end, gaining velocity over time, Figure 2b. With the passing waves and because of the restoring moment that is produced, Figure 2c, E-Motions will enter into a roll oscillation cycle with an amplitude and periodicity dependent upon the characteristics of the wave field and of the device itself. Consequently, the PTO will continue to slide along the superstructure, being this the main means of energy conversion.
The energy conversion process is highly non-linear, since it is dependent upon the wave–structure and structure–structure (or platform/superstructure–PTO) interactions. Initially, the wave–structure interactions can be mathematically described following well-known deductions found in the literature [22,52,53,54,55]. For a free-floating structure, the equation of motion can be derived through the application of Newton’s 2nd law, which can be developed either in a frequency domain or time domain (Cummins’ equation [56]). For the former, the time component is omitted and the complex amplitudes corresponding to each force/moment, as well as to the body motions, are considered. This yields:
F e , i = j = 1 6 ζ j [ ω 2 ( m i j + A i j ) + i ω B i j + C i j ] ,     f o r   i = 1 , 2 6
where ω is the (wave) frequency, F e is the wave excitation force/moment, m the mass matrix, ζ i the ith DoF of the floating structure, C the complex hydrostatic stiffness matrix, A the complex added mass (moment of inertia) matrix and B the complex damping matrix, which can be linearized [53,57,58], a priori. Notice that i differs from the corresponding subscript, as it refers to the imaginary unit.
The mass in Equation (1) can be obtained through direct measurement, while C requires the estimation of the mass moment of inertia or radius of gyration. Formulae for generic shapes are available, including for the three E-Motions variants considered in this study. To account for the superstructure and ballasts, Steiner’s theorem was applied. The formulae also enabled the estimation of the metacentric height (e.g., Scribanti’s formula), which is pivotal for stability assessment and estimation of the natural roll period. Other components, namely the hydrodynamic coefficients and the wave excitation, can be computed with numerical software, as was the case with E-Motions [26]. Even so, for this device, one must account for the contribution of the mooring system and of the mobile PTO, with the latter introducing an additional degree of freedom (DoF). This creates important non-linearities that require a time domain approach. As such, by considering the contribution of both the mooring system, F m , 4 , and the PTO, F P T O , the equation of motion for roll, ζ 4 , becomes:
F e , 4 ( t ) + F P T O , 4 ( t ) + F h , 4 ( t ) + F m , 4 ( t ) + F r , 4 ( t ) = m 44 ζ 4 ¨ ( t )
The mobile PTO generates a net roll moment, F P T O , 4 , which can be decomposed into two parts. One results from the projected gravity force, F g P T O , perpendicularly (and with an arm equal) to the PTO sliding DoF, ζ 7 . The other is formed by the net PTO force in the direction of ζ 7 , F P T O , 7 , with a constant arm O P ¯ (distance between the centre of rotation O, at waterline level, and the PTO, perpendicularly to ζ 7 ), Figure 3. Other acting forces on the PTO include the inertial response ,   F a P T O , whose absolute value is equal to F P T O , 7 ; friction ,   F μ P T O , and damping ,   F B P T O . The PTO’s sliding can be perceived as an inclined plane problem with a time-varying tilt.
The net PTO force can be written as:
F P T O , 7 = m P T O ζ 7 ¨ ( t ) = F g P T O sin ( ζ 4 ) ( F μ P T O + F B P T O )
From which one obtains:
m P T O ζ 7 ¨ ( t ) = m P T O g [ sin ( ζ 4 ) μ cos ( ζ 4 ) ] B P T O , 7 ζ ˙ 7
where m P T O , μ , B P T O and g are the PTO mass, PTO friction and damping coefficients and acceleration of gravity, respectively.
By including the deducted PTO contribution, Equation (4) can be re-written as
F e , 4 ( t ) + F P T O , 7 ( t ) O P ¯ + F g P T O cos [ ζ 4 ( t ) ] ζ 7 ( t ) = ζ ¨ 4 ( t ) [ I 44 + I P T O , 44 ( t ) ] + t g 44 ( t τ ) ζ 4 ˙ ( τ ) d τ + ζ 4 ( t ) [ C 44 + C m , 44 + C P T O , 44 ( t ) ]
where I 44 and I P T O , 44 are the mass moment of inertia values of the floating platform, which includes the added mass moment of inertia term at infinite frequency, and PTO components, respectively; C 44 , C m , 44 and C P T O , 44 are the hydrostatic restoring coefficients of the platform, mooring system and PTO, respectively; and g 44 is the “memory” function, related to the damping term. Some higher-order terms, such as those related to the mooring system, are omitted here, by simplification.
In order to obtain the average power output P P T O ¯ , one must integrate the product of F B P T O , which can be isolated in Equation (3), by the PTO velocity, ζ ˙ 7 , over the time interval T, as presented below:
P P T O ¯ = 1 T 0 T F B P T O ζ ˙ 7 d t

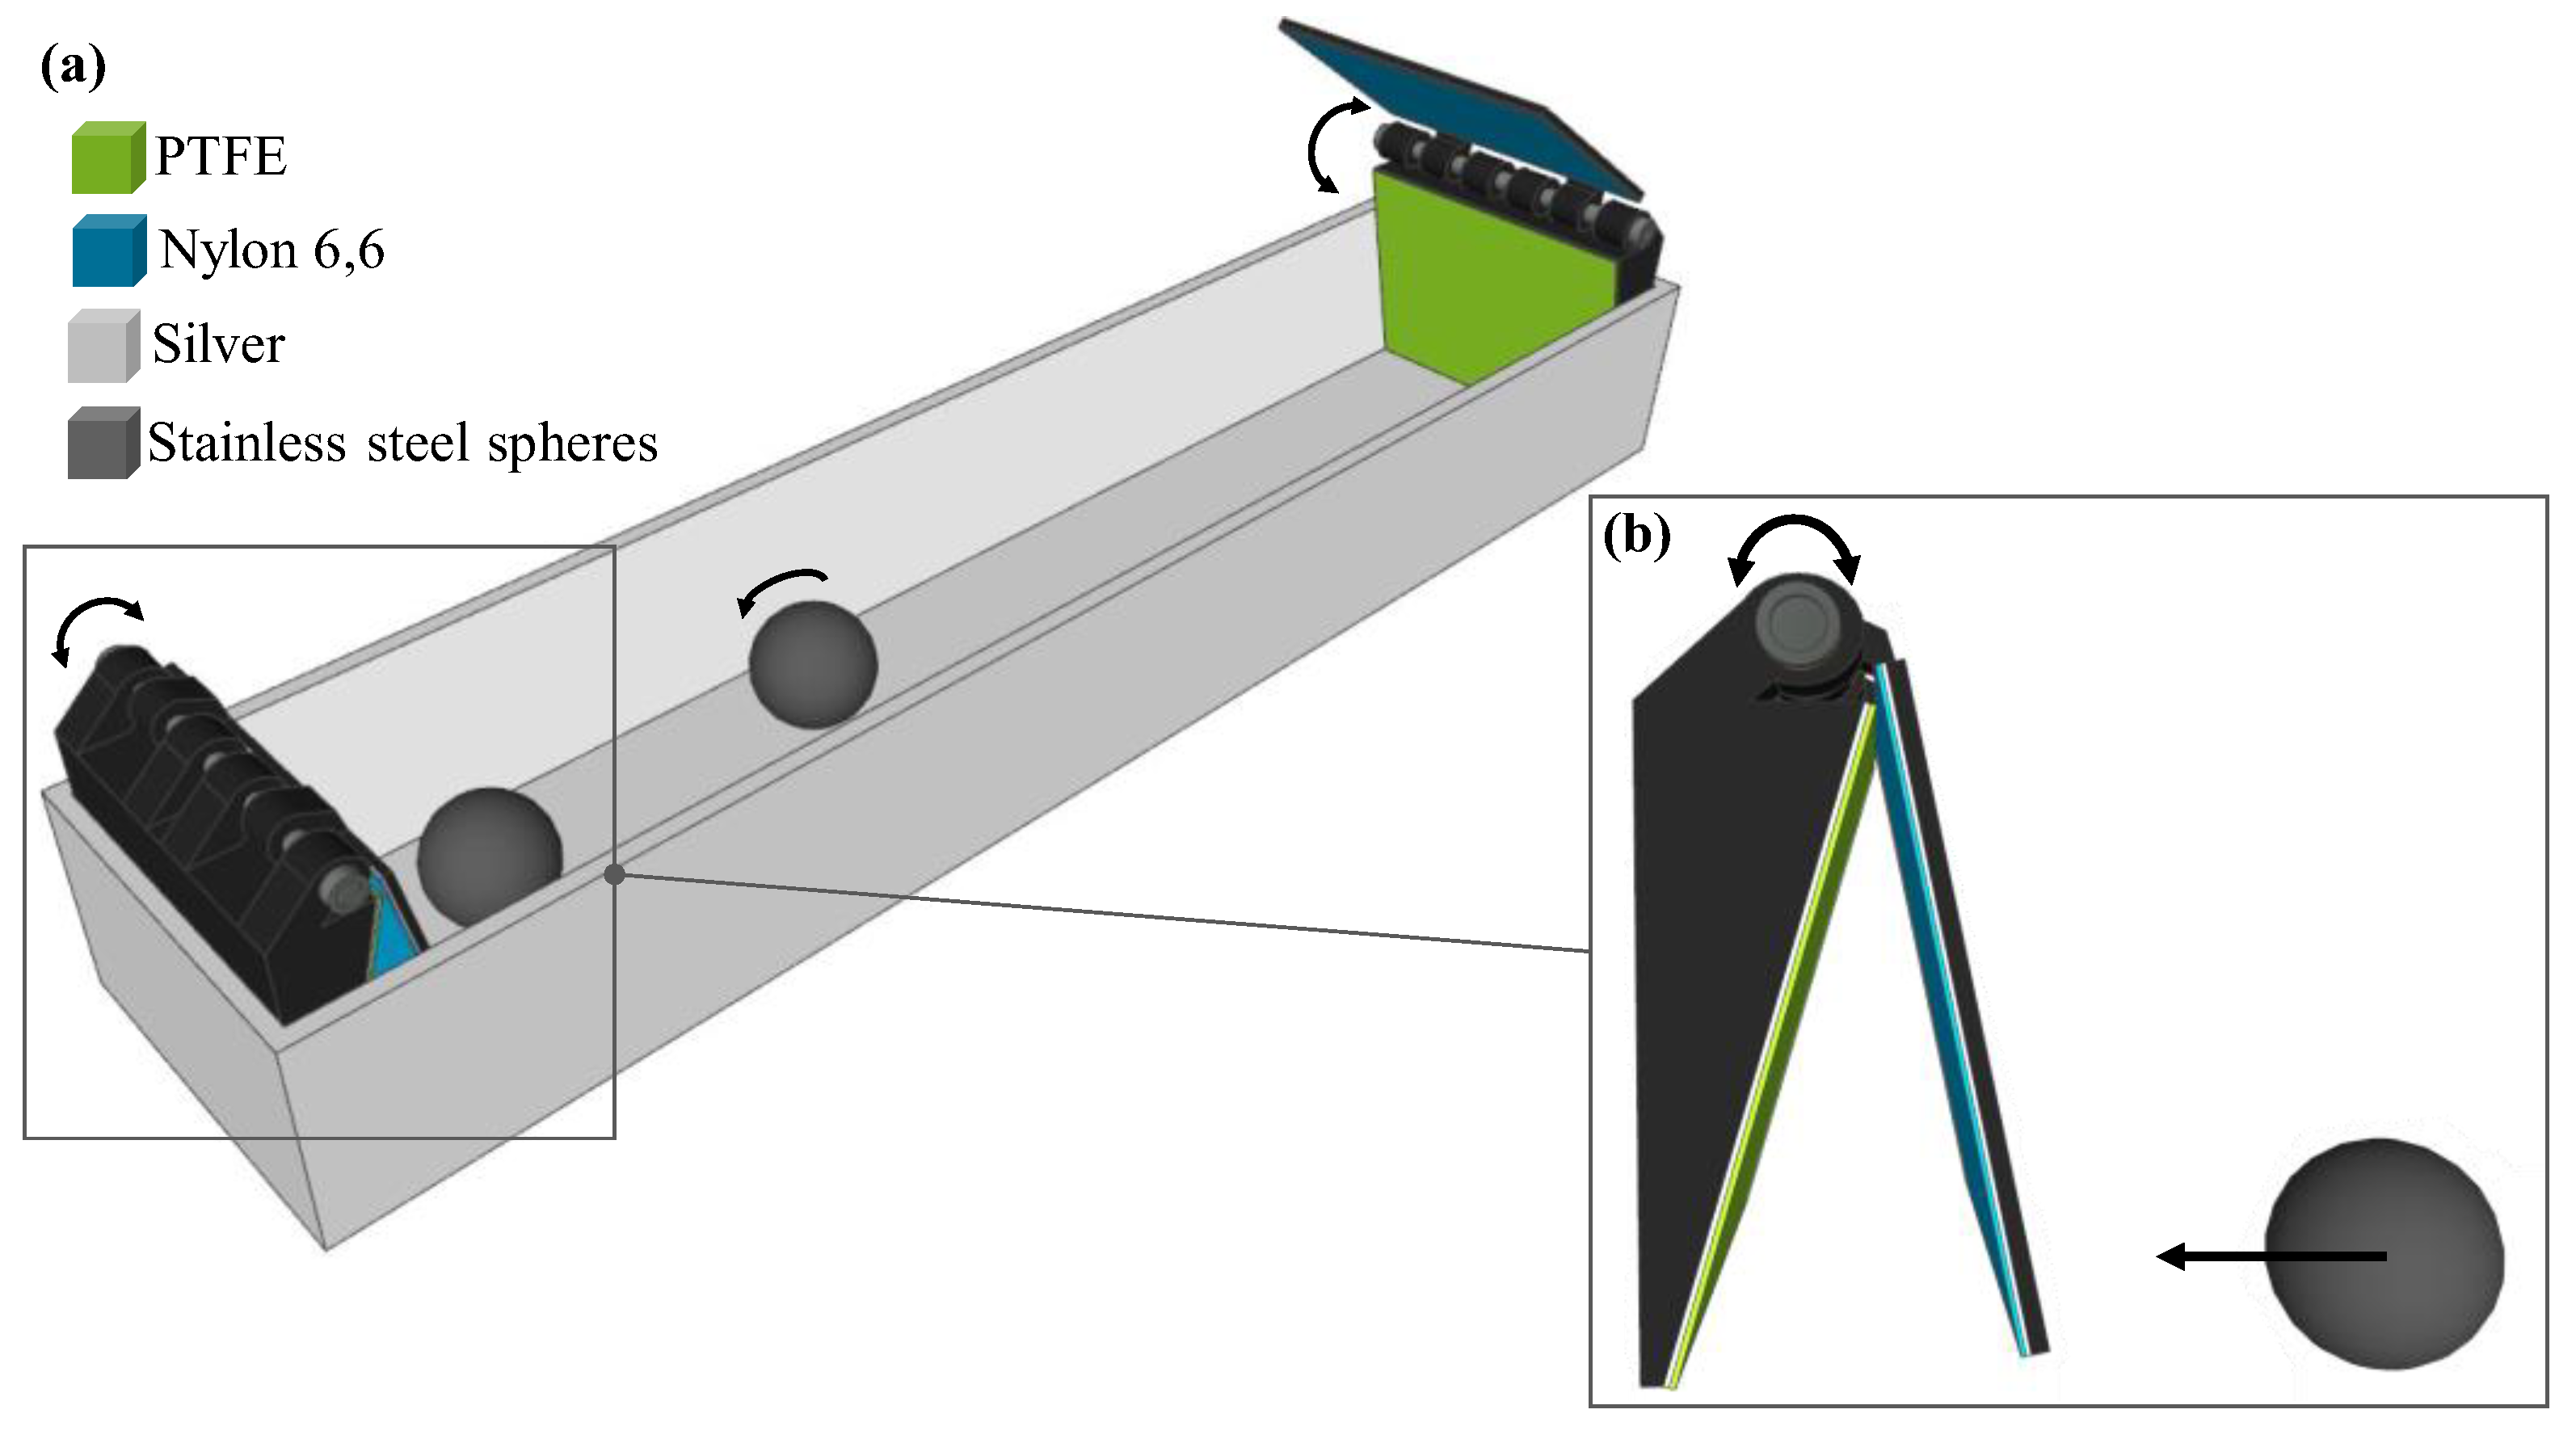
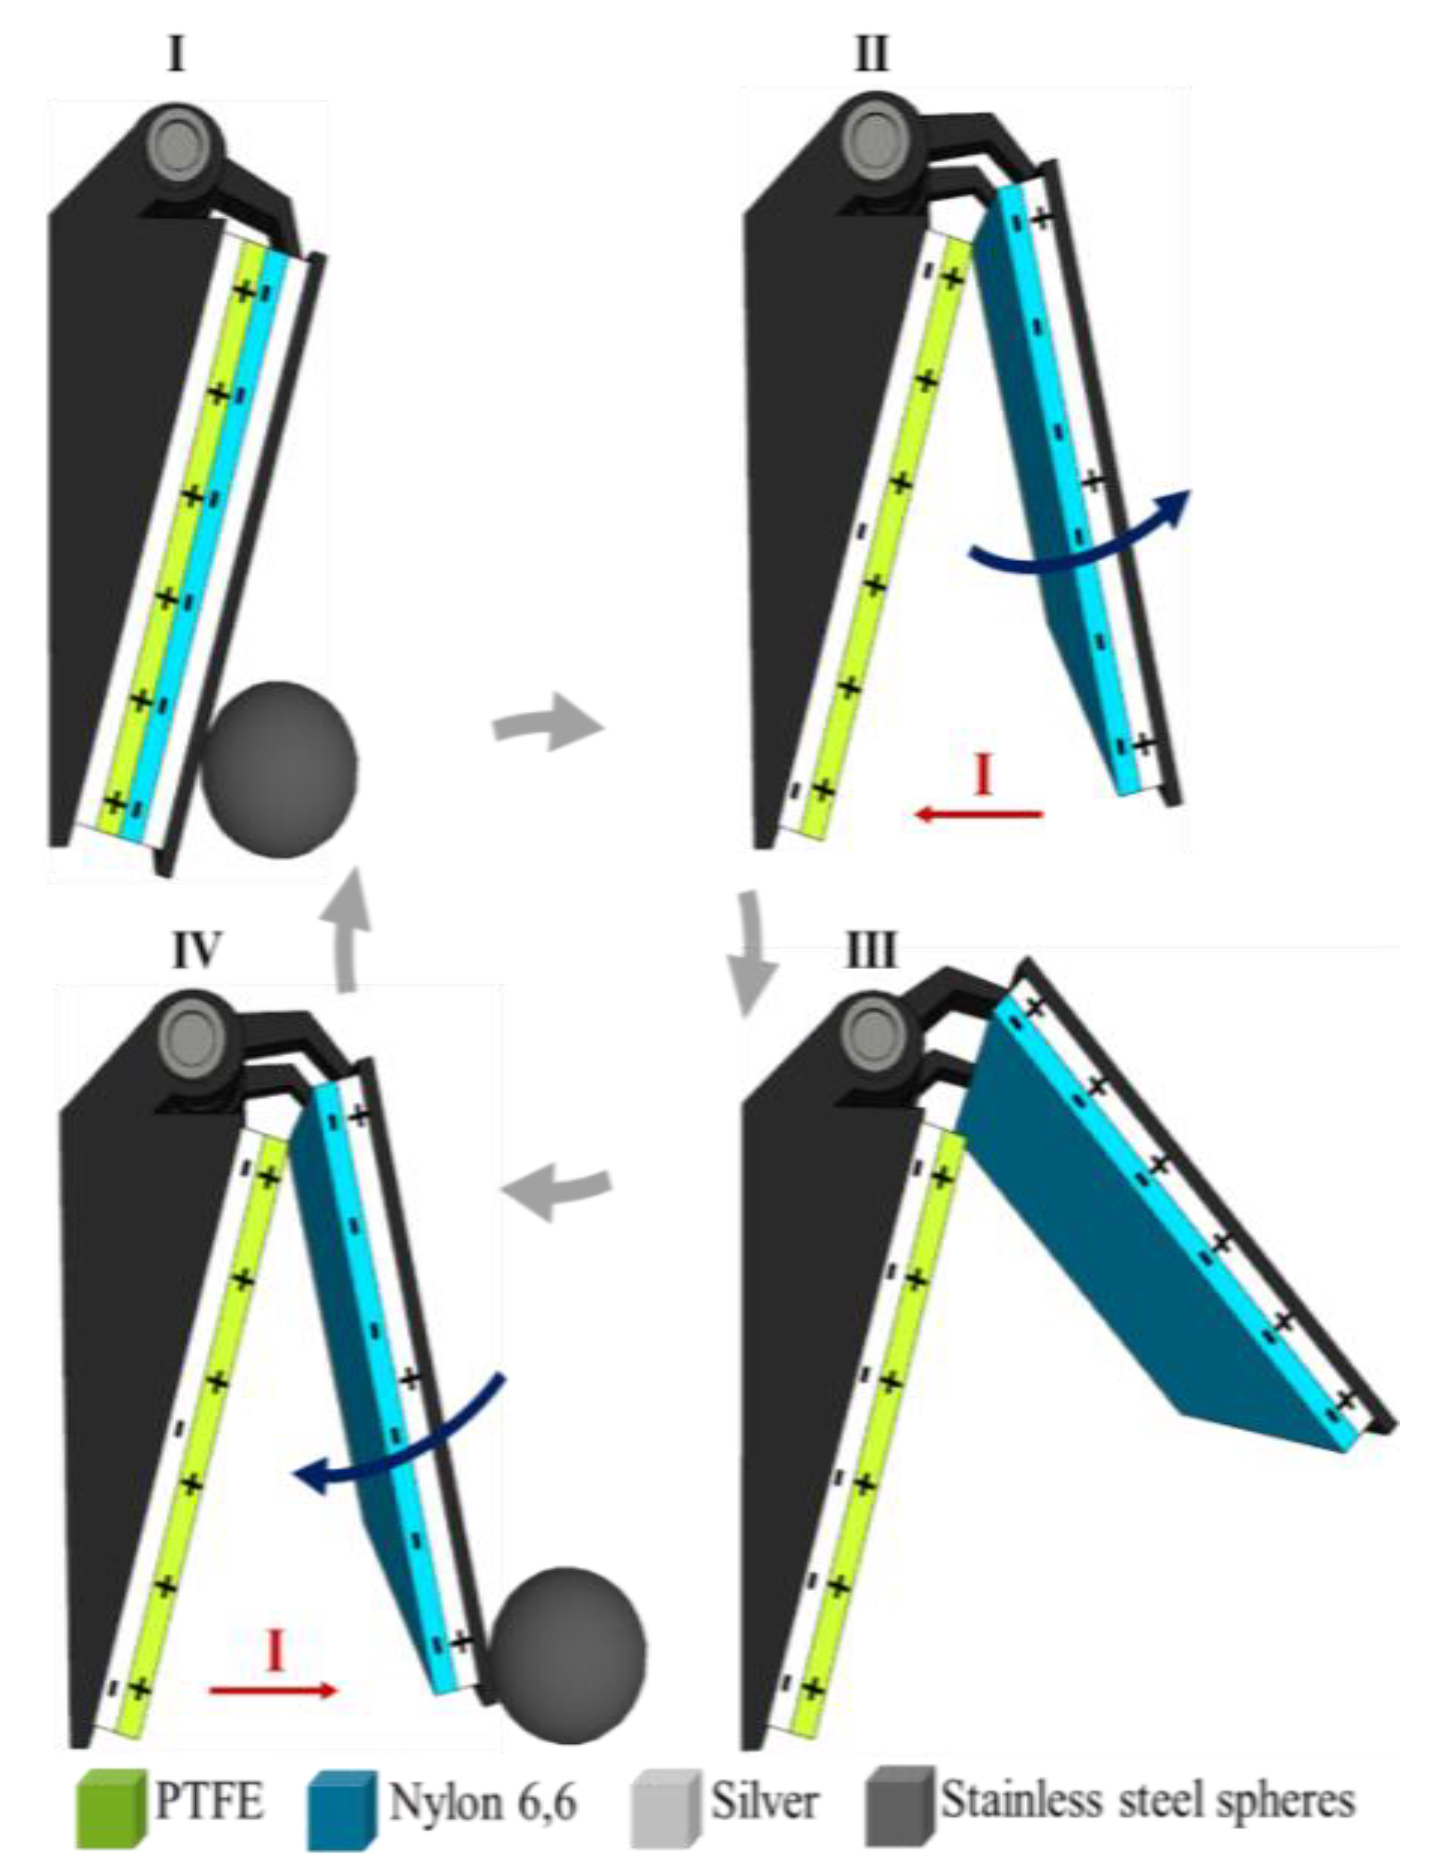
2.2. Triboelectric Nanogenerators

Based on the combination of triboelectrification and electrostatic induction effects, triboelectric nanogenerators (TENGs) convert randomly distributed and ubiquitous mechanical energy into electricity [59,60,61,62]. With the advantages of lightweight, easy encapsulation, low cost and high efficiency, particularly from low frequency oscillations, TENGs are presented as a suitable technology for ocean wave energy harvesting [63,64,65]. Basically, a TENG is composed of two triboelectric materials with different polarities, an air gap between them and two metal electrodes. When two triboelectric surfaces with opposite triboelectric charges have contact and separate from one another, a potential differential is created, driving electrons to flow between the two metal electrodes. Design configuration of TENGs, based on freely moving rolling spheres, allows them to harvest energy from arbitrary and multidirectional motions of floating bodies. This occurs even under low-frequency and irregular waves, since the spheres promote the contact and separation of triboelectric pairs [28]. In this work, a lateral TENG based on rolling-spheres (Figure 4) was developed to take full advantage of all the degrees of freedom of the floating platform motion, as well as to provide a correlation between its hydrodynamic response and triboelectric energy generation. The lateral-based TENG is composed of two tribo-devices fixed on lateral ends of narrow and flat PLA troughs. Under the action of ocean waves, the spheres move along the trough and collide with the tribo-devices fixed on the lateral ends, thus promoting the contact and separation between the tribo-pairs. The developed TENG was encapsulated within the hull, protecting it from direct contact with the harsh conditions of the ocean environment. The TENG’s encapsulation allows this device to work normally in humid and salt environments, making the application of this technology reliable and robust.

3. Experimental Campaign Setup and Methodologies

The experimental study of the E-Motions was carried out at a 1:20 geometric scale, based on the Froude similarity criterion. Three different hull designs for the physical models were considered, with the E-Motions’ PTO being reproduced as a damped encasing based on Lenz’s Law. The lateral-based TENG was assembled within the half-cylinder physical model to study the dependency of the electrical outputs under different wave conditions. A thorough description of the equipment layout, model construction, mooring connections and wave conditions selection is presented in the following sub-sections.

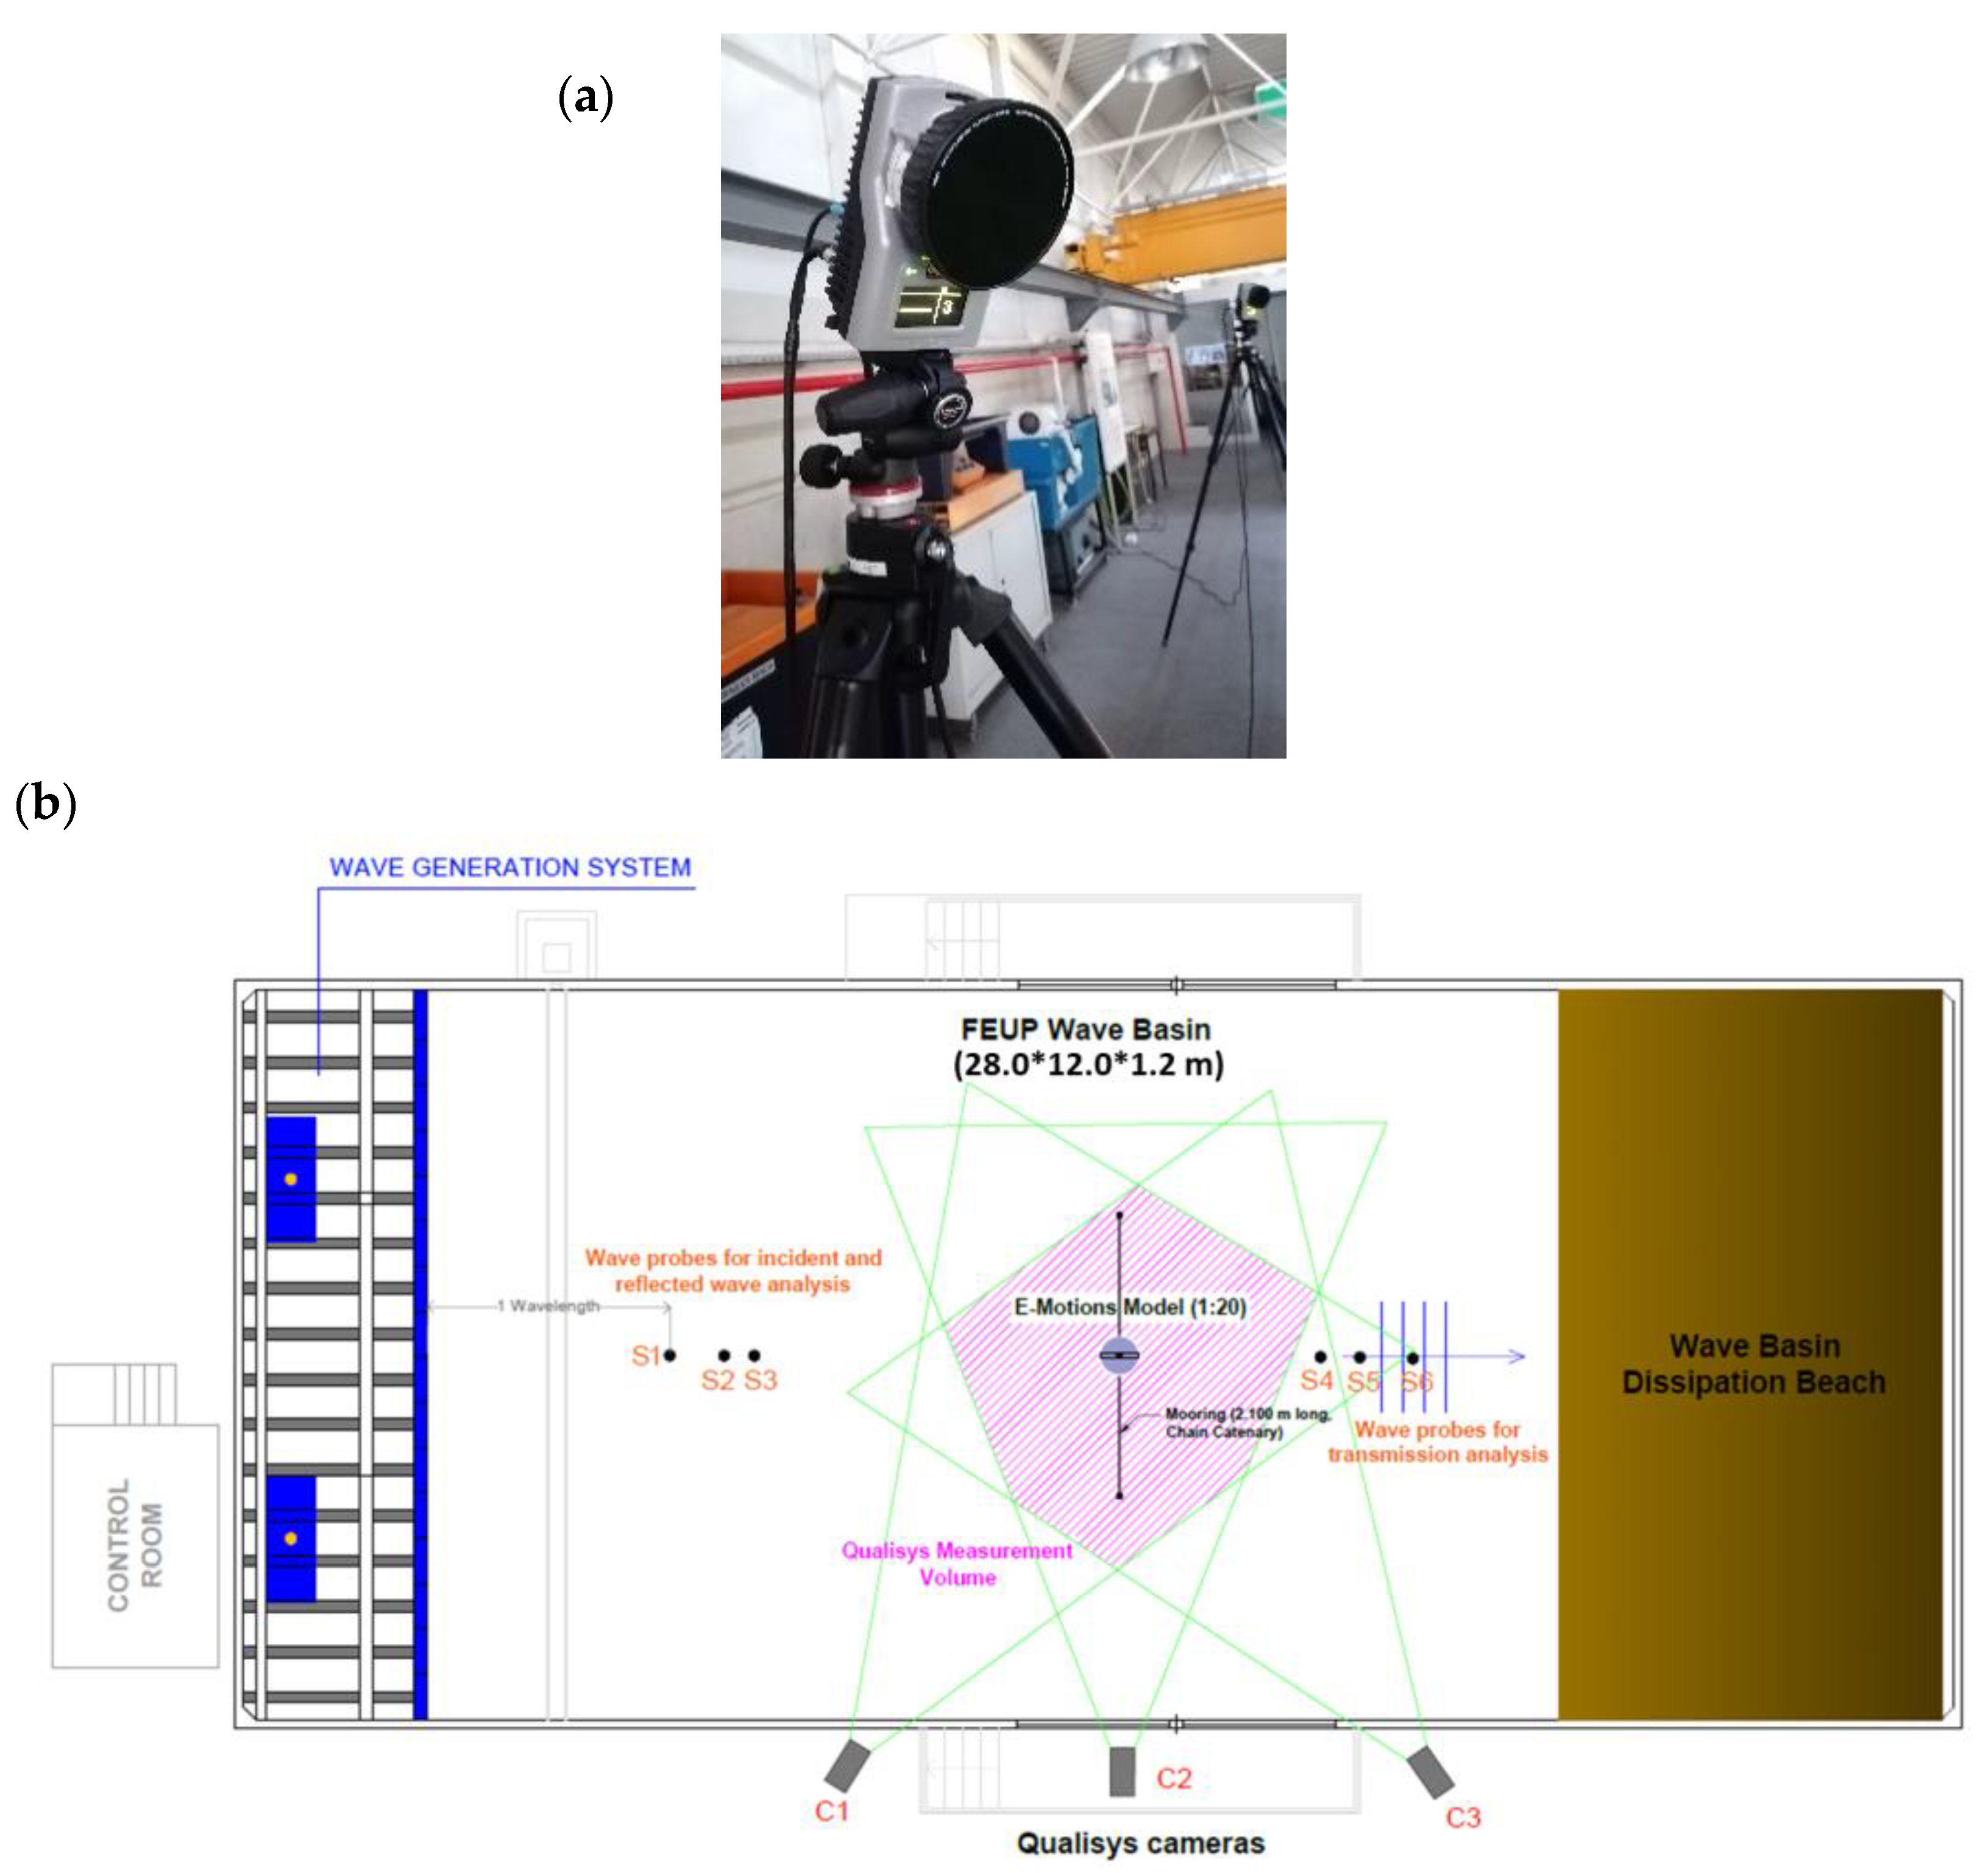
3.1. Equipment and Facility

The experimental study was carried out within the wave basin of the Hydraulics Laboratory of the Hydraulics, Water Resources and Environment Division (SHRHA), at the Faculty of Engineering of the University of Porto (FEUP). The wave basin includes a wave tank that spans 28 m in length, 12 m in width and 1.2 m in depth. A multi-element piston-type wavemaker (HR Wallingford, UK) was used to generate the selected wave conditions, while a dissipative beach, on the opposite end of the basin, ensured the minimization of reflected wave energy back to the physical modelling area, Figure 5b. In terms of equipment, two separate sets of infra-red markers were strategically integrated onto the top of each model’s superstructure and PTO. This enabled real-time tracking of the motions, velocities and accelerations of each component of the physical models through the Qualisys system [66]. Average residuals obtained during the tests were kept below 0.5 mm, with the system being recalibrated daily and upon reaching this threshold. The free surface elevation was measured via two groups of resistive-type wave gauges (±0.4 mm accuracy): one for reflection and another for transmission analysis. This can be seen in Figure 5a, which also depicts the initial reference position of the physical model, the disposition of the wave gauges and the layout of the mooring system.

3.2. Physical Models and Mooring System

The physical models considered in this 1:20 geometric scale study were designed based on the outcomes of a preceding numerical study [26]. It is worth noting that a water depth of 0.8 m was considered in the experiments, also in accordance with the numerical study. In total, three E-Motions models with different hull designs/variants were constructed: a half-cylinder, a half-sphere and a trapezoidal prism. The respective hulls and decks were fabricated in methacrylate from cast moulds, with the exception of the HS’s deck, which was made from a PVC layer. Ballasts were introduced into each physical model to calibrate the physical properties, particularly the metacentric height and the natural roll period, T n , 4 . The superstructure was constructed as a metal porch with an inverted U-shape aluminium encasing on top and two vertical metal rods serving as end-stops and connections to the platform component. Two PVC layers were added on the flanks to further enclose the superstructure and partially isolate the PTO from the surrounding environment, as would be expected in reality. The characteristics of each physical model are summarized in Table 1.
Regarding the mooring system, which was selected based on the preceding numerical study [26] and the guidelines of DNVGL-OS-E301 [67,68], two galvanized studless steel chains were setup between the bow and stern of the physical models, at waterline level, and two corresponding submerged anchor points, at a distance of about 2.00 m. Each chain extends 2.16 m in length, with a nominal diameter of 6 mm and a weight of 0.729 kg/m.

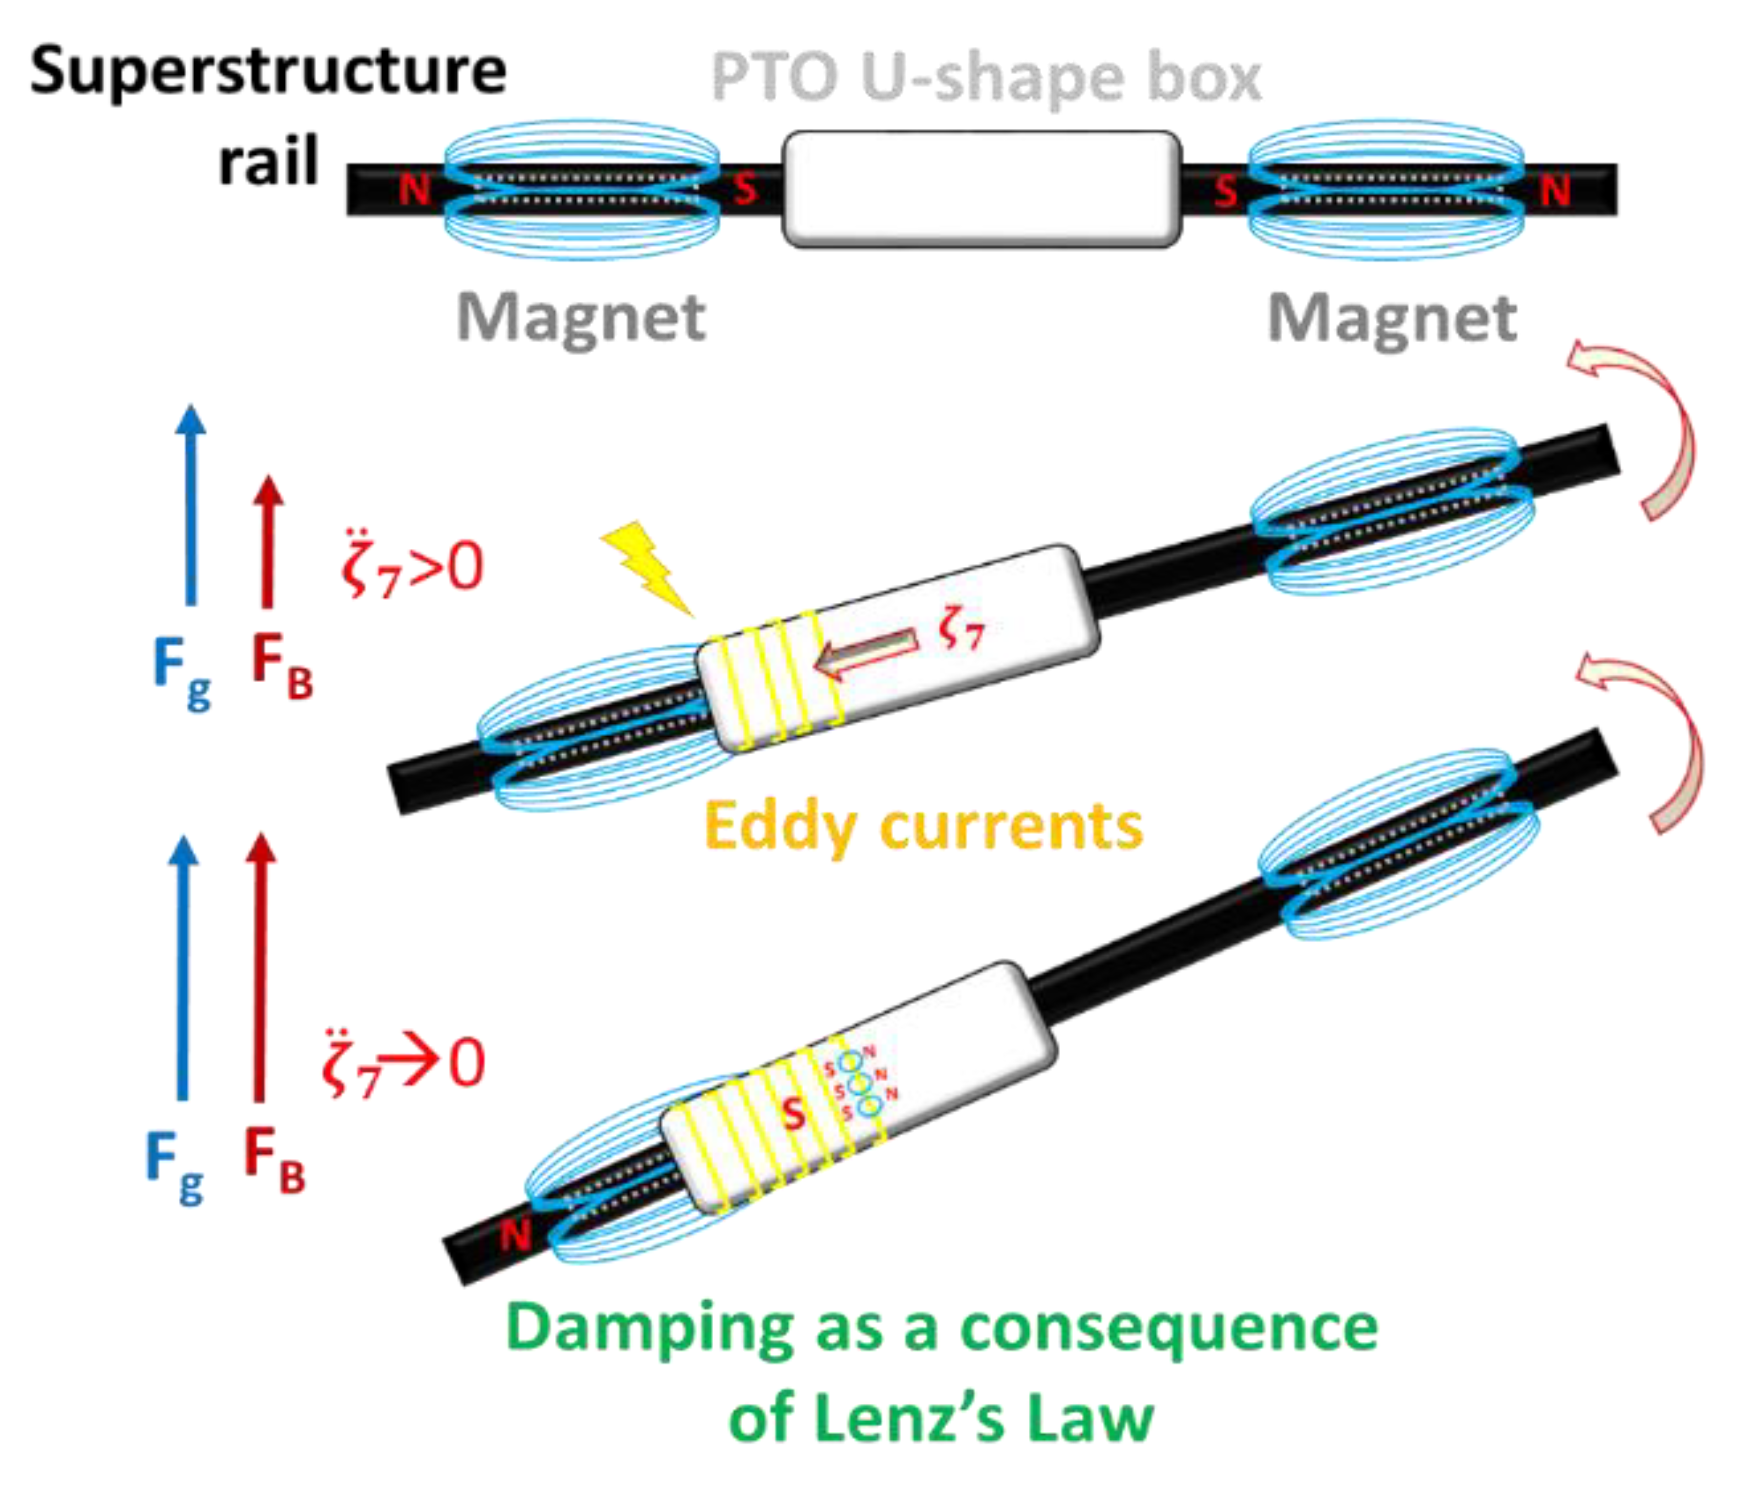
3.3. PTO and TENG Reproduction

In order to reproduce E-Motions’ PTO, an approach based on electromagnetic induction and Lenz’s law was selected. The system, itself, is composed of a hollow aluminium box (2 mm thin and 0.080 m long, weighing nearly 0.147 kg) and a set of evenly spaced neodymium magnets (six, each of them weighing 0.130 kg) placed inside the superstructure’s rail. A lightweight-wheeled cart was connected to the aluminium box and introduced into the superstructure’s inverted U-shape encasing, so as to enable the sliding motion of the mobile PTO (total weight of 0.229 kg). For this component of the physical model, the cart’s wheels are the only source of physical friction, as the aluminium box and the magnets only interact through electromagnetic induction.
Given the challenges and limitations inherent to PTO reproduction in experimental studies, as outlined in [69], the proposed solution was of simple design and application, without the need for complex electronic equipment. Moreover, this approach permitted a pseudo closed loop damping system. Recalling that the PTO slides towards the lower end of the superstructure, due to gravitational pull (the platform is assumed to be inclined due to wave-induced roll), the aluminium box will pass through the magnets, each of them producing a magnetic field, Figure 6. This, in turn, will induce eddy currents on the surface of the hollow box, which act as small solenoids generating their own magnetic field. By Lenz’s Law, these fields will oppose those produced by the magnets, creating a pseudo damping system for the reproduced PTO. The “electromagnetic damping” will tend to nullify the acceleration of the sliding PTO ( ζ ¨ 7 0 ), although one must also account for the variation of the induced field due to the alternating magnets. Since the gravitational and net forces acting on the PTO can be obtained through the Qualisys system (platform roll angle and PTO acceleration, respectively), as well as the PTO’s velocity, one can estimate the instantaneous, maximum and average power output by applying Equations (4) and (6). Here, it is considered that the friction force is secondary/negligible, by comparison, since the PTO would begin to slide at a tilt angle below 4°.
The unidirectional lateral TENG (Figure 7) is composed of two tribo-devices fixed at opposite ends of a polylactic acid (PLA) trough of 4.0 × 21.5 cm2. The tribo-devices consist of Nylon 6,6 and PTFE films with electrodes made of conductive thin silver films, which were fabricated using screen printing. Each generator has PLA supporting substrates with 2.65 × 3.75 cm2, onto which PTFE/silver and Nylon 6,6/silver films were attached with the same dimensions. To promote the contact separation of the two triboelectric materials of each tribo-device, two stainless steel spheres with a diameter of 12 mm and a weight of 7.2 g were used.
Under the excitation of ocean waves, the spheres roll and, when hitting the lateral ends of the trough, make the Nylon 6,6 and PTFE films come into contact with one another, becoming charged by contact electrification. With the tribo-generator fully closed, the electrostatic equilibrium is attained, there are no induced charges on the electrodes and the current is zero (Figure 7-I). When the PLA supporting substrates begin to open, a potential differential is induced due to the separation of the two tribo-surfaces, resulting from the wave oscillation. Consequently, a current will flow between the two electrodes (Figure 7-II) and continue until the two tribo-materials are at a maximum distance (Figure 7-III). Afterwards, the spheres continue to roll and promote the approximation of the triboelectric pairs, which results in a current flow in the external circuit in the other direction (Figure 7-IV).

3.4. Test Plan and Selection Methods

For this experimental study, a total of eight reference sea-states were selected, assuming operational conditions under irregular long-crested wave action. The selection of the wave conditions followed on the bin methodology proposed by Pecher and Kofoed in [22], which was applied to the case studies of Aguçadoura and São Pedro de Moel. The respective resource matrices were obtained from the numerical studies conducted by Silva et al. [29], which include data on the available wave energy distribution and the number of hours of registered occurrences for each H s T p combination (significant wave height and peak wave period, respectively). From this data, it was possible to compute the wave power per metre of wave crest in deep water, P w , and the probability of occurrence, P r o b S S i , of a given sea state, SSi, as:
P w ρ g 2 64 π H s 2 T e ,     w i t h   T e = T p 1.12   c o n s i d e r i n g   a   J O N S W A P   s p e c t r u m
P r o b S S i = T S S i T S S i
where ρ is the water density, T e the wave energy period and T S S the number of hours of occurrence inherent to a given sea-state.
Initially, seven bins were constructed from separate groups of four adjacent H s T p blocks (0.5 m and 0.5 s of interval, each), thus encompassing 28 combinations for each case study (total of 56). The next step involved the computation of the occurrence contribution, associated with each bin, by adding up the four P r o b S S values from the composing sea-states. A similar procedure was applied when computing the respective energy contribution. This step was executed for both case studies, representing almost 60 and 70% of the total available resource and number of hours of registered occurrences, respectively, Figure 8. The considered methodology also enabled the estimation of the inherent H s and T e , representative of each bin. However, values of H s above 5 m were neglected at this stage, as these are considered to be storm conditions for the Portuguese coastline.
The following step in the application of the methodology implied the selection of the most representative bins from each case study (in other words, 7 out of 14). As seen in Table 2, Aguçadoura contributed with four bins, while São Pedro de Moel yielded the remaining three.
The final step involved the introduction of an additional bin that would encompass the T n , 4 of the physical models (vicinity of 9 s, prototype value). Based on the distribution found in the resource matrices, a reference peak wave period of 8.96 s was selected, with a corresponding T e of 8.00 s and a H s of 1.33 m. The final test plan is presented in Table 3. Note that the reference values were scaled down in accordance with the Froude similarity criterion, for the purpose of the physical modelling study (scale of 1:20).
The operational conditions were reproduced for a duration of 512 waves, as recommended in literature [22,70]. A total of 72 tests were performed: 3 × 3 × 8. The tests were conducted for each physical model—a control case, with the model characteristics from Section 3.2, and two additional cases with adjustments (e.g., ballast configuration and magnet layout) to each physical model, in accordance with their observed performance.

4. Results

Each physical model was tested for three distinct sub-variants. The “control” cases (designated as V1) have already been described, but the additional sub-variants (designated as V2 and V3) differed from one model to the other. The definition of the modifications was based on the outcomes of the “control” cases, which were run first. In detail, the following observations were made:
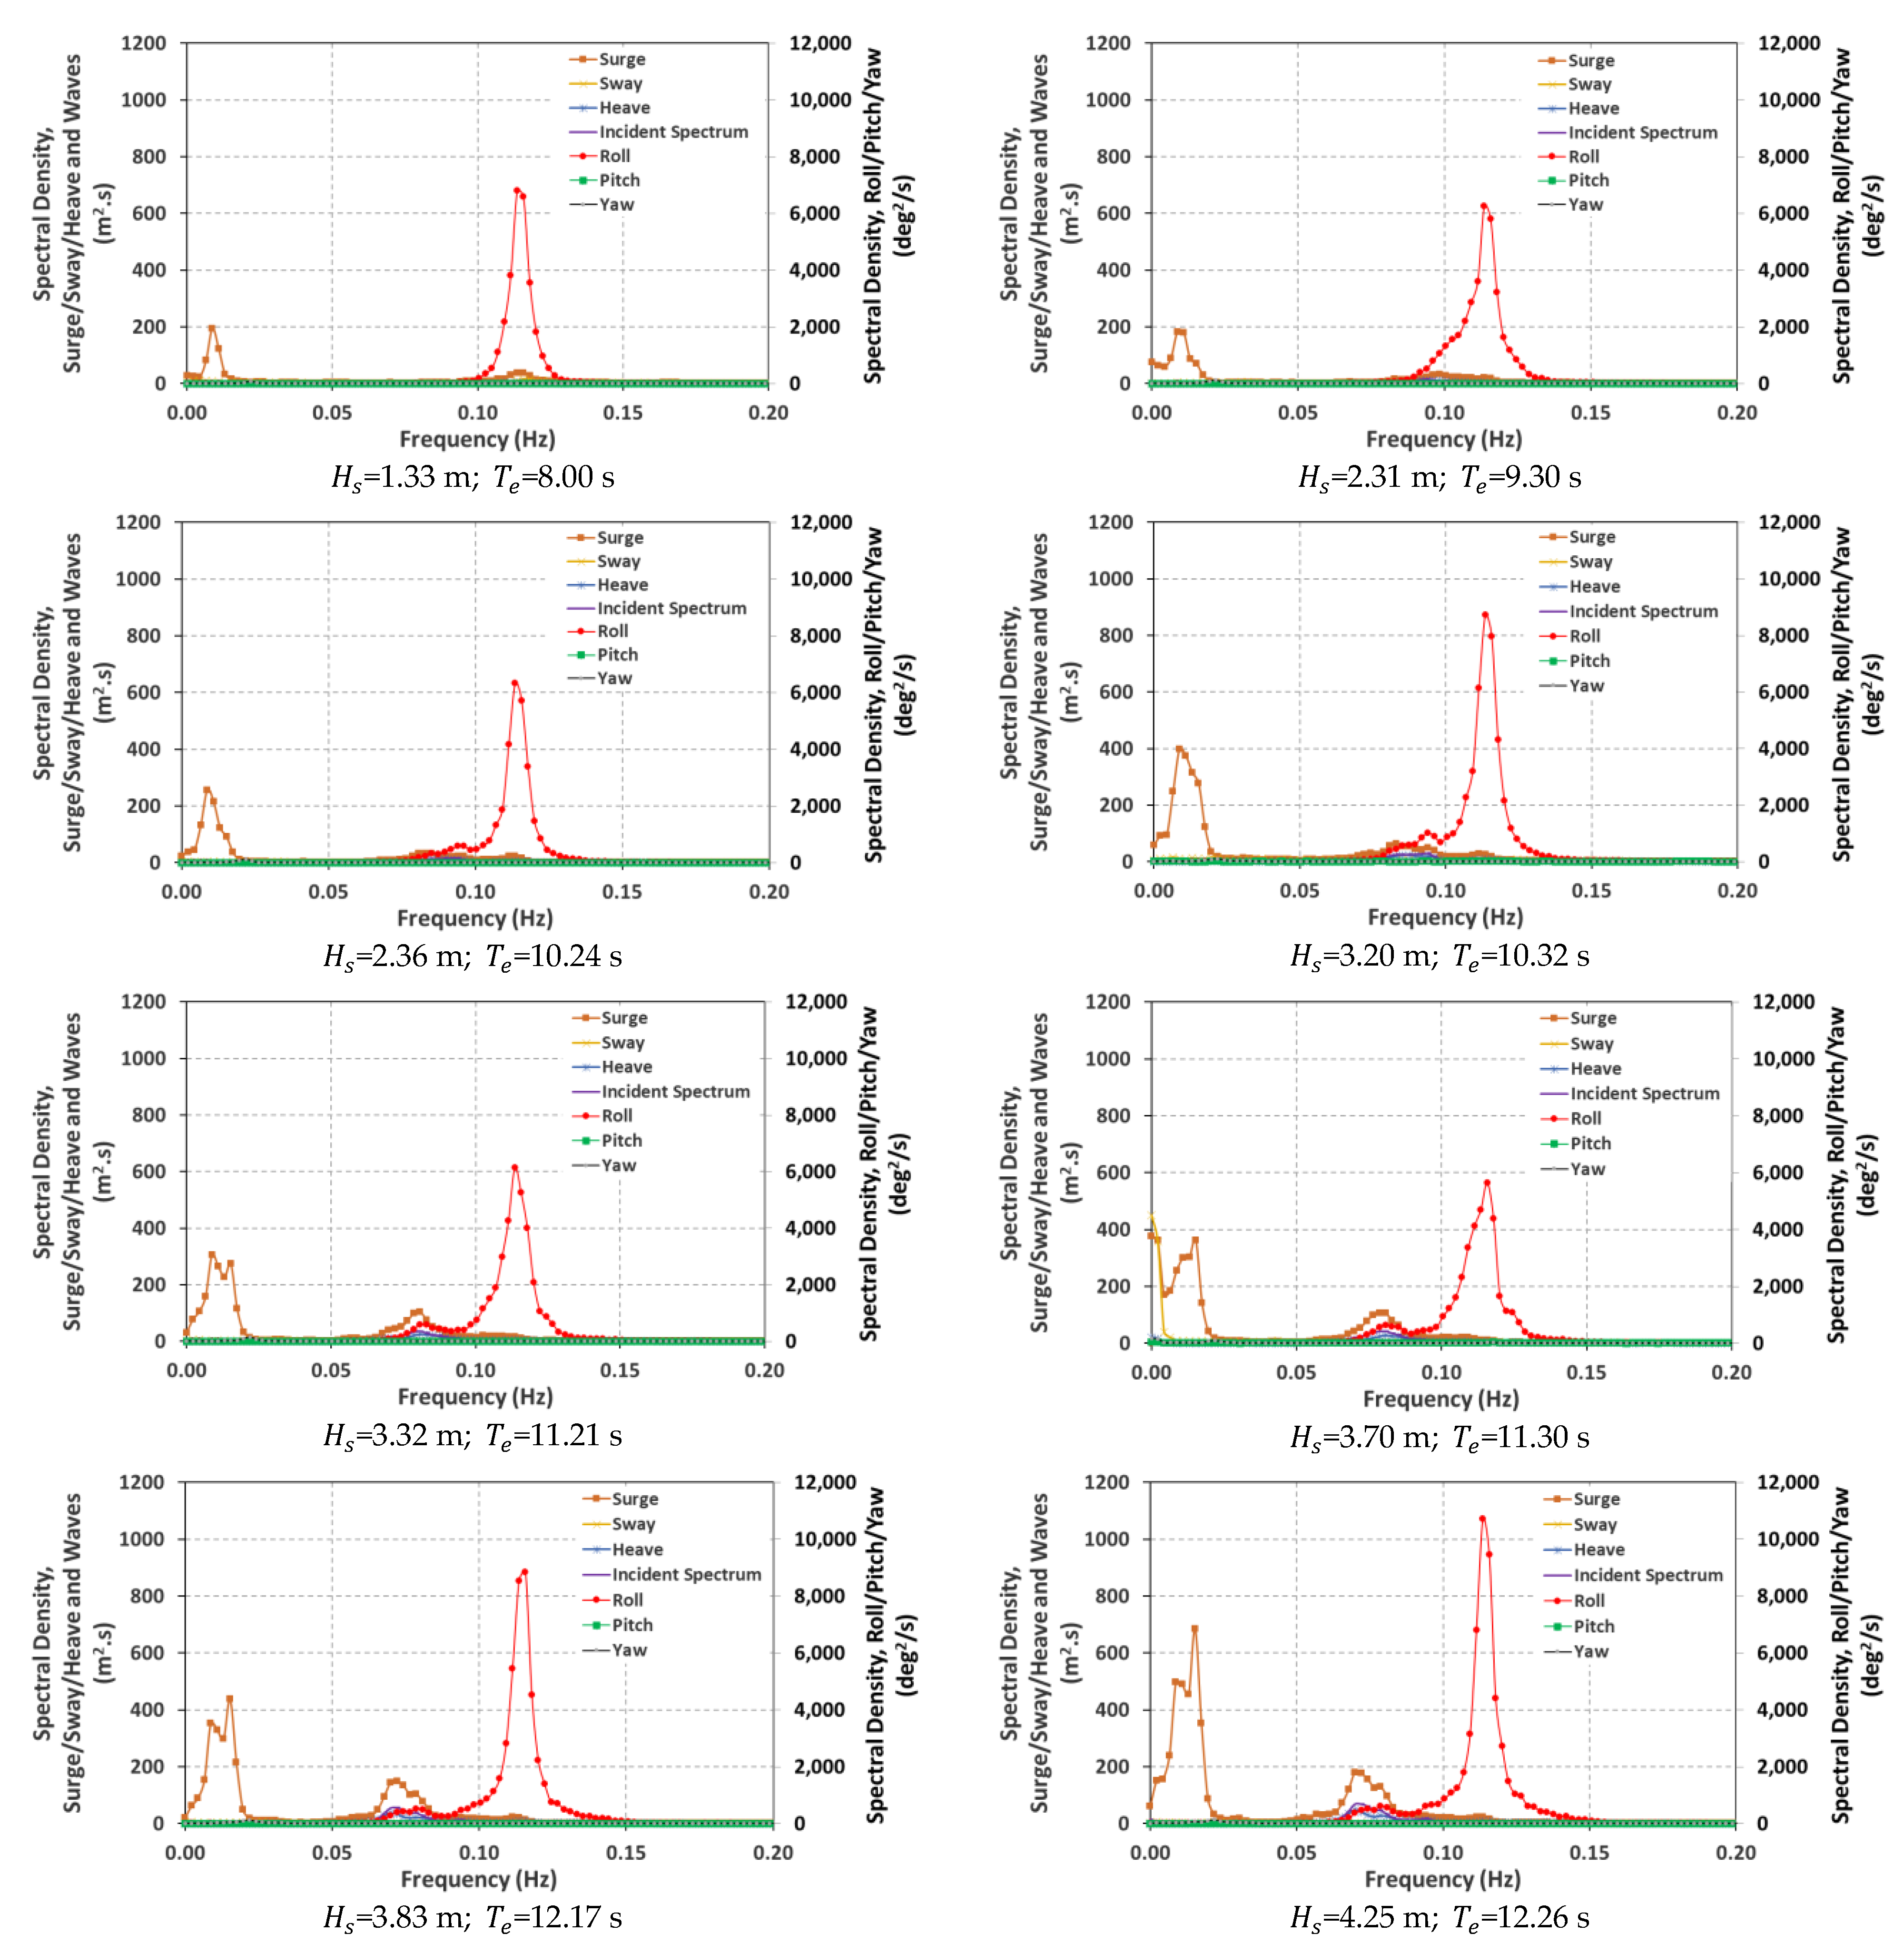
  • Half-Cylinder V1: generally broad and consistent hydrodynamic roll response over the considered test conditions, denoting large roll amplitudes (up to 40° or slightly higher). Recurrent PTO slamming against the end stops of the superstructure, albeit not constant.
  • Half-Sphere V1: broad hydrodynamic roll response, but not as consistent or wide, in terms of roll amplitudes, as that of the HC. Tendency to misalign with the incoming waves, leading to a combination of roll and pitch oscillations (with regard to a body-bound coordinate system). PTO “stalling” between one of the end-stops and the middle of the superstructure: sliding along only half of the available rail amplitude.
  • Trapezoidal Prism V1: similar occurrences to those reported for the HS. However, the PTO would generally slide along a wider extension (3/4 of the available amplitude) of the superstructure’s rail, with frequent impacts against one of the end-stops being reported.
Consequently, specific modifications were carried out for each physical model. These will be presented in Section 4.2.

4.1. Hydrodynamic Response: V1 Sub-Variants

To better understand the aforementioned modifications, the results of the hydrodynamic response, particularly concerning the roll DoF, are summarized in this sub-section of the paper. Despite the mooring setup and the orientation of the incoming waves, it was important to analyse the physical model’s motions for all six DoFs. Since it was found that the hydrodynamic response would show similar patterns for the three models, albeit some noteworthy magnitude differences concerning surge and, mainly, roll, the key outcomes for each DoF are presented in Figure 9 (associated with the HC model, V1 variant). The frequency-domain spectra were obtained through the application of a Fast Fourier Transformation of the time series for each DoF. It is clear that the predominant modes of oscillations are surge and roll. The latter denotes a bell-shaped curve with a restricted bandwidth of significant response mostly centred on a peak, which is corresponding to the natural roll frequency, ω n , 4 , of the physical model. However, another peak emerges for high Hs and Te values, coincident with the incoming wave frequency. As for surge, up to three peaks emerge: one at low frequencies, highlighting a slowly drifting motion of the physical model and the influence of the mooring system; another coinciding with the incoming wave frequency, similar to what was observed for roll; and a third one with a frequency matching ω n , 4 . The second and third peak hint towards a coupling between the surge and roll DoFs, given the correspondence in terms of peak frequencies.
Since the observed patterns are similar for all three physical models and the E-Motions’ operating principle is based on roll, the focus will now shift towards analysing and comparing the corresponding hydrodynamic response for the various test conditions and physical models, including their sub-variants.
For the V1 sub-variants, the incoming wave spectra are summarized in Figure 10a, where the incrementing peak and shift towards a lower frequency denote the evolution of the Hs-Te combinations. In order to better assess the hydrodynamic roll response, a transfer function was computed for each sub-variant, following on the explanation found in [54]. Since the spectral density associated with the incoming waves S f and roll S ζ are, respectively, m2.s and deg2/s, respectively, to obtain the hydrodynamic roll transfer function R A O 4 (vertical axis in deg/m) one must apply the square root, as shown in [54]:
R A O 4 ( ω ) = S ζ ( ω ) S f ( ω )
The roll transfer functions computed through the application of Equation (9), for the three physical models and regarding their respective V1 sub-variants, are presented in Figure 10b–d. These curves are truncated at a frequency that varies from 0.08 Hz to 0.04 Hz, depending on the spectral density range of the wave spectrum. This is required to avoid situations where a very small spectral response value is divided by a near-zero wave spectral density value, resulting in an unrealistic transfer function value.
The wave spectrum associated with each reproduced sea state is also shown, for comparison. It is perceivable that all V1 sub-variants exhibit a greater spectral roll response, in magnitude and with regard to the characteristics of each sea-state. This is essentially valid within the vicinity of their ω n , 4 , in accordance with preceding observations. Minor deviations on the peak’s position are observed with regard to the (unmoored) T n , 4 , attributed to the influence of the mooring system and the PTO. The HC V1 also shows a consistent spectral curve for all test conditions, while the HS V1 and TP V1 denote a relatively lower spectral response in comparison with the HC V1 (particularly for the TP variant), in terms of the order of magnitude. Furthermore, regarding the HS V1 and TP V1, a decreasing peak is observed when the H s and T e increase (or the associated frequency decreases). As such, the deviation away from the resonance range overlaps an expected roll response increment attributed to a greater value of H s . This also suggests a non-linear pattern for the hydrodynamic roll response.
It is worth noting that the HC’s transfer function values, especially those inherent to the curve peaks, reach up to 40 °/m, only matched in sea state 1 by HS V1. Supported by observations from the tests, where the physical model’s laterals (at deck level) would touch the water surface, it becomes pertinent to shift the focus towards the PTO component. Incrementing the hydrodynamic roll response could imply a shift in the model’s stability curve beyond the maximum righting arm [22,54], leading to potential capsizing. On the HS, the transfer function’s peak diminishes with increasing H s T e , suggesting a potential non-linear response, while on HC V1 the curves tended to overlap one another. Lastly, the TP V1 yielded a transfer function curve with similar response bandwidth, but values of a lower order of magnitude, in comparison to the HS and, mainly, HC counterparts for the majority of the test conditions. The decrease in peak from sea state 1 to 8 is also noticeable, analogous to what was observed in HS.

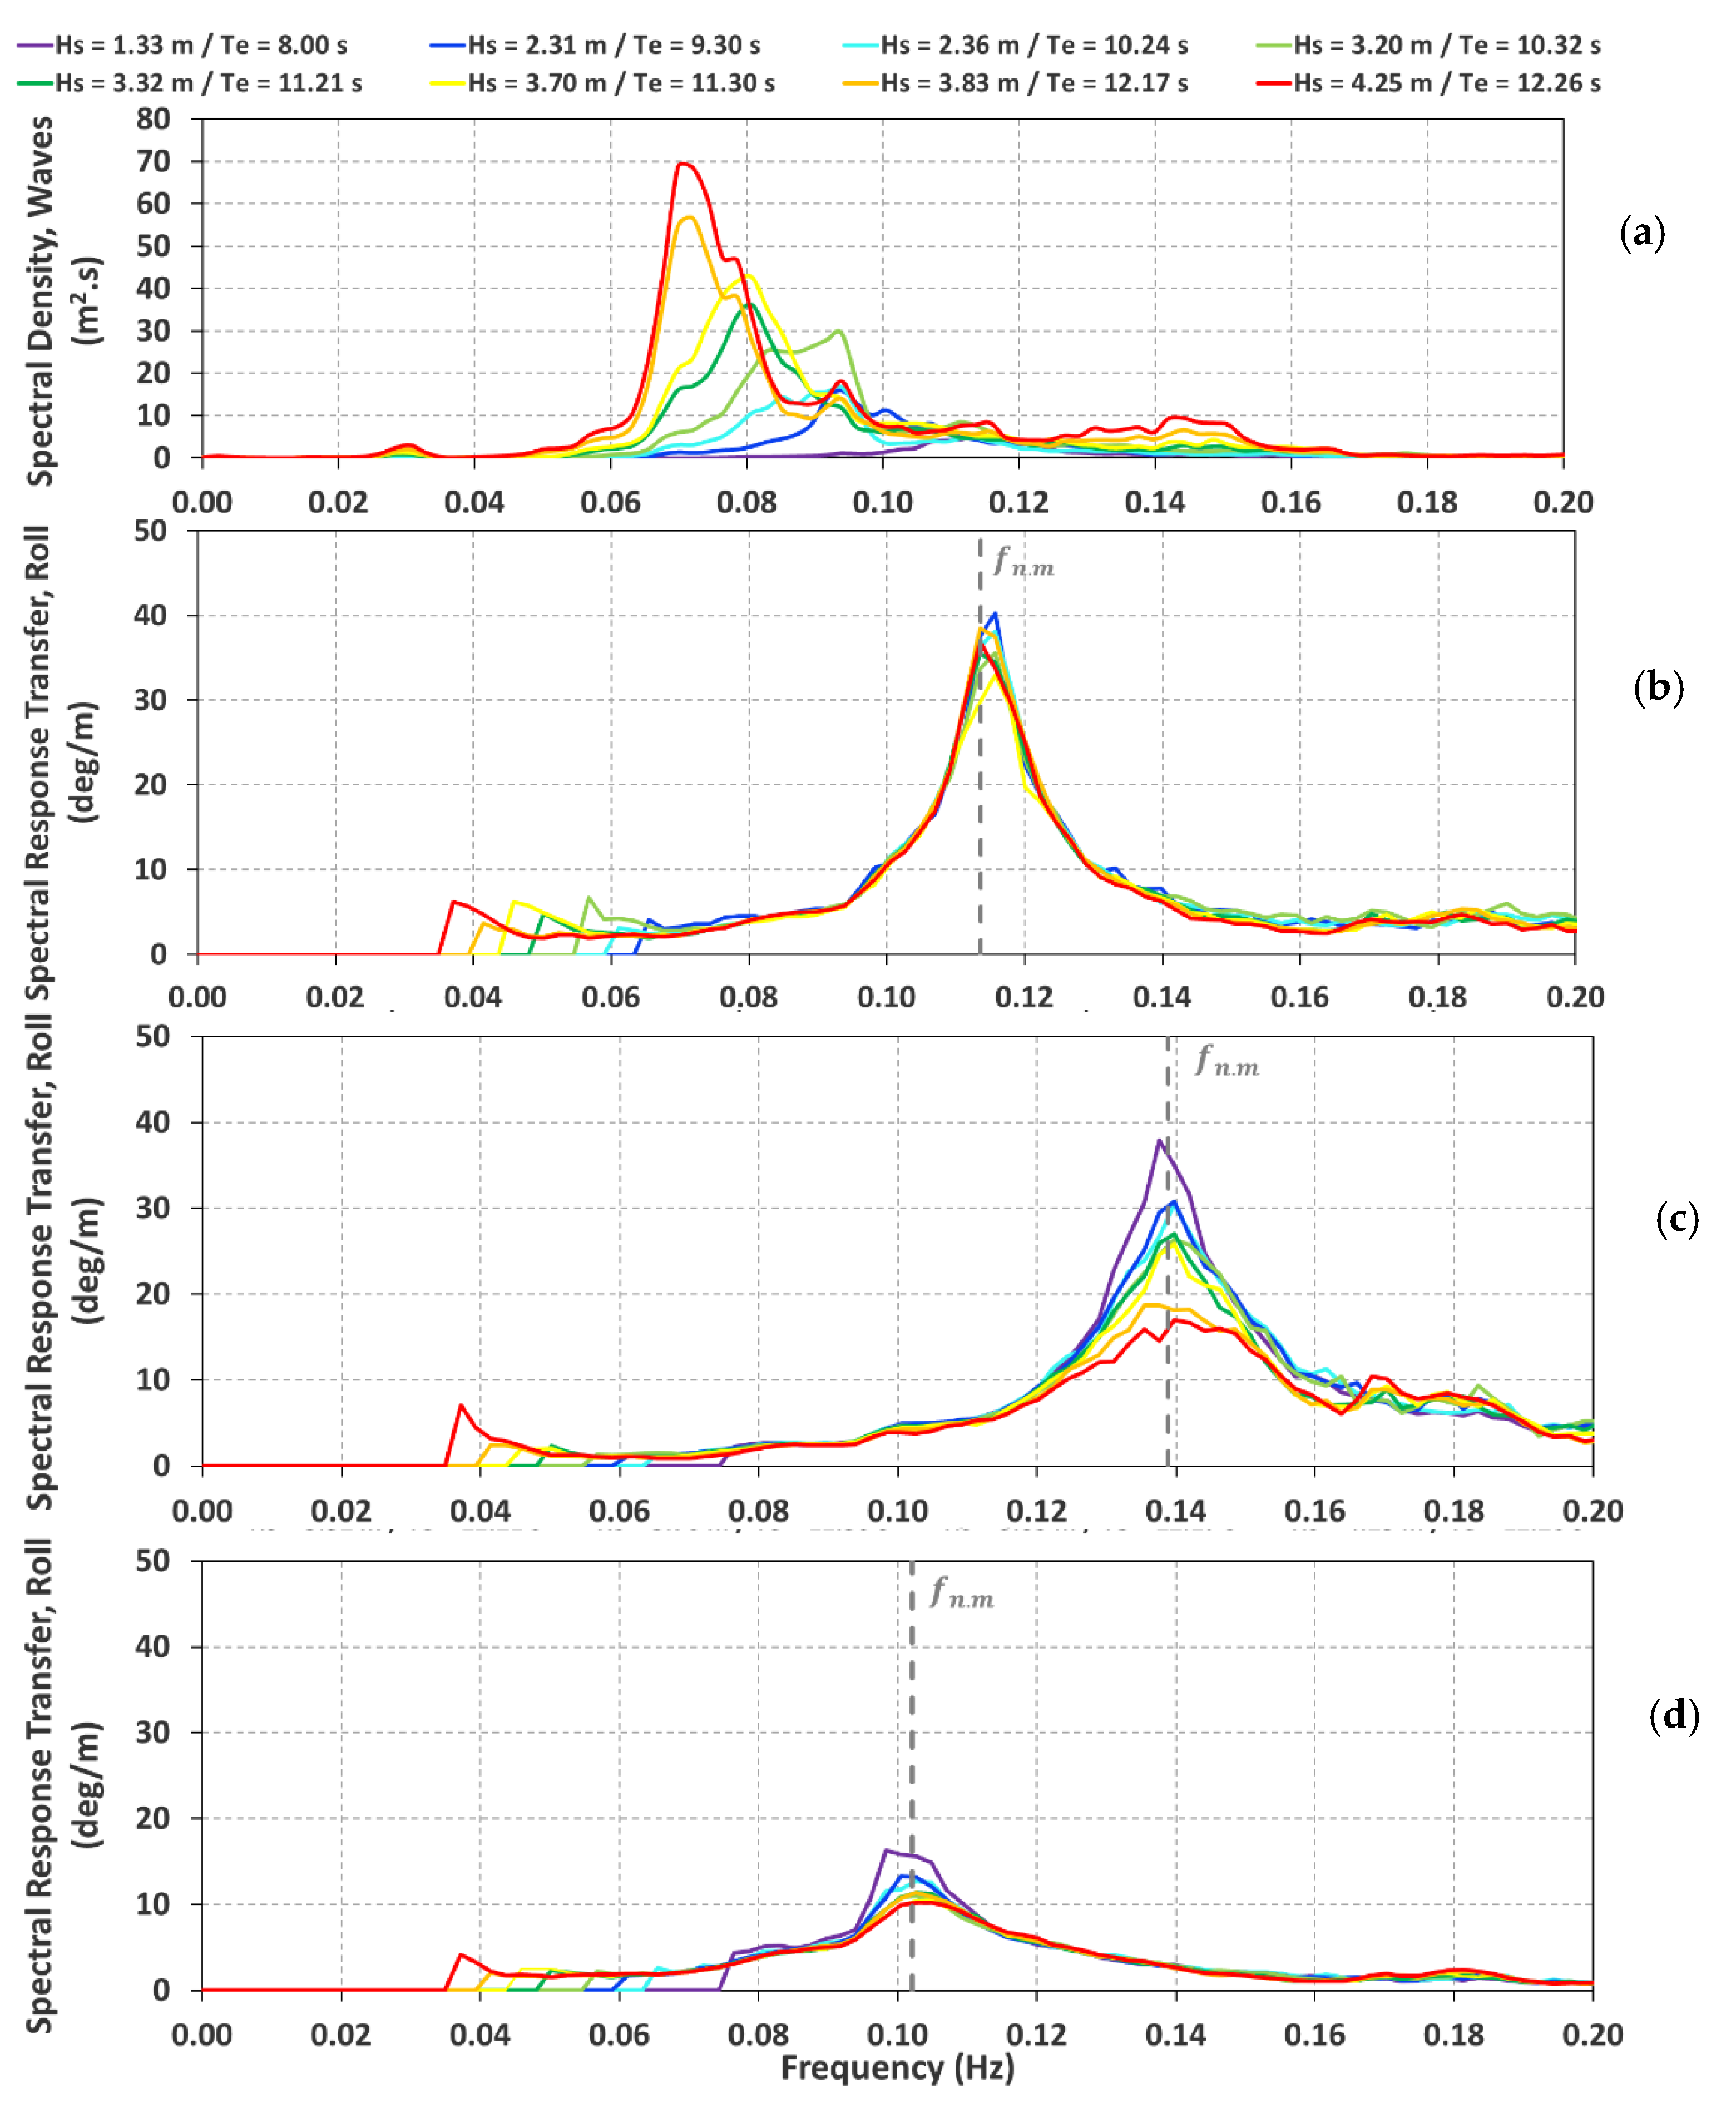
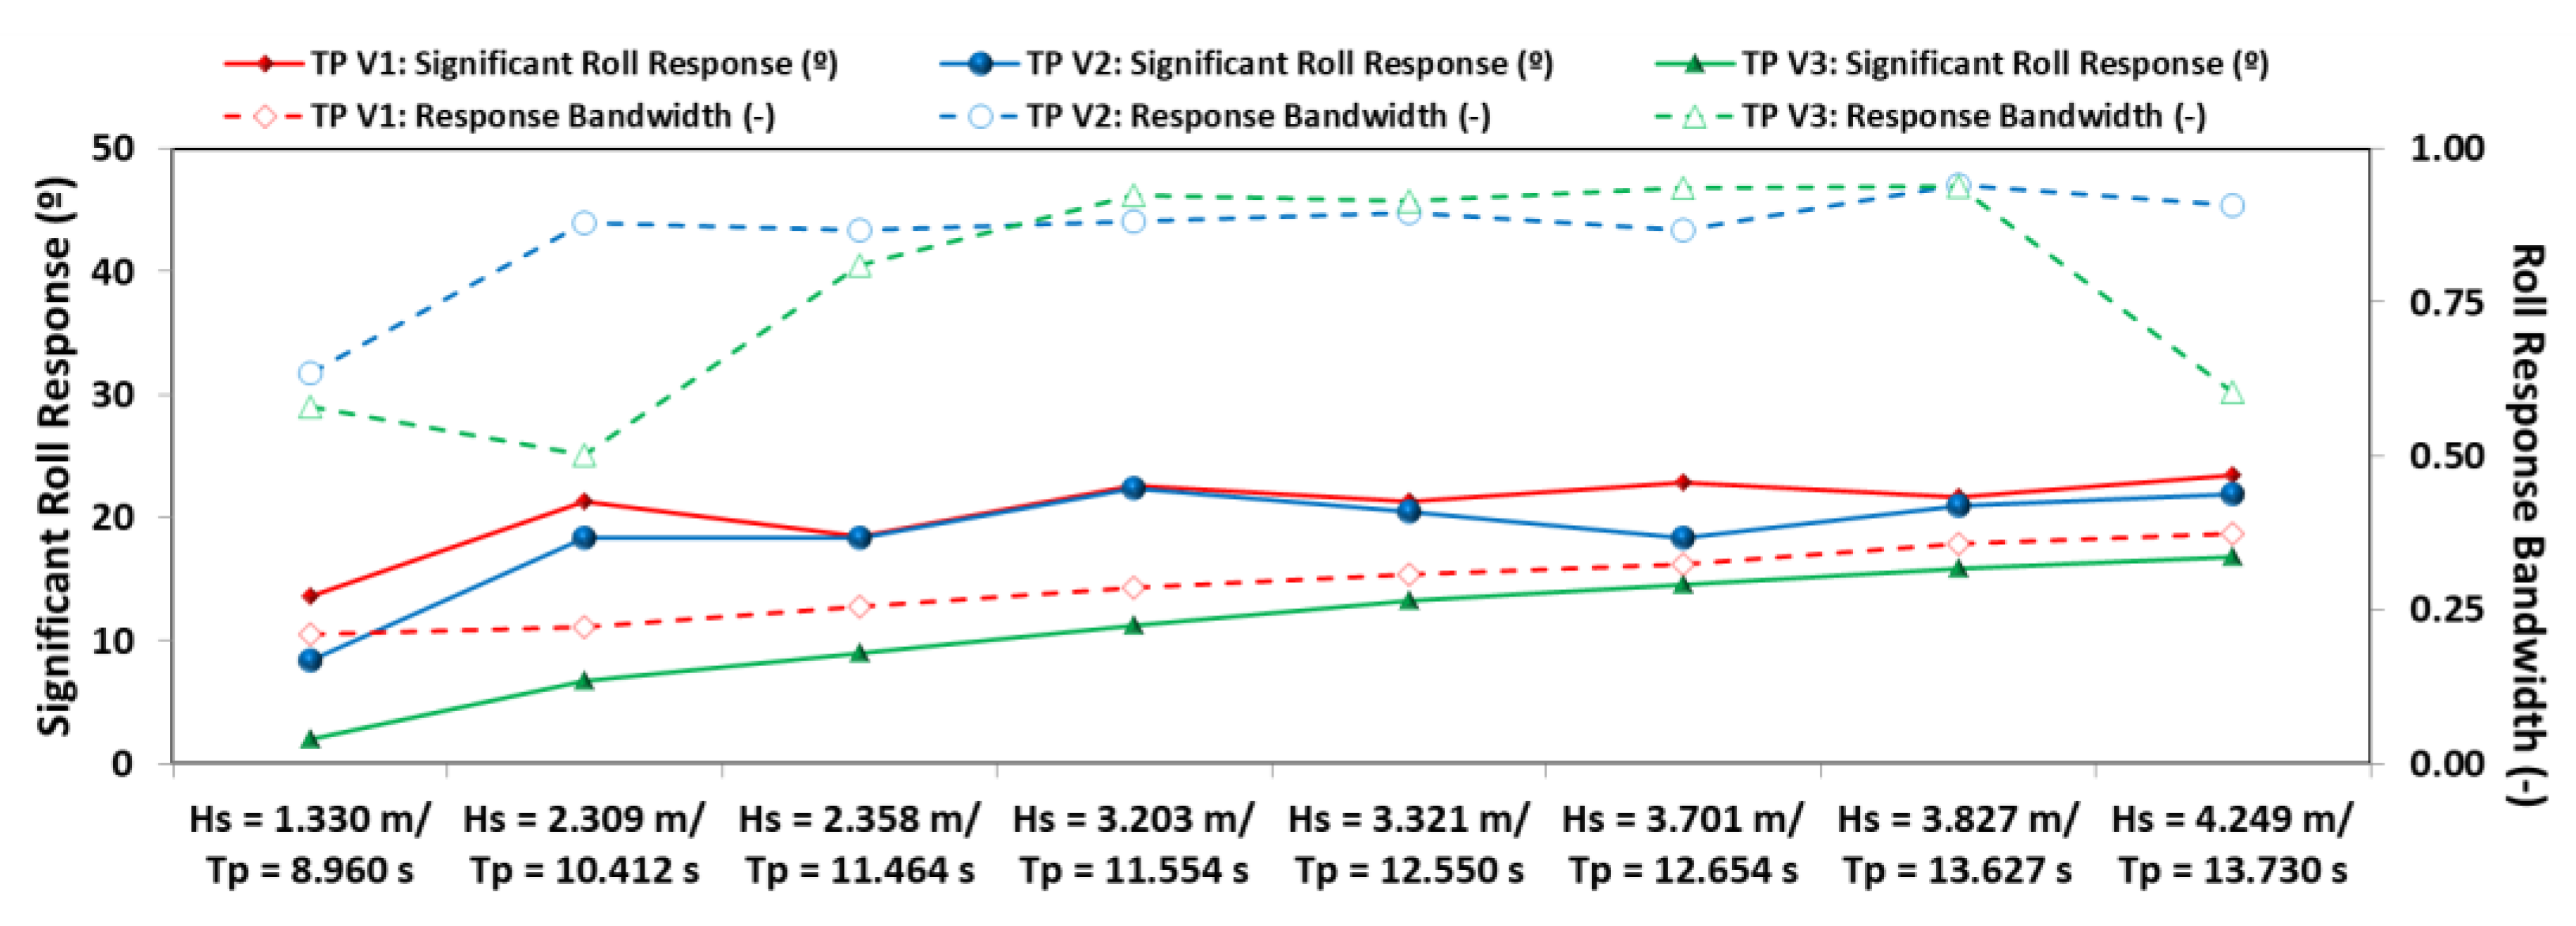
4.2. Hydrodynamic Response: All Sub-Variants

As an initial remark, since each physical model was subjected to specific adaptations in order to define the V2 and V3 sub-variants, the following results reflect a comparison between different variants of the same physical model. The key modifications are summarized in Table 4. The geometric properties of the HC remain essentially unaltered.
The analysis of the aforementioned adaptations involved a parametric comparison based on two parameters: the significant hydrodynamic roll response, ζ m 0 , 4 , defined analogously to H s from a wave spectrum, and the roll response bandwidth, ϵ 4 , as a function of the 0th, 2nd and 4th order moments of the hydrodynamic roll response spectrum ( m 0 , 4 , m 2 , 4 and m 4 , 4 , respectively) [22,54]:
m n = 0 ω n S f ( ω ) d ω ,     n = 0   for   the   zero order   moment ,
ζ m 0 , 4 = 4 m 0 , 4
ϵ 4 = 1 m 2 , 4 2 m 0 , 4 m 4 , 4
The resulting parameters are summarized in Figure 11, Figure 12 and Figure 13, from which it is perceivable that:
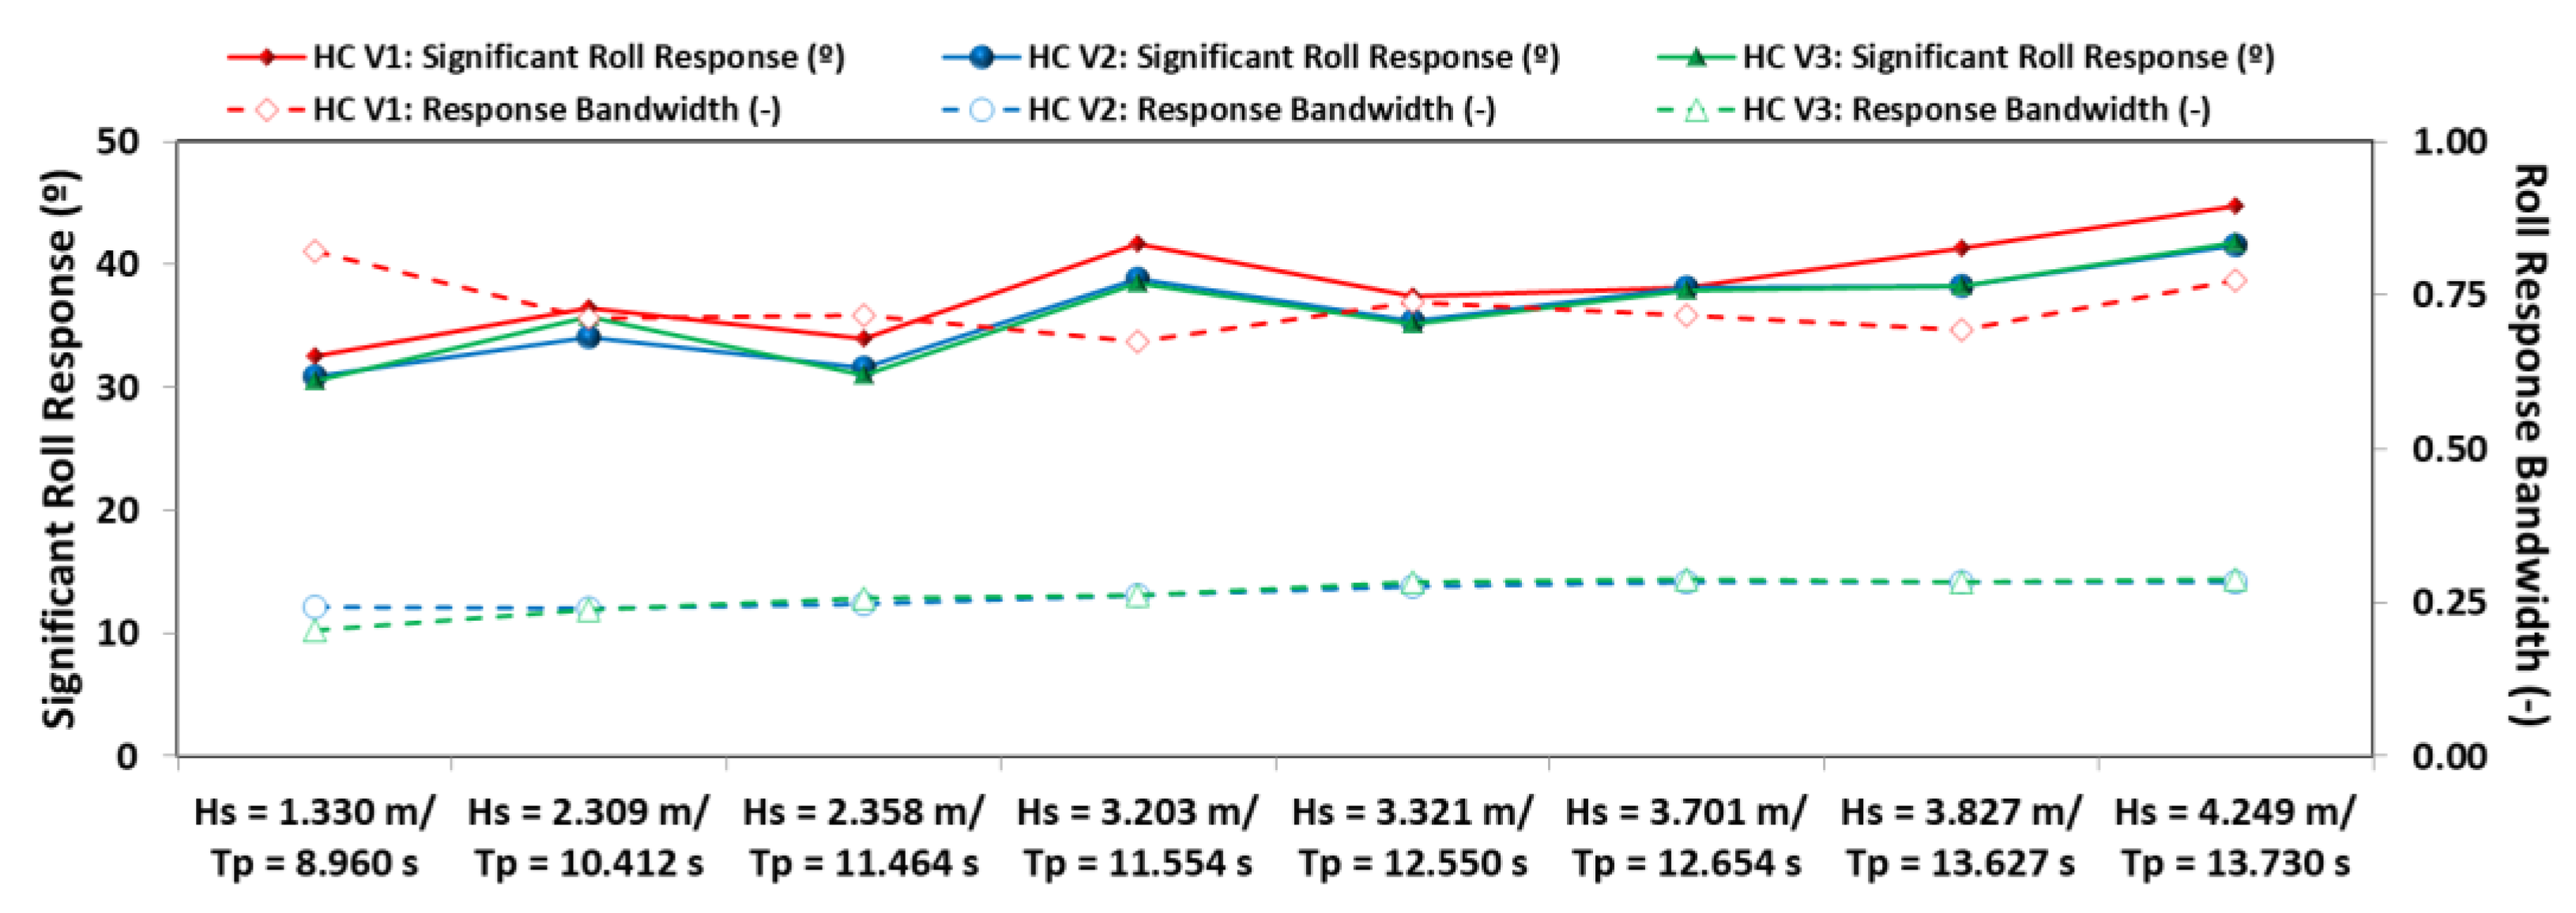
  • The HC sub-variants did not suffer significantly from the PTO changes but exhibited a considerable reduction of ϵ 4 from V1 to V2 and V3 (from broad, with ϵ 4 > 0.5 , to narrow, with ϵ 4 0.5 ). This derives from a slightly lower hydrodynamic roll response from V2 and V3, even away from the resonance range. Nevertheless, both parameters are essentially conserved, in terms of order of magnitude, over the various wave conditions, although a slight increase is perceivable for ζ m 0 , 4 with the increasing H s T e .
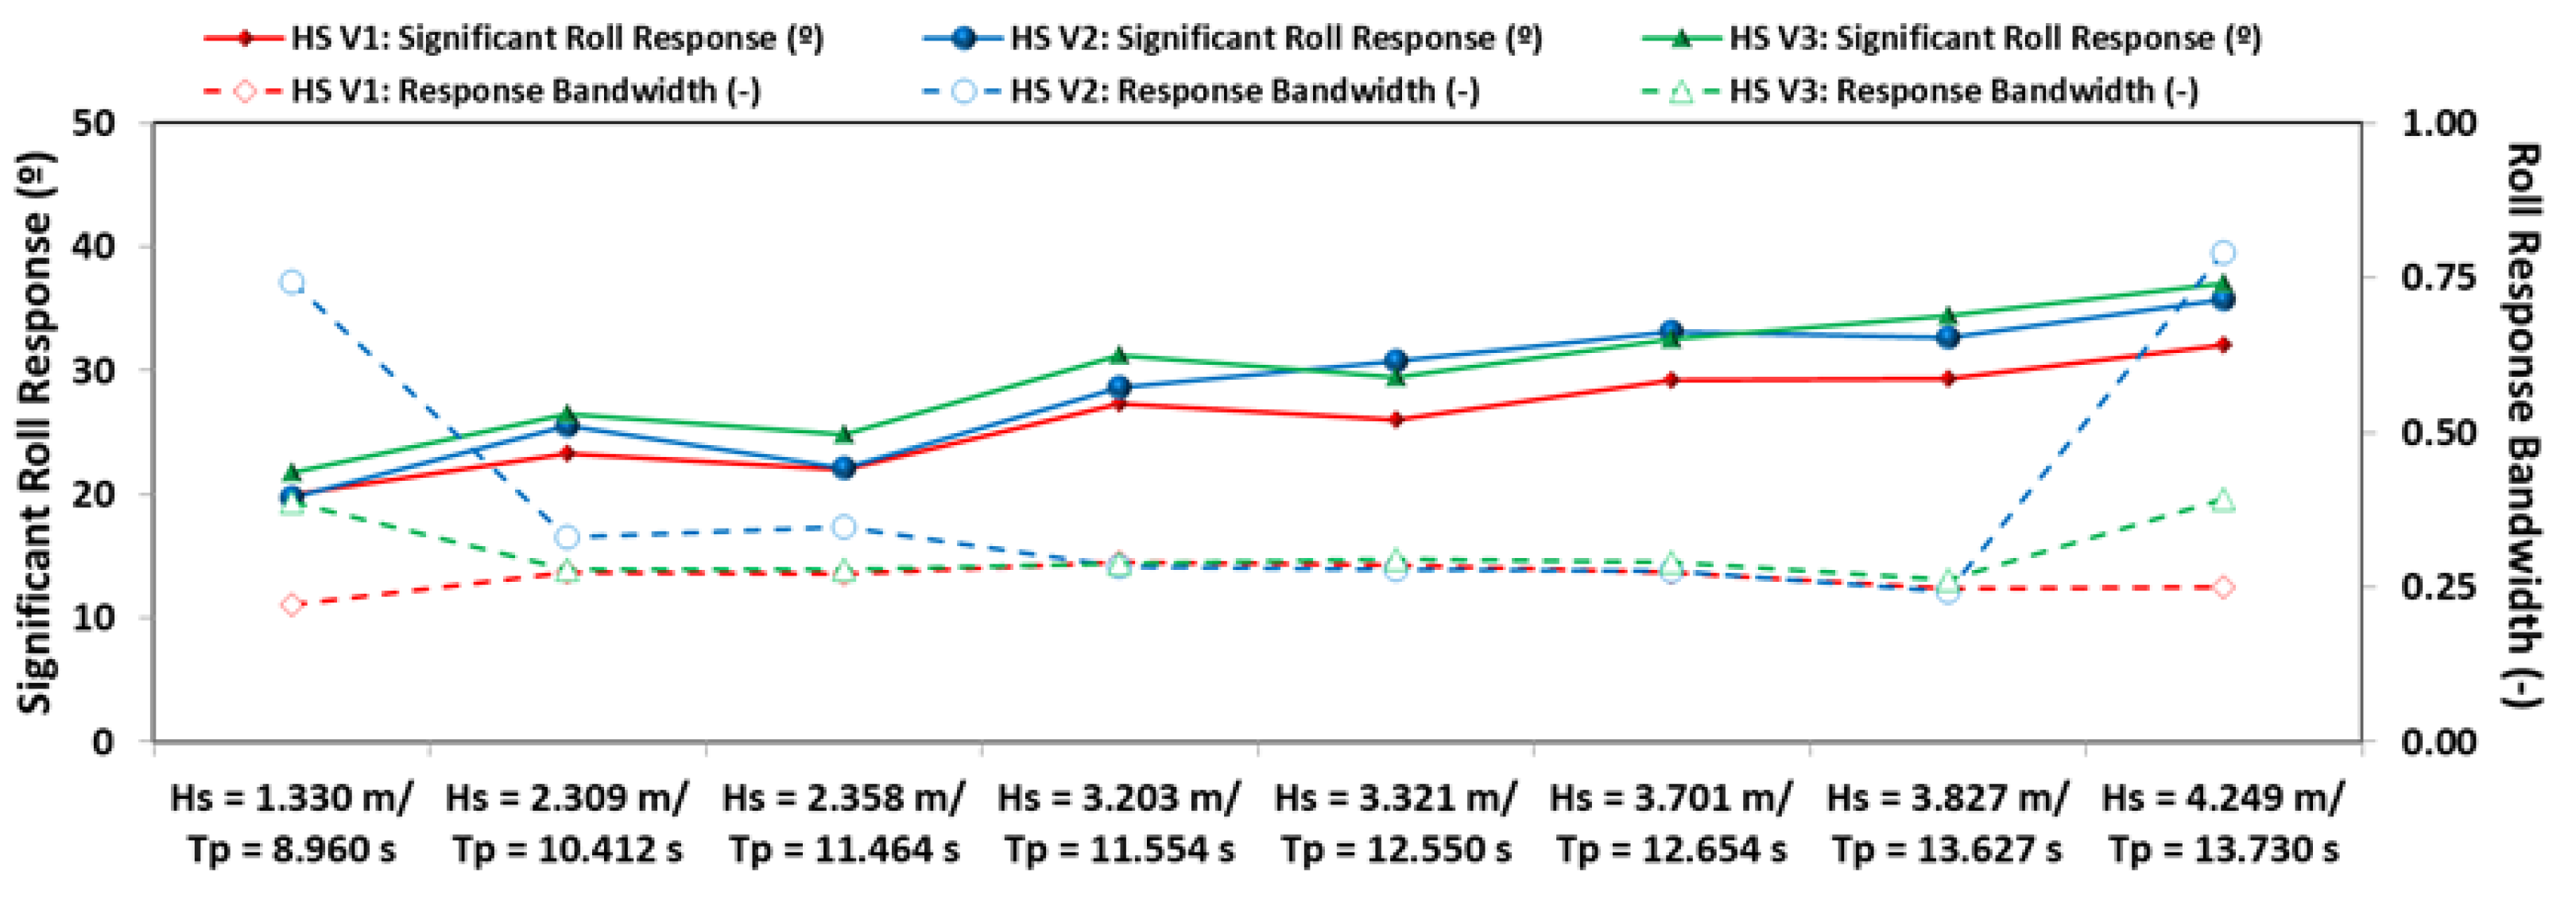
  • The HS sub-variants showed a slight improvement, in terms of order of magnitude, for ζ m 0 , 4 , with a similar trend to that of HC being obtained from sea state 1 to 8. The values remain smaller than those of HC. Regarding ϵ 4 , aside from a noticeable increment for these two bins for HS V2 and V3 towards a broad bandwidth, the values are very similar over the different sea states.
  • The TP sub-variants exhibited a similar (V2) to relatively weaker (V3) roll performance, in terms of significant roll response. These remain, in fact, the lowest out of all three E-Motions variants/physical models. In contrast, the response bandwidth went from narrow to broad, which suggests a flatter hydrodynamic response curve. Furthermore, bins 1, 2 and 8 exhibit the lowest ϵ 4 values, in contrast to the observations from HS.
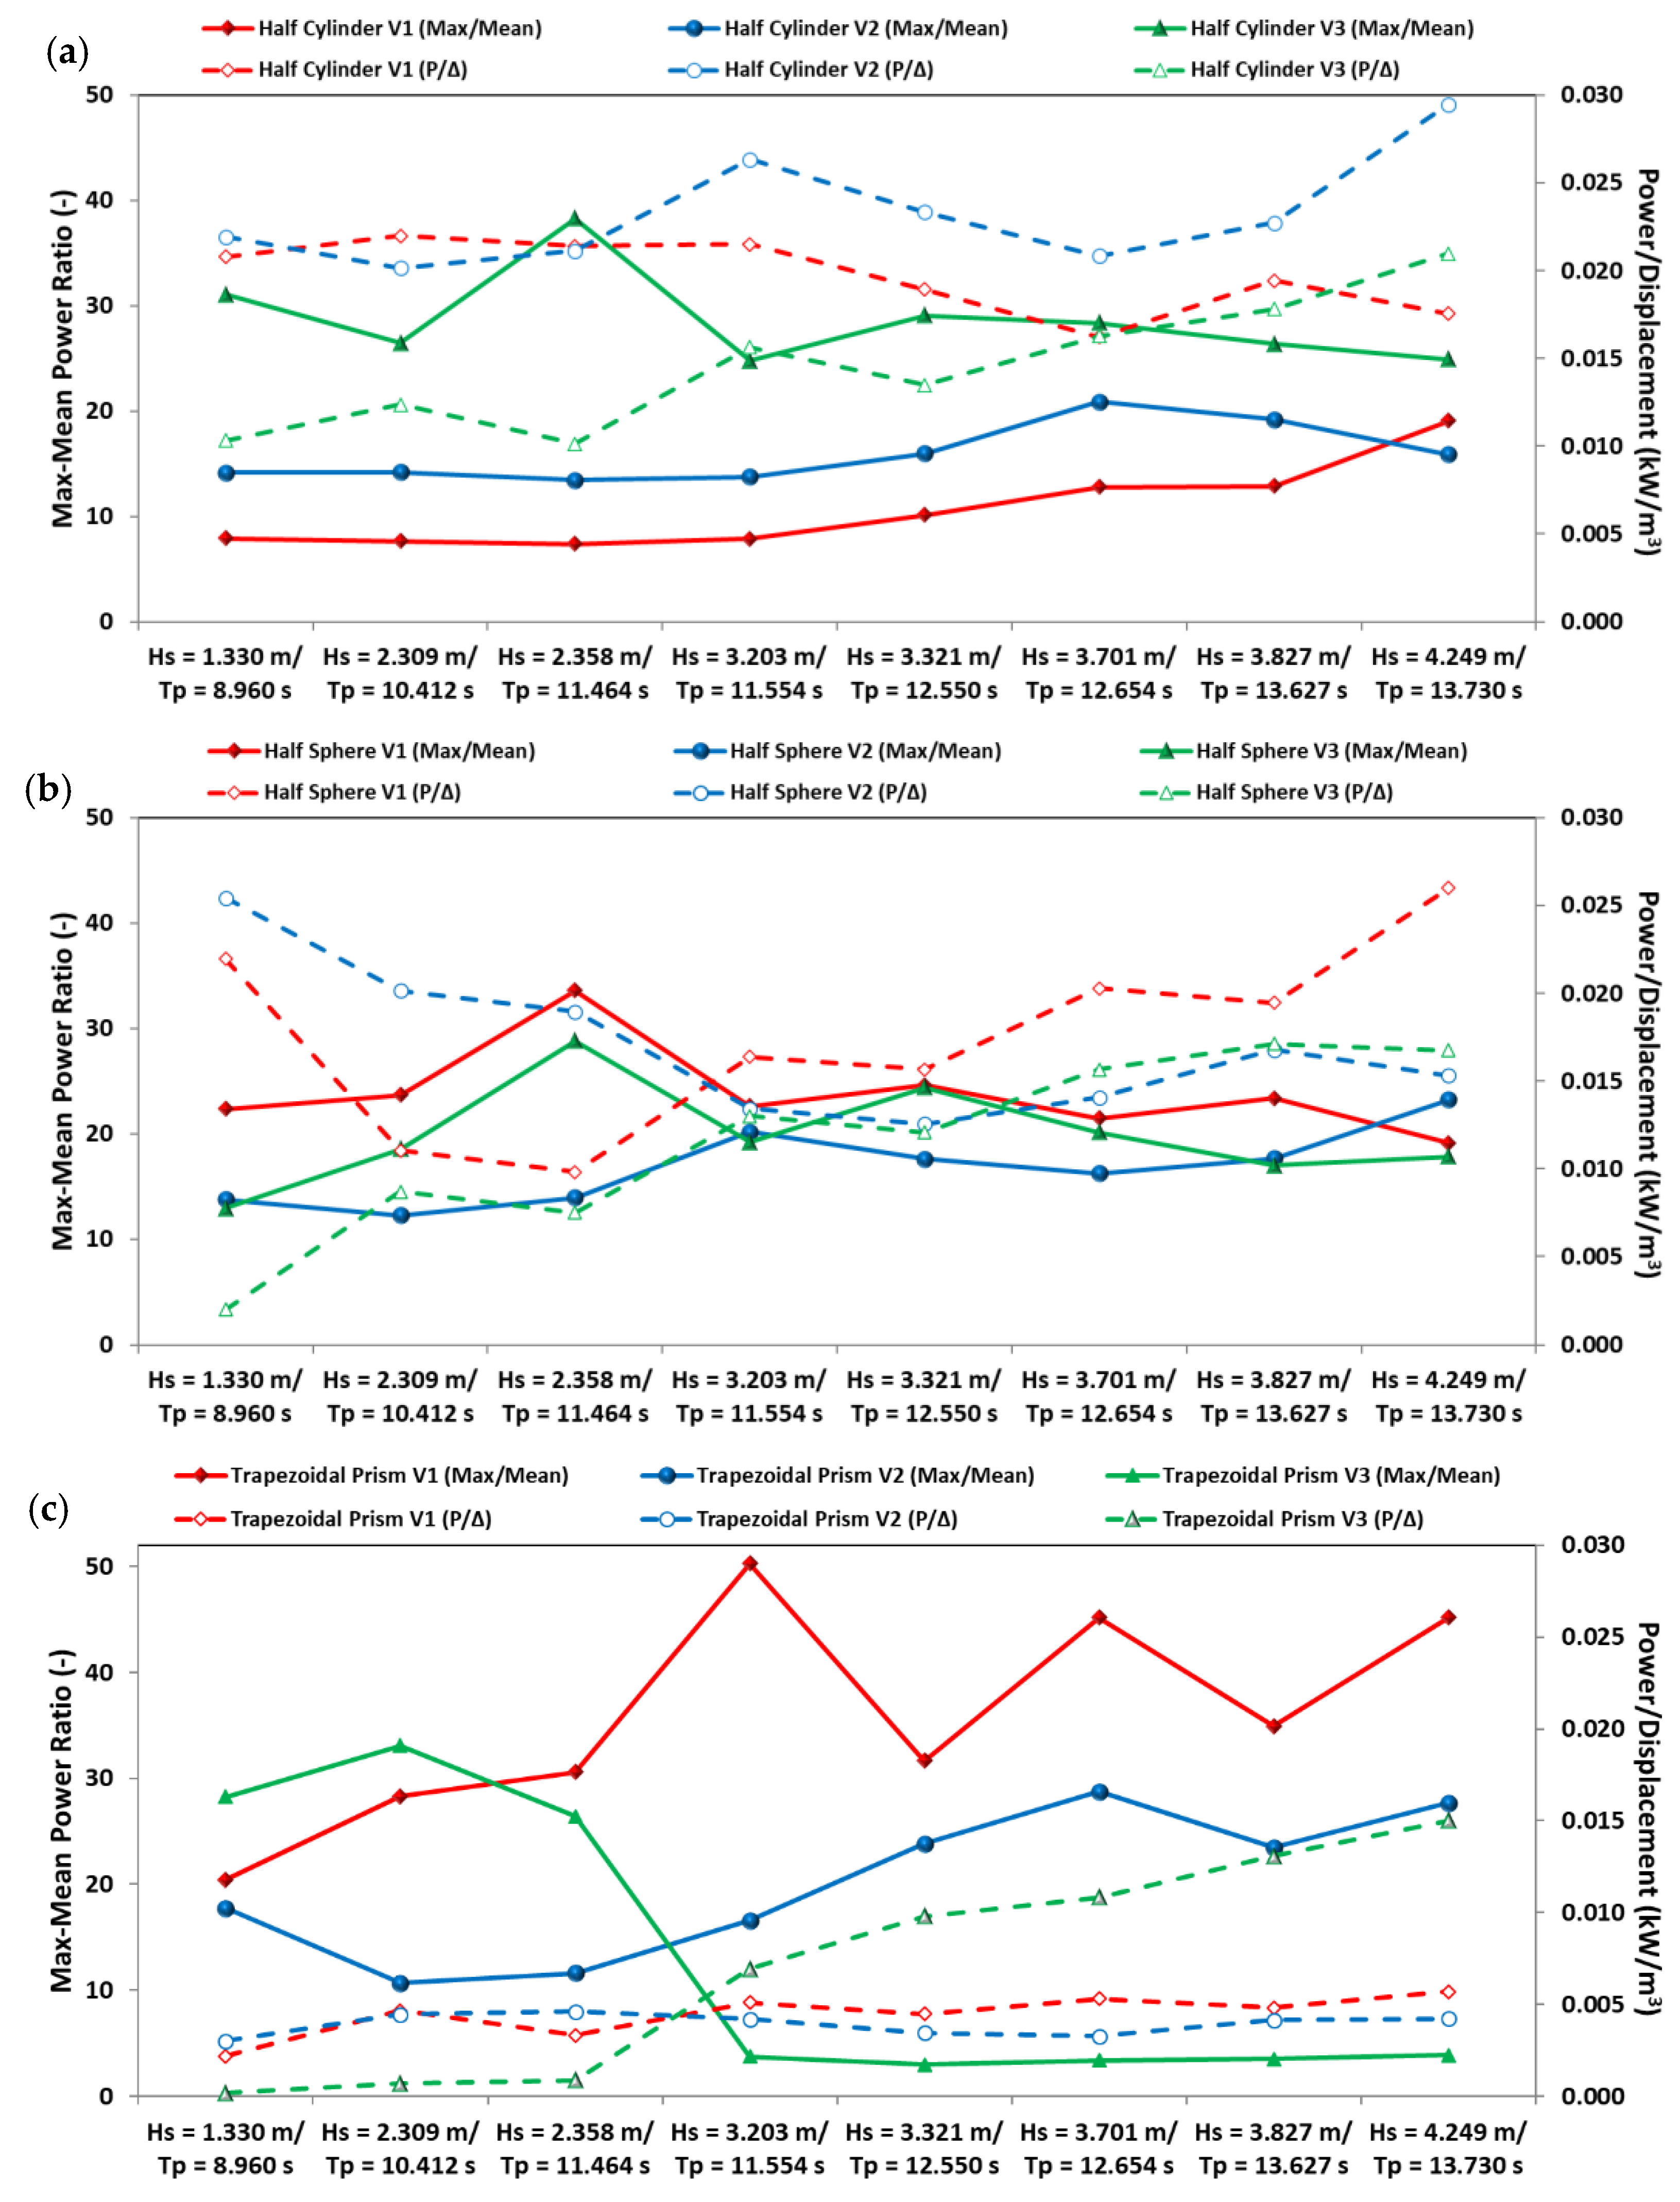
4.3. Power Output

Starting with the E-Motions and its PTO, two sets of power ratios were computed: one between the maximum and the average power output, and another between the average power values per cubic metre of displaced volume, Δ. These are presented in Figure 14, for all sub-variants of the three E-Motions variants. These values were obtained indirectly by estimating the PTO force and power outputs, from Equations (4) and (6). From the results, it is noticeable that:
  • For the HC, V1 and V2 exhibit the lowest power variability regarding the maximum and average power outputs, while V3 yields values that exceed the recommendations from literature [22]. Although V1 has the lowest max-mean ratios, the highest power/displacement values can be found for the V2 curve, mainly from sea state 4 onwards.
  • For the HS, overall, the lowest max-mean ratios can be found for the V2 variant. Regarding the power/displacement values, the V2 curves denote a reduction trend (from an initial maximum) as Hs-Tp increases, with the opposite trend being, overall, verified for the V1 and V3 variants.
  • For the TP, V1 and V2 yield relatively consistent power/displacement values across the considered range of wave conditions, while V3 denotes an increasing trend for higher Hs-Tp values, closer to the resonance range. The max-mean ratios should be interpreted with caution, as the order of magnitude of both the maximum and average power is lower than that of the HC and HS variants.
Following on the E-Motions’ power output results, the unidirectional lateral TENG was implemented inside the HC (which resulted in the largest output power from complementary tests under regular waves [71]) for the V1 variant. The open-circuit voltage was acquired using a Bluetooth datalogger that transmitted data in real time to a nearby personal computer. This implementation prevented extra cables from being connected to the HC, which could affect its hydrodynamic response. The open-circuit voltage (VOC) under the eight sea states (bins) considered in the experimental study, with irregular waves, is presented in Figure 15a. An average open-circuit voltage (<VOC>) and power density of ~ 85 V and 182 mW/m2, respectively, was achieved for sea state 1, which corresponds to a wave period closer to the platform’s T n , 4 (2.040 s in model values, or approximately 9.123 s in prototype values). A significant decrease of VOC is observed when the wave period deviates from the resonant period. However, an increase in the electrical outputs was obtained with increasing wave height and wave period, as shown in Figure 15. This trend may be related to the increase in the wave excitation and the inherent transported energy, as a consequence of the relation from Equation (9). On the other hand, the surge DoF increases with increasing height and period of waves, which can also lead to an increase in the generated electrical outputs. Thus, the larger wave excitation and surge excursions cause the spheres to increase their motion span, acquiring larger momentum and colliding with a greater impact force on each tribo-device fixed on the lateral ends of the PLA trough. Considering the final sea states of the experimental study, a maximum specific power of ~18 mW/kg was achieved in sea state 1.

5. Discussion

As expected from the experimental setup and wave conditions, the hydrodynamic response of the physical models was mostly in the surge and roll DoFs. On the former, the order of magnitude generally increases with H s T e (and, consequently, wavelength), suggesting that the models follow the incoming waves. However, this was not the case for the roll DoF, as the physical model tends to oscillate at a frequency corresponding to ω n , 4 . It is worth stating that the hydrodynamic responses of the HC, HS and TP V1 sub-variants were quite similar to those obtained in [26], albeit some differences were found (mainly attributed to uncertainty in computing the hydrodynamic parameters). Resonance was observed near the unmoored natural roll period, which supports a good agreement between the estimated and obtained/measured values. Other parameters also yielded a good agreement with the expected values (differences below 5%), as demonstrated in [71] under dry conditions (inclining and free decay tests) and regular wave conditions.
The HC V1 shows a relatively consistent profile over the selected range of wave conditions, which can be justified by the conservation of its submerged profile even for very large roll amplitudes. The opposite is verified for TP V1, since the TP’s submerged profile changes with the roll angle. This implies a time-varying and incrementing stiffness for higher roll angles, as expected from similar hull shapes [22,54]. Unexpectedly, the shape evolution of the HS’ transfer function curves, from sea-state 1 to 8, was similar to that of the TP, despite the somewhat constant submerged profile for large roll amplitudes. Even so, one must account for the mooring system: although the chain setup was similar for all three physical models, the proportionally lower mass and stiffness of the HS would make it more susceptible to the mooring system’s influence, namely in terms of the moored T n , 4 (relatively lower than that of the HC and TP). All physical models exhibit the expected behaviour of a resonant-type floating body, which, regarding the roll DoF, is sufficiently large to oscillate at a frequency corresponding to the natural (roll) frequency, instead of moving with the incoming waves [22].
The modifications of the V2 and V3 sub-variants produced different outcomes on each physical model:
  • On the HC, a stepwise increment is observed for the significant response curves. Despite the increase in PTO mass and damping from V1 to V3, there is little alteration in the order of magnitude of ζ m 0 , 4 . This adaptation also implies that the maximum convertible energy increases. However, this can also lead to “stall” occurrences, as described previously. This was observed rarely in V1 and V2, but for V3 the PTO would often slide along a more limited extension of the superstructure (1/2 to 2/3). The combination of these two factors explains the similar hydrodynamic roll response, but higher/lower max-mean ratio/power per unit of displaced volume, respectively. The PTO’s influence was also perceivable in the response bandwidth curves, which yielded lower values from V1 to V3. Overall, the intermediate option (V2) yielded the most beneficial results.
  • For the HS, the new ballast setup leads not only to a change in the T n , 4 and metacentric height, but in the hydrostatic stiffness and total weight of each sub-variant. An inflection point is observed at about halfway in the test lineup, where the higher power per unit of displaced volume from V2 is surpassed by V3 and, mainly, V1. After this inflection point, the max-mean curves are also similar. The variable that follows a similar pattern is the hydrostatic stiffness, which is maximum for V2 and minimum for V1 (16.389 N/m.rad and 13.068 N/m.rad, respectively, and not contemplating the contribution of the mooring system). This is also in agreement with the peaks observed for the ϵ 4 curves, albeit a slight improvement, in terms of significant roll response, is observed for both V2 and V3.
  • Lastly, regarding the TP, the modifications introduced into V2 did not seem to improve the performance of this sub-variant compared to V1, with the exception of lower max-mean ratios. The relatively high T n , 4 of V3 lead to a comparably lower average power output for lower wave energy periods and a high max-mean ratio, consequently. In contrast, the performance improves considerably from sea state 4 onwards, with a beneficial effect of a lower metacentric height and higher T n , 4 being observed.
The TENGs did not significantly affect the hydrodynamics of the E-Motions physical model (HC) but yielded promising power output ratios. In detail, an open-circuit voltage and power density peak was observed for sea state 1, where the peak wave period coincides with T n , 4 of the physical model. The deviation from the resonance range has an immediate effect, as the measured TENG outputs reduce significantly from sea state 1 to 3. Afterwards, the increasing Tp and, consequently, deviation from roll resonance seems to be compensated by the increasing Hs and surge excursions, since the wavelength increases with the wave period (intermediate water depth). In fact, after sea state 3, this conjugation leads to a systematic increase of the voltage and power output, which tends to stabilize for the last sea states. The values for sea states 7 and 8 are only slightly below those of sea state 1, suggesting that the available stroke for the spheres is probably the main restrictor of greater voltage and power outputs. This is a pertinent observation that ought to be confirmed in future studies, namely through the introduction of cameras with a direct line of sight towards the TENG structures.
From this study, the hybridization approach demonstrated:
  • Compartmentation—sliding PTO within the superstructure, at deck level, while TENGs were protected within the hull;
  • TENGs have a negligible effect on platform hydrodynamics;
  • Energy redundancy and dual operation—E-Motions’ PTO (single-mode restricted by end stops and “stalling”, but with higher power output range) and lateral TENGs (lower power output range, but multi-mode and based on end-stop impacts);
  • Power density—in model scale, the TENG’s output can reach, at minimum, 4.36%, 12.07% and 8.69% of HC’s, HS’ and TP’s power density values, respectively. This is valid by assuming a reference area equal to the deck of each physical model, for the PTO’s power density calculation.
  • Potential output gains in future studies—stacking multiple PTO rows and/or expanding the TENGs’ surface area, over several compartment levels, whilst including horizontal sliding tracks (vertical contact-separation alongside lateral end-stops).

6. Conclusions

In summary, this paper presented the key outcomes of a joint study involving nine variants, with three original hull shapes (HC, HS and TP) of the E-Motions device with unidirectional TENG structures. Eight reference sea states from the Portuguese coastline were reproduced for the considered variants, being the TENGs incorporated into HC V1 sub-variant for the combined assessment. The hydrodynamic analysis was centred on the hydrodynamic roll response and respective frequency bandwidth, albeit some considerations on other DoFs, namely surge, were discussed. Open-voltage and power output ratios were estimated/measured for the E-Motions and TENGs, with noteworthy patterns emerging over the different sea-state bins.
Overall, all variants exhibited a generally increasing surge response from sea-states 1 to 8, following on the greater wave excitation and wavelength. Up to three peaks were reported, although the one with the highest value was observed for very low frequencies, corresponding to slow drifting. On the roll DoF, a bell-shaped pattern was obtained for all variants, with the corresponding peaks’ position centred on the respective T n , 4 . The order of magnitude of the HC peak tended to be conserved for all sea states but decreased for the HS and TP variants from sea state 1 to 8. This suggests a non-linear response to the incoming waves, which should be taken into account in follow-up studies. The significant roll response tended to follow a stepwise increment pattern with the increasing Hs-Te across all E-Motions sub-variants, but different outcomes were observed about the response bandwidth. ϵ 4 was reduced from HC V1 to HC V3, as a consequence of the PTO’s greater mass and damping. Apart from sea states 1 and 8, where V2 and V3 stood out, the HS variants exhibited similar outcomes, while TP exhibited a significant response bandwidth increment with the ballast rearrangements of V2 and V3.
On the power output ratios, HC V2 stood out from the alternatives, yielding ratios of up to 0.030 kW/m3 and max-mean ratios of 15 to 20. Depending on the sea states, V1 and V2 provided the highest power ratios (up to 0.026 kW/m3), but V2 demonstrated a lower max-mean range of similar magnitude as that of HC V2. As for the TP sub-variants, V3 showed an improved performance, but only after sea state 3, likely due to the shift of T n , 4 towards higher values. In turn, the TENGs demonstrated an open-circuit voltage and power density evolution highly influenced by both surge motions, roll oscillations and increasing wave excitation/energy from sea state 1 to 8. Corresponding peaks of average VOC and power density of ~ 85 V and 182 mW/m2 were obtained. In fact, by considering model values, the power density can be comparable to that of E-Motions’ PTO, with bottom thresholds of 4.36%, 12.07% and 8.69% of E-Motions’ PTO power density values (HC, HS and TP sub-variants, correspondingly).
The outcomes of this study demonstrated the viability of a hybrid E-Motions/TENGs solution towards wave energy conversion, which can benefit from equipment sharing, redundancy, compartmentation, dual energy production and protection of sensitive equipment from the surrounding marine environment. TENG output can be further bolstered by increasing the deployed surface area inside the platform’s hull, as only a small portion was employed in this study, while stacking numerous PTO rows can multiply the power generated by E-Motions. Future developments will strive to optimize these components so that the final device solution can be deployed, at sea, towards supplying energy to numerous marine activities in a sustainable manner.

Author Contributions

D.C. and C.R.: Conceptualization; Data curation; Formal analysis; Investigation; Methodology; Software; Validation; Visualization; Roles/Writing—original draft; Writing—review and editing R.E. and J.C. Data curation; Investigation; Software; Validation A.M.P., J.O.V., P.R.-S. and F.T.-P.: Conceptualization; Data curation; Funding acquisition; Methodology; Project administration; Resources; Supervision; Validation; Writing—review and editing; P.M.: Conceptualization. All authors have read and agreed to the published version of the manuscript.

Funding

The authors acknowledge funding in the form of a Ph.D. scholarship grant by the FCT, co-financed by the EU’s ESF through the NORTE 2020 program, with reference 2020.05280.BD. C. Rodrigues is thankful to FCT for grant SFRH/BD/147811/2019. The authors also acknowledge support from the International Consortium of Nanotechnologies (ICON) funded by Lloyd’s Register Foundation, a charitable foundation which helps to protect life and property by supporting engineering-related education, public engagement and the application of research.

Institutional Review Board Statement

Not applicable.

Informed Consent Statement

Not applicable.

Data Availability Statement

Not applicable.

Conflicts of Interest

The authors declare no conflict of interest.

References

  1. Prăvălie, R.; Patriche, C.; Bandoc, G. Spatial assessment of solar energy potential at global scale. A geographical approach. J. Clean. Prod. 2019, 209, 692–721. [Google Scholar] [CrossRef]
  2. Kabir, E.; Kumar, P.; Kumar, S.; Adelodun, A.A.; Kim, K.-H. Solar energy: Potential and future prospects. Renew. Sustain. Energy Rev. 2018, 82, 894–900. [Google Scholar] [CrossRef]
  3. Poggi, F.; Firmino, A.; Amado, M. Planning renewable energy in rural areas: Impacts on occupation and land use. Energy 2018, 155, 630–640. [Google Scholar] [CrossRef]
  4. van de Ven, D.-J.; Capellan-Peréz, I.; Arto, I.; Cazcarro, I.; de Castro, C.; Patel, P.; Gonzalez-Eguino, M. The potential land requirements and related land use change emissions of solar energy. Sci. Rep. 2021, 11, 2907. [Google Scholar] [CrossRef]
  5. European Comission. A Hydrogen Strategy for a Climate-Neutral Europe; European Comission: Brussels, Belgium, 2020. [Google Scholar]
  6. Kakoulaki, G.; Kougias, I.; Taylor, N.; Dolci, F.; Moya, J.; Jäger-Waldau, A. Green hydrogen in Europe—A regional assessment: Substituting existing production with electrolysis powered by renewables. Energy Convers. Manag. 2021, 228, 113649. [Google Scholar] [CrossRef]
  7. Falnes, J. A review of wave-energy extraction. Mar. Struct. 2007, 20, 185–201. [Google Scholar] [CrossRef]
  8. de O.Falcão, A.F. Wave energy utilization: A review of the technologies. Renew. Sustain. Energy Rev. 2010, 14, 899–918. [Google Scholar] [CrossRef]
  9. Guillou, N.; Lavidas, G.; Chapalain, G. Wave Energy Resource Assessment for Exploitation—A Review. J. Mar. Sci. Eng. 2020, 8, 705. [Google Scholar] [CrossRef]
  10. IEA. World Energy Outlook 2020; IEA: Paris, France, 2020; ISBN 978-92-64-44923-7. [Google Scholar]
  11. Leijon, J.; Boström, C. Freshwater production from the motion of ocean waves—A review. Desalination 2018, 435, 161–171. [Google Scholar] [CrossRef]
  12. Abdelkareem, M.A.; El Haj Assad, M.; Sayed, E.T.; Soudan, B. Recent progress in the use of renewable energy sources to power water desalination plants. Desalination 2018, 435, 97–113. [Google Scholar] [CrossRef]
  13. OES. Ocean Energy in Islands and Remote Coastal Areas: Opportunities and Challenges; University of Edinburgh, IEA: Edinburgh, UK, 2020; p. 32. [Google Scholar]
  14. Oliveira-Pinto, S.; Rosa-Santos, P.; Taveira-Pinto, F. Electricity supply to offshore oil and gas platforms from renewable ocean wave energy: Overview and case study analysis. Energy Convers. Manag. 2019, 186, 556–569. [Google Scholar] [CrossRef]
  15. Chai, H.; Guan, W.; Wan, X.; Li, X.; Zhao, Q.; Liu, S. A Wave Power Device with Pendulum Based on Ocean Monitoring Buoy. IOP Conf. Ser. Earth Environ. Sci. 2018, 108, 8. [Google Scholar] [CrossRef]
  16. Guerriero, P.; Attanasio, C.; Matacena, I.; Daliento, S. Merged Photovoltaic/Wave System for the Power Supply of a Marine Buoy for Harbour Monitoring. In Proceedings of the 2019 International Conference on Clean Electrical Power (ICCEP), Otranto, Italy, 2–4 July 2019; pp. 664–668. [Google Scholar] [CrossRef]
  17. Abanades, J.; Flor-Blanco, G.; Flor, G.; Iglesias, G. Dual wave farms for energy production and coastal protection. Ocean Coast. Manag. 2018, 160, 18–29. [Google Scholar] [CrossRef] [Green Version]
  18. Bergillos, R.J.; Rodriguez-Delgado, C.; Iglesias, G. Wave farm impacts on coastal flooding under sea-level rise: A case study in southern Spain. Sci. Total Environ. 2019, 653, 1522–1531. [Google Scholar] [CrossRef] [PubMed]
  19. Kao, C.-C.; Lin, Y.-S.; Wu, G.-D.; Huang, C.-J. A Comprehensive Study on the Internet of Underwater Things: Applications, Challenges, and Channel Models. Sensors 2017, 17, 1477. [Google Scholar] [CrossRef] [PubMed] [Green Version]
  20. Temeev, A.A.; Belokopytov, V.P.; Temeev, S.A. An integrated system of the floating wave energy converter and electrolytic hydrogen producer. Renew. Energy 2006, 31, 225–239. [Google Scholar] [CrossRef]
  21. Offshore Energy. Finnish Wave Energy Company Enters Green Hydrogen Market. 2021. Available online: https://www.offshore-energy.biz/finnish-wave-energy-company-enters-green-hydrogen-market/ (accessed on 12 February 2021).
  22. Pecher, A.; Kofoed, J.P. (Eds.) Handbook of Ocean Wave Energy; Springer International Publishing: Cham, Switzerland, 2017; Volume 7. [Google Scholar] [CrossRef] [Green Version]
  23. Magagna, D.; Margheritini, L.; Alessi, A.; Bannon, E.; Boelman, E.; Bould, D.; Coy, V.; Marchi, E.D.; Frigaard, P.B.; Soares, C.G.; et al. Workshop on Identification of Future Emerging Technologies in the Ocean Energy Sector: JRC Conference and Workshop Reports; European Commission Office for Official Publications of the European Union: Ispra, Italy, 2018; p. 81. [Google Scholar] [CrossRef]
  24. Clemente, D.; Rosa-Santos, P.; Taveira-Pinto, F. On the potential synergies and applications of wave energy converters: A review. Renew. Sustain. Energy Rev. 2021, 135, 110162. [Google Scholar] [CrossRef]
  25. Clemente, D.; Rosa-Santos, P.; Taveira-Pinto, F.; Martins, P.; Paulo-Moreira, A. Proof-of-concept study on a wave energy converter based on the roll oscillations of multipurpose offshore floating platforms. Energy Convers. Manag. 2020, 224, 19. [Google Scholar] [CrossRef]
  26. Clemente, D.; Rosa-Santos, P.; Taveira-Pinto, F.; Martins, P. Influence of platform design and power take-off characteristics on the performance of the E-Motions wave energy converter. Energy Convers. Manag. 2021, 244, 15. [Google Scholar] [CrossRef]
  27. Rodrigues, C.; Nunes, D.; Clemente, D.; Mathias, N.; Correia, J.M.; Rosa-Santos, P.; Taveira-Pinto, F.; Morais, T.; Pereira, A.; Ventura, J. Emerging triboelectric nanogenerators for ocean wave energy harvesting: State of the art and future perspectives. Energy Environ. Sci. 2020, 27, 2657–2683. [Google Scholar] [CrossRef]
  28. Rodrigues, C.; Ramos, M.; Esteves, R.; Correia, J.; Clemente, D.; Gonçalves, F.; Mathias, N.; Gomes, M.; Silva, J.; Duarte, C.; et al. Integrated study of triboelectric nanogenerator for ocean wave energy harvesting: Performance assessment in realistic sea conditions. Nano Energy 2021, 34, 105890. [Google Scholar] [CrossRef]
  29. Silva, D.; Martinho, P.; Guedes Soares, C. Wave energy distribution along the Portuguese continental coast based on a thirty three years hindcast. Renew. Energy 2018, 127, 1064–1075. [Google Scholar] [CrossRef]
  30. Babarit, A.; Clément, A.H. Optimal latching control of a wave energy device in regular and irregular waves. Appl. Ocean Res. 2006, 28, 77–91. [Google Scholar] [CrossRef]
  31. Chen, Z.; Zhou, B.; Zhang, L.; Sun, L.; Zhang, X. Performance evaluation of a dual resonance wave-energy convertor in irregular waves. Appl. Ocean Res. 2018, 77, 78–88. [Google Scholar] [CrossRef]
  32. Rodríguez, C.A.; Taveira-Pinto, F.; Rosa-Santos, P. Experimental Assessment of the Performance of CECO Wave Energy Converter in Irregular Waves. In Ocean Renewable Energy; ASME: Madrid, Spain, 2018; Volume 10, p. V010T09A026. [Google Scholar] [CrossRef]
  33. Calheiros-Cabral, T.; Clemente, D.; Rosa-Santos, P.; Taveira-Pinto, F.; Ramos, V.; Morais, T.; Cestaro, H. Evaluation of the annual electricity production of a hybrid breakwater-integrated wave energy converter. Energy 2020, 213, 17. [Google Scholar] [CrossRef]
  34. Clemente, D.; Cabral, T.; Rosa-Santos, P.; Taveira-Pinto, F.; Rodrigues, C.; Correia, J.M.; Pereira, A.; Ventura, J.; Mathias, N.; Marini, R.; et al. Experimental Study of a Navigational Buoy Powered by Wave Energy through Triboelectric Nanogenerators, 1st ed.; CRC Press: Lisboa, Portugal, 2020. [Google Scholar] [CrossRef]
  35. Bracco, G.; Cagninei, A.; Giorcelli, E.; Mattiazzo, G.; Poggi, D.; Raffero, M. Experimental validation of the ISWEC wave to PTO model. Ocean Eng. 2016, 120, 40–51. [Google Scholar] [CrossRef]
  36. Wello Oy Technology. Wello Oy Penguin 2019. Available online: https://wello.eu/technology/ (accessed on 29 January 2020).
  37. A View inside Oscilla Power’s Triton C Wave Energy Converter; Oscilla Power Inc.: Seattle, WA, USA, 2020.
  38. Pozzi, N.; Bracco, G.; Passione, B.; Sirigu, S.A.; Mattiazzo, G. PeWEC: Experimental validation of wave to PTO numerical model. Ocean Eng. 2018, 167, 114–129. [Google Scholar] [CrossRef]
  39. Cordonnier, J.; Gorintin, F.; De Cagny, A.; Clément, A.H.; Babarit, A. SEAREV: Case study of the development of a wave energy converter. Renew. Energy 2015, 80, 40–52. [Google Scholar] [CrossRef]
  40. Wu, J.; Yao, Y.; Sun, D.; Ni, Z.; Göteman, M. Numerical and Experimental Study of the Solo Duck Wave Energy Converter. Energies 2019, 12, 1941. [Google Scholar] [CrossRef] [Green Version]
  41. Crowley, S.; Porter, R.; Taunton, D.J.; Wilson, P.A. Modelling of the WITT wave energy converter. Renew. Energy 2017, 15, 159–174. [Google Scholar] [CrossRef] [Green Version]
  42. Liu, L.; Yang, X.; Zhao, L.; Hong, H.; Cui, H.; Duan, J.; Yang, Q.; Tang, Q. Nodding Duck Structure Multi-track Directional Freestanding Triboelectric Nanogenerator toward Low-Frequency Ocean Wave Energy Harvesting. ACS Nano 2021, 16, 9412–9421. [Google Scholar] [CrossRef] [PubMed]
  43. Sheng, W.; Tapoglou, E.; Ma, X.; Taylor, C.J.; Dorrell, R.M.; Parsons, D.R.; Aggidis, G. Hydrodynamic studies of floating structures: Comparison of wave-structure interaction modelling. Ocean Eng. 2022, 249, 16. [Google Scholar] [CrossRef]
  44. Guercio, A.; Frazitta, V.; Cuto, D.; Trapanense, M.; Kumar, D.M.; Cirrincione, M. A system capable of dampening roll and producing electricity installed on the hull of a fishing vessel. In Proceedings of the OCEANS 2021, San Diego, CA, USA, 20–23 September 2021; pp. 1–5. [Google Scholar] [CrossRef]
  45. Chen, H.; Xing, C.; Li, Y.; Wang, J.; Xu, Y. Triboelectric nanogenerators for a macro-scale blue energy harvesting and self-powered marine environmental monitoring system. Sustain. Energy Fuels 2020, 4, 1063–1077. [Google Scholar] [CrossRef]
  46. Chen, J.; Yang, J.; Li, Z.; Fan, X.; Zi, Y.; Jing, Q.; Guo, H.; Wen, Z.; Pradel, K.C.; Niu, S.; et al. Networks of Triboelectric Nanogenerators for Harvesting Water Wave Energy: A Potential Approach toward Blue Energy. ACS Nano 2015, 9, 3324–3331. [Google Scholar] [CrossRef] [PubMed]
  47. Zhang, C.; Liu, L.; Zhou, L.; Yin, X.; Wei, X.; Hu, Y.; Liu, Y.; Chen, S.; Wang, J.; Wang, Z.L. Self-Powered Sensor for Quantifying Ocean Surface Water Waves Based on Triboelectric Nanogenerator. ACS Nano 2020, 14, 7092–7100. [Google Scholar] [CrossRef] [PubMed]
  48. Wang, H.; Fan, Z.; Zhao, T.; Dong, J.; Wang, S.; Wang, Y.; Xiao, X.; Liu, C.; Pan, X.; Zhao, Y.; et al. Sandwich-like triboelectric nanogenerators integrated self-powered buoy for navigation safety. Nano Energy 2021, 84, 105920. [Google Scholar] [CrossRef]
  49. Liu, G.; Xiao, L.; Chen, C.; Liu, W.; Pu, X.; Wu, Z.; Hu, C.; Wang, Z.L. Power cables for triboelectric nanogenerator networks for large-scale blue energy harvesting. Nano Energy 2020, 75, 104975. [Google Scholar] [CrossRef]
  50. Gao, Q.; Xu, Y.; Yu, X.; Jing, Z.; Cheng, T.; Wang, Z.L. Gyroscope-Structured Triboelectric Nanogenerator for Harvesting Multidirectional Ocean Wave Energy. ACS Nano 2022, 16, 6781–6788. [Google Scholar] [CrossRef]
  51. Astariz, S.; Iglesias, G. Enhancing Wave Energy Competitiveness through Co-Located Wind and Wave Energy Farms. A Review on the Shadow Effect. Energies 2015, 8, 7344–7366. [Google Scholar] [CrossRef]
  52. Sheng, W. Wave energy conversion and hydrodynamics modelling technologies: A review. Renew. Sustain. Energy Rev. 2019, 109, 482–498. [Google Scholar] [CrossRef]
  53. Chakrabarti, S. Empirical calculation of roll damping for ships and barges. Ocean Eng. 2001, 28, 915–932. [Google Scholar] [CrossRef]
  54. Journée, J.M.J.; Massie, W.W. Offshore Hydromechanics, 1st ed.; Delft University of Technology: Delft, The Netherlands, 2001. [Google Scholar]
  55. Bertram, V. Practical Ship Hydrodynamics, 2nd ed.; Elsevier: Amsterdam, The Netherlands, 2012. [Google Scholar] [CrossRef]
  56. Cummins, W. The Impulse Respone Function and Ship Motions. In Proc Symp. Ship Theory; Institut für Schiffbau der Universität Hamburg: Hamburg, Germany, 1962; p. 51. [Google Scholar]
  57. Ikeda, Y.; Himeno, Y.; Tanaka, N. On Eddy Making Component of Roll Damping Force on Naked Hull. J. Soc. Nav. Archit. Jpn. 1977, 1977, 54–64. [Google Scholar] [CrossRef] [PubMed] [Green Version]
  58. Ikeda, Y. Prediction Methods of Roll Damping of Ships and Their Application to Determine Optimum Stabilization Devices. Mar. Technol. 1978, 41, 89–93. [Google Scholar] [CrossRef]
  59. Fan, F.-R.; Tian, Z.-Q.; Wang, Z.L. Flexible triboelectric generator. Nano Energy 2012, 1, 328–334. [Google Scholar] [CrossRef]
  60. Wang, Z.L. Triboelectric Nanogenerator (TENG)—Sparking an Energy and Sensor Revolution. Adv. Energy Mater. 2020, 10, 7. [Google Scholar] [CrossRef] [Green Version]
  61. Wu, C.; Wang, A.C.; Ding, W.; Guo, H.; Wang, Z.L. Triboelectric Nanogenerator: A Foundation of the Energy for the New Era. Adv. Energy Mater. 2019, 9, 1802906. [Google Scholar] [CrossRef]
  62. Rodrigues, C.; Pires, A.; Gonçalves, I.; Silva, D.; OIiveira, J.; Pereira, A.; Ventura, J. Hybridizing Triboelectric and Thermomagnetic Effects: A Novel Low-Grade Thermal Energy Harvesting Technology. Adv. Funct. Mater. 2022, 32, 2110288. [Google Scholar] [CrossRef]
  63. Wang, Y.; Yang, Y.; Wang, Z.L. Triboelectric nanogenerators as flexible power sources. NPJ Flex. Electron. 2017, 1, 10. [Google Scholar] [CrossRef] [Green Version]
  64. Ahmed, A.; Saadatnia, Z.; Hassan, I.; Zi, Y.; Xi, Y.; He, X.; Zu, J.; Wang, Z.L. Self-Powered Wireless Sensor Node Enabled by a Duck-Shaped Triboelectric Nanogenerator for Harvesting Water Wave Energy. Adv. Energy Mater. 2017, 7, 1601705. [Google Scholar] [CrossRef]
  65. Harmon, W.; Bamgboje, D.; Guo, H.; Hu, T.; Wang, Z.L. Self-driven power management system for triboelectric nanogenerators. Nano Energy 2020, 71, 8. [Google Scholar] [CrossRef]
  66. Qualisys AB. Qualisys Track Manager: User Manual; Qualisys AB: Gothenburg, Sweden, 2006. [Google Scholar]
  67. DNV GL DNVGL-OS-E301; Position Mooring—Rules and Standards. DNV GL AS: Byrum, Norway, 2018.
  68. Offshore Standards DNVGL-OS-E301; Position Mooring. DNV GL AS: Byrum, Norway, 2020.
  69. Giannini, G.; Temiz, I.; Rosa-Santos, P.; Shahroozi, Z.; Ramos, V.; Göteman, M.; Engström, J.; Day, S.; Taveira-Pinto, F. Wave Energy Converter Power Take-Off System Scaling and Physical Modelling. J. Mar. Sci. Eng. 2020, 8, 632. [Google Scholar] [CrossRef]
  70. Kofoed, J.P. On the duration of test time series for stable and reliable performance indicators derived from experimental testing of WECs. In Book of Abstracts of the General Assembly 2019 (Porto, Portugal) of the WECANet COST Action CA17105: A pan-European Network for Marine Renewable Energy with a Focus on Wave Energy; WECANet: Porto, Portugal, 2019; p. 58. [Google Scholar]
  71. Clemente, D.; Rosa-Santos, P.; Taveira-Pinto, F.; Martins, P. Experimental performance assessment of geometric hull designs for the E-Motions wave energy converter. Ocean Eng. 2022, 260, 111962. [Google Scholar] [CrossRef]
Figure 1. Conceptualization of E-Motions with integrated triboelectric nanogenerators. The inner compartments can also accommodate either the E-Motions’ PTO or the TENGs.
Jmse 10 01924 g001
Figure 2. E-Motions operation at sea, under wave action: (a) initial equilibrium state; (b) wave-induced roll oscillations and translation of the PTO along the superstructure; (c) restoring moment induced roll oscillations and PTO sliding towards the superstructure’s end-stop at a lower height.
Jmse 10 01924 g002
Figure 3. Acting forces on the E-Motions’ PTO.
Jmse 10 01924 g003
Figure 4. (a) Structural design of the fabricated unidirectional lateral TENG and (b) the schematic illustration of the closing of the triboelectric nanogenerator placed at each side of the linear trough.
Jmse 10 01924 g004
Figure 5. Close-up view of a Qualisys camera (a) and experimental setup, top view schematic (b). The minimum wavelength distance of the first trio of probes was adjusted, for each test, in accordance with the varying wave period.
Jmse 10 01924 g005
Figure 6. Schematic of the reproduced PTO’s conceptualization and operation.
Jmse 10 01924 g006
Figure 7. Schematic representation of the working mechanism of lateral triboelectric nanogenerator.
Jmse 10 01924 g007
Figure 8. Bin distribution (one per group of four colours) for the case studies of (a) Aguçadoura and (b) São Pedro de Moel.
Jmse 10 01924 g008
Figure 9. Hydrodynamic roll response for the six DoFs, concerning the HC V1 model.
Jmse 10 01924 g009
Figure 10. Sea-state spectra (a) and roll transfer functions for the V1 variants of the HC, HS and TP ((bd), in that order).
Jmse 10 01924 g010
Figure 11. ζ m 0 , 4 (left) and ϵ 4 (right) for the HC sub-variants.
Jmse 10 01924 g011
Figure 12. ζ m 0 , 4 (left) and ϵ 4 (right) for the HS sub-variants.
Jmse 10 01924 g012
Figure 13. ζ m 0 , 4 (left) and ϵ 4 (right) for the TP sub-variants.
Jmse 10 01924 g013
Figure 14. Max-mean power ratios (left) and average power output per cubic meter of displaced volume (right), in prototype values: (a) HC, (b) HS and (c) TP sub-variants.
Jmse 10 01924 g014
Figure 15. (a) Open-circuit voltage generated by lateral based TENG within the half-cylinder hull under studied sea states. (b) Mean voltage (dark line), power densities (red line) per meter square and kilogram generated by triboelectric device.
Jmse 10 01924 g015
Table 1. Physical models: shape, dimensions and physical properties.
ModelJmse 10 01924 i001
Half-Cylinder (HC)
Jmse 10 01924 i002
Half-Sphere (HS)
Jmse 10 01924 i003
Trapezoidal Prism (TP)
Weight42.004 kg (unloaded) + 14.502 kg (2 × 3 ballasts, 2.416 kg each)8.066 kg (unloaded) + 4.834 kg (2 ballasts, 2.416 kg each)36.784 kg (unloaded) + 4.834 kg (2 ballasts, 2.416 kg each)
Ballasts positionUnderneath deck, two aligned groups at 0.350 m from the centre of the superstructureUnderneath deck, at 0.320 m from the centre of the superstructureBottom of the hull, aligned perpendicularly to the superstructure
Dimensions1.000 m length, 0.500 m radius/height, 10 mm thicknessOuter radius of 0.345 m, 5 mm thickness0.980 m length, 0.495—0.850 m lower-upper width, 0.500 m height, 10 mm thickness
Metacentric height0.146 m0.103 m0.114 m
Natural roll period2.04 s (unmoored)1.91 s (unmoored)2.15 s (unmoored)
Table 2. Representative bins from the (a) Aguçadoura and (b) São Pedro de Moel case studies.
(a) BINSContr. (-)Hs (m)Te (s)Tp (s)ProbSS (%)Pw (kW/m)
15.402.319.3010.4115.2224.31
25.602.3510.2311.4612.8927.73
39.803.2010.3211.5511.2151.90
411.203.3211.2112.5510.3060.61
59.804.1611.3212.678.0895.99
67.203.8312.1713.634.5687.37
711.404.7512.2713.744.76135.88
(b) BINSContr. (-)Hs (m)Te (s)Tp (s)ProbSS (%)Pw (kW/m)
15.002.259.3010.4212.0423.16
27.202.3610.2411.4615.0527.92
36.403.1510.3411.596.9250.28
49.202.8411.2112.5511.8744.20
511.403.7011.3012.658.1675.88
66.603.3112.1713.636.1465.44
711.604.2512.2613.736.22108.50
Table 3. Final bins considered in the experimental study with irregular waves, prototype values.
BINSContr. (-)Hs (m)Te (s)Tp (s)ProbSS (%)Pw (kW/m)
25.402.319.3010.4115.2224.31
37.202.3610.2411.4615.0527.92
49.803.2010.3211.5511.2151.90
511.203.3211.2112.5510.3060.61
611.403.7011.3012.658.1675.88
77.203.8312.1713.634.5687.37
811.604.2512.2613.736.22108.50
11.201.338.008.967.216.94
Table 4. Summary of the sub-variants for each E-Motions physical models.
V1V2V3
Jmse 10 01924 i004
  • Total mass: 56.506 kg;
  • Six ballasts: 6 × 2.417 kg;
  • PTO mass: 0.229 kg;
  • 6 magnets;
  • Metacentric height: 0.146 m;
  • T n , 4 (unmoored): 2.04 s.
Jmse 10 01924 i005
  • Total mass: 56.636 kg;
  • Six ballasts: 6 × 2.417 kg;
  • PTO mass: 0.311 kg;
  • 7 magnets (extra 0.130 kg);
  • Metacentric height: 0.146 m;
  • T n , 4 (unmoored): 2.04 s
Jmse 10 01924 i006
  • Total mass: 56.896 kg;
  • Six ballasts: 6 × 2.417 kg;
  • PTO mass: 0.372 kg;
  • 9 magnets (extra 0.390 kg);
  • Metacentric height: 0.145 m;
  • T n , 4 (unmoored): 2.05 s
Jmse 10 01924 i007
  • Total mass: 12.900 kg;
  • Two ballasts: 2 × 2.417 kg;
  • PTO mass: 0.229 kg;
  • 6 magnets;
  • Metacentric height: 0.103 m;
  • T n , 4 (unmoored): 2.04 s.
Jmse 10 01924 i008
  • Total mass: 17.734 kg;
  • Extra ballasts: 2 × 2.417 kg;
  • PTO mass: 0.229 kg;
  • 6 magnets;
  • Metacentric height: 0.096 m;
  • T n , 4 (unmoored): 2.05 s.
Jmse 10 01924 i009
  • Total mass: 19.534 kg;
  • Extra PVC walls: 6 × 0.300 kg;
  • PTO mass: 0.229 kg;
  • 6 magnets;
  • Metacentric height: 0.082 m;
  • T n , 4 (unmoored): 2.18 s.
Jmse 10 01924 i010
  • Total mass: 41.618 kg;
  • Two ballasts: 2 × 2.417 kg;
  • PTO mass: 0.229 kg;
  • 6 magnets;
  • Metacentric height: 0.114 m;
  • T n , 4 (unmoored): 2.15 s.
Jmse 10 01924 i011
  • Total mass: 46.452 kg;
  • Extra ballasts: 2 × 2.417 kg;
  • PTO mass: 0.229 kg;
  • 6 magnets;
  • Metacentric height: 0.074 m;
  • T n , 4 (unmoored): 2.65 s.
Jmse 10 01924 i012
  • Total mass: 46.452 kg;
  • Repositioning of ballasts;
  • PTO mass: 0.229 kg;
  • 6 magnets;
  • Metacentric height: 0.036 m;
  • T n , 4 (unmoored): 3.26 s.
Publisher’s Note: MDPI stays neutral with regard to jurisdictional claims in published maps and institutional affiliations.

