1. Introduction
It is well known that the 1991 Gulf War oil spills resulted in extensive contamination of the Arabian (Persian) Gulf shoreline of Saudi Arabia [
1,
2]. However, the source of extensive intertidal asphalt pavements extending more than 25 km (km) along Abu Ali Island (
Figure 1), documented during 1992 surveys [
1] has not been confirmed. Researchers working in Saudi Arabia in 1983 [
3,
4] reported that these pavements formed after the spills from at least two platforms in the Nowruz oil field that released oil for over two years from 1983 to 1985 during the Iran-Iraq War. NOAA [
5] reported that on 10 February 1983, a tanker collided with a platform in the Nowruz oil field in Iranian waters. The riser collapsed into the wellhead, releasing approximately 1500 barrels per day. The well was not capped until 18 September 1983 because the field was in the middle of the Iran-Iraq war zone. In March 1983, a nearby platform was attacked with rockets by Iraqi helicopters. The platform burned and spilled oil at approximately 5000 barrels per day. The rate slowed to about 1500 barrels per day over the two years before the well was capped.
Al-Amirah [
6] reported sheens, tarballs, and heavily weathered oil slicks contaminating the Saudi Arabian shoreline between 23 March and late June 1983. Fayad [
7] collected tarballs in April 1983 from the offshore islands and Saudi mainland to identify their source, using high-resolution gas chromatography and infrared spectroscopy to compare them with crude oils from the region, including the heavy Nowruz crude (no information was provided about the source of these crude oils). The results suggested that 90% of the samples matched the Nowruz crude oil [
7].
Figure 1.
The Arabian (Persian) Gulf showing the location of Abu Ali Island (star), the general surface currents (modified from [
8]), and the location of the Nowruz oil field (asterisk).
Figure 1.
The Arabian (Persian) Gulf showing the location of Abu Ali Island (star), the general surface currents (modified from [
8]), and the location of the Nowruz oil field (asterisk).
Figure 2 shows that Gulf War oil slicks were entering the bays just to the west of Abu Ali Island on 16 February 1991, but with no oil along the north-facing eastern side of Abu Ali Island where the extensive asphalt pavements have been observed. Shoreline surveys conducted in May/June 1991 to document the distribution of oil along the Saudi Arabian coastline stopped at the western end of Abu Ali Island (indicated by the white arrow in
Figure 2) because that was the extent of observations of the fresh oil from the Gulf War oil spills [
9]. The asphalt pavements had physical properties that were visually and chemically different than shoreline oiling resulting from the 1991 Gulf War oil spills that extended along 700 km of the Saudi Arabian coast, from the border with Kuwait to the western end of Abu Ali Island. Hayes et al. [
1] referred to these as “relict asphalt pavements” and said that the pavement “was extremely hard and resistant to breaking.” They reported that where both oils were present on the shoreline, the older asphalt pavement functioned as a barrier to penetration of the Gulf War oil into the underlying sediments.
Sauer et al. [
10] used chemical biomarkers (17α-trisnorhopane; Tm and 18α-trisnorneohopane; Ts) for 70 oiled shoreline sediment samples collected in 1992 from Abu Ali Island north to Ras Tanaqib to determine that 11 samples did not match the Gulf War oil spill, including 2 samples of relict pavement on Abu Ali Island (all of these samples were collected by co-author J. Michel). Sauer et al. [
10] specifically determined that these pavements on Abu Ali Island originated from a source other than the 1991 Gulf War oil spill.
In October 2020, the present study was conducted to identify and characterize the extent and degree of oiling and the volume of oil remaining on Abu Ali Island, to support remediation design plans. Key questions posed from this study include: What was the source(s) of this extensive pavement? Was it from multiple spills? Recent spills? The Gulf War oil spill? We use forensic analyses and supporting literature review to address these questions.
2. Materials and Methods
2.1. Historical Oil Spills That Could Have Affected Abu Ali Island
A literature search was conducted to identify reports on historical spills that could have affected Abu Ali Island, defined as releases from the northern Arabian (Persian) Gulf southward to Jubail. Based on the surface currents (
Figure 1) and winds that are predominantly out of the northwest, spills from this area would have the greatest potential for impacting Abu Ali Island. A key source was reports by Etkin [
11,
12] on oil inputs to the Arabian (Persian) Gulf. ITOPF maintains a database on tanker spills worldwide. Upon our request, they searched this database for tanker spills that occurred between the border with Kuwait and Dammam, Saudi Arabia over the period from 1970 to April 2020, to determine if there were local spills that could have affected the area. In addition, the ITOPF website (
https://www.itopf.org; accessed on 27 April 2020) was searched for reports of shoreline oiling for potential tanker spill sources.
The literature was also searched to obtain chemical biomarker data on crude oils in the region that could be used in a forensic analysis to compare the fingerprints of the oil residues on Abu Ali Island with those of potential sources. The biomarker ratio Ts/Tm is often used for forensic fingerprinting analysis [
13], and it was reported for many of the potential source oils. Furthermore, it was the only biomarker ratio reported for 70 oiled sediment samples collected in 1992 [
10] and the 2240 samples collected in 2002–2003 along the eastern shore of Saudi Arabia [
14], providing a robust dataset on the types of oil pollution present on the Saudi Arabian shoreline. Therefore, it was used for our forensic analysis of potential source oils for the oil on Abu Ali Island. It is acknowledged that long-term weathering of oil on the shoreline could affect even the more resistant biomarkers and their fingerprint stability. However, we anticipated that the biomarkers in the interior of thick layers of asphalt pavements and heavily oiled sediments would be less likely to be affected by microbial or photo-oxidative weathering processes.
2.2. Field Survey, Sample Collection, and Analysis Methods
The 2020 field study of the oil residues on Abu Ali Island consisted of 254 transects at 100 m (m) spacing from the supratidal zone to low tide. At each transect, detailed surface and subsurface oiling observations were recorded in shovel test pits dug to below the oiled layers, or until beach rock was encountered, with a minimum of three pits per transect perpendicular to the shoreline. If a significant subsurface continuous asphalt pavement or heavily oiled sediment layer was encountered at any observation location, additional bracketing observation locations with pit excavation, were added between 2 to 3 m from the original location landward and/or seaward, to delineate the across-shore extent of the oiled layers. This process was continued, with additional observation locations and pit excavations added as necessary, until no oil was observed.
All of the observation pits were excavated, where possible, to a minimum depth of 1 m when located at the berm top, or at the top of the beach face, and to 50 cm (cm) depth when located lower on the beach face or tidal flats. Pits were excavated to shallower depths when constrained by presence of beach rock, or where significant groundwater flow within beach sediments made further excavation or observation impossible. The sediments were described as: (1) asphalt pavement (generally hard, cohesive, weathered oil mixed with sediments, black to very dark gray in color); (2) heavily oiled sediment (non-cohesive to semi-cohesive oiled sediments with oil-covered clasts and in many cases pore spaces partially to completely saturated with oil, medium to dark brown in color); (3) lightly to moderately oiled sediments (non-cohesive oiled sediments that were much lighter in color); or (4) no visible oil.
For the forensic analysis of the possible source(s) of the oil, 100 oil samples were collected for laboratory analysis from a subset of the surface oiling sites and subsurface test pits, including five samples from “background” sites where oil was not observed. Oiled sample locations were distributed evenly across the study area. Samples were collected using pre-cleaned sampling utensils, placed into pre-cleaned glass jars, labeled to provide sample tracking, and placed in a cooler with blue ice. Care was taken to ensure that each sample was collected from a fresh surface that was not disturbed or contaminated during pit excavation. Separate coolers were used to segregate heavier oiled samples from lighter oiled and no visible oil samples. All samples were stored at 4 °C and maintained under chain of custody until transported to the laboratory.
Figure 3 shows examples of the asphalt pavement and heavily oiled sediment.
All 100 samples were analyzed for total petroleum hydrocarbons (TPH)—using American Public Health Association (APHA) 21st Edition Methods for Examination of Water and Wastewater Part 5520 E/F; and for biomarkers using U.S. Environmental Protection Agency (EPA) method SW-846/8720D in the single ion monitoring (SIM) mode. Polycyclic aromatic hydrocarbons (PAH)—parent compounds and homologues were measured in 47 samples using EPA SW-846/8720D-SIM. Using gas chromatography/mass spectrometry (Agilent 7890A/5975C with Agilent 7693, Santa Clara, California, USA), identification of the analytes of interest was performed by comparing the retention times of the analytes with the retention times of peaks identified by specific peak patterns in NIST 2779 standards.
Figure 4 shows the location of the 100 samples.
3. Results
3.1. Potential Crude Oil Sources and Properties
Documentation was found for 21 spills of crude oil spills >30 tons and 4 additional spills off the Saudi Arabia coast of unknown volumes over the period 1967 to 2017. Most of these spills were of 34–900 tons. Only three spills were of sufficient known volume (>10,000 tons) to have created the amount of oil that remained stranded on Abu Ali Island: the 1975 T/V Thorshammer that spilled 14,803 tons of Kuwait crude off the Mina Al Ahmadi terminal in Kuwait; the 1983–1985 spills of crude oil from two platforms in the Nowruz oil field that released 260,000 tons of Nowruz crude oil; and the 1991 Gulf War oil spills that released 1–1.7 million tons of Kuwait and Iraq crude oil.
The results of the literature search for biomarker data for potential crude oil sources are shown in
Table 1, which also includes Ts/Tm ratios from the following spilled oil field samples from the eastern coast of the Arabian (Persian) Gulf [
14]: (1) sample collected by Saudi authorities directly from the Gulf War oil spills in 1991 at Tanaqib (n = 1), Mardumah (n = 75), and Bryce Lagoon (n = 8); (2) samples from a storage pit where Gulf War oil recovered from the shoreline was stored (n = 3); and (3) samples collected during the 2002–2003 Oiled Shoreline Survey (n = 2240), which largely avoided sampling the Abu Ali asphalt pavement because the focus was on the oil from the Gulf War spills.
Table 1 also includes the two samples of the Abu Ali Island pavement that were collected in 1992 as part of the NOAA R/V
Mt. Mitchell cruise [
10], and tarmat deposits (n = 6) collected in 2019 from the northern region of Qatar [
15].
3.2. Extent of Oil on Abu Ali Island
Of the 1434 observation pits excavated, oiling of any description was observed at 1089 pits (76%). Continuous asphalt pavements or heavily oiled sediment layers, either buried or exposed at the surface, were the most common type of oil contamination observed during the field assessment. These continuous layers were observed at 514 observation pits (36%) along 173 unique transects (68%). Thickness of these continuous asphalt pavements when exposed at the surface ranged from less than 1 cm to 40 cm, with an average thickness of 14 cm. Thickness of continuous asphalt pavements or heavily oiled sediment layers buried below the surface ranged from less than 1 cm to 35 cm, with an average thickness of 12 cm. The mean and standard deviation for TPH concentration in the visually oiled samples was 53,840 ± 18,118 mg/kg. The mean and standard deviation for PAH concentration in the 44 visually oiled samples was 418.5 ± 132.4 mg/kg.
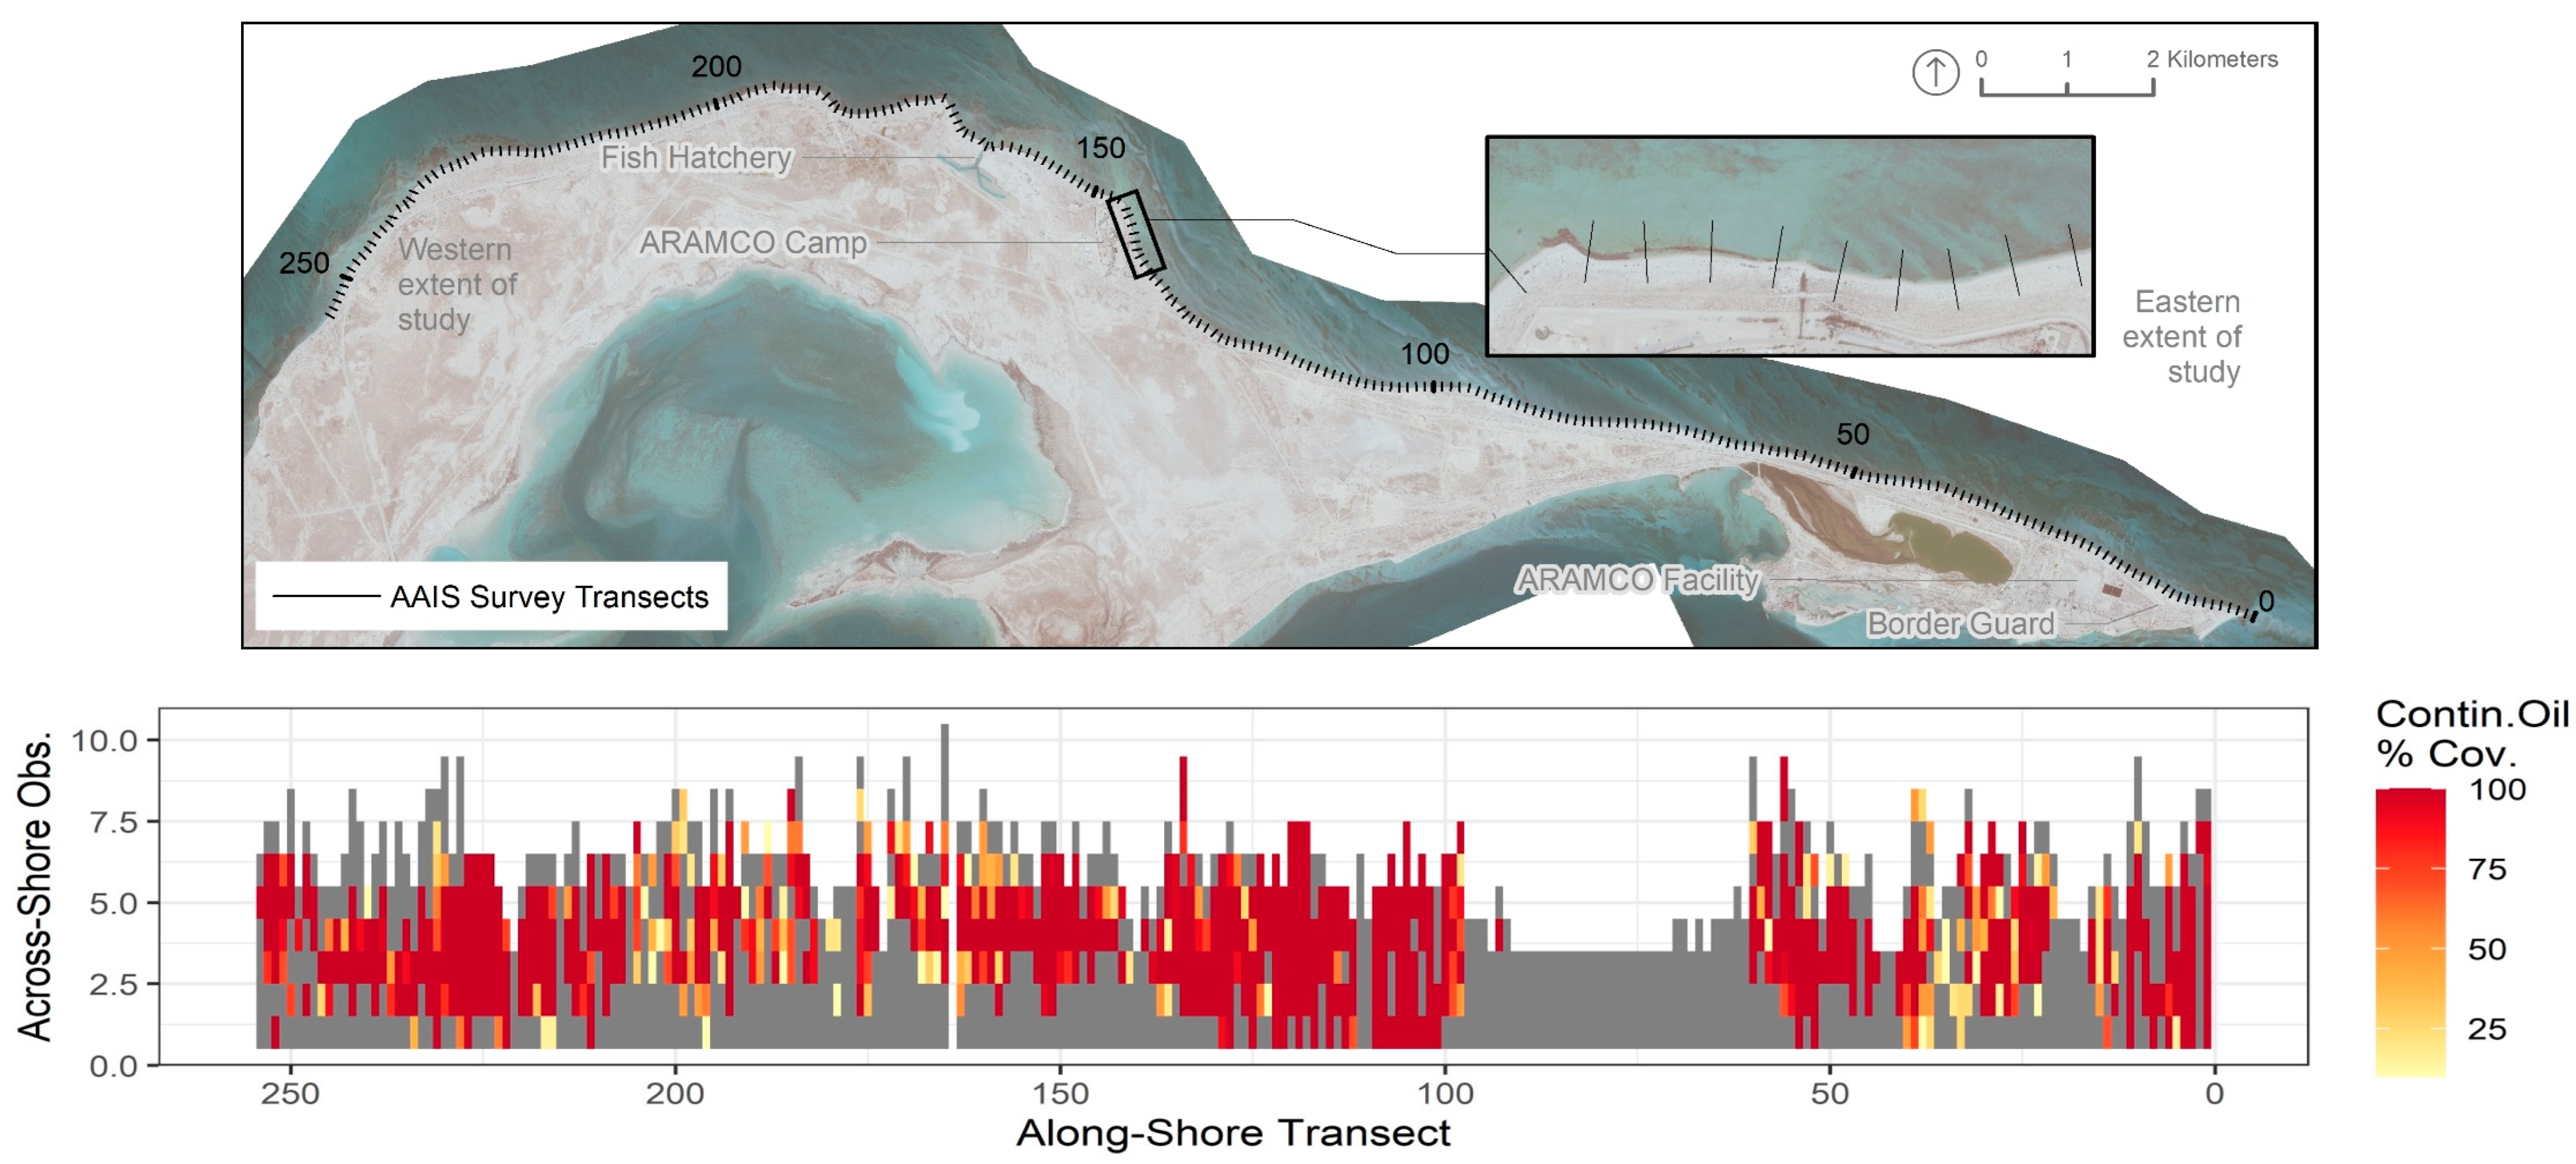
Figure 5 shows plots of the percent cover of continuous asphalt pavements or heavily oiled sediment layers at each pit location along all 254 transects. Continuous oiling is defined as greater than 50% oil coverage and the remainder of oiling is defined as discontinuous. This plot symbolizes each observation made in the field as a single tile, oriented such that observations made along the same transect appear as a vertical stack of tiles, with the most landward observation at the bottom and the most seaward observation at the top. Transects are displayed with the easternmost transect at the right and the westernmost at the left. This graphical method allows convenient representation of all observations, oriented approximately as they are in geographic space.
As can be seen in
Figure 5, oiled layers covers most of the surveyed length of 25.4 km, except for an area between transects 60 and 100. This 4 km length of shoreline consisted mostly of sand beach without underlying beach rock or seaward rock platforms or tidal flats and thus would have higher rates of shoreline change. The oiled layers along the area surveyed range in thickness from 0.3 to 30 cm. Much of the oiled layers are buried in the upper intertidal zone, in some cases by up to 1 m of clean sand. However, this oil outcrops at the surface from the middle to the lower intertidal zones. Though only the intertidal zone was surveyed in 2020, some of the oiled layers extend to a limited to unknown degree into the adjacent subtidal zone.
3.3. Origin of the Oil Residues on Abu Ali Island
Figure 6 (top) shows the distribution of Ts/Tm ratios for the 94 sediment samples collected in 2020 from Abu Ali Island that had concentrations above detection limits. Most samples had Ts/Tm ratios of 0.20–0.23. Only 1 sample, 139-4, was higher than 0.3 (refer to
Table S2 in the Supplementary Information). Excluding that outlier sample, the Ts/Tm ratio in the Abu Ali Island samples had a mean and standard deviation of 0.23 ± 0.02.
Ts and Tm values for the 94 visually oiled samples collected in 2020 from Abu Ali Island showed a high degree of correlation (R
2 = 0.9548) and thus are useful for comparison of these ratios in other samples.
Figure 6 (bottom) shows the range of Ts/Tm ratios for the 2002–2003 GWS samples and the mean Ts/Tm ratios for possible source oils listed in
Table 1. The only potential source oil that had a similar ratio was one Iraq crude oil. No large spills of Iraq crude oil were identified in the literature search; although releases of both Kuwait and Iraq crudes were reported for the 1991 Gulf War oil spills [
22]. Two tarmat samples also had Ts/Tm ratios with the range of the 2020 Abu Ali samples: the two 1992 Abu Ali tarmat samples and the Qatar tarmat samples collected in 2019, indicating that these were likely the same oils. The samples from the 2002–2003 Oil Shoreline Survey, which collected samples mostly of oil from the Gulf War oil spills, were similar to Kuwait crude and the Nowruz crude sample from 2005. One sample collected from Abu Ali Island in 2020 (139-4; the bar at 0.3) could contain some oil from the Gulf War spills. Though the 1983–1985 Nowruz spills were of Iran crude oils, the available Ts/Tm data for the other Iran crudes, including the 2005 sample from the Nowruz oil field, are very different than the asphalt pavements and heavily oiled sediments on Abu Ali Island. This is not unexpected because these ratios can vary on small geologic scales, including among individual oil reservoirs, and over time as reservoirs in an oil field are depleted and new wells drilled into different reservoirs. In this case, unfortunately, we do not have closely coupled source and spilled oil field samples from the Nowruz spills at the time they were occurring.
The 2020 Abu Ali Island oiled samples were evaluated for 15 diagnostic ratios (shown in the
Supplementary Information, Table S1). Though these diagnostic ratios were not available for the potential source oils in
Table 1, the results can be evaluated to determine whether the 2020 Abu Ali Island samples are internally consistent with each other (
Table S2). Using this more robust set of diagnostic ratios, two samples “very likely” include oil from different sources, 139-4 and 142-3, because at least three of the ratios are very different in these samples (values greater than 2 standard deviations from the mean of all samples). Three samples, 122-6 (0–4 cm), 142-3, and 153-3, have two ratios that are very different, thus also “likely” include oil from different sources. Note that these five samples are from the surface of the oiled layers, thus they are more likely to include oil from other sources.
4. Discussion
Though we cannot definitely conclude that the majority of the residual oil encountered on Abu Ali Island during the 2020 survey was oil mostly from the Nowruz oil spills because there is no source oil from the Nowruz spills, we evaluate the weight of evidence as follows:
The first reports of oil on Abu Ali Island were in late March 1983 just a month after the first releases from the Nowruz spills [
3,
4,
6,
7]. Al Amirah [
6] reported that from April to Mid-June 1983, many shorelines in Saudi Arabia were oiled and about 300 tons of oil were collected from the Saudi coastal zone in 1983, without listing any specific areas. By mid-June 1983, strong northwest winds and wave action buried the oil by clean sand and “Between July and early September the coast appeared clear.”
Satellite imagery collected in February 1991 shows the oil slicks from the Gulf War spills mostly on the west side of Abu Ali Island, not the north side (
Figure 2). In addition, shoreline assessment surveys in 1991 stopped where the field teams encountered the hardened asphalt pavements on Abu Ali Island because they could visually differentiate the pavements from the recent Gulf War spilled oil [
9].
Hayes et al. [
1] mapped the pavements on Abu Ali Island in 1992, which extended over 20 km on the north shore, calling them relict pavements that looked different than Gulf War oil. Co-author Michel collected the two asphalt pavement samples analyzed by Sauer et al. [
10] in 1992, specifically sampling them because they appeared different and older than the Gulf War oiled sediments on the shorelines north of Abu Ali Island. Forensic analysis confirmed that the asphalt pavements on Abu Ali Island in 1992 were not a match to oil from the Gulf War spills [
10].
Our analysis using 15 biomarker ratios in this current study showed that nearly all of the asphalt pavements or heavily oiled sediments on the north shore of Abu Ali Island are from the same oil. Forensic analysis using Ts/Tm biomarkers showed that the asphalt pavements or heavily oiled sediments on Abu Ali Island match the “Nowruz” asphalt pavement collected on Abu Ali Island in 1992, the Qatar tarmats, and an Iraq crude. No large individual spills of Iraq crude oil were identified in the literature or spill databases, although releases of both Kuwait and Iraq crudes were reported for the 1991 Gulf War oil spills [
22]. However, the 2020 oil residues from Abu Ali did not match most prior samples of Saudi shoreline oiling from the Gulf War oil spills, which largely consisted of spilled Kuwait crude.
Based on this weight of evidence, we argue that it is highly likely that the asphalt pavements and heavily oiled sediments on the north shore of Abu Ali Island are from the 1983–1985 spills from the Nowruz platforms off Iran and not from the Gulf War oil spills.
5. Conclusions
For perhaps as long as four decades, extensive and heavy oil has persisted along the outer coast of Abu Ali Island, Saudi Arabia. Most of the samples of asphalt pavement and heavily oiled sediments from Abu Ali Island collected in 2020 were fingerprinted as being similar to each other and to samples of asphalt pavements collected in 1992 that were visibly different from the samples of fresher Gulf War oil spills at the time. Only five samples contain other oils, which are likely oil from the Gulf War oil spills or from other spills of similar crudes. The vast majority of asphalt pavements and heavily oiled sediments on Abu Ali Island are not from the Gulf War oil spills and are most likely from the 1983–1985 Nowruz oil spills.
Supplementary Materials
The following supporting information can be downloaded at:
https://www.mdpi.com/article/10.3390/jmse10121877/s1, Table S1: The biomarker compounds and diagnostic ratios used in the fingerprinting analysis of the sediment samples collected from Abu Ali Island in 2020. Table S2: Diagnostic ratios of biomarkers for 2020 Abu Ali Island samples. Those ratios that are very different from the mean and standard deviation are highlighted in pink; those that are outside the mean and standard deviation are highlighted in yellow.
Author Contributions
Conceptualization, Z.N., J.M., L.C., S.Z.; methodology, Z.N.; investigation, J.M., Z.N., L.C., S.Z., H.F., J.W., P.B.; writing—original draft preparation, J.M.; illustrations, J.W., Z.N.; writing—review and editing, J.M., Z.N., L.C., S.Z., J.W., P.B. All authors have read and agreed to the published version of the manuscript.
Funding
The field data collection and sample analysis were funded under a contract to Pandion Saudia Company, Ltd. from the National Center for Environmental Compliance, Kingdom of Saudi Arabia. Research Planning, Inc. funded the preparation of the manuscript.
Institutional Review Board Statement
Not applicable.
Informed Consent Statement
Not applicable.
Data Availability Statement
Conflicts of Interest
The authors declare no conflict of interest.
References
- Hayes, M.O.; Michel, J.; Montello, T.M.; Aurand, D.V.; Al-Mansi, A.M.; Al-Momen, A.H.; Sauer, T.C.; Thayer, G.W. Distribution and weathering of shoreline oil one year after the Gulf War oil spill. Mar. Pollut. Bull. 1993, 27, 135–142. [Google Scholar] [CrossRef]
- Al-Mansi, A.M.; Montello, T.M.; Al-Momen, A.H. Seasonal profile changes in the western Arabian Gulf. In Marine Wildlife Sanctuary for the Arabian Gulf. Environmental Research and Conservation Following the 1991 Gulf War Oil Spill; Krupp, F., Abuzinada, A.H., Nader, I.A., Eds.; NCWCD, Riyadh and Senckenberg Research Institute: Frankfort A.M., Germany, 1996; pp. 33–290. [Google Scholar]
- Lehr, W.; National Oceanic and Atmospheric Administration, Seattle, WA, USA. Personal communication, 1992.
- Lehr, W.; National Oceanic and Atmospheric Administration (ret.), Seattle, WA, USA. Personal communication, 2022.
- National Oceanic and Atmospheric Administration (NOAA). Oil Spill Case Histories. NOAA/Hazardous Materials Response and Assessment Division, Seattle, Washington. 1992. Available online: https://www.hsdl.org/?view&did=709115 (accessed on 31 May 2022).
- Al-Amirah, A. Oil pollution in the Arabian Gulf: Nowruz oil spill and its impact. A case study of Saudi Arabia. Geogr. Bull. 1985, 37, 16–32. [Google Scholar] [CrossRef]
- Fayad, N.M. Identification of tar balls following the Nowruz oil spill. Mar. Environ. Res. 1986, 18, 155–163. [Google Scholar] [CrossRef]
- Reynolds, R.M. Physical oceanography of the Gulf, Strait of Hormuz, and the Gulf of Oman–Results from the Mt Mitchell expedition. Mar. Pollut. Bull. 1993, 27, 35–59. [Google Scholar] [CrossRef]
- Gundlach, E.R.; McCain, J.C.; Fadlallah, Y.H. Distribution of oil along the Saudi Arabian coastline (May/June 1991) as a result of the Gulf War oil spills. Mar. Pollut. Bull. 1993, 27, 93–96. [Google Scholar] [CrossRef]
- Sauer, T.C.; Brown, J.S.; Boehm, P.D.; Aurand, D.V.; Michel, J.; Hayes, M.O. Hydrocarbon source identification and weathering characterization of intertidal and subtidal sediments along the Saudi Arabian coast after the Gulf War oil spill. Mar. Pollut. Bull. 1993, 27, 117–134. [Google Scholar] [CrossRef]
- Etkin, D.S. Analysis of oil inputs into the Arabian Gulf; Environmental Research Consulting: Cortlandt Manor, NY, USA, 2002; 64p. [Google Scholar]
- Etkin, D.S. Oil Inputs into the Kuwaiti Waters of the Arabian Gulf; Environmental Research Consulting: Cortlandt Manor, NY, USA, 2003; 69p. [Google Scholar]
- Wang, Z.D.; Yang, C.; Fingas, M.; Hollebone, B.; Yim, U.H.; Oh, J.R. Petroleum biomarker fingerprinting for oil spill characterization and source identification. In Oil Spill Environmental Forensics; Academic Press: Cambridge, MA, USA, 2007; pp. 73–146. [Google Scholar] [CrossRef]
- Research Planning, Inc. (RPI). Oiled Shoreline Survey (OSS) in Support of the Marine and Coastal Damage Assessment; Research Planning, Inc.: Columbia, SC, USA, 2003; 414 pp plus appendices. [Google Scholar]
- Arekhi, M.; Terry, L.G.; John, G.F.; Al-Khayat, J.A.; Castillo, A.B.; Vethamony, P.; Clement, T.P. Field and laboratory investigation of tarmat deposits found on Ras Rakan Island and northern beaches of Qatar. Sci. Total Environ. 2020, 735, 139516. [Google Scholar] [CrossRef]
- Yim, U.K.; Kim, M.; Ha, S.Y.; Kim, S.; Shim, W.J. Oil spill environmental forensics: The Hebei Spirit oil spill case. Environ. Sci. Technol. 2012, 46, 6431–6437. [Google Scholar] [CrossRef] [PubMed]
- El-Gayar, M.S. Aromatic steroids in mideastern crude oils: Identification and geochemical application. Pet. Sci. Technol. 2005, 23, 971–990. [Google Scholar] [CrossRef]
- Rabbani, A.R.; Kamali, M.R. Source rock evaluation and petroleum geochemistry, offshore SW Iran. J. Petrol. Geol. 2005, 28, 413–428. [Google Scholar] [CrossRef]
- Al-Khafaji, A.J.; Hakimi, M.H.; Najaf, A.A. Organic geochemistry characterisation of crude oils from Mishrif reservoir rocks in the southern Mesopotamian Basin, South Iraq: Implication for source input and paleoenvironmental conditions. Egypt. J. Petrol. 2018, 27, 137–144. [Google Scholar] [CrossRef]
- Yim, U.K.; Ha, S.Y.; An, J.G.; Won, J.H.; Han, G.M.; Hong, S.H.; Kim, M.; Jung, J.H.; Shim, J.W. Fingerprint and weathering characteristics of stranded oils after the Hebei Spirit oil spill. J. Hazard. Mater. 2011, 197, 60–69. [Google Scholar] [CrossRef]
- Hauser, A.; Dashti, H.; Khan, Z.H. Identification of biomarker compounds in selected Kuwait crude oils. Fuel 1999, 78, 1483–1488. [Google Scholar] [CrossRef]
- Tawfiq, N.; Olsen, D.A. Saudi Arabia’s response to the 1991 Gulf oil spill. Mar. Pollut. Bull. 1993, 27, 333–345. [Google Scholar] [CrossRef]
| Publisher’s Note: MDPI stays neutral with regard to jurisdictional claims in published maps and institutional affiliations. |
© 2022 by the authors. Licensee MDPI, Basel, Switzerland. This article is an open access article distributed under the terms and conditions of the Creative Commons Attribution (CC BY) license (https://creativecommons.org/licenses/by/4.0/).

 ,
, 


