Article

Influences of Seasonal Variability and Potential Diets on Stable Isotopes and Fatty Acid Compositions in Dominant Zooplankton in the East Sea, Korea

1
Department of Marine Science and Convergent Technology, Hanyang University, Ansan 15588, Republic of Korea
2
Ocean Climate & Ecology Research Division, National Institute of Fisheries Science, Busan 46083, Republic of Korea
*
Author to whom correspondence should be addressed.
J. Mar. Sci. Eng. 2022, 10(11), 1768; https://doi.org/10.3390/jmse10111768
Submission received: 11 October 2022 / Revised: 13 November 2022 / Accepted: 15 November 2022 / Published: 17 November 2022

Abstract

:
Despite their crucial roles in transporting primary productions in marine food webs, the trophic dynamics of zooplankton throughout the seasons have rarely been studied. In this study, four dominant zooplankton taxa with phytoplankton size composition and productivity were collected over four seasons in the East Sea, which is known to change more rapidly than global trends. We then analyzed the δ13C and δ15N values and fatty acid composition of zooplankton. The heavy δ13C values in February and August 2021 were observed with high concentrations of total chlorophyll-a, and the δ13C differences among the four zooplankton taxa in the coastal region (site 105-05) were most pronounced in February 2021. The relative amounts of eicosapentaenoic acid (C20:5(n-3)) and docosahexaenoic acid (C22:6(n-3)), indicators of phytoplankton nutritional quality, were also highest in February 2021. Non-metric multivariate analyses showed dissimilarity among zooplankton taxa during the high productivity period based on chlorophyll-a concentrations (51.6%), which may be due to an increase in available foods during the highly productive season. In conclusion, the dietary intake of zooplankton can be reduced by the transition of phytoplankton, which has important implications for the impact of climate change on planktonic ecosystems in the East Sea.

1. Introduction

As zooplankton are crucial mediators of trophic transfer, zooplankton community shifts may reflect changes in primary production and affect consumers at higher trophic levels [1,2]. Alterations in the structures of diverse zooplankton populations have been implicated as the potential drivers of food web shifts in marine ecosystems [1,3], and such a trophic-based context is known to be affected by environmental variability [4,5]. For instance, water temperature can influence the distribution, physiology, and abundance of zooplankton [6,7], and stratification of seawater causes a decrease in the body size of zooplankton [8]. Moreover, different feeding strategies among diverse zooplankton taxa (e.g., herbivores, omnivores, and carnivores) could cause a variety of responses to changes in the ecosystem. The seasonal heterogeneity of primary production changes the diversity of edible food sources for each zooplankton taxon [5]. Thus, coastal and offshore ecosystem management involves tracking an actual change in ecological status that responds to environmental variability (spatial and temporal dynamics). However, the zooplankton population shift under naturally variable environmental conditions in local ecosystems is often poorly characterized, as do primary production, ecological parameters and community, and climate change.
Climate change causes high water temperature and ocean acidification, and triggers changes in physiology, production, and size composition in the phytoplankton community [9,10,11]. In particular, the ocean warming trend of the East Sea/Japan Sea (hereafter the East Sea) has been faster than the global trend over the last 50–60 years [12]. The East Sea is a semi-enclosed marginal sea of the Northwest Pacific Ocean, adjacent to the Korean Peninsula, Russia, and the Japanese islands. The East Sea has highly dynamic environmental conditions with seasonal upwelling, eddies, and mixing of water masses between the Tsushima and Oyashio currents [13]. Consequently, recent studies in the East Sea have reported that such a continuous ocean temperature rise induces a decreasing trend in primary productivity with an increasing proportion of small-sized phytoplankton in the basal food web [9,10]. A likely reason for such an increase in the proportion of small-sized phytoplankton could be because as phytoplankton cells decrease in size, their surface area-to-volume ratio increases, and the thickness of the diffusion boundary layer decreases. This may be advantageous over larger phytoplankton in nutrient-poor environments [14]. However, Kang et al. [10] reported that small-sized phytoplankton have lower calorific values per chlorophyll-a concentration than large phytoplankton, suggesting that small-sized phytoplankton could provide a more energy-inefficient food source for upper trophic level consumers. Nevertheless, previous studies of zooplankton conducted in the East Sea have focused on monitoring spatiotemporal changes in species abundance and richness [15,16,17] for water temperature and salinity. It is difficult to understand the ecological changes at the base of the pelagic ecosystem, which is composed of diverse and complex trophic relationships of zooplankton with phytoplankton, protozoa, detritus, and sinking particles in the water column.
Approaches to trophic relationships reflect in situ ecological changes through informing about the changes in niche breadth, interspecies dietary competition, the nutritional quality of organisms, and the trophic position of consumers in environments based on primary productivity [4,5,18,19,20]. In particular, stable isotope ratios and fatty acid (FA) concentrations have been used increasingly to provide dietary information in consumer tissues [5,19,20]. The carbon stable isotope (δ13C) value of animal tissues indicates diet sources distributed in the habitat, as the value generally shows little isotopic enrichment during trophic transfer (<1‰). The nitrogen stable isotope (δ15N) value can provide information on trophic positions in marine ecosystems due to a constant 3.4‰ increase per trophic level from prey to its direct consumer [21,22]. C and N stable isotope compositions have been used widely to investigate changes in the food diversity of zooplankton based on seasonal ocean currents [20,23], effects of eutrophication caused by anthropogenic activities on the trophic level of zooplankton [24], and differences in the ecological niche of zooplankton by size [19]. FAs can also be functional parameters, and information on plankton-specific FAs can provide more detailed C source to the δ13C results of zooplankton [20,25]. In particular, some FAs are called essential FAs as these cannot be synthesized de novo in the consumer body, and thus the relative contributions of diatom and dinoflagellate in diet are directly reflected in consumers [5,20,23,26,27]. For instance, eicosapentaenoic acid (EPA, C20:5(n-3)) and docosahexaenoic acid (DHA, C22:6(n-3)) are specific markers for the ratio of diatom and dinoflagellate abundance. In addition, the total lipid content can identify the most nutritionally sufficient diet for consumers at the upper trophic level [5]. Overall, stable isotopes, FA biomarkers, and total lipid content are valuable tools for revealing the effects of environmental variability on trophic interactions between zooplankton consumers and primary producers at the base of the pelagic ecosystem.
It is still challenging to improve our understanding of the effects of temporal and spatial variability on the trophic structure of zooplankton despite several studies that have used stable isotope analysis and FA parameters to describe the trophic structure and to specify dietary resources successfully in pelagic ecosystems [24,27]. In this regard, we addressed how the four dominant zooplankton taxa in the East Sea are affected by environmental conditions and phytoplankton community changes over a one-year sampling period of August 2020 to August 2021. Stable isotope compositions and FA profiles in zooplankton from the coastal site 105-05, where vertical mixing and upwelling by wind occur actively and frequently, were compared with those from the offshore site 105-11, where vertical mixing and upwelling are less frequent. Identifying the ecological change in response to the fluctuation of primary producers coinciding with environmental changes helps us to broadly characterize the ecological and biochemical processes under current climate change.

2. Materials and Methods

2.1. Analysis of Environmental Parameter

Seasonal sampling was conducted in the East Sea using the ocean research vessel Tamgu3 (797 tons; National Institute of Fisheries Sciences, Busan, Republic of Korea) during four seasons from 2020 to 2021 (August, October, February, and April, representing summer, autumn, winter, and spring, respectively) (Figure 1 and Table 1). In 105-05 and 105-11, water samples were collected using Niskin bottles, which were attached to a conductivity-temperature-depth (CTD)/rosette sampler (SBE911 plus, Seabird Electronics Inc., Bellevue, WA, USA) to measure dissolved inorganic nutrients such as nitrate (NO32−), nitrite (NO2), ammonium (NH4+), silicate (SiO32−), phosphate (PO43−), and size-fractioned chlorophyll-a concentrations. Temperature, salinity, and dissolved oxygen were measured using a CTD/rosette sampler.
0.1 L seawater was passed through a 0.45 μM disposable membrane filter unit and stored at −20 °C for analyzing dissolved inorganic nutrient concentrations. Nutrient concentrations were measured using an automatic analyzer (Quattro, Seal Analytical, Norderstedt, Germany) at the National Institute of Fisheries Science (NIFS), Korea. The sum of NO32−, NO2, and NH4+ was calculated as dissolved inorganic N (DIN).
For total chlorophyll-a, 0.1–0.4 L of seawater was filtered through a GF/F (ø = 25 mm; Whatman). Size-fractioned chlorophyll-a was separated sequentially through membrane filters with pore sizes of 20 and 2 µM (ø = 47 mm; Whatman). The filtered sample was shaded from light using aluminum foil and stored at −20 °C. Before analysis, pigments were extracted with 90% acetone in the dark at 4 °C for 12–24 h. Chlorophyll-a concentrations were measured using a fluorometer, following Parson et al. [28] (Turner Designs, 10-AU, San Jose, CA, USA).

2.2. Zooplankton Sampling

Zooplankton were collected over four seasons, from August 2020 to August 2021. The plankton net (RN80, diameter 80 cm, mesh size 300 μM) was towed vertically to the surface after horizontal drawing for 10 min at a speed of 2 knots using the oblique tow method at site 105-05 in the coastal region and site 105-11 in the offshore of the East Sea (Figure 1, Table 1). Then, zooplankton were selectively sorted and isolated into four different groups (Euchaetidae, Chaetognatha, Euphausiid, and Amphipod) using an optical microscope and stored at −20 °C until further use. The zooplankton were freeze-dried for 48 h before sample pretreatment.

2.3. Stable Isotope Analysis of Zooplankton

The δ13C and δ15N values of the samples were analyzed in triplicate using an elemental analyzer (EA, Vario PYROcube, Elementar, Germany) equipped with an isotope ratio mass spectrometer (IRMS, Isoprime 100, Isoprime, UK), as described in a previous study. Briefly, inorganic C was extracted using 1 M HCl, whereas lipids were extracted using chloroform/methanol treatment. For analysis, approximately 0.1 and 1.0 mg of samples for carbon and nitrogen analysis, respectively, were wrapped in a tin capsule. Stable isotopes are stated in conventional δ notation as follows:
δ X   ( ) = [ ( R S a m p l e R S t a n d a r d ) 1 ] × 1000
where X and R indicate the isotope (C or N) and corresponding ratio of 13C/12C or 15N/14N, respectively. δ13C and δ15N standards (IAEA CH-3 and N-1, respectively) with known isotopic ratios were measured every 10 sample runs to confirm the precision of the analysis instrument. The standard deviations of the samples in the entire analysis set were less than 0.3‰ for δ13C and δ15N.

2.4. Fatty Acid Composition Analysis

The total lipids in approximately 2 mg of zooplankton samples were extracted using the method established by Folch et al. [29] and modified by Choi et al. [26]. Briefly, after total lipids were extracted using a dichloromethane/methanol solution, 100 µL of 20 ppm surrogate (nonadecanoic acid, C19:0) was added to the sample. Saponification was performed using KOH solution in MeOH, and methylation and derivatization were performed using Boron trifluoride-methanol solution and FA methyl esters (FAMEs). Methyl heneicosanoic acid (C21:0) was added at the same amount as the surrogate for use as an internal standard. FAME concentrations were determined in triplicate using gas chromatography (GC/FID, HP-7890A, Agilent Technologies, Santa Clara, CA, USA) equipped with a flame ionization detector on a DB5 column (60 m in length × 0.25 mm inner diameter × 0.25 μM film thickness, Agilent Technologies, Santa Clara, CA, USA). FAs were confirmed by comparing the retention time of FAME standards (Supelco, Bellefonte, PA, USA) and mass spectra of gas chromatography equipped with mass spectrometry (GC/MS, HP-7820A, Agilent Technologies, Santa Clara, CA, USA).

2.5. Statistical Analysis

All data are presented as the mean and standard deviation of three replicates. To confirm the effects of seasonality on the stable isotope ratio and FA composition in the zooplankton groups, a one-way analysis of variance (ANOVA) was performed using IBM SPSS statistics 27. Tukey’s-b test was conducted for post hoc analysis. Non-metric multidimensional scaling (NMDS) was used for ordinations based on the Bray—Curtis similarity index using PAST software [30] to identify the differences between zooplankton taxa according to environmental differences. Feature scaling is a method of standardizing data for statistical processing to values within the desired range and can eliminate errors due to different values, signs, and variability. We selected seven FAs that generated up to 75% cumulative dissimilarity between zooplankton taxa using a similarity percentage (SIMPER) analysis (contributing at least 5% per FA). These seven FAs and carbon and nitrogen stable isotope ratios were used for NMDS analysis. In this study, NMDS was performed after normalizing the data to a range of 0 to 1 using the feature scaling method. We analyzed stress values from NMDS analysis and confirmed that all the values were less than 0.2. We performed SIMPER analysis to confirm dissimilarity between zooplankton taxa. Furthermore, the FAs that contributed the most to each taxon were identified using SIMPER analysis.

3. Results

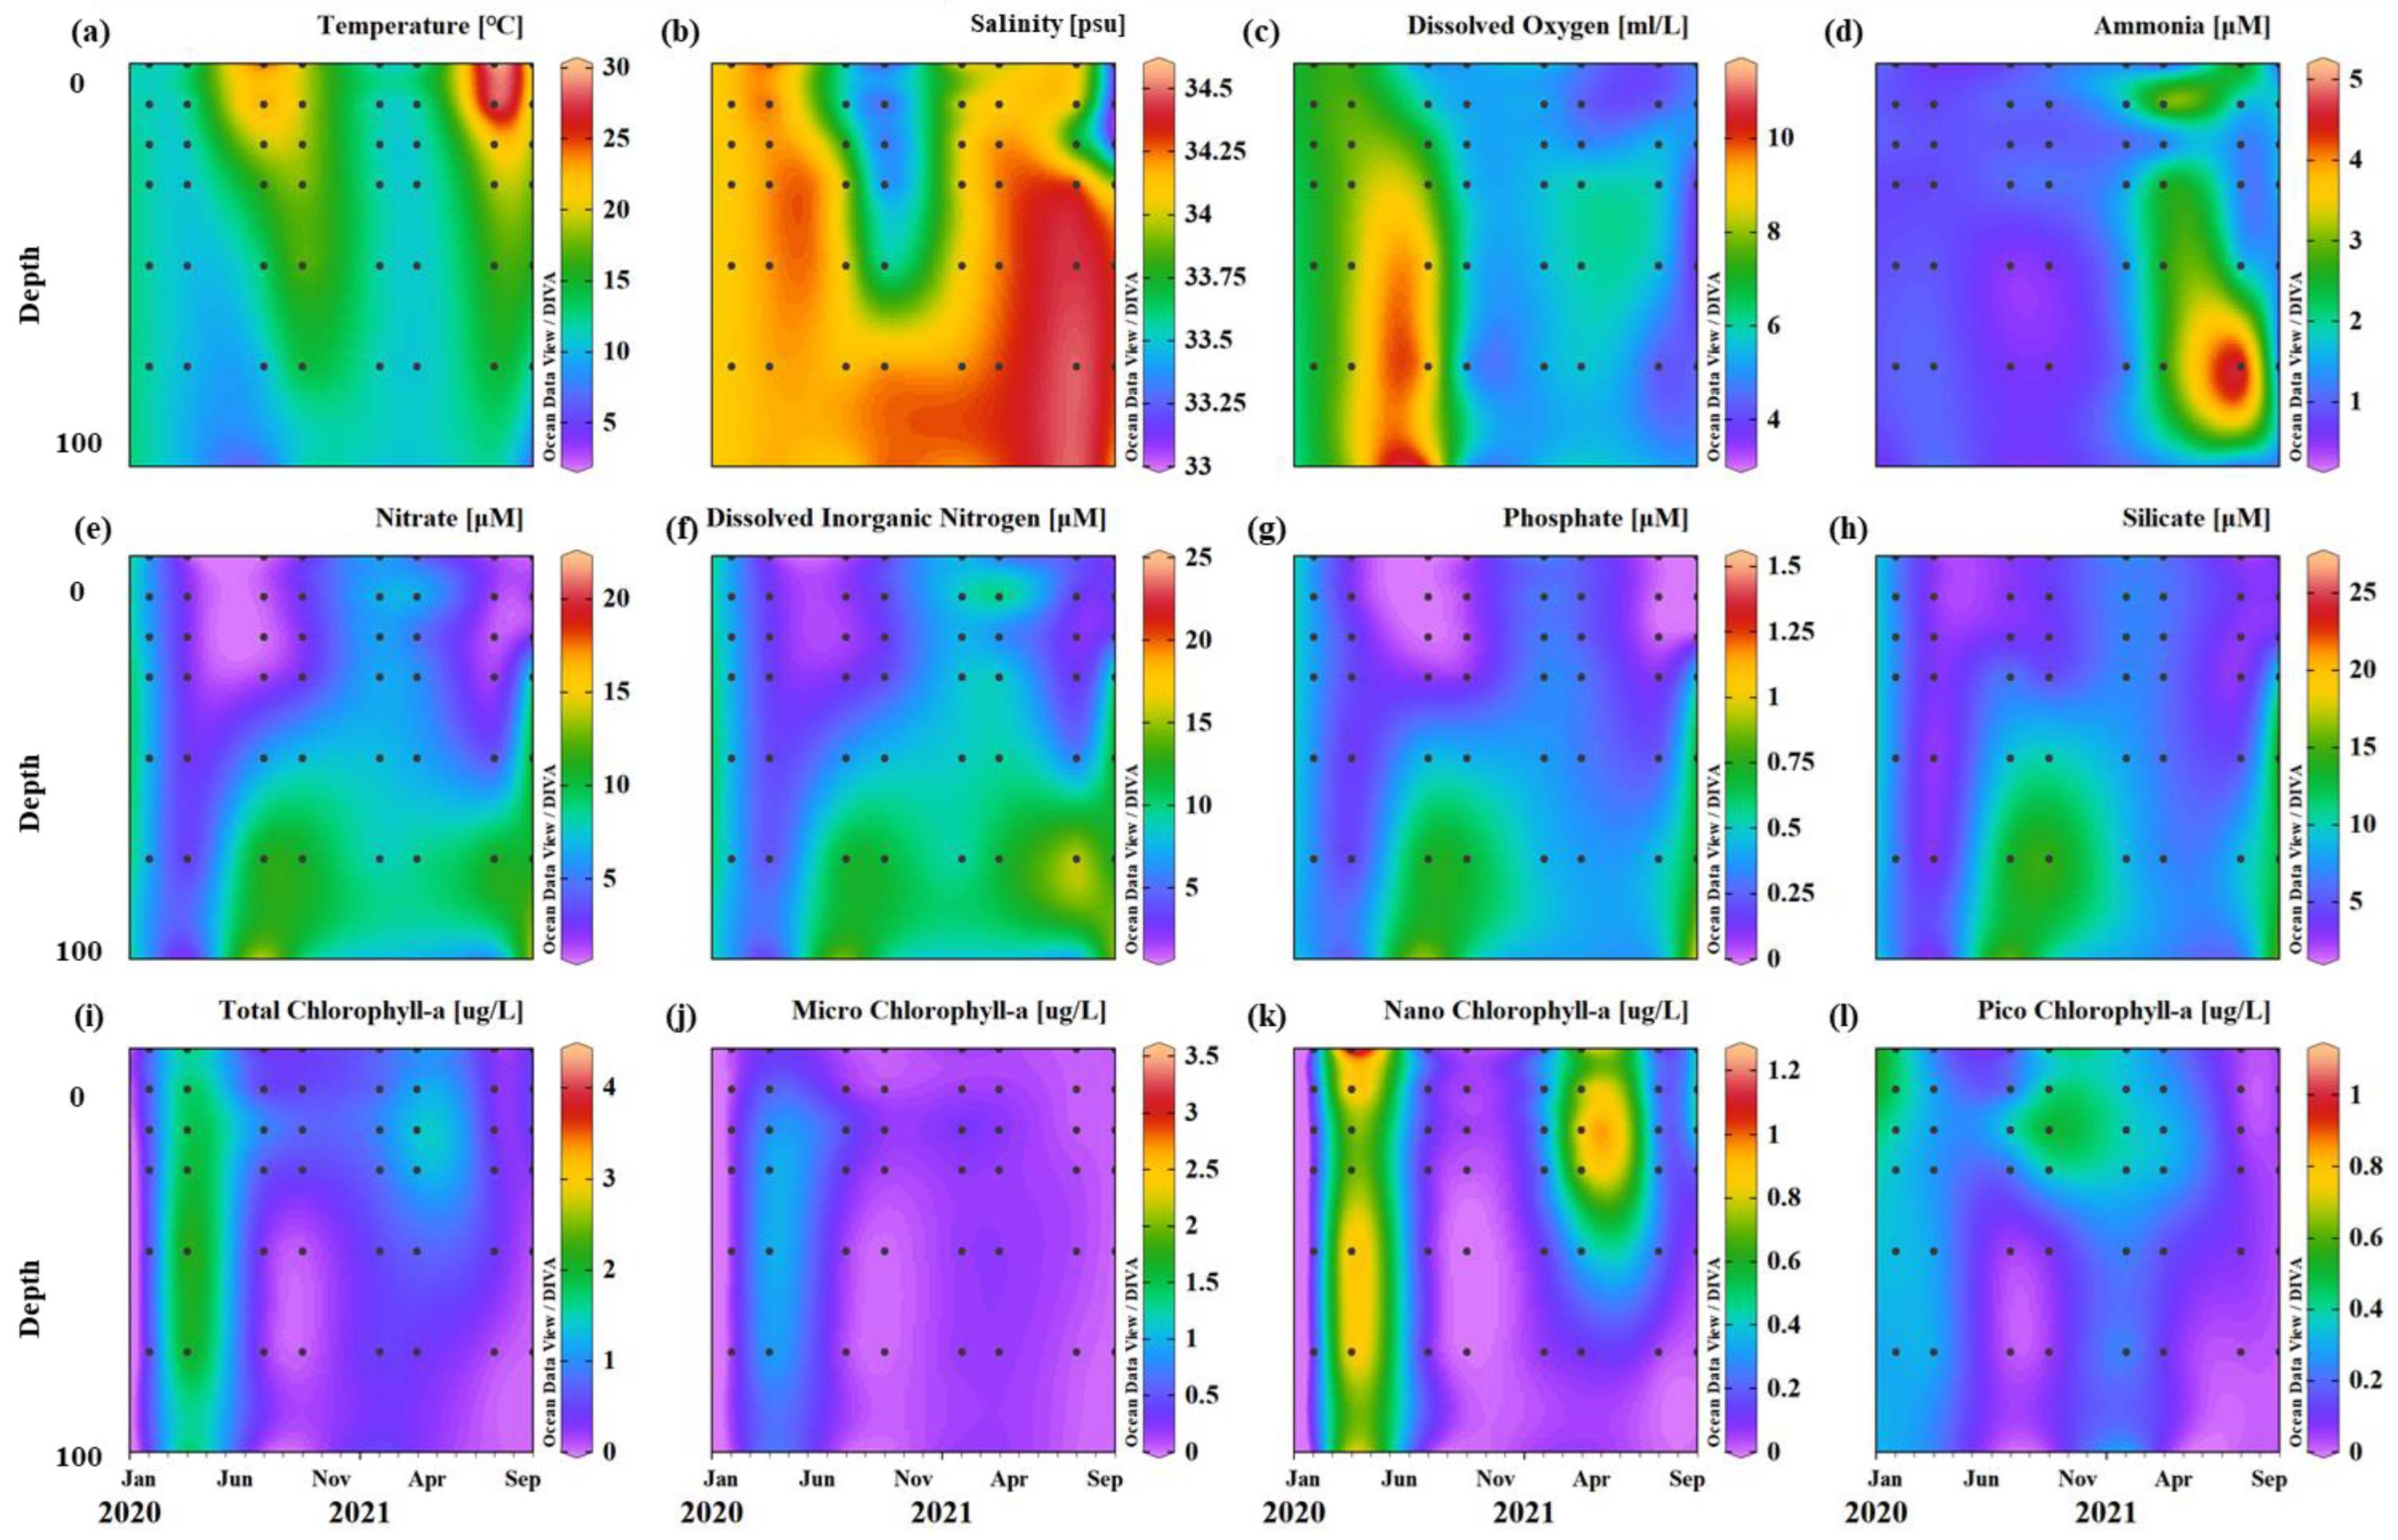
3.1. Environmental Conditions

The surface water temperature ranged from 12.1–23.0 °C at 105-05 and 10.6–30.2 °C at 105-11 (Figure 2 and Figure 3). Both sites showed low water temperatures in winter, i.e., February 2021, and the highest in summer, i.e., August 2020 and August 2021. However, salinity showed constant values in the range of 33.1–34.5 psu at 105-05, and 33.1–34.2 psu at 105-11, and a slight decline in August 2021. The water temperature and salinity data represent the stratification status of the study area according to the sampling seasons. At the 105-05 site, strong stratification occurred during and after the summer in August 2020, October 2020, and August 2021. During these seasons, a thermocline layer was formed at a depth of approximately 30 m, and in February and April 2021, the thermocline layer deepened to nearly 50 m.
The seasonal fluctuation in dissolved inorganic nutrient concentrations was slightly different between the sampling sites (Figure 2 and Figure 3). In the section within 100 m, nutrient variability in the coastal region at site 105-05 was more pronounced than in the offshore at site 105-11. In October 2020, the section where the nutrient content decreased sharply from 12.8 to 5.3 µM was formed around 40 m, whereas in February, the section where the nutrient dropped from 17.4 to 9.3 µM was formed around 60 m. However, DIN concentration measured at site 105-11 maintained a relatively low concentration between 2.7–11.7 µM in October 2020 and 7.6–9.1 µM in February 2021.
During the sampling period, depth-integrated total chlorophyll-a concentrations within 50 m in 105-05 peaked in February and August 2021 (141.9 mg m−2 and 73.5 mg m−2) (Figure 4). In particular, the chlorophyll-a concentrations of micro-size phytoplankton in February and August 2021 accounted for the dominant part of total chlorophyll-a concentrations, i.e., 114.3 and 56.8 mg m−2, contributing to 80.6 and 77.2% of total 141.9 and 73.5 mg m−2, respectively. Moreover, at 105-05, the chlorophyll-a concentrations of nano-size phytoplankton, 3–20 µM, were the highest in April 2021 (21.7 mg m−2, 66.8%), and those of the pico-size sample were the highest in August 2020 and October 2020 (20.4 and 23.2 mg m−2 contributing to 60.6 and 75.0%, respectively). In contrast, the total chlorophyll-a concentrations at 105-11 peaked in April 2021 at 79.6 mg m−2 during the study period. Micro-sized chlorophyll-a was maintained at a low concentration of less than 18.0 mg m−2 throughout the year, except for April 2021. Nano-size chlorophyll-a showed the highest concentrations in April 2021 (51.1 mg m−2, 64.2%), and pico-size chlorophyll-a showed the highest concentrations in October 2020 and February 2021 (21.6 and 23.8 mg m−2 contributing to 72.2 and 48.6%, respectively).

3.2. Spatiotemporal Isotope Fluctuations in Zooplankton Taxa

Spatiotemporal variations in δ13C and δ15N values of zooplankton are shown in Figure 5 and Table S1. The δ13C and δ15N values of zooplankton collected at 105-05 ranged from −23.6 to −17.9‰ and 2.6 to 10.9‰, respectively. The average δ13C values of zooplankton at 105-05 were significantly different, with the highest value of −19.2‰ in August 2021, followed by −20.3‰ in February 2021 (one-way ANOVA, p < 0.01). Furthermore, the average δ15N of zooplankton showed significant differences among the seasons (one-way ANOVA, p < 0.01), with the highest value of 7.8‰ in February 2021. However, the δ13C (−22.6 to −18.9‰) and δ15N (4.7 to 9.8‰) values of zooplankton at 105-11 were not significantly different among seasons.
The absolute value of the isotope ratio and the difference in δ13C values among the zooplankton taxa showed seasonal characteristics. At site 105-05, δ13C values were considerably different among zooplankton taxa in February 2021, April 2021, and August 2021. δ13C values of zooplankton taxa ranged from −22.6 to −20.8‰ and from −23.6 to −22.2‰ in August 2020 and October 2020, respectively, with little difference among taxa. However, a significant difference occurred in April 2021 (−22.9 to −20.3‰, one-way ANOVA, p < 0.05), and the largest difference occurred in February 2021 (−22.4 to −17.9‰, one-way ANOVA, p < 0.01). At 105-11, however, δ13C values among zooplankton taxa were significantly different for all seasons except April 2021, when there were not enough comparable samples.
At 105-05, a significant difference in δ15N values among zooplankton occurred from August 2020 to April 2021 (one-way ANOVA, p < 0.05). In addition, among the zooplankton taxa collected from both study sites, Chaetognatha showed the highest δ15N values, followed by Euchaetidae. The δ15N value of Chaetognatha showed the highest value of 10.2‰ in February 2021 and the lowest value of 7.3‰ in August 2020. Similarly, Euchaetidae and Euphausiid also showed the highest δ15N values in February 2021 (8.4 and 7.9‰, respectively) and the lowest values in August 2020 (5.6 and 5.0‰, respectively). Amphipods showed the highest value of 6.8‰ in August 2021, which is different from other taxa. However, at 105-11, there was no difference in the δ15N values of zooplankton based on season.

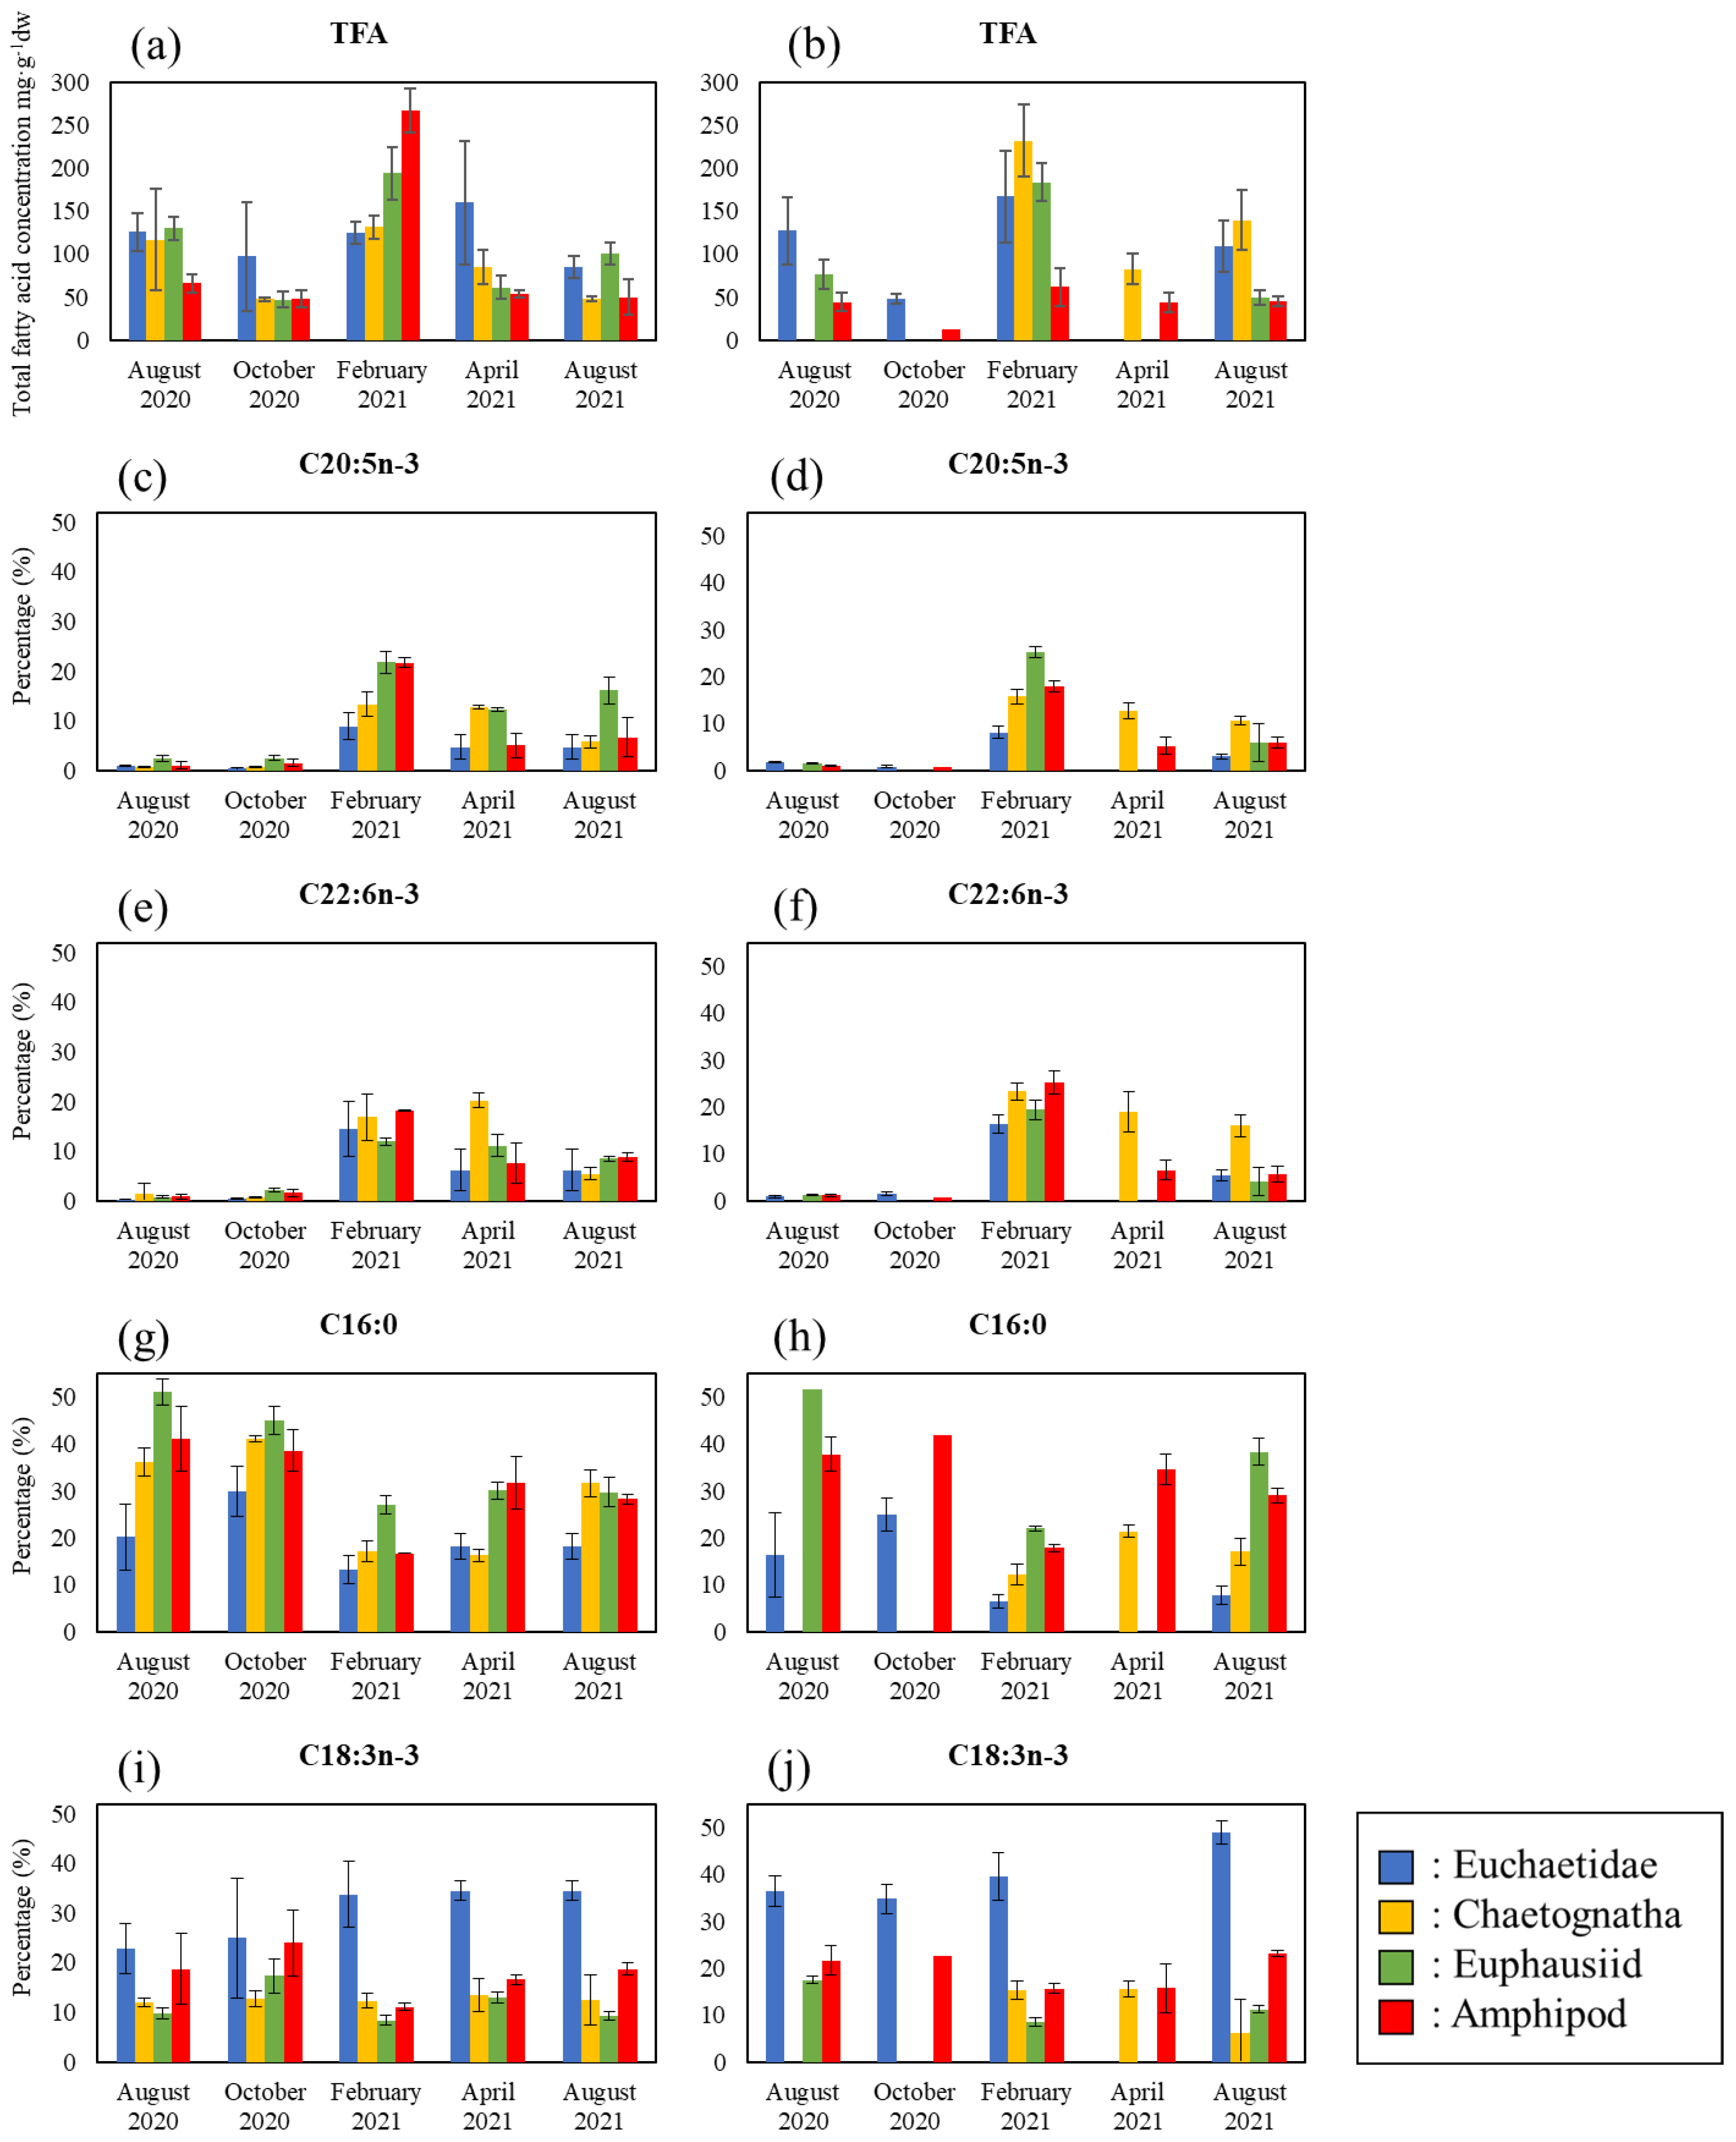
3.3. Changes in Total Fatty Acid Concentrations and the Proportion of Major Fatty Acids in Zooplankton Taxa

The total amount of FAs per unit dry weight of zooplankton showed seasonal variability (one-way ANOVA, p < 0.01) (Figure 6, Tabls S2–S5). The highest concentration of average total FA in both study sites showed in February 2021 (105-05: 179.5 mg g−1 dw; 105-11: 161.2 mg g−1 dw) compared to other sampling times.
Four FAs, C16:0, C18:3(n-3), C20:5(n-3), and C22:6(n-3), 63% of total FAs, were chosen based on SIMPER analysis, allowing the selection of FAs that contributed the most distinctive seasonal variation at both 105-05 and 105-11. Among these FAs, C16:0 accounted for the highest proportion in the zooplankton body, averaging 29.1 and 25.3% at 105-05 and 105-11, respectively. C18:3(n-3) was the second most abundant compound, with 18.0 and 22.2% at 105-05 and 105-11, respectively. C16:0 and C18:3(n-3) did not exhibit any significant seasonal variability. However, C20:5(n-3) and C22:6(n-3) showed seasonal variation. At both sampling sites, the proportion of C20:5 (n-3) and C22:6 (n-3) was the highest at 15.4 and 16.4%, respectively, in February 2021. In August and October 2020, these two FAs were less than 1.5 and 1.2%, respectively. Moreover, the seasonal trends in C20:5(n-3) and C22:6(n-3) were similar in all zooplankton taxa (one-way ANOVA, p < 0.01).

3.4. Estimating Changes in the Ecological Niche of Zooplankton

NMDS was performed using the variables of stable isotope ratios and FA compositions of the dominant zooplankton species to determine variations in the ecological niche of zooplankton taxa based on phytoplankton productivity (Figure 7). Productivity was categorized as high primary productivity (chlorophyll-a concentrations > 50 mg m−2) in February 2021 and August 2021 at 105-05 and April 2021 at 105-11, and low (chlorophyll-a concentrations < 50 mg m−2) in August 2020, October 2020, and April 2021 at 105-05 and August 2020, October 2020, February 2021, and August 2021 at 105-11. The dissimilarity of zooplankton taxa during low and high productivity periods was 37.8 and 51.6%, respectively, suggesting a high dissimilarity of zooplankton in the high production period rather than the low production period. The dissimilarity between Euchaetidae and Euphausiid was as high as 68.0% during the high-production period compared to 42.6% during the low-production period. In addition, the dissimilarity between Euphausiid and Amphipod during the high production period was 34.4%, which was large relative to 29.7% in the low production period.

4. Discussion

In predicting changes in ecosystem structure according to environmental changes, understanding the organisms that have connectivity in feeding relationships is the most basic and important topic. In trophic relationships, changes in diet organisms affect consumers, and changes in primary production caused by physicochemical factors such as light, water temperature, and nutrients affect the trophic relationship that follows.
In this study, the increase in total chlorophyll-a and micro-size chlorophyll-a concentrations observed in February 2021 also signifies the proliferation of primary producers in February, possibly regarded as winter, rather than other times in the East Sea and can be explained by the reinforcement of vertical mixing in terms of salinity and temperature. Vertical mixing has been reported in the East Sea, and many studies have measured seasonal phytoplankton blooms in the study area [31,32]. The effects of vertical mixing on the stable isotope ratios of zooplankton have been reported frequently in other regions. For instance, the stable isotope ratio of zooplankton in the Red Sea is related to upwelling-induced diatom bloom [33]. In this study, total chlorophyll-a concentrations and the proportion of micro-sized chlorophyll-a at 105-05 increased with the depth of the mixing layer in February 2021. Simultaneously, the overall δ15N of the zooplankton showed the highest value of 7.8‰. The isotopic values of nitrogen reflect these sources. For example, vertical mixing in the Red Sea supplies 15N-enriched NO32− to the euphotic layer, and the actively growing diatom mainly uptakes 15N-enriched NO32− rather than other N sources, e.g., NH4+, transferred to zooplankton through trophic transfer and thus shows a heavier δ15N value in zooplankton [34]. In addition, in the Gulf of Riga and the Baltic Sea, the δ15N value of suspended particulate matter (SPM) increased by 3.9‰ after phytoplankton bloom compared to pre-bloom under the N recycling of already assimilated N pool [35]. Likewise, seston isotope ratios in the Yellow Sea showed that N sources exported to bottom water during summer and autumn are transported to the euphotic layer through intense vertical mixing in winter and transferred to the local basal food web [36]. Thus, the results of chlorophyll-a concentrations and isotopic ratios of N indicate the supply of regenerated N sources through vertical mixing in February 2021. However, we did not measure bulk isotope ratios or the C:N ratio from particulate organic matter (POM) data. In addition, N sources supplied through vertical mixing imprint the enriched δ15N signals in SPM and phytoplankton and are likely to be transferred into zooplankton within the local food web by recycling in the water column [37]. The δ13C values of zooplankton at 105-05 increased sharply in February 2021 and August 2021. The 13C-enrichment of zooplankton tissue in February 2021 could be due to high primary production caused by intense vertical mixing in winter, similar to the 15N-enrichment. At 105-05, the δ13C value of zooplankton rapidly increased as the proportion of micro-sized phytoplankton increased (February 2021, August 2021). The effect of phytoplankton community changes on isotope variables in consumers has been reported in other studies in which the δ13C of POM under low temperature and high nutrition environments (i.e., upwelling regions) becomes higher when micro-sized phytoplankton (such as diatoms) are dominant over nano- and pico-sized phytoplankton [1,2]. In the Gulf of Riga and the Baltic Sea, 15N and 13C enrichment occurred as the populations of diatoms, dinoflagellates, and the ciliate Mesodinium rubrum increased [35]. Several studies have suggested that δ13C values in rapidly growing diatoms can be increased through changes in the C source and metabolic processes [38,39,40,41]. In addition, there is a difference in δ13C values of phytoplankton-derived POM in regions with and without seasonal upwelling on the western Indian shelf, showing that rapidly growing micro-sized phytoplankton were higher in upwelling regions, with relatively low temperatures and high nutrition conditions. In contrast, at other study sites where nano- and pico-sized phytoplankton having slow growth rates were dominant, the δ13C value was approximately 3‰ lower than that of upwelling area with large-sized phytoplankton, i.e., diatom [42]. These results indicate that contrasting biogeochemical conditions influenced by phytoplankton communities and growth rates show that the basial diet source produced by vertical mixing is conveyed to the zooplankton community with the accumulation of the imprint of 13C enrichment.
As expected, (e.g., consumer δ15N increase per trophic level [22]), carnivorous Chaetognatha showed the highest δ15N value (7.1–10.9‰) throughout the sampling periods over amphipods (complex feeder from detritivorous, carnivorous to herbivorous properties, varied on species specificity) (Figure 5). Moreover, the δ15N variation pattern in all four zooplankton was dependent on seasonality, particularly at 105-05, but weakly at 105-11. In the context of δ13C variability, in contrast to our expectation, consumer δ13C variables become comparable if they shared basal resources [19,24,43], and the isotope variables were different among dominant zooplankton at specific times in February 2021, April 2021, and August 2021. Consistent with other studies [3,4,5], this study supports the view that the diversity of prey in local habitats is one of the main factors influencing temporally variable isotope values of zooplankton.
The results of the SIMPER analysis showed that the FAs best classified among the zooplankton taxa of 105-05 and 105-11 were C16:0, C18:3(n-3), C20:5(n-3), C22:6(n-3), C16:3(n-3), C18:1(n-9), and C14:0. In particular, the ratio of the biological indicators of diatoms (e.g., EPA) and dinoflagellates (e.g., DHA) measured in this study was relatively low during August 2020 and October 2020, called as the highly stratified period. Additionally, during this period, the total FA content of zooplankton and the contribution of phytoplankton were low. Phytoplankton synthesize essential FAs, i.e., EPA and DHA, that consumers cannot produce in vivo and can be delivered through trophic transfer by feeding. Thus, seasonal changes in the composition of FAs in zooplankton are closely related to dietary resources and certain primary producers, such as diatoms and dinoflagellates [44,45,46]. Several possibilities may have led to the determination of quantitative and qualitative changes in the main dietary resources of zooplanktonic FAs. First, as the productivity of phytoplankton decreases owing to the physicochemical conditions of the ocean, the diet consumption of zooplankton decreases, and accordingly, fewer FAs might be stored in their tissue [47]. In addition, several studies have reported that high temperatures sustained during August and October 2020 cause heat stress to zooplankton and weaken lipid storage efficiency [48,49]. Furthermore, high temperatures reduce the total FA concentration and change the relative abundance of each FA synthesized by phytoplankton [50,51,52]. As shown in Figure 2, Figure 3 and Figure 4, an increase in pico-size phytoplankton ratio in August 2020 and October 2020 causes much less efficiency in the direct grazing of zooplankton in our study and a decrease in FA assimilation. These results suggest that the nutritional quality and ecological characteristics of intermediate species in the pelagic food web depend on the physicochemical aspects of the ocean, such as temperature and nutrient concentration, as reported in previous studies. As a result, the low total FA content and C20:5(n-3) and C22:6(n-3) abundances of zooplankton during the high-temperature period in this study suggested that zooplankton might take up little essential FAs and energy from diatoms and dinoflagellates under low productive conditions.
The typical seasonal isotopic variability of zooplankton taxa observed in this study supports the idea that they reflect information on taxonomic characteristics and environmental impacts in their tissue. In 105-05, δ13C and δ15N values of zooplankton taxa showed seasonal variability (Figure 5). During August and October 2020, the four zooplankton taxa showed relatively similar isotope ratios compared with other seasons, and after Feb 2021, the zooplankton showed a larger range of isotope ratios among taxa. In addition, the isotope ratios of zooplankton showed discrepancies according to the study sites. In 105-05, δ15N was the lowest in Amphipods, but in 105-11, Euphausiid had the highest δ15N value among species. Despite the spatiotemporal variation of δ15N of zooplanktonic taxa, Chaetognatha had the heaviest δ15N value for all sites and seasons.
The difference in δ13C values between the zooplankton taxa was evident in February 2021 and August 2021. During this period, the δ13C of Euphausiid was higher than that of other zooplankton. In contrast, Euchaetidae had relatively low δ13C values. In 105-05, the seasonal variation in the carbon stable isotope ratio of zooplankton was significant, whereas, in 105-11, a relatively consistent isotope trend was observed. Although we found a spatiotemporal trend in zooplankton isotope ratios, we could not establish a complete spatiotemporal dataset because of the low zooplankton density during the study period. We confirmed that the environmental heterogeneity and characteristics of taxa were reflected in zooplankton tissues. Unfortunately, we were unable to collect some taxa, causing difficulty in understanding the overall trophic structure variation, but we inferred that more diverse results could be obtained if additional datasets were collected in the future.
NMDS analysis using the stable isotope ratio and FA proportion revealed a clear separation among zooplankton taxa in the productive season, and the stress value was less than 0.2 (Figure 7). The stress value refers to the degree to which a given dataset is suitable for visualization within an acceptable level of distortion. When the stress value is 0.2 or more, there is possibility to produce a plot that is not suitable for interpretation. In general, when consumers have more diet options with plenty of diet sources, differences in isotope ratios between consumers might be broad, as individuals opportunistically switch their diets [19,53,54]. However, in the less-productive period, zooplankton groups overlapped relative to the productive period. This might be due to limited diets during the less productive period, and thus, the range of δ13C and δ15N values for consumers might be narrowly distributed under harsh environmental conditions. Henschke et al. [18] and Kozak et al. [19] confirmed ecological niche separation by analyzing the δ13C and δ15N of zooplankton communities inhabiting water masses with high nutrient conditions. In addition, previous research on the west coast of Vancouver Island showed that NMDS clustering using the FA compositions of zooplankton indicated a distinct pattern in the functional groups of zooplankton during the post-bloom period from the pre-bloom period, i.e., spread vs. overlapped [5]. Ultimately, it can be applied to effectively describe the interspecific competition among zooplankton taxa according to the magnitude of primary production (e.g., Schoo et al. [20]). To understand the impact of climate change on micro-ecosystems in the East Sea, long-term monitoring of zooplankton trophic dynamics with stable isotope and FA analyses is necessary.

5. Conclusions

In this study, we confirmed that the stable isotopes and FA compositions of zooplankton directly reflect changes in the phytoplankton biomass in the East Sea. An increase in pico-size chlorophyll-a proportion relative to micro-size chlorophyll-a caused the communities of zooplankton taxa to overlap among zooplankton in August 2020 and October 2020, indicating relatively simplified options of diet choice in habitat environment for zooplankton that might suffer from diet limitations in the East Sea during the low-productivity season. On the other hand, during the highly productive seasons, each zooplankton group was well segregated because of the diversification of diet caused by the proliferation of primary producers during February 2021. This result indicates that the dietary intake of zooplankton can be reduced (restricted) owing to species succession to small-sized phytoplankton. This has important implications for predicting the impact of climate change on micro-ecosystems in the East Sea. In the future, long-term monitoring of the trophic dynamics of zooplankton is required to understand the disturbances in micro-ecosystems caused by climate change in the East Sea.

Supplementary Materials

The following supporting information can be downloaded at: https://www.mdpi.com/article/10.3390/jmse10111768/s1, Table S1, Carbon (δ13C) and nitrogen (δ15N) stable isotope ratios of zooplankton taxa among four seasons in the East Sea, Korea; Table S2, Spatiotemporal fatty acid percent composition of zooplankton taxa (Euc: Euchaetidae, Cha: Chaetognatha, Eup: Euphausiid, and Amp: Amphipod) in coastal region (105-05) of the East Sea; Table S3, Spatiotemporal fatty acid percent composition of zooplankton taxa (Euc: Euchaetidae, Cha: Chaetognatha, Eup: Euphausiid, and Amp: Amphipod) in offshore region (105-11) of the East Sea; Table S4, Seasonal total fatty acid concentrations (mg g−1 dw) in Zooplankton Taxa in coastal regions (105-05) in the East Sea; Table S5, Seasonal total fatty acid concentrations (mg g−1 dw) in zooplankton taxa in offshore regions (105-11) in the East Sea.

Author Contributions

Conceptualization, J.K., H.C. and K.-H.S.; methodology, J.K.; software, J.K.; validation, J.K., H.-Y.Y., E.-J.W. and H.C.; formal analysis, J.K.; investigation, J.K.; resources, S.-H.Y.; data curation, J.K. and H.C.; writing—original draft preparation, J.K. and H.C.; writing—review and editing, J.K., H.-Y.Y., E.-J.W., H.C. and K.-H.S.; visualization, J.K.; supervision, K.-H.S.; project administration; K.-H.S. and S.-H.Y.; funding acquisition; K.-H.S. All authors have read and agreed to the published version of the manuscript.

Funding

This research was supported by the National Institute of Fisheries Science (NIFS), Korea (Analysis of the species composition and structure of the marine food web, No. R2022073).

Institutional Review Board Statement

Not applicable.

Informed Consent Statement

Not applicable.

Data Availability Statement

All data supporting the results of this study are provided in this manuscript and Supplementary Information File (https://www.mdpi.com/article/10.3390/jmse10111768/s1).

Acknowledgments

This work was supported by the National Institute of Fisheries Science (NIFS) grant (‘Analysis of the species composition and structure of the marine food web’; R2022073) funded by the ministry of oceans and fisheries, republic of Korea. Also, this research is supported by the National Research Foundation of Korea (NRF) grants funded by the Ministry of Science and ICT (MSIT) (2022M3I6A1085992). We would like to thank the NIFS researchers and the captain and crew for their assistance with the sampling.

Conflicts of Interest

The authors declare no conflict of interest.

References

  1. Lomartire, S.; Marques, J.C.; Gonçalves, A.M. The key role of zooplankton in ecosystem services: A perspective of interaction between zooplankton and fish recruitment. Ecol. Indic. 2021, 129, 107867. [Google Scholar] [CrossRef]
  2. Sterner, R. Role of zooplankton in aquatic ecosystems. In Encyclopedia of Inland Waters; Elsevier Inc.: Amsterdam, The Netherlands, 2009; pp. 678–688. [Google Scholar] [CrossRef]
  3. Winder, M.; Jassby, A.D. Shifts in Zooplankton Community Structure: Implications for Food Web Processes in the Upper San Francisco Estuary. Estuaries Coasts 2011, 34, 675–690. [Google Scholar] [CrossRef] [Green Version]
  4. Choi, H.; Ha, S.-Y.; Lee, S.; Kim, J.-H.; Shin, K.-H. Trophic dynamics of zooplankton before and after polar night in the Kongsfjorden (Svalbard): Evidence of trophic position estimated by δ15N analysis of amino acids. Front. Mar. Sci. 2020, 7, 489. [Google Scholar] [CrossRef]
  5. Stevens, C.; Sahota, R.; Galbraith, M.; Venello, T.; Bazinet, A.; Hennekes, M.; Yongblah, K.; Juniper, S. Total lipid and fatty acid composition of mesozooplankton functional group members in the NE Pacific over a range of productivity regimes. Mar. Ecol. Prog. Ser. 2022, 687, 43–64. [Google Scholar] [CrossRef]
  6. Athira, T.R.; Nefla, A.; Shifa, C.T.; Shamna, H.; Aarif, K.M.; Almaarofi, S.S.; Rashiba, A.P.; Reshi, O.R.; Jobiraj, T.; Thejass, P.; et al. The impact of long-term environmental change on zooplankton along the southwestern coast of India. Environ. Monit. Assess. 2022, 194, 316. [Google Scholar] [CrossRef]
  7. Richardson, A.J. In hot water: Zooplankton and climate change. ICES J. Mar. Sci. 2008, 65, 279–295. [Google Scholar] [CrossRef] [Green Version]
  8. Gao, X.; Chen, H.; Govaert, L.; Wang, W.; Yang, J. Responses of zooplankton body size and community trophic structure to temperature change in a subtropical reservoir. Ecol. Evol. 2019, 9, 12544–12555. [Google Scholar] [CrossRef]
  9. Joo, H.; Son, S.; Park, J.-W.; Kang, J.J.; Jeong, J.-Y.; Kwon, J.-I.; Kang, C.-K.; Lee, S.H. Small phytoplankton contribution to the total primary production in the highly productive Ulleung Basin in the East/Japan Sea. Deep. Sea Res. Part II Top. Stud. Oceanogr. 2017, 143, 54–61. [Google Scholar] [CrossRef]
  10. Kang, J.J.; Jang, H.K.; Lim, J.-H.; Lee, D.; Lee, J.H.; Bae, H.; Lee, C.H.; Kang, C.-K.; Lee, S.H. Characteristics of Different Size Phytoplankton for Primary Production and Biochemical Compositions in the Western East/Japan Sea. Front. Microbiol. 2020, 11, 560102. [Google Scholar] [CrossRef]
  11. Winder, M.; Sommer, U. Phytoplankton response to a changing climate. Hydrobiologia 2012, 698, 5–16. [Google Scholar] [CrossRef]
  12. Han, I.-S.; Lee, J.-S. Change the annual amplitude of sea surface temperature due to climate change in a recent decade around the Korean Peninsula. J. Korean Soc. Mar. Environ. Saf. 2020, 26, 233–241. [Google Scholar] [CrossRef]
  13. Chang, K.-I.; Zhang, C.-I.; Park, C.; Kang, D.-J.; Ju, S.-J.; Lee, S.-H.; Wimbush, M. (Eds.) Oceanography of the East Sea (Japan Sea), 1st ed.; Springer International Publishing: Cham, Switzerland, 2016. [Google Scholar] [CrossRef]
  14. Marañón, E.; Cermeño, P.; Latasa, M.; Tadonléké, R.D. Temperature, resources, and phytoplankton size structure in the ocean. Limnol. Oceanogr. 2012, 57, 1266–1278. [Google Scholar] [CrossRef]
  15. Ashjian, C.J.; Davis, C.S.; Gallager, S.M.; Alatalo, P. Characterization of the zooplankton community, size composition, and distribution in relation to hydrography in the Japan/East Sea. Deep. Sea Res. Part II Top. Stud. Oceanogr. 2005, 52, 1363–1392. [Google Scholar] [CrossRef]
  16. Lee, B.R.; Park, W.; Kang, H.K.; Lee, H.W.; Ji, H.S.; Choi, J.H. Comparison of zooplankton communities in the East Sea, East China Sea and Philippine Sea. J. Environ. Biol. 2019, 40, 861–870. [Google Scholar] [CrossRef]
  17. Lee, H.; Choi, J.; Im, Y.; Oh, W.; Hwang, K.; Lee, K. Spatial–Temporal Distribution of the Euphausiid Euphausia pacifica and Fish Schools in the Coastal Southwestern East Sea. Water 2022, 14, 203. [Google Scholar] [CrossRef]
  18. Henschke, N.; Everett, J.D.; Suthers, I.M.; Smith, J.A.; Hunt, B.P.V.; Doblin, M.A.; Taylor, M.D. Zooplankton trophic niches respond to different water types of the western Tasman Sea: A stable isotope analysis. Deep. Sea Res. Part I Oceanogr. Res. Pap. 2015, 104, 1–8. [Google Scholar] [CrossRef]
  19. Kozak, E.R.; Franco-Gordo, C.; Godínez-Domínguez, E.; Suárez-Morales, E.; Ambriz-Arreola, I. Seasonal variability of stable isotope values and niche size in tropical calanoid copepods and zooplankton size fractions. Mar. Biol. 2020, 167, 37. [Google Scholar] [CrossRef]
  20. Schoo, K.L.; Boersma, M.; Malzahn, A.M.; Löder, M.G.J.; Wiltshire, K.H.; Aberle, N. Dietary and seasonal variability in trophic relations at the base of the North Sea pelagic food web revealed by stable isotope and fatty acid analysis. J. Sea Res. 2018, 141, 61–70. [Google Scholar] [CrossRef]
  21. Post, D.M. Using stable isotopes to estimate trophic position: Models, methods, and assumptions. Ecology 2002, 83, 703–718. [Google Scholar] [CrossRef]
  22. Vander Zanden, M.J.; Rasmussen, J.B. Variation in δ15N and δ13C trophic fractionation: Implications for aquatic food web studies. Limnol. Oceanogr. 2001, 46, 2061–2066. [Google Scholar] [CrossRef]
  23. Ahn, I.-Y.; Elias-Piera, F.; Ha, S.-Y.; Rossi, S.; Kim, D.-U. Seasonal Dietary Shifts of the Gammarid Amphipod Gondogeneia antarctica in a Rapidly Warming Fjord of the West Antarctic Peninsula. J. Mar. Sci. Eng. 2021, 9, 1447. [Google Scholar] [CrossRef]
  24. Ke, Z.; Li, R.; Chen, D.; Zhao, C.; Tan, Y. Spatial and seasonal variations in the stable isotope values and trophic positions of dominant zooplankton groups in Jiaozhou Bay, China. Front. Mar. Sci. 2022, 9, 968. [Google Scholar] [CrossRef]
  25. El-Sabaawi, R.; Dower, J.F.; Kainz, M.; Mazumder, A. Characterizing dietary variability and trophic positions of coastal calanoid copepods: Insight from stable isotopes and fatty acids. Mar. Biol. 2009, 156, 225–237. [Google Scholar] [CrossRef]
  26. Choi, H.; Won, H.; Kim, J.H.; Yang, E.J.; Cho, K.H.; Lee, Y.; Kang, S.H.; Shin, K.H. Trophic Dynamics of Calanus hyperboreus in the Pacific Arctic Ocean. J. Geophys. Res. Ocean. 2021, 126, e2020JC017063. [Google Scholar] [CrossRef]
  27. Hiltunen, M.; Strandberg, U.; Brett, M.T.; Winans, A.K.; Beauchamp, D.A.; Kotila, M.; Keister, J.E. Taxonomic, Temporal, and Spatial Variations in Zooplankton Fatty Acid Composition in Puget Sound, WA, USA. Estuaries Coasts 2022, 45, 567–581. [Google Scholar] [CrossRef]
  28. Parson, T.R.; Maita, Y.; Lalli, C.M. A Manual of Biological and Chemical Methods for Seawater Analysis; Pergamon Press: Oxford, UK, 1984. [Google Scholar]
  29. Folch, J.; Lees, M.; Sloane Stanley, G.H. A simple method for the isolation and purification of total lipids from animal tissues. J. Biol. Chem. 1957, 226, 497–509. [Google Scholar] [CrossRef]
  30. Hammer, Ø.; Harper, D.A.T.; Ryan, P.D. PAST-palaeontological statistics, ver. 1.89. Palaeontol. Electron 2001, 4, 1–9. [Google Scholar]
  31. Kim, H.-C.; Yoo, S.; Oh, I.S. Relationship between phytoplankton bloom and wind stress in the sub-polar frontal area of the Japan/East Sea. J. Mar. Syst. 2007, 67, 205–216. [Google Scholar] [CrossRef]
  32. Lee, M.; Ro, H.; Kim, Y.-B.; Park, C.-H.; Baek, S.-H. Relationship of Spatial Phytoplankton Variability during Spring with Eutrophic Inshore and Oligotrophic Offshore Waters in the East Sea, Including Dokdo, Korea. J. Mar. Sci. Eng. 2021, 9, 1455. [Google Scholar] [CrossRef]
  33. Kürten, B.; Al-Aidaroos, A.M.; Kürten, S.; El-Sherbiny, M.M.; Devassy, R.P.; Struck, U.; Zarokanellos, N.; Jones, B.H.; Hansen, T.; Bruss, G. Carbon and nitrogen stable isotope ratios of pelagic zooplankton elucidate ecohydrographic features in the oligotrophic Red Sea. Prog. Oceanogr. 2016, 140, 69–90. [Google Scholar] [CrossRef] [Green Version]
  34. Domingues, R.B.; Barbosa, A.B.; Sommer, U.; Galvão, H.M. Ammonium, nitrate and phytoplankton interactions in a freshwater tidal estuarine zone: Potential effects of cultural eutrophication. Aquat. Sci. 2011, 73, 331–343. [Google Scholar] [CrossRef]
  35. Tunēns, J.; Aigars, J.; Poikāne, R.; Jurgensone, I.; Labucis, A.; Labuce, A.; Liepiņa-Leimane, I.; Buša, L.; Vīksna, A. Stable Carbon and Nitrogen Isotope Composition in Suspended Particulate Matter Reflects Seasonal Dynamics of Phytoplankton Assemblages in the Gulf of Riga, Baltic Sea. Estuaries Coasts 2022, 45, 2112–2123. [Google Scholar] [CrossRef]
  36. Wu, Z.; Yu, Z.; Song, X.; Wang, W.; Zhou, P.; Cao, X.; Yuan, Y. Key nitrogen biogeochemical processes in the South Yellow Sea revealed by dual stable isotopes of nitrate. Estuar. Coast. Shelf Sci. 2019, 225, 106222. [Google Scholar] [CrossRef]
  37. Bode, A.; Lamas, A.F.; Mompeán, C. Effects of Upwelling Intensity on Nitrogen and Carbon Fluxes through the Planktonic Food Web off A Coruña (Galicia, NW Spain) Assessed with Stable Isotopes. Diversity 2020, 12, 121. [Google Scholar] [CrossRef] [Green Version]
  38. Fry, B.; Wainright, S.C. Diatom sources of 13 C-rich carbon in marine food webs. Mar. Ecol. Prog. Ser. 1991, 76, 149–157. [Google Scholar] [CrossRef]
  39. Bardhan, P.; Karapurkar, S.G.; Shenoy, D.M.; Kurian, S.; Sarkar, A.; Maya, M.V.; Naik, H.; Varik, S.; Naqvi, S.W.A. Carbon and nitrogen isotopic composition of suspended particulate organic matter in Zuari Estuary, west coast of India. J. Mar. Syst. 2015, 141, 90–97. [Google Scholar] [CrossRef]
  40. Perry, R.I.; Thompson, P.A.; Mackas, D.L.; Harrison, P.J.; Yelland, D.R. Stable carbon isotopes as pelagic food web tracers in adjacent shelf and slope regions off British Columbia, Canada. Can. J. Fish. Aquat. Sci. 1999, 56, 2477–2486. [Google Scholar] [CrossRef]
  41. Rau, G.H.; Riebesell, U.; Wolf-Gladrow, D. A model of photosynthetic 13C fractionation by marine phytoplankton based on diffusive molecular CO2 uptake. Mar. Ecol. Prog. Ser. 1996, 133, 275–285. [Google Scholar] [CrossRef] [Green Version]
  42. Silori, S.; Sharma, D.; Chowdhury, M.; Biswas, H.; Bandyopadhyay, D.; Shaik, A.U.R.; Cardinal, D.; Mandeng-Yogo, M.; Narvekar, J. Contrasting phytoplankton and biogeochemical functioning in the eastern Arabian Sea shelf waters recorded by carbon isotopes (SW monsoon). Mar. Chem. 2021, 232, 103962. [Google Scholar] [CrossRef]
  43. Ying, R.; Cao, Y.; Yin, F.; Guo, J.; Huang, J.; Wang, Y.; Zheng, L.; Wang, J.; Liang, H.; Li, Z.; et al. Trophic structure and functional diversity reveal pelagic-benthic coupling dynamic in the coastal ecosystem of Daya Bay, China. Ecol. Indic. 2020, 113, 106241. [Google Scholar] [CrossRef]
  44. Budge, S.M.; Parrish, C.C. Lipid biogeochemistry of plankton, settling matter and sediments in Trinity Bay, Newfoundland. II. Fatty acids. Org. Geochem. 1998, 29, 1547–1559. [Google Scholar] [CrossRef]
  45. Dalsgaard, J.; John, M.S.; Kattner, G.; Muller-Navarra, D.; Hagen, W. Fatty acid trophic markers in the pelagic marine food environment. Adv. Mar. Biol. 2003, 46, 226–340. [Google Scholar] [CrossRef]
  46. El-Sabaawi, R.W.; Sastri, A.R.; Dower, J.F.; Mazumder, A. Deciphering the seasonal cycle of copepod trophic dynamics in the Strait of Georgia, Canada, using stable isotopes and fatty acids. Estuaries Coasts 2010, 33, 738–752. [Google Scholar] [CrossRef]
  47. Lee, R.F.; Hagen, W.; Kattner, G. Lipid storage in marine zooplankton. Mar. Ecol. Prog. Ser. 2006, 307, 273–306. [Google Scholar] [CrossRef]
  48. Sokolova, I.M.; Lannig, G. Interactive effects of metal pollution and temperature on metabolism in aquatic ectotherms: Implications of global climate change. Clim. Res. 2008, 37, 181–201. [Google Scholar] [CrossRef] [Green Version]
  49. Werbrouck, E.; Van Gansbeke, D.; Vanreusel, A.; De Troch, M. Temperature affects the use of storage fatty acids as energy source in a benthic copepod (Platychelipus littoralis, Harpacticoida). PLoS ONE 2016, 11, e0151779. [Google Scholar] [CrossRef] [Green Version]
  50. Jin, P.; Gonzàlez, G.; Agustí, S. Long-term exposure to increasing temperature can offset predicted losses in marine food quality (fatty acids) caused by ocean warming. Evol. Appl. 2020, 13, 2497–2506. [Google Scholar] [CrossRef]
  51. Shin, K.-H.; Hama, T.; Yoshie, N.; Noriki, S.; Tsunogai, S. Dynamics of fatty acids in newly biosynthesized phytoplankton cells and seston during a spring bloom off the west coast of Hokkaido Island, Japan. Mar. Chem. 2000, 70, 243–256. [Google Scholar] [CrossRef]
  52. Shin, K.-H.; Hama, T.; Handa, N. Effect of nutrient conditions on the composition of photosynthetic products in the East China Sea and surrounding waters. Deep. Sea Res. Part II Top. Stud. Oceanogr. 2003, 50, 389–401. [Google Scholar] [CrossRef]
  53. Landry, M.R. Switching between herbivory and carnivory by the planktonic marine copepod Calanus pacificus. Mar. Biol. 1981, 65, 77–82. [Google Scholar] [CrossRef]
  54. López-Ibarra, G.A.; Bode, A.; Hernández-Trujillo, S.; Zetina-Rejón, M.J.; Arreguín-Sánchez, F. Trophic position of twelve dominant pelagic copepods in the eastern tropical Pacific Ocean. J. Mar. Syst. 2018, 187, 13–22. [Google Scholar] [CrossRef]
Figure 1. The sampling locations of the coastal (105-05) and offshore (105-11) regions during August 2020, October 2020, February 2021, April 2021, and August 2021.
Jmse 10 01768 g001
Figure 2. Monthly variation of temperature (a), salinity (b), dissolved oxygen (c), NH4+ concentration (d), NO32− concentration (e), dissolved inorganic N concentration (f), PO43− concentration (g), SiO32− concentration (h), total chlorophyll-a concentration (i), micro chlorophyll-a concentration (j), nano chlorophyll-a concentration (k), and pico chlorophyll-a concentration (l) from 0 to 100 m in site 105-05. The white triangular mark indicates the month in which the zooplankton samples were collected.
Jmse 10 01768 g002
Figure 3. Monthly variation of temperature (a), salinity (b), dissolved oxygen (c), NH4+ concentration (d), NO32− concentration (e), dissolved inorganic N concentration (f), PO43− concentration (g), SiO32− concentration (h), total chlorophyll-a concentration (i), micro chlorophyll-a concentration (j), nano chlorophyll-a concentration (k), and pico chlorophyll-a concentration (l) from 0 to 100 m at site 105-11. The white triangular mark indicates the month in which the zooplankton samples were collected.
Jmse 10 01768 g003
Figure 4. Seasonal variations in different size fractioned chlorophyll-a concentrations at 105-05 (a) and 105-11 (b) sites.
Jmse 10 01768 g004
Figure 5. Spatiotemporal (August 2020: (a,b); October 2020: (c,d); February 2021: (e,f); April 2021: (g,h); August 2021: (i,j) δ13C and δ15N biplots of four zooplankton taxa collected at 105-05 (a,c,e,g,i) and at 105-11 (b,d,f,h,j) sites. Each taxon is depicted with different color (Euchaetidae: blue; Chaetognatha: yellow; Euphausiid: green; Amphipod: red).
Jmse 10 01768 g005
Figure 6. Changes in the total fatty acid (TFA) concentrations (a,b), proportions of C20:5(n-3) (c,d), C22:6(n-3) (e,f), C16:0 (g,h), C18:3(n-3) (i,j) best representing seasonal dissimilarity in 105-05 (a,c,e,g,i) and 105-11 (b,d,f,h,j) based on SIMPER analysis. Each color represents different zooplankton taxa (Blue: Euchaetidae, Yellow: Chaetognatha, Green: Euphausiid, Red: Amphipod).
Jmse 10 01768 g006
Figure 7. NMDS ordination of fatty acids and stable isotopes from four zooplankton taxa (Euchaetidae, Chaetognatha, Euphausiid, and Amphipod) during high productivity period (a) and low productivity period (b). Each color represents the different zooplankton taxa (Blue: Euchaetidae, Yellow: Chaetognatha, Green: Euphausiid, Red: Amphipod). The stress values of each graph were 0.15 and 0.14. Both values are less than 0.2, which indicates that the given data set is suitable for visualization within an acceptable level of distortion.
Jmse 10 01768 g007
Table 1. Information of sampling sites of this study.
RegionStationLatitudeLongitudeSample Collection Depth (m)Bottom Depth (m)Species
East Sea105-0537.55129.38100280Euchaetidae
Chaetognatha
Euphausiid
Amphipod
105-1137.55131.241001140Euchaetidae
Chaetognatha
Euphausiid
Amphipod
Publisher’s Note: MDPI stays neutral with regard to jurisdictional claims in published maps and institutional affiliations.

