1. Introduction
Radionuclides are always present in the environment and provide valuable information regarding the state of marine ecosystems. A lot of effort is given to determine the mobility of radionuclides in seawater in order to study oceanographic processes as well as for radioprotection purposes. Among the different radionuclides,
137Cs is a key tracer to support oceanographic studies due to its steady presence in the ocean.
137Cs is water-soluble, has high mobility and is exchangeable between the different layers in the marine environment [
1]. Moreover,
137Cs has long half-life (approximately 30 y) and it has been extensively studied since it can be easily detected through gamma-ray spectrometry. Its presence corresponds to well-known occurrence sources (i.e., nuclear accidents, weapons tests and operational releases of power plants).
The Chernobyl Nuclear Power Plant (ChNPP) accident resulted in large radioactive releases to the environment. At the end of the 20th century, the
137Cs inventories in the soil, within the Chernobyl zone, reached levels greater than 37 MBq m
−2 [
2]. In addition, radioactive cesium was transported from catchment to downstream as suspended matter and was stored in the river basins. Cesium after its deposition in the soil is transported through the rivers to the sea. According to literature [
3], the
137Cs inventory had been increased at the Black Sea by 6 to 10 times in the surface water layer of the first 50 m due to the large contribution from the Dnieper and Danube rivers (~26 TBq). However, the chemical and mobility processes of radioactive cesium were interpreted since the activity concentration was high enough to study concentration factors between the water masses’ layers [
4]. The total radiocaesium isotope deposits (
137Cs and
134Cs) from the Chernobyl accident has been estimated at about 2400 TBq for the Black Sea, 820 TBq for the Aegean Sea and 600 TB for the Ionian Sea, while 2/3 of these amounts corresponded to
137Cs some months after the accident [
5,
6].
The Aegean Sea constitutes the north-east part of the Mediterranean Sea. It is a basin between the coastlines of west Turkey and east and north Greece and bounded to the south by the island of Crete. It covers approximately an area of 160·10
3 km
2. The northeast is connected with the Sea of Marmara and the Black Sea through the Dardanelles Strait. It exchanges, at the south, water masses with the central part of the Mediterranean Sea through the Cretan passages, and southwest, it is connected to the Ionian Sea through Antikythera Strait, Kythera Strait, and the Strait of Elaphonissos [
7]. At the south-east, the Aegean Sea joins the Levantine Basin. The Aegean Sea is a continuous mixing area with Black Sea Waters (BSW) inflow through the Dardanelles strait and seawater outflows around Lemnos (both at North and South). This circulation is mainly due to the NE Aegean water masses (south of the Dardanelles straits) that are occupied by warm and saline waters influenced by the branch of the Asia Minor current. This branch enters the Aegean Sea from the eastern straits, and it transfers Levantine waters towards northern parts of the Aegean Sea.
The hydrological structure of the basin is controlled by the connection of the Aegean Sea with the Black Sea through the Dardanelles Strait and by interaction with the Ionian Sea and Levantine basins through the Antikythera and Karpathos Straits of the Cretan basin, respectively. The circulation of the Aegean Sea is rather complex, characterized by basin-scale cyclonic flows, sub-basin scale recurrent gyres, and a number of transient eddies creating a dynamic multi-pattern area [
8]. The Dardanelles Strait provides low salinity and temperature water masses (BSW) with a very thin surface layer (~30 m) at the North Aegean, which is moved southwards along the western shores of the sea, following a generally cyclonic (counter-clockwise) circulation [
9]. The intermediate layer of the Sea (down to the level of 400 m) is occupied by Levantine Sea Water (LSW) masses (found mostly at the intermediate level and are named Levantine Intermediate Waters, LIW), which enter the Aegean through the Karpathos Straits of the Cretan basin. These waters along with Cretan Surface Waters (CSW) and Aegean Intermediate Waters (AgIW) are characterized by high salinity and high temperature. Levantine water-masses extend all the way to the surface along the eastern shores of the Central Aegean, where the Black Sea Water surface layer is not present. The deeper part of the basin consists of laterally isolated basins and the evolution of the deep water masses (named Aegean Deep Water, AgDW) are determined solely by vertical turbulent diffusion during stagnation periods [
10]. Moreover, low temperature Transient Mediterranean Water (TMW) masses, which move from the Adriatic and the west part of Ionian Sea, are located well below the seawater surface.
The study of the general circulation of seawater is related to the advection–diffusion processes and the pathways that follow the main water masses. Thus, the tracing of the water masses obtained by the density field is essential for the description of the average general seawater circulation. Mixing processes are favored along equally densed (isopycnal) surfaces than across them. Temperature–salinity diagrams (Τ/S diagrams) are used to identify water masses by plotting the potential temperature versus salinity. Although density remains unchanged, Τ/S characteristics change according to the type of the water masses. However, the distributions of the water characteristics determine mixing processes both along and across isopycnals. The mixing of the different masses may provide changes in the studied marine system, which is mostly related to surface or near-surface waters, created by air–sea interaction processes, or by flow over and through a narrow passage/sill (e.g., the Dardanelles Strait between the Marmara Sea and Aegean Sea). The water masses are traditionally identified using Τ/S diagrams along with isopycnal surfaces. Nevertheless, recent studies have combined
137Cs activity concentration with temperature and salinity data to assess water-mass dynamics, circulation and mixing processes in specific basins of the Aegean Sea [
11,
12,
13]. Moreover, the
137Cs activity concentrations provided evidence for BSW masses’ contribution to the intermediate and deep layers of the Cretan basin [
12]. Therefore, the correlation of
137Cs activity concentration with oceanographic parameters (salinity, temperature), could optimize existing methodologies to identify and validate the origin of the water masses.
The scope of the present work is to study spatially the oceanographic processes in the deep basins of the Aegean Sea using data collected from the same time period, giving an overview of the hydrodynamic regime and the Aegean Sea’s radiological status. To this end, a sampling cruise was carried out covering all the Aegean Sea with the oceanographic vessel “AEGEAON” during winter 2017. Data from seven sampling stations in various depths were collected, including stations (Myrtoan and North Cretan basins) where previous data were obtained [
10,
11].
137Cs activity concentration measurements were performed in collected water samples and the results are combined with corresponding oceanographic parameters (salinity, temperature) obtained with the in-situ method. The motivation of the present work was to study the oceanographic processes in the deep basins of the Aegean Sea optimizing methodological tools for water masses’ identification and mixing processes. In more detail, an attempt is made to identify the main water masses in the Aegean Sea plotting the
137Cs activity concentration against the potential temperature and salinity. The idea of the proposed parameter was based in the known physical properties of the different water masses of the Aegean Sea (e.g., BSW exhibit lower salinity and temperature values compared to LIW, AgIW and TMW). The combination of
137Cs activity concentration with temperature and salinity is tested to better identify the main water masses of the Aegean Sea (BSW, LIW, CSW, TMW and AeDW). Furthermore, the utilization of
137Cs as a tracer is tested to study the mixing of BSW masses with intermediate Cretan waters (that are mainly enriched in the central Aegean Sea at depths greater than 300 m), as well as with AgIW masses (that are enriched in the south-west Aegean Sea and the Myrtoan and Antikythera basins), providing evidence of water masses characterized as Transitional Subsurface Aegean Waters (TSAW).
2. Materials and Methods
2.1. Study Area and Fieldwork
The Aegean Sea constitutes the north-east part of the Mediterranean Sea. It is a system between the coastlines of west Turkey and east and north Greece and bounded to the south by the island of Crete (see
Figure 1). It covers approximately an area of 160·10
3 km
2. The northeast is connected with the Sea of Marmara and the Black Sea through the Dardanelles Strait. It exchanges, at the south, water masses with the central part of the Mediterranean Sea through the Cretan passages, and southwest, it is connected to the Ionian Sea through the Antikythera Strait, the Kythera Strait, and the Strait of Elaphonissos. At the south-east, Aegean Sea is joined with the Levantine Basin (see
Figure 1). The Aegean Sea is an epicontinental sea, occupying a subsided portion of the Alpine chain and microtidal phenomena [
7,
14].
Based on its geomorphological characteristics, the Aegean Sea can be divided into:
- (a)
The North Aegean, an elongated area located between the northern Greek coastline and an almost linear ridge complex located around the parallel of 39° N, and extending from Evia to Skyros and then to Lesvos;
- (b)
The Central Aegean, which includes the Cycladic plateau, is a relatively shallow plateau (average depth <350 m) surrounded by small basins (up to 1000 m deep), including the relatively extensive eastern continental shelf of Asia Minor (the Central Aegean has a transitional character with its terrestrial inflows, which are imported along its eastern part) and;
- (c)
The South Aegean, which is located southwards of the Greek volcanic arc (Cretan Sea); it is enriched with high percentages (>50%) of biogenic material, due to the characteristic small continental origin inflows, although it is a more oligotrophic system than the North Aegean Sea [
7].
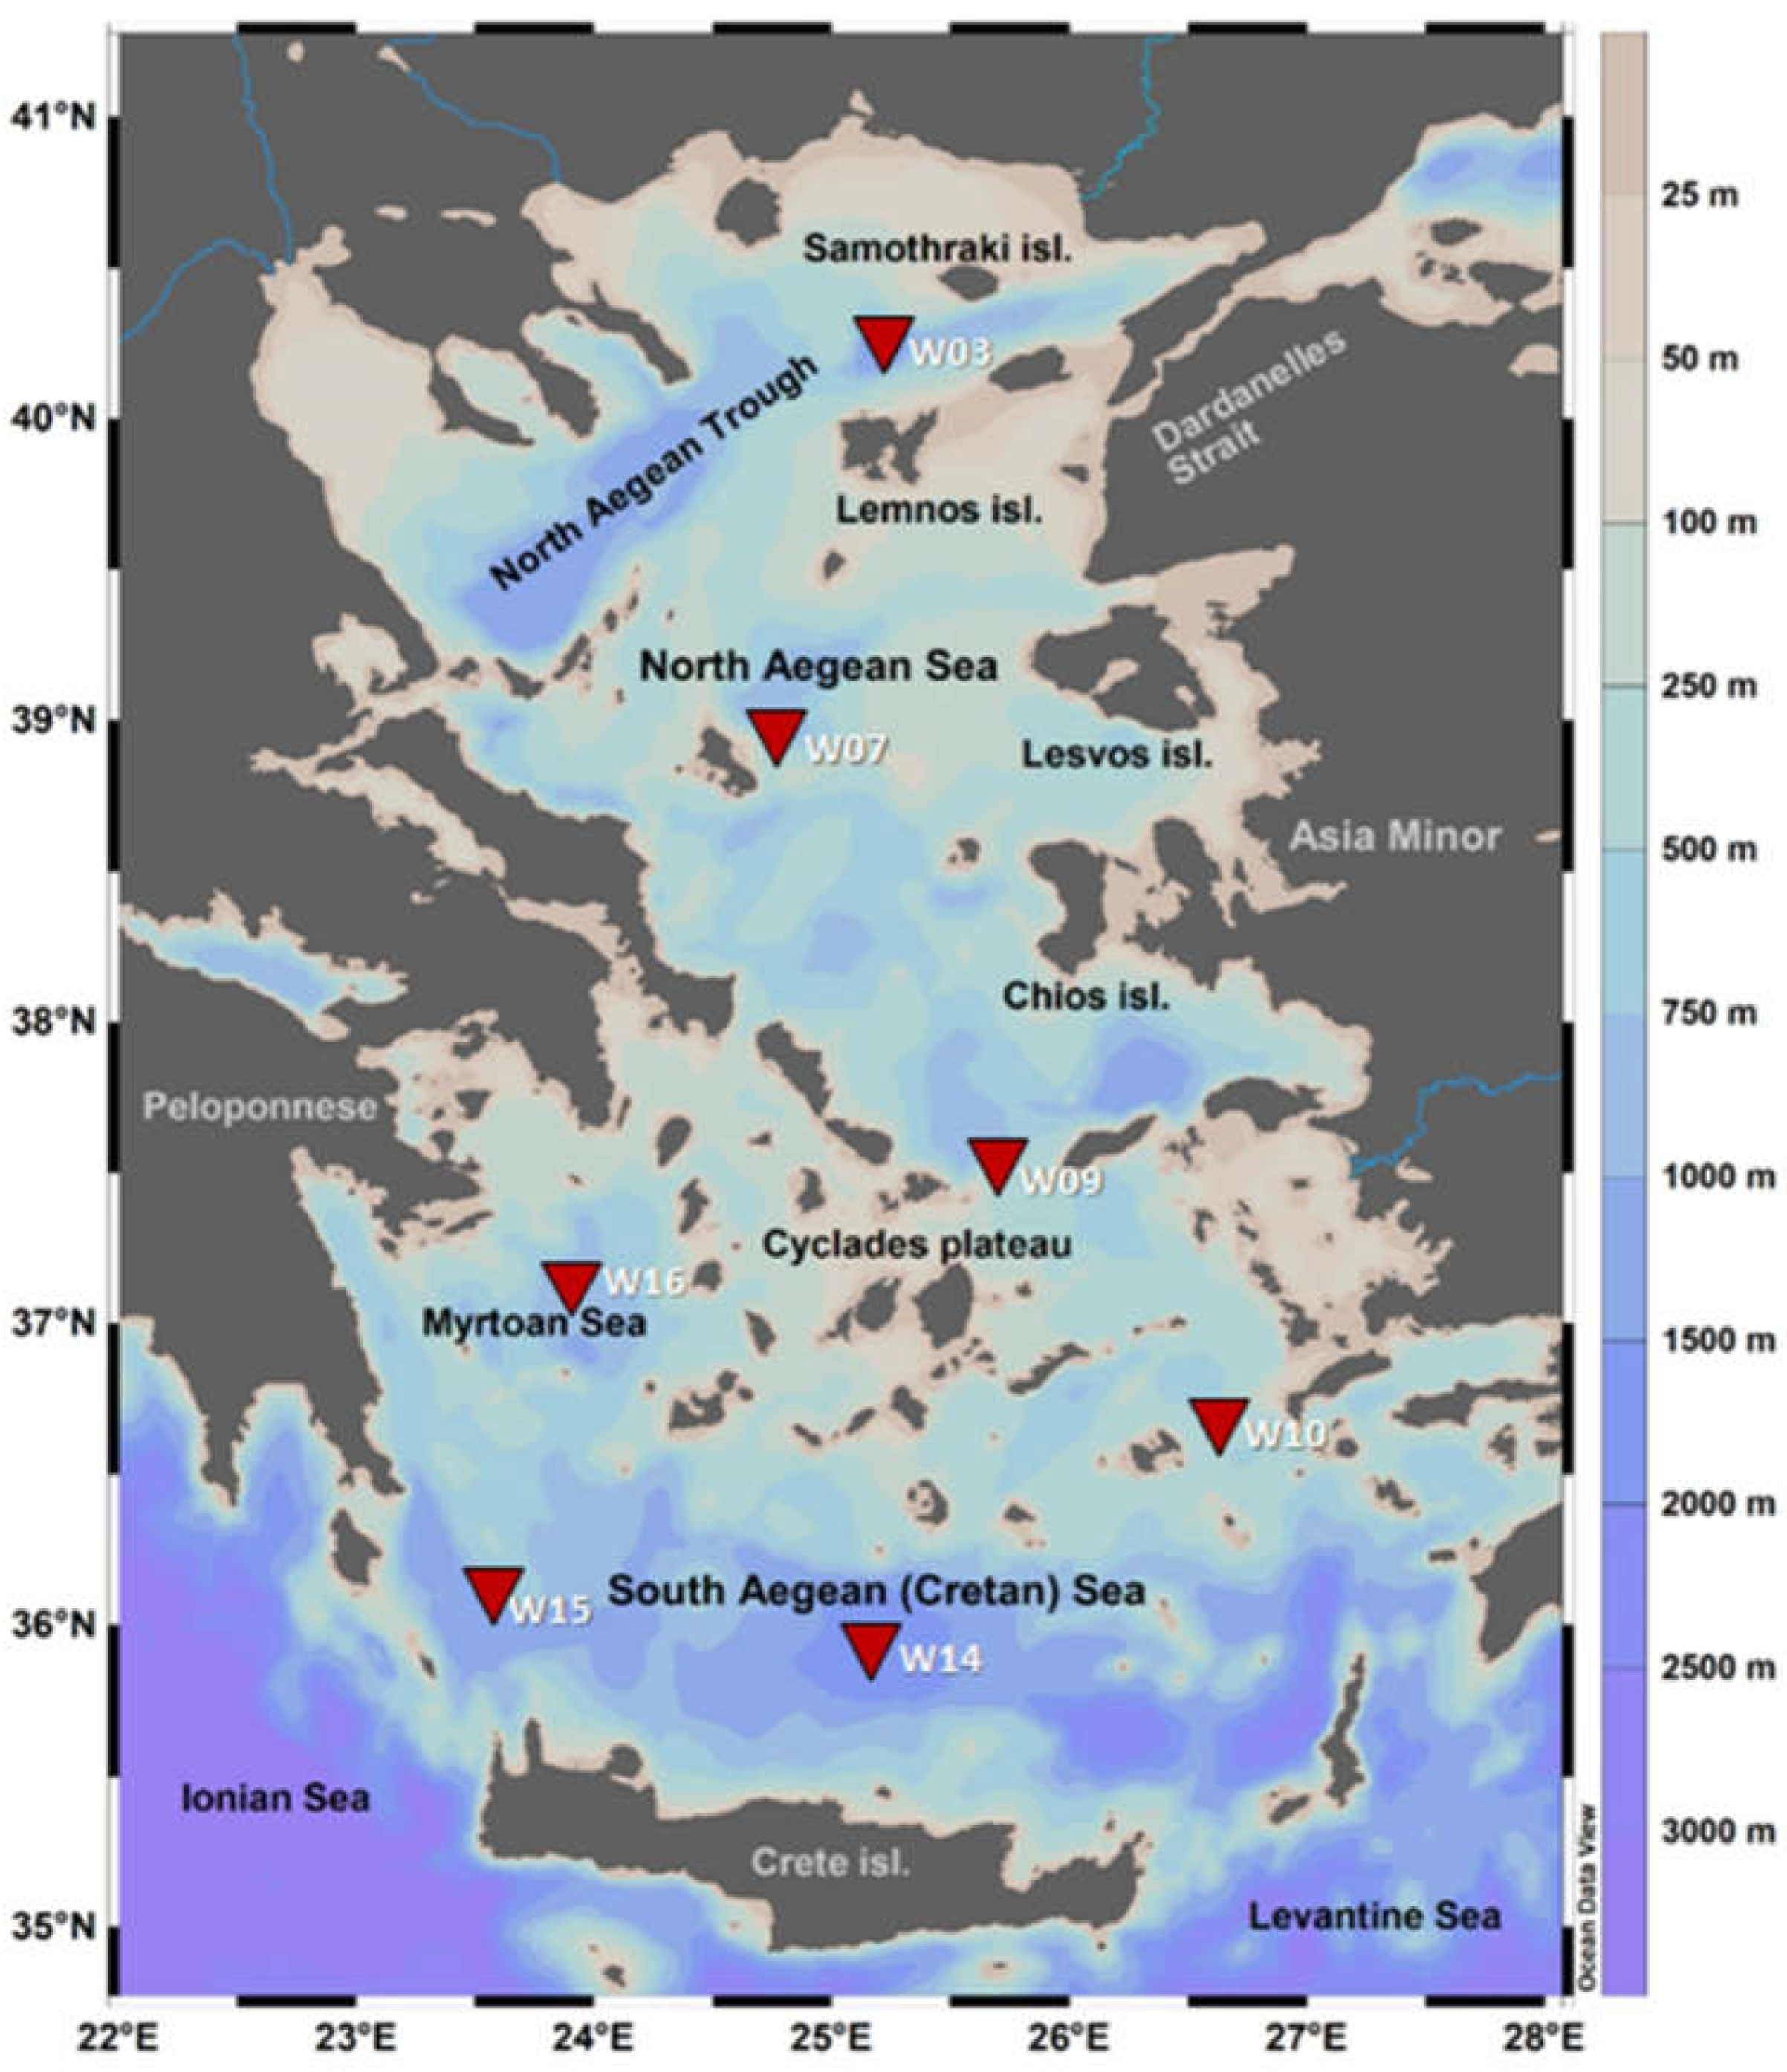
In order to study the current level of 137Cs in the water masses of the Aegean Sea, a sampling cruise was carried out with the oceanographic vessel “AEGEAON” of the Hellenic Centre for Marine Research (HCMR) from 17 to 23 March 2017. Seawater samples from different depths and vertical profiles of typical oceanographic parameters were collected from seven sampling stations along the Aegean Sea. The seawater samples (20–40 l) were collected with a rosette sampling apparatus, equipped with 12 Niskin bottles of 10 l each. Hydrographical data of temperature and salinity were collected by a CTD (SEABIRD 911 PLUS) along with a Dissolve Oxygen (DO) sensor integrated in the rosette apparatus, both routinely calibrated with off-line quality control measurements. The sampling depths were selected during the deployment of the rosette according to the recorded hydrographic profiles. All samples were acidified on board to values close to pH 2 in order to avoid potential absorption of Cs ions to the walls of the containers and, consequently, transported to the laboratory for the pre-concentration of 137Cs.
The selected sampling stations are depicted in
Figure 1, while in
Table 1 are given the coordinates and the maximum depth of each station. In detail, the northernmost station (W03) is located at the basin of Lemnos, which has a steep conical prostration, a maximum depth around 1520 m, and a surface area which is more than 11,000 km
2. The north basin of Skyros (W07 station) has a maximum depth of approximately 1040 m. The overall morphology of this basin forms an equilateral triangle and is shaped by a large slope discontinuity, which separates the continental platform from the continental slope at the depths of 200 to 400 m [
15]. The sample station W09 is one of the shallowest basins studied in this work, reaching almost 550 m and located between the islands Mykonos and Ikaria. The sampling station between the islands of Astypalea and Kos (W10) is also a shallow basin, of just 552 m depth. The Cretan basin (W14 station) is the southernmost part of the Aegean Sea and is bounded to the northern parts by the shallow Cyclades plateau (maximum depth <250 m) and southern by the island of Crete. It covers an area of approximately of 87,000 km
2 with composite bathymetry and depths varying between 100 and 2500 m [
16]. The Cretan basin is the largest and deepest basin of the Aegean Sea with an average depth of about 1000 m and maximum depths recorded in two troughs in its eastern part reaching 2200 and 2500 m, respectively. The Cretan basin communicates with the Eastern Mediterranean Sea through the Straits of the Cretan Arc separating the island of Crete from the Peloponnese and Asia Minor [
12]. As concerns Antikythera’s deep basin (W15 station), the maximum depth at the sampling area was around 1160 m just at the edge of Cyclades’ plateau. The deep basin of the Myrtoan Sea (W16 station) with a depth of approximately to 970–1000 m is bounded by the adjacent Cyclades plateau and the North Cretan Sea.
2.2. Methodology
To determine the 137Cs activity concentration in the collected seawater samples, an appropriate chemical pre-concentration procedure was applied in the laboratory. Initially, the volume of each sample was accurately measured and transferred to a plastic container for constant loose stirring. The sample was then acidified to pH~1 using HCl, in order to prevent 137Cs loss due to absorption in the container’s walls, and 2.2 Bq of 134Cs reference source was also added as a tracer for the determination of the chemical efficiency of the pre-concentration process. At the next step, an acidified (pH~1.5) solution containing 15 g of ammonium phosphate hydrate—(AMP) ((NH4)3PMo12O40×H2O)—was diluted to the sample, let to stir for 4–8 h and consequently rested for 8–12 h. The precipitated material that arose in the bottom of the container was then transfused to a smaller geometry by carefully removing the supernatant water and let again to settle down. The latter process was successively repeated until the container reached the measurement geometry, and was stored in an inductor and dried at room temperature. The final sample was filled with talc powder and sealed, preventing the occurrence of any cracks at the surface of the dried material in order to achieve maximum homogeneity.
The measurements of the final samples were performed via high resolution gamma-ray spectrometry at the Marine Environmental Radioactivity Laboratory of HCMR using a broad-energy HPGe detector with ultra-thin carbon fiber window (Ortec GEM-FX8530P4, 50% rel. efficiency and 1.7 keV FWHM at 1.3 MeV) and at the Nuclear Physics Laboratory of National Technical University of Athens (NTUA) using an aluminum window HPGe detector (Canberra GC5021, 50% rel. efficiency and 2.1 keV FWHM at 1.3 MeV). The samples were measured in a touch-to-window geometry to maximize the measurement efficiency, and detectors were shielded with lead to suppress the background due to environmental radiation and cosmic rays and to reduce the corresponding uncertainty of the measurements. A background measurement (24 h) of a sample filled only with talc powder was taken every week. To specify the chemical efficiency a “blank sample” was produced, where 15 g of AMP in hydrochloride solution and 134Cs reference source of the same activity (2.2 Bq) as the one added in every measured sample were placed and dried directly to the final geometry.
The detection efficiency of both systems (HCMR and NTUA) was experimentally determined using extended reference sources of
152,154Eu,
40K and
134Cs in the same geometry of the measured samples [
11,
12]. Appropriate corrections for true coincidence summing effect of gamma rays simultaneously emitted by the source and attenuation corrections due to differences in the properties (composition and density) between the reference sources and the samples were performed using the dedicated efficiency transfer EFFTRAN software package [
17,
18]. The analytical calculations of the efficiency correction factors for each photopeak as well as the calibration methodology are described in detail elsewhere [
19].
Based on spectral analysis of the measured sample, the activity concentration of
137Cs
A in Bq m
−3 is given by the following equation:
where
eff is the detection efficiency (full-energy photopeak efficiency) for a specific gamma ray,
Aref is the activity concentration of the reference sources (Bq m
−3),
Iγ is the gamma ray intensity (probability of emission),
cps (i.e., counts per second) is the rate of events (detected photons) measured at the photopeak area during the acquisition time of the spectrum,
cheff is the chemical efficiency of the pre-concentration procedure,
fgeo is the geometric correction factor of the efficiency to the measurement geometry,
ftcs is the true coincidence summing correction factor and
V is the volume of the water sample (m
3).
The experimental spectra were analyzed using the SPECTRW software package [
20].
134Cs emits gamma rays at the energies of 569.3, 604.7 and 795.9 keV, while
137Cs is monoenergetic and emits at 661.6 keV. The counting rates for each photopeak at the net spectra (where the background has been subtracted) were calculated by applying asymmetric Gaussian fitting. The partially overlapping photopeaks at 569.3 and 604.7 keV were analyzed via automatic de-convolution taking into account the FWHM of the interfering gamma-rays.
The uncertainty of the measurements depends mainly on the statistical uncertainty of the recorded net counts of the photopeaks given by the equation:
where
δsam and
δbgr are the events recorded by the detector for the seawater and background samples, respectively.
The uncertainty of the chemical efficiency is given by the relation:
where the net counts are derived from the measurement of the energy peaks of
134Cs by subtracting the background, and the blank factor is calculated from the three energy peaks of
134Cs.
The uncertainty of the activity concentration is given by the relation following the propagation law:
where the efficiency term refers to its absolute efficiency uncertainty as calculated by the propagation law of Equation (1), while the relative uncertainty of chemical efficiency is given by Equation (5). The relative uncertainty of the volume is less than 0.5% while the uncertainty of the gamma-ray intensity is negligible. The relative uncertainty of cps is given by Equation (4) divided by the acquisition period.
According to literature [
21] salinity units are calculated as g kg
−1, however only salinity values will be presented in the text and the graphs without units for the sake of brevity.
3. Results
The deeper parts of the basins are, in their majority, laterally isolated basins and the evolution of their deep-water masses is determined solely by the vertical turbulent diffusion during stagnation periods [
10]. As concerned, the Transient Mediterranean Water (TMW) masses, which move from the Adriatic and the west part of the Ionian Sea, are located below 600 m and are distinctively separated from the sea bottom water masses. The Transient Mediterranean Water (TMW) masses exhibit low temperature and appear to be placed under the Transitional Subsurface Aegean Water (TSAW) masses which are mainly identified below 300 m of depth.
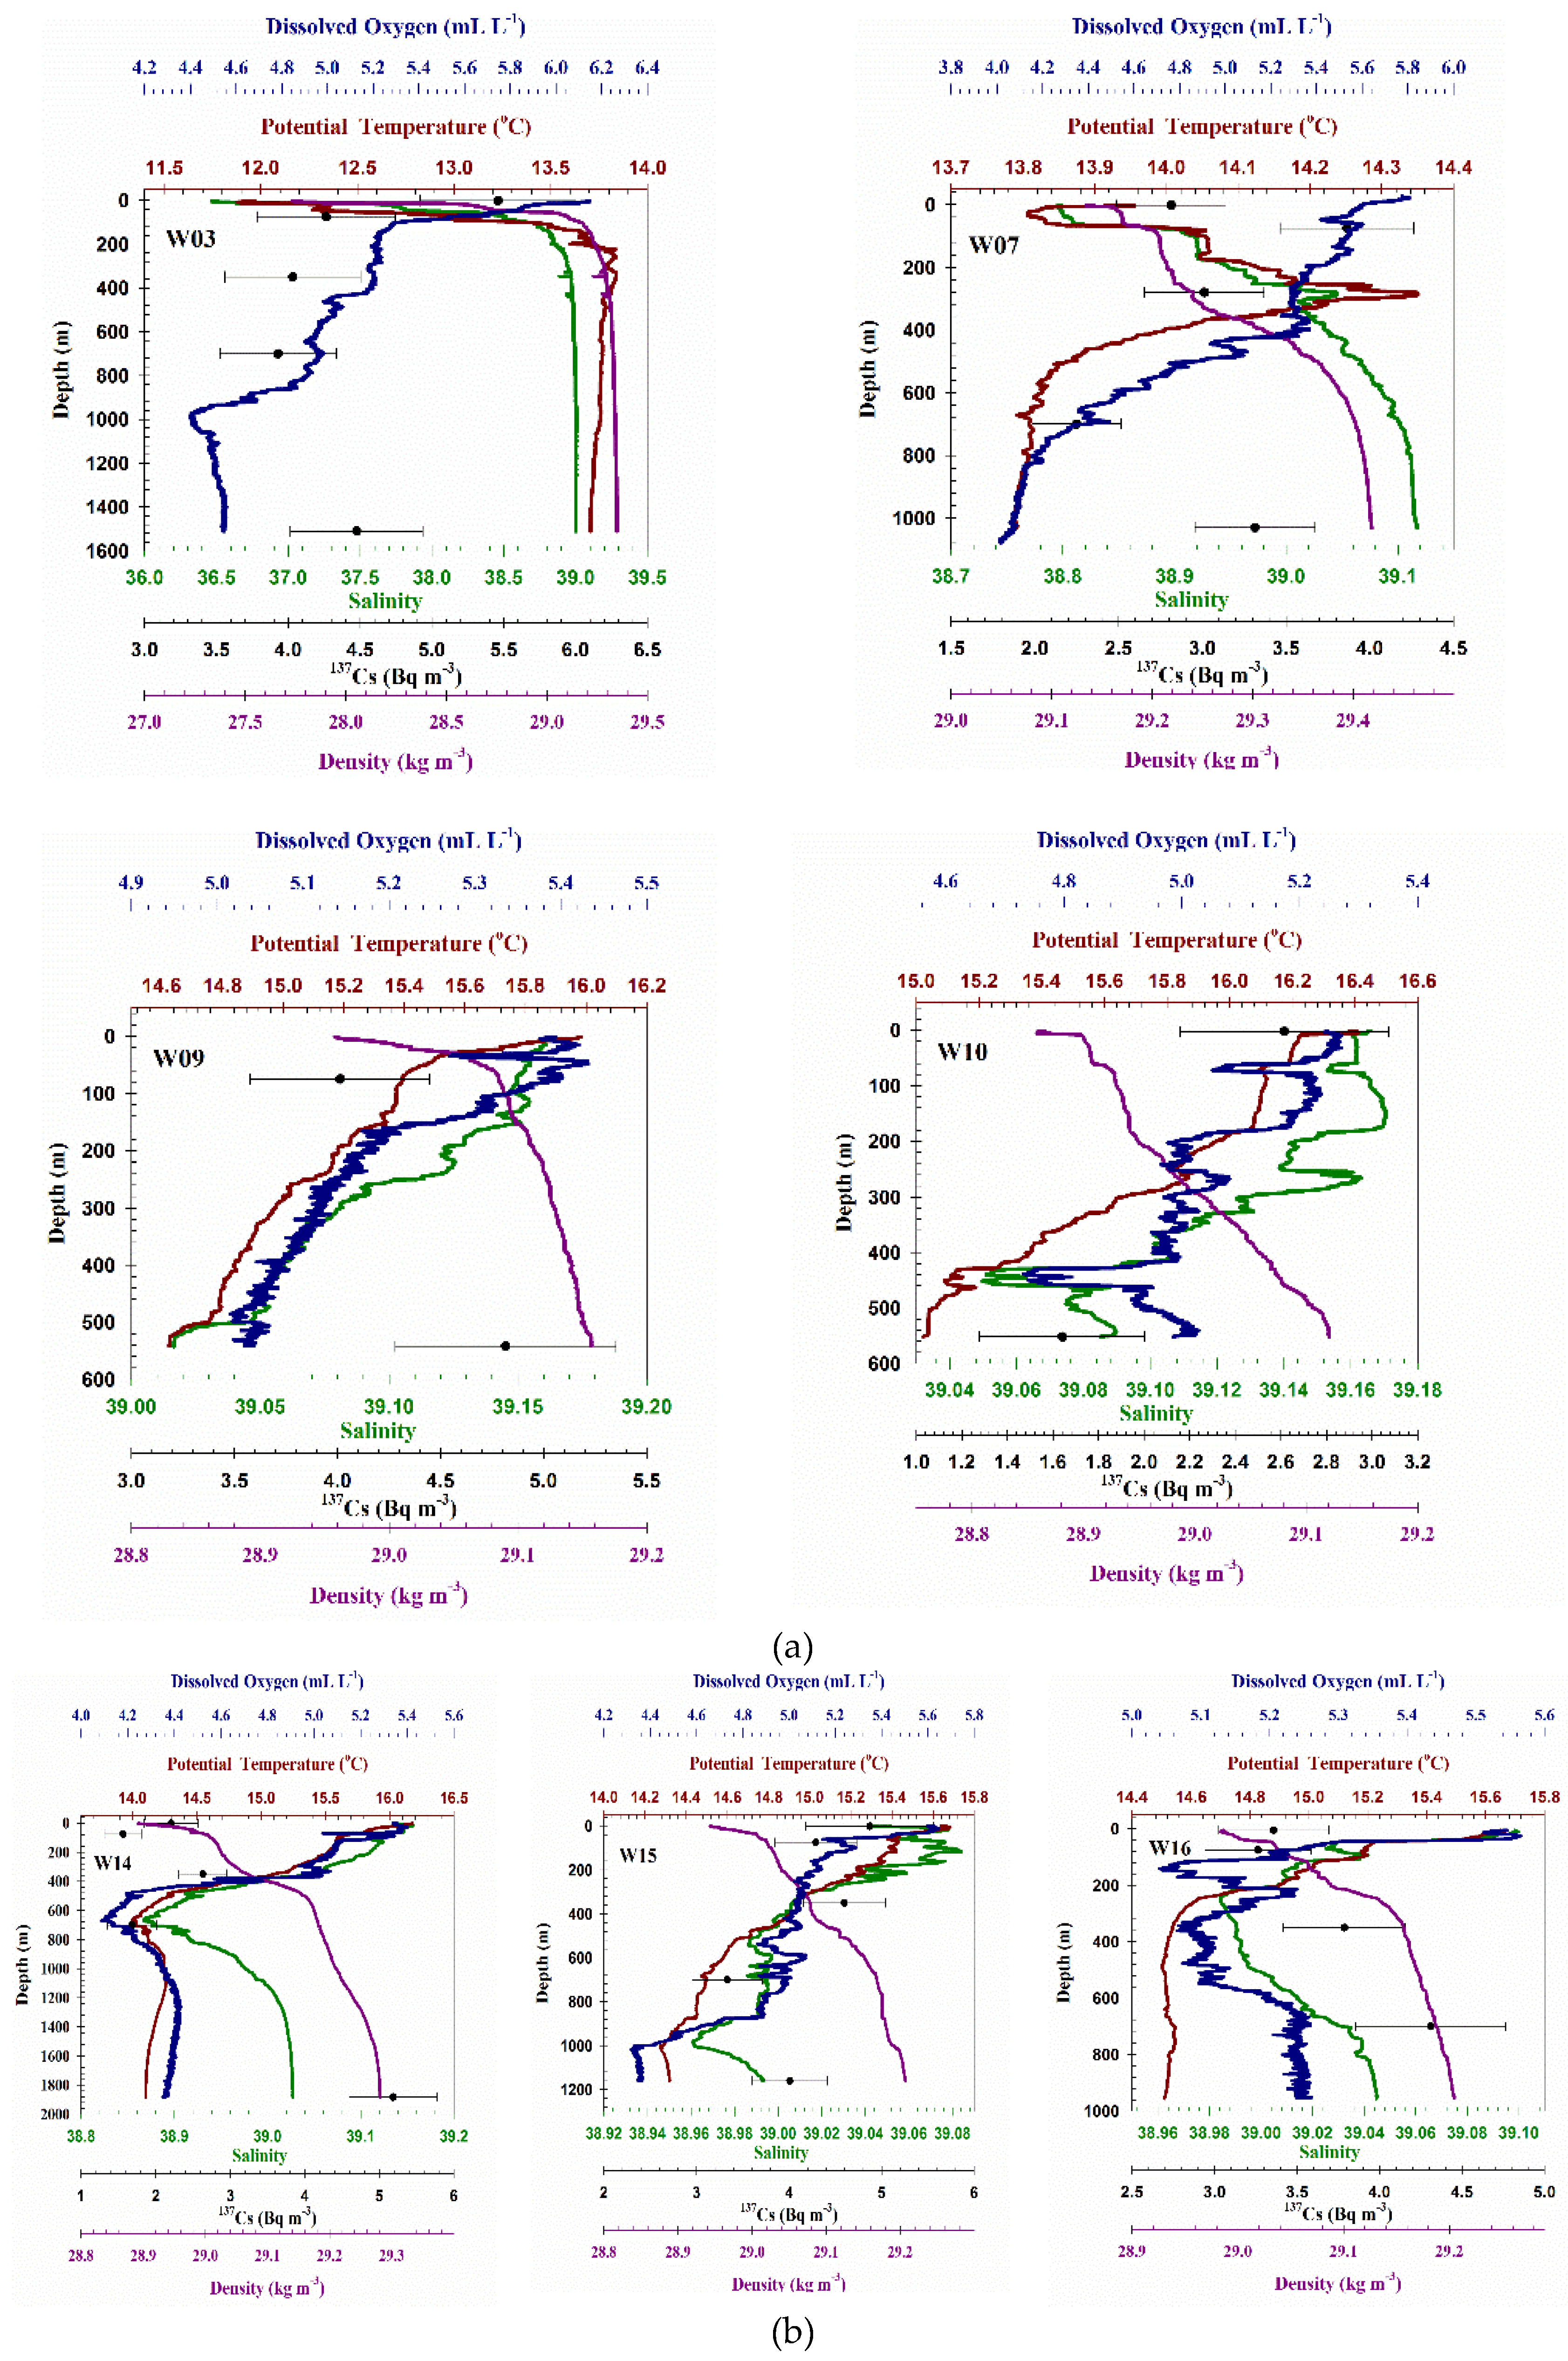
The collected data are represented in vertical (per depth) plots combining oceanographic parameters and
137Cs activity concentration values. A better representation for the understanding of the mixing and circulation of the water masses is provided combining by typical oceanographic parameters with the radio-tracer
137Cs. The results are presented for the different compartments of the Aegean Sea (North Aegean, Central Aegean, and South Aegean) and are discussed separately for each sampling station below.
137Cs activity concentration results are presented in
Table 2 and depicted along with depth in
Figure 2. The highest values of the
137Cs activity concentration were found in the deep water masses of station W14 (Cretan Sea) and at the surface of station W03 (Lemnos), while the lowest values were found in intermediate water masses at 550 and 700 m for stations W10 (between Astypalea and Kos) and W14, respectively.
3.1. Lemnos Basin
Lemnos basin (W03 station) is the northernmost of the sampling stations (
Figure 1), characterized by high concentrations of
137Cs due to its vicinity to the Dardanelles exit and it has been studied continuously for many years [
12]. The results of the Lemnos basin are depicted along with depth in
Figure 2. In the Lemnos basin, the temperature reaches its maximum value of 13.84 °C at 330 m, while the minimum value of 11.88 °C is obtained in surface waters (9 m). The highest value of salinity is observed below 700 m, where it is almost constant at 39.01, while the minimum value (36.46) is also observed in surface waters (3 m), indicating the presence of Black Sea Waters (BSW). The density has a similar profile to salinity, where the maximum (1029 kg m
−3) and the minimum (1028 kg m
−3) values are measured below 700 m and in surface waters (3 m), respectively. Dissolved oxygen minimizes almost linearly from the surface (6.15 mL L
−1) to 1000 m depth, where the minimum value (4.4 mL L
−1) is obtained. Below 1000 m, dissolved oxygen increases to 4.7 mL L
−1, which indicates the direct replenishment from surface waters (high dissolved oxygen values) due to oceanographic phenomena such as past deep formation events. This fact can be also verified via
137Cs activity concentration which exhibits a high value of (4.5 ± 0.5) Βq m
−3 at deep layers (1500 m), indicating that deep layers become a depository of
137Cs due to dense water formation events [
12]. Thus, it is evident that the surface layers which are enriched with
137Cs (5.5 ± 0.5) Βq m
−3 due to BSW inflow reach the deepest layers.
3.2. Skyros Basin
Skyros basin (W07 station) belongs to the North Aegean compartment; it is located close to the Greek mainland (
Figure 1) and it has been also studied repeatedly [
11,
12]. The profiles of oceanographic data and
137Cs activity concentration are depicted in
Figure 2. In this basin, the temperature increases linearly to 290 m depth, where it reaches the maximum value of 14.35 °C. Below 290 m until 1030 m, the temperature decreases intensively and reaches the minimum value of 13.79 °C at 1030 m depth. On the other hand, salinity increases almost linearly from surface to deep layers (1030 m) exhibiting values from 38.79 to 39.12, respectively, while it also shows a local maximum of 39.05 at 290 m. Additionally, density has a similar to salinity profile and increases almost linearly from surface to deep layers with the values ranging from 1029.1 to 1029.5 kg m
−3. The dissolved oxygen profile decreases along with depth, showing a continuous mixing of fresh waters (high dissolved oxygen) with the basin’s waters. The dissolved oxygen values range from 5.3 to 2.1 mL L
−1. The activity concentration of
137Cs is found constant at (3.0 ± 0.4) Βq m
−3 along with depth, while a local maximum of (3.9 ± 0.4) Βq m
−3 and a local minimum of (2.3 ± 0.3) Βq m
−3 are observed at 80 and 700 m, respectively. The oceanographic data combined with
137Cs concentrations indicate a sub-surface mass after the first 100 m representing the southern part of the BSW branch as described in literature [
22].
3.3. Mykonos—Ikaria Basin
The W09 station is located between Mykonos and Ikaria islands, in the central Aegean Sea (
Figure 1). The obtained results of the W09 station are depicted in
Figure 2, in which it is evident that this basin is shallower than the others with a maximum depth of 550 m. Temperature, salinity and dissolved oxygen are decreasing along with depth and their values range from 15.98 to 14.63 °C, from 39.16 to 39.01 and from 5.43 to 5.03 mL L
−1, respectively. Dissolved oxygen also shows a local minimum at 30 m depth. Furthermore, the maximum value of
137Cs activity concentration is found (4.8 ± 0.5) Βq m
−3 at the deep layer (550 m) of the basin and the minimum value is (4.0 ± 0.4) Βq m
−3 at 75 m depth. In this basin, a transitional layer is located under the thermocline depth, while the surface parameters’ values are quite similar with those parameters that characterize Levantine water masses.
3.4. Astypalea—Kos Basin
The W10 station is between Astypalea and Kos islands and it is situated in the eastern part of the Aegean Sea (see
Figure 1). All data of the W10 basin are depicted in
Figure 2. The temperature exhibits the maximum value of 16.41 °C at the surface (4–5 m) and the minimum value 15.02 °C in intermediate water masses (~550 m). The maximum salinity value is 39.17 at depths deeper than 150 m, while the minimum value (39.05) is recorded at 450 m. The density exhibits a maximum value of 1029 kg m
−3 at the sea bottom (~550 m) and a minimum value (1028 kg/m
3) at the surface (4 m). In the surface layer (till 10 m), the maximum value of dissolved oxygen is ~5.27 mL L
−1, while the minimum value is recorded at 440 m (~4.73 mL L
−1). The maximum
137Cs activity concentration (2.6 ± 0.5) Βq m
−3 is obtained at the sea bottom while the minimum value (1.6 ± 0.4) Βq m
−3 is observed at the surface. At this station, surface Levantine waters are mixed with intermediate dense water masses, while the seawater masses in the deep basin are a mixture of North Aegean deep water masses together with Cretan intermediate water masses.
137Cs activity concentrations do not exceed 3.0 Βq m
−3 since there was no presence of BSW masses at this area.
3.5. Myrtoan Basin
The station at the Myrtoan basin (W16 station) is located in the western part of the Aegean Sea (see.
Figure 1) and is a standard monitoring area where previous data exist. The results for the Myrtoan basin are depicted in
Figure 2. At the Myrtoan basin, the temperature and the salinity exhibit maximum values of 15.66 °C and 39.10, respectively (at approximately of 10 m depth). The minimum temperature value is 14.50 °C at 490 m depth and the minimum salinity is 38.98 at 240 m of depth. The density exhibits the maximum value of 1029.21 kg m
−3 at the bottom of the basin and the minimum value is recorded at the first 10 m (1028.98 kg m
−3). Dissolved oxygen values show a maximum of 5.57 mL L
−1 in the first 25 m, and a minimum value of 1.68 mL L
−1 at 960 m. As concerned,
137Cs activity concentration of the maximum value of (4.3 ± 0.5) Βq m
−3 is observed at the depth of 700 m, and a minimum value of (3.3 ± 0.3) Βq m
−3 at 75 m.
3.6. Antikythera Basin
The station W15 is in the Antikythera strait and it is situated in the south-west part of the Aegean Sea (see
Figure 1). The data of the Antikythera basin is depicted in
Figure 2. In this basin, the temperature exhibits the maximum value of 15.68 °C at the surface seawater layer, while the minimum value 14.27 °C is obtained at 1000 m. Salinity exhibits maximum values of 39.08 at 120 m and minimum values of 38.96 at depth below 980 m. The maximum density value is 1029 kg m
−3 recorded at the sea bottom of the basin, while the minimum values of 1028 kg m
−3 at the surface water layer. The recorded values of dissolved oxygen exhibit a maximum value of 5.64 mL L
−1 at 10 m, and a minimum value of 4.32 mL L
−1 at 1020 m. The
137Cs activity concentration exhibits maximum value (4.9 ± 0.7) Βq m
−3 at 2 m depth, while the minimum concentration (3.3 ± 0.4) Βq m
−3 is measured at 700 m. The activity concentration of
137Cs exhibits values of ~4 Βq m
−3 in the deep part of the basin (below 1050 m).
3.7. North Cretan Basin
The station W14 in the North Cretan Sea is located in the south part of the Aegean Sea (see
Figure 1), and it is considered to operate as a monitoring station since it follows the rules of marine strategies at a national and European level (e.g., the EU Directive-General MSFD). The results of the North Cretan basin are depicted in
Figure 2. In the W14 station, the temperature exhibits maximum values of 16.18 °C at the surface of the water column and minimum values of 13.99 °C at 670 m depth. The seawater layer with the maximum values of salinity (39.16) is recorder at 16 m, while the minimum values of salinity (38.87) are found around 670 m of depth. The maximum density is observed in the layer below 1760 m with a value of about 1029 kg m
−3, while the minimum density (1028 kg m
−3) characterizes the layer of the first 6 m of the surface water. Dissolved oxygen values at 30 m exhibit a maximum value of 5.39 mL L
−1, while at 670 m the value is 4.09 mL L
−1 (which is the lowest value of dissolved oxygen). As concerned, the activity concentration of
137Cs, the maximum value is observed in the deep water masses of the sea bottom (5.2 ± 0.6) Βq m
−3 and the minimum activity concentration (1.6 ± 0.2) Βq m
−3 is obtained at 75 m. In the layer 0–700 m, the low
137Cs activity concentration values indicate low intense mixing process with Black Sea Water masses. Moreover, the deep water masses (below 1300 m) remain well isolated from the surface and intermediate layers and are unaffected by the mixing procedures. However, the deep layer exhibits enhanced
137Cs activity concentration values as observed in previous measurements [
12] due to the vertical migration and dispersion processes of cesium along with the depth.
4. Discussion
The W10 station (between Astypalea and Kos) exhibits the minimum concentrations of 137Cs, which varied between 1.2 and 3.0 Bq m−3 due to the Levantine Waters’ presence, while the waters close to the seabed are enriched in 137Cs from their mixing with the Intermediate Cretan waters (CIW). The basin with the highest concentration of 137Cs (3.5–6.2 Bq m−3) was observed at the northernmost of the sampling station (W03), where the water masses interact with the Dardanelles Strait’s masses and are constantly enriched with 137Cs via the BSW outflow. At Lemnos basin, the 137Cs activity concentration at the surface layer is higher compared to the intermediate layer since the northern branching of the BSW masses dominates. At the deepest part, dense waters with high 137Cs values (6.2 Bq m−3) were also measured. Furthermore, the northern basin of Skyros (W07 station) exhibits activity concentration of 137Cs between 2.0–4.5 Bq m−3, and in the deep part of the basin, water masses from North Aegean are advected to its dense waters’ formation. In the central Aegean Sea (between Mykonos and Northern Ikaria- W09), the activity concentration of 137Cs varied from 3.5–5.5 Bq m−3. The intermediate Levantine waters (LIW) are identified between 50 and 100 m and are slightly affected by BSW masses (as identified by the low values of 137Cs activity concentration). In the deep part of the station W09, water masses exhibit relatively higher values of 137Cs due to the passage of the BSW in the central Aegean Sea and to its vertical advection–dispersion to the deep part of the basin. In the North Cretan Sea (W14 station), the activity concentration of 137Cs varied from 1.5–5.5 Βq m−3.The Cretan Surface Waters (CSW) dominate the first 100 m; below 100 m the Cretan Intermediate Waters (CIW) were identified, while at about 700 m, a mixture of Transitional Mediterranean Waters (TMW) with Levantine Waters was observed. Below 1400 m till the bottom of the basin very dense water masses are observed, combined with enhanced density and 137Cs activity concentration values. In general, pycnoclines seem to continue incessantly to great depths with several pycnostads (very homogenous layers) along the vertical path depending on the basin. The recorded data at Myrtoan and Antikythera basins (W15 and W16 stations) provide information of recent water masses related to sub-surface transitional waters originated from the North Aegean. In the Cretan basin (W14 station), the 137Cs activity concentration is low (in the depths from 700 to 800m) since the waters are enriched with TMW masses. These observations combined with the low values of dissolved oxygen demonstrate that TMW have a long-term subsurface presence in the specific basin originated from the West Mediterranean Sea without enrichment with recent water masses.
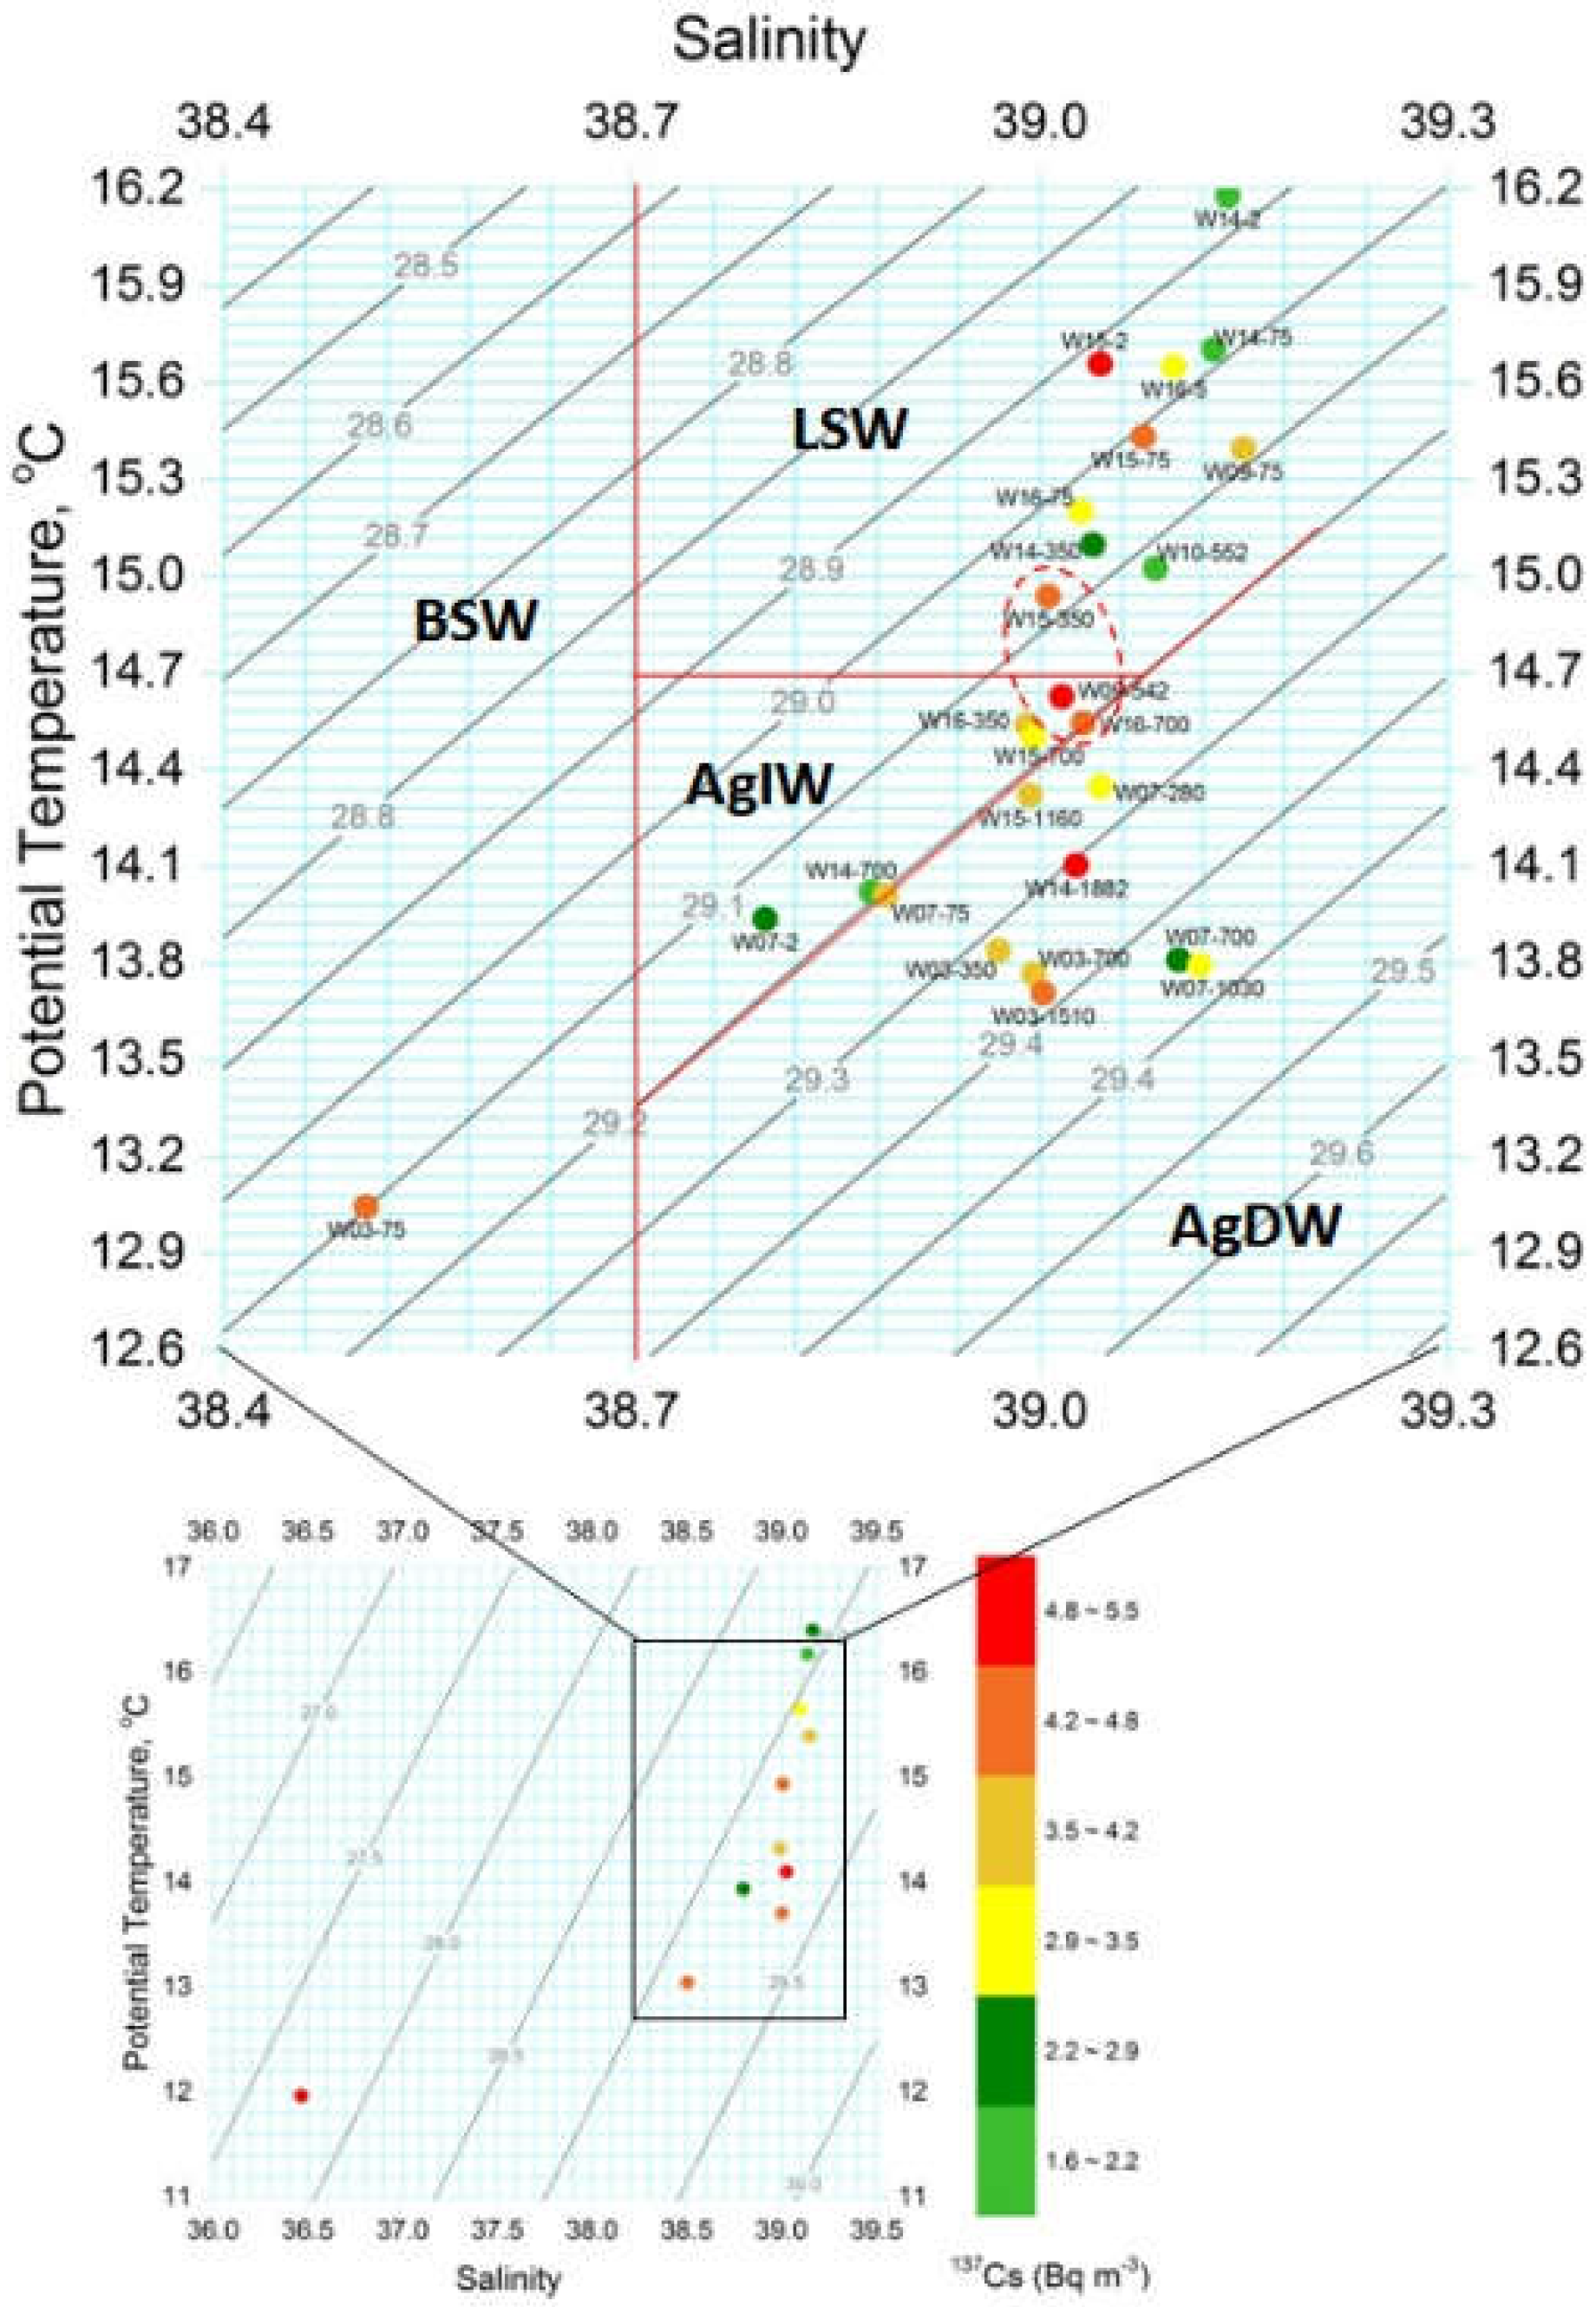
4.1. 137Cs Activity Concentration Combined with T and S
The data are represented and classified in
Figure 3. In
Figure 3, the main seawater masses of the Aegean Sea are separated by isosurfaces as described in literature [
23]. The combination of density, salinity and temperature values identify the BSW masses at the left part of the figure (due to the low salinity values), the LSW at the upper right part (due to the low salinity and high temperatures) and the AgDW at the lower right part of the figure (due to the high salinity and low temperature values). The AgIW masses are defined at temperatures around 14.7 °C, at the isopycnal of 1029.3 g cm
−3 and reaching salinity values up to 39.08. The
137Cs activity concentration values are given in classification with different colors from green to red (see
Figure 3) according to the
137Cs activity concentration.
The measured values of
137Cs activity concentration with red color are related to BSW masses due to the maximum concentration values, while the green and some yellow are due to LSW/LIW and TMW masses (due to the low values). It is clearly seen that the BSW part includes one point with red color due to high concentration values and this is located in the Lemnos basin. Other red points are found in the Central and South Aegean Sea, W09-542, W15-550 and W16-700 (as indicated at
Figure 3) exhibiting relatively higher values of
137Cs activity concentration. Cesium is mainly enriched in the BSW masses and any combination of enriched water masses with relatively high
137Cs values demonstrates the potential mixing processes of the water masses. Such mixture processes are demonstrated with the water masses called Transitional Subsurface Aegean Waters, where the AgIW are mixed with BSW (as indicated form the
137Cs values as a key radiotracer of BSW masses). Furthermore, red points appear also in the AgDW masses since deep parts of the basins are depositories of
137Cs due to the vertical advection of
137Cs along with depth as well as due to the deep formation events [
11,
12].
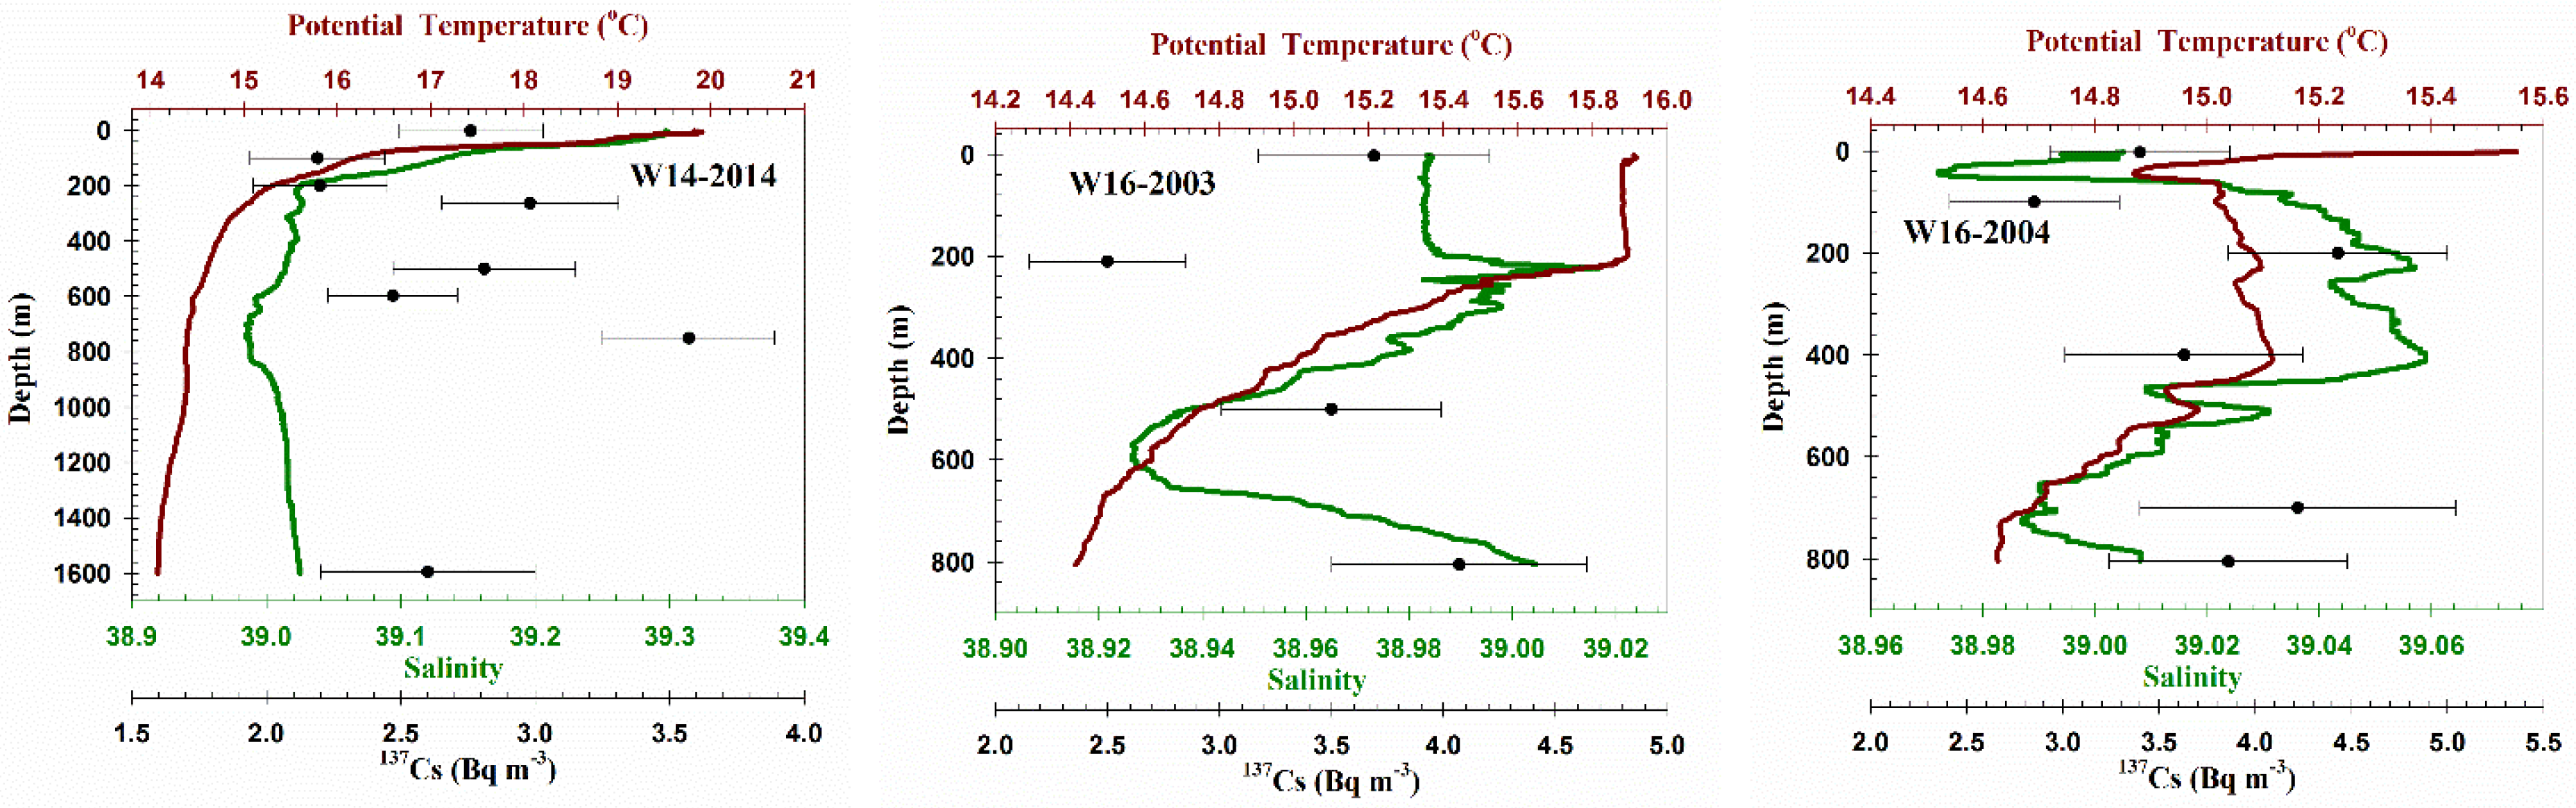
4.2. Transitional Subsurface Aegean Water Masses—Comparison with Previous Data
The Transitional water masses at the North Aegean Sea are advected to the Central Aegean Sea and then due to formation and mixing processes the oceanographic properties of the water column are changed affecting the dynamics of the sub-surface water masses in the Central Aegean Sea. These water masses are called Transitional Subsurface Aegean Water Masses. In this section, a comparison study is presented using previous published data in the areas where the Transitional Subsurface Aegean Water masses were observed (Myrtoan and North Cretan seas). The data of the vertical profiles in the Myrtoan deep basin sampled in 2003 and 2004 (station W16) exhibit smooth variations in salinity and temperature along with the depth. Moreover, in 2003 at 200 m of depth, the values of
137Cs activity concentration are lower (~2.5 Bq m
−3) due to the presence of LSW/LIW masses (see
Figure 4). In 2004, the activity concentration of
137Cs varied from 3.1 to 4.1 Bq m
−3 (the values are not normalized in time), indicating also a smooth trend along with depth taking into account the uncertainty values (see
Figure 4). This could be explained either by the assumption that a more intense production of dense water pushed the upper layers, or that the water masses observed one year later (in 2004) at 200 m were moved downwards under the pressure of an intermediate layer. These water masses probably originated from the northern fragment of BSW passage, due to the fact that the hydrographical properties of those water masses were similar to those found in Lemnos basin.
Furthermore, LSW/LIW masses have a critical role in the shaping and the spreading of TSAW masses. In 2004 in the Myrtoan Sea, high salinity seawater masses invaded the water layer between 50–450 m, with lower values of temperature compared to the previous period of sampling (2003). The salinity has increased compared to 2003 along with depth. It is pointed out that the Myrtoan basin became denser over the years, since it maintains the densest of its masses after 2004, despite fluctuations in the basin’s stratification. The maximum values of
137Cs activity concentration were found, in 2004, on two critical depths, at 200 and 700 m. Furthermore, below 550 m, the relative stability of the salinity, recorded in 2004 in contrast to its intense alteration in 2003, demonstrates the aforementioned process. This type of water mass identified as Transitional Subsurface Aegean Water masses (TSAW) are mainly located in the southwest Aegean Sea, i.e., the Myrtoan and Antikythera seas [
12].
In the North Cretan basin in 2014 (see
Figure 4), the
137Cs activity concentration varies from 2.2. to 3.5 Bq m
−3. The maximum
137Cs activity concentrations were around 3.6 Bq m
−3 and observed at a depth of ~750 m (approximately at 650–850 m depth), exhibiting a salinity value of 39.0 and dynamic temperature value of 14.5 °C [
12]. At this depth (~750 m), the maximum value of
137Cs may be attributed to the mixing process with water masses originated from the Black Sea. However, the salinity and temperature values exhibit typical values of the water column of the basin for the specific season. The water masses enriched with the maximum concentration of
137Cs may be attributed to a mixing process between BSW masses and intermediate Cretan waters (which might be in a mixture phase with LIW and TMW masses).
In this work, the values of 137Cs activity concentration in the aforementioned basin varied from 3.2 to 4.3 Bq m−3. In this dataset (2017), TSAW masses are identified by the activity concentration of 137Cs (which is higher compared to those of LSW/LIW and CIW masses), since they are enriched with BSW. In the Myrtoan basin (W16 station), the activity concentrations of 137Cs (in 2017) varied from 3.0 to 4.8 Βq m−3. Levantine seawater masses are mixed in the upper sea layer with the waters of the Black Sea up to 100m, while below 350 m (and up to 750 m), the TSAW masses are predominant. By comparing the data of 2003, the results prove that the TSAW masses of 2003 are identified at greater depths compared to the depth at which TSAW masses are observed in this work (2017). The interpretation of these mixing processes needs to be further examined, in order to see to what extent and under which conditions and pressures the mixing processes take place on a temporal basis. It is obvious that Black Sea Waters are mixed with Levantine Waters and probably, at some point, with TMW masses forming the TSAW masses.
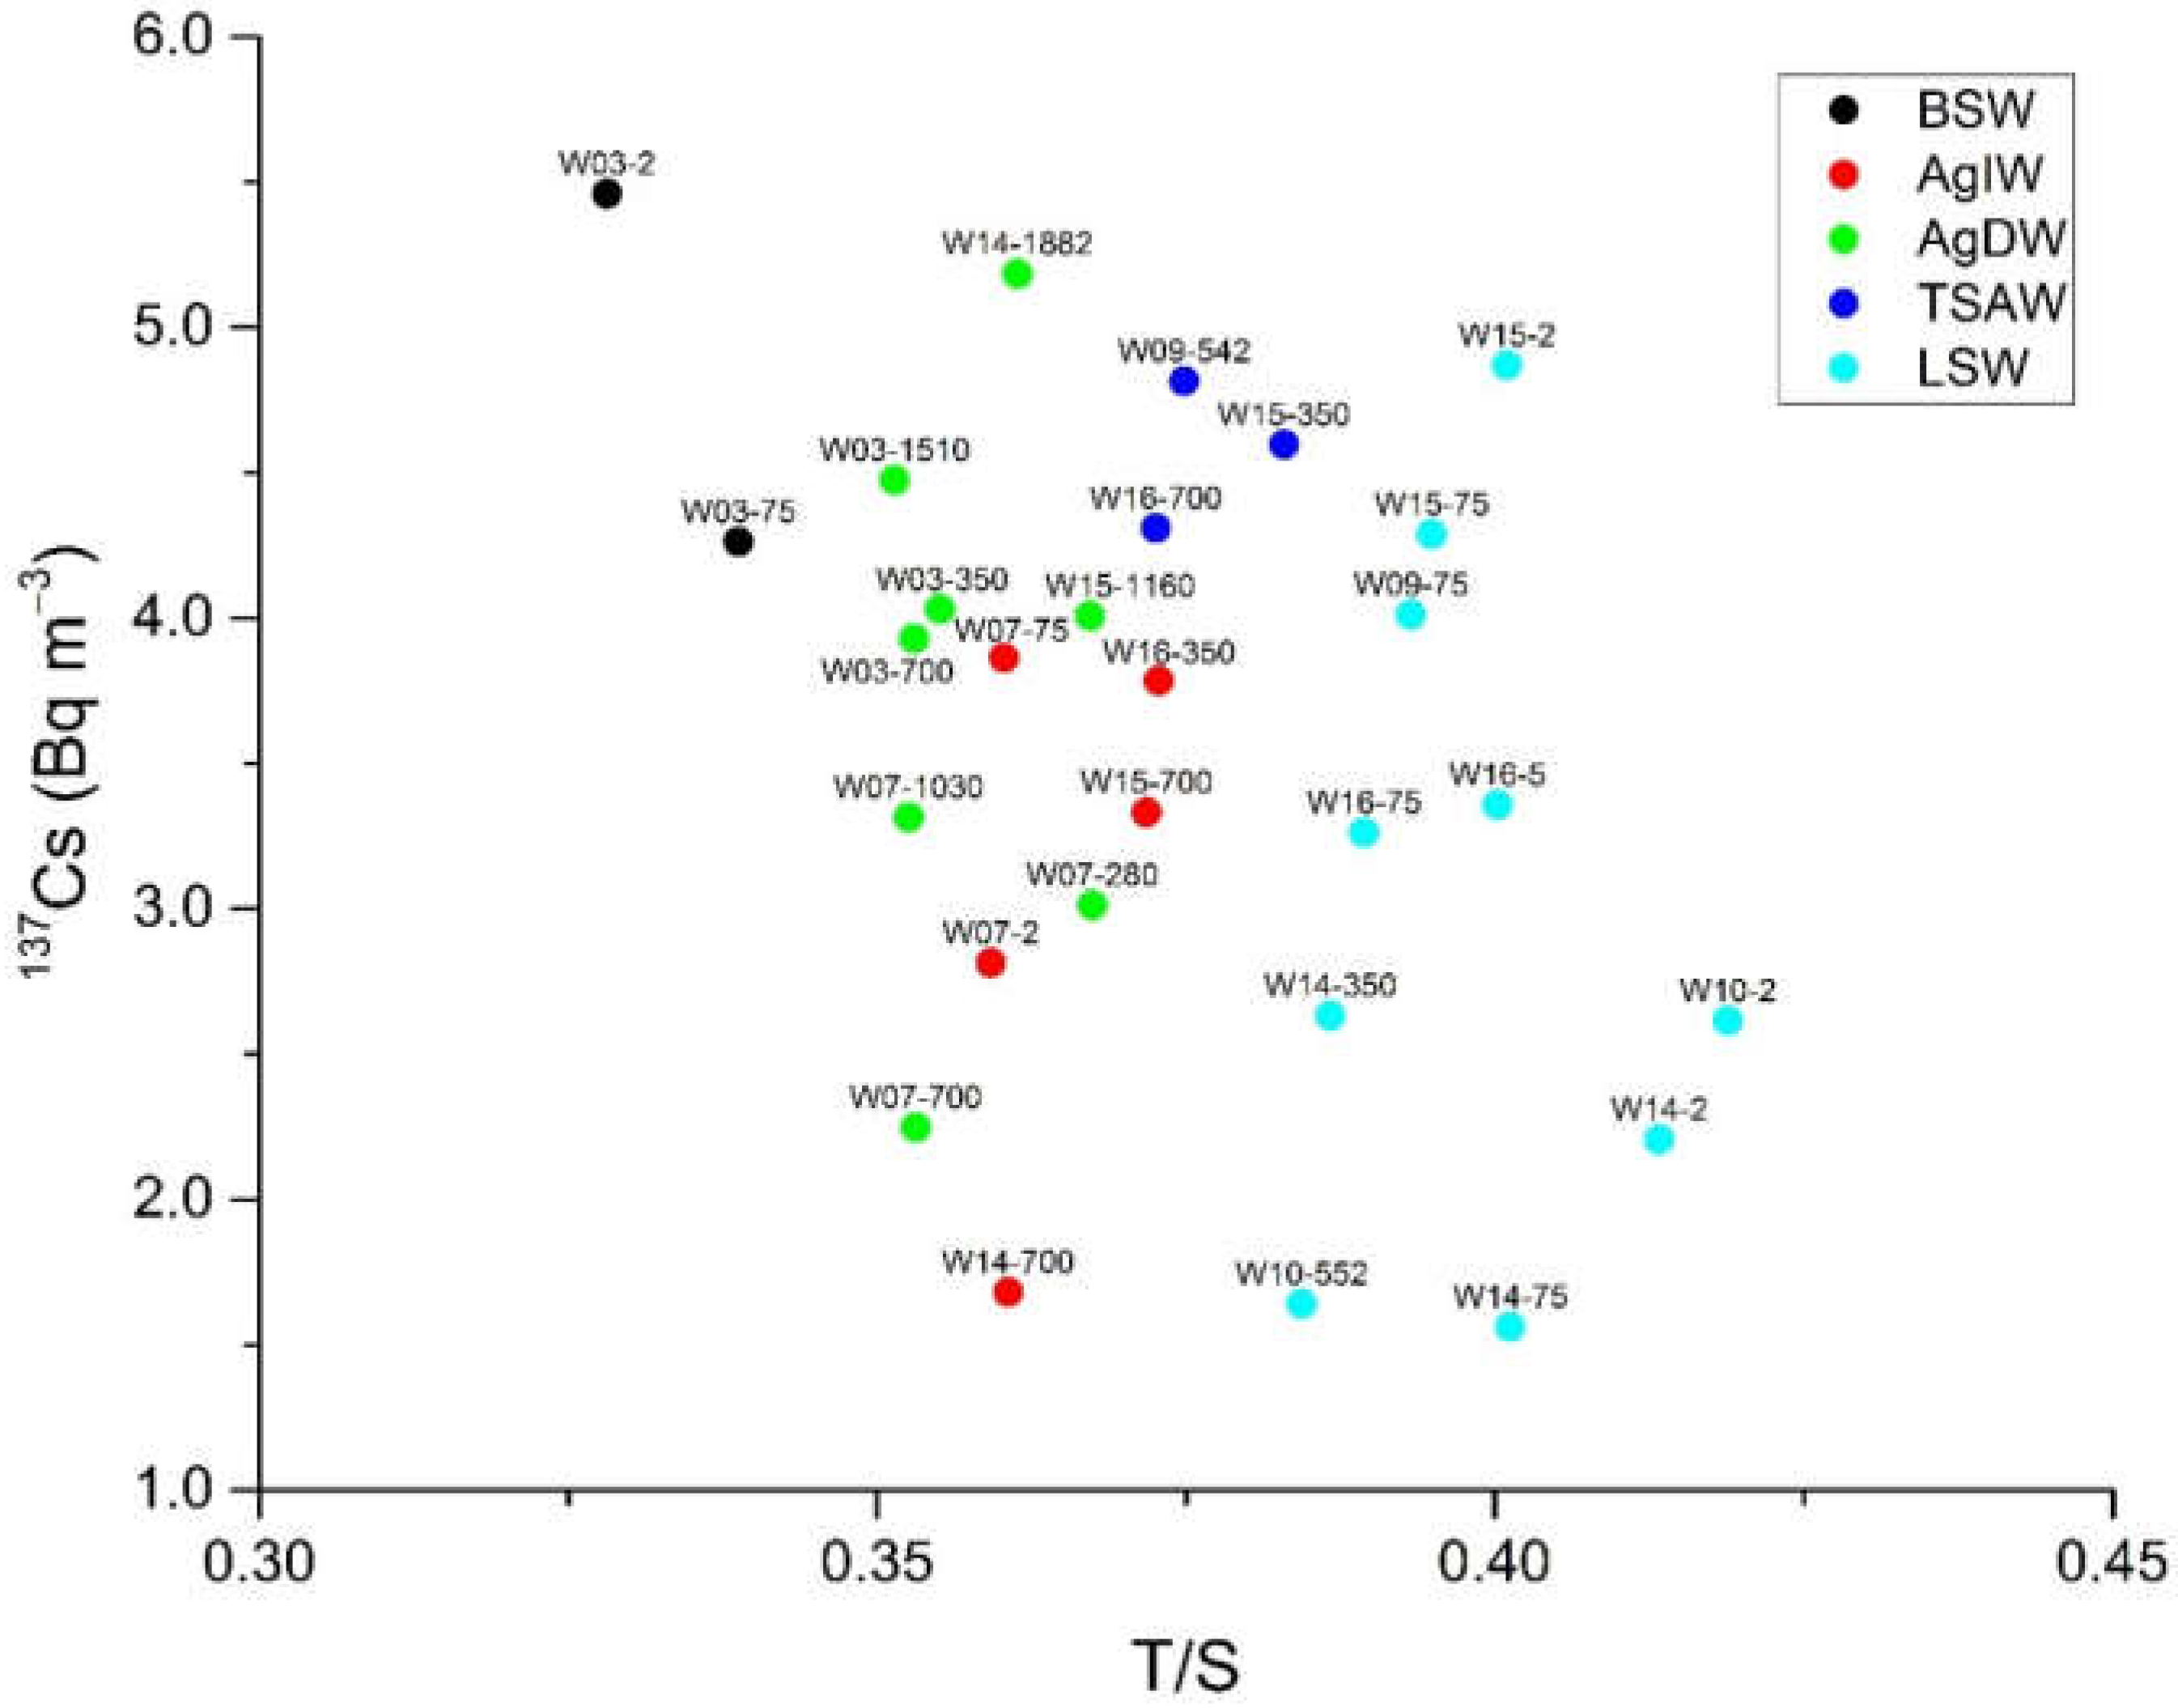
4.3. 137Cs Activity Concentration versus T/S Ratio
The results of
137Cs activity concentration are depicted along with Τ/S ratio values in
Figure 5 for the studied stations in the Aegean Sea of this work (2017) as well as for previous periods in the Myrtoan Sea (2003 and 2004). It is clearly seen that in all studied stations (see
Figure 5), the BSW masses are clearly identified (in the upper part of the graph) since they are enriched with enhanced values of
137Cs. The combination of the aforementioned parameters to identify the other water masses in the Aegean Sea is possible by looking at the relevant patterns, created by the points that characterize the different water masses and their uncertainty of
137Cs measurements. For instance, the LSW masses are also well separated in
Figure 5 since the water masses are characterized by high T/S ratios and low
137Cs activity concentration values (due to the LIW masses). The AgDW and AgIW are mainly characterized by the T/S ratios (see
Figure 5), while the TSAW waters lie in the same T/S ratio with enhanced
137Cs activity concentration. Τhe marine areas where mixing processes of different water masses take place are identified for specific water masses (e.g., BSW, LIW, TMW, AgDW), even when they overlap or get a significant interval of measured data.
Comparing with other marine areas, the
137Cs activity concentration in seawater in the Gulf exhibits levels between 1.3–1.4 Bq m
−3. These levels are lower compared to the Aegean Sea since the Chernobyl accident did not affect this marine compartment [
24]. These low levels are mainly attributed to the nuclear tests. Recent measurements of
137Cs activity concentration in the Black Sea exhibit values in the range 5.7–8.8 Bq m
−3 and amounted on average to 6.9 ± 0.2 Bq m
−3, while the vertical distribution of
137Cs was found to be uniform [
25]. As concerns the previous status of the radioactivity level in seawater in the Aegean Sea, the highest activity concentration was found in the North Aegean near the Dardanelles exit, with a mean value of 6.6 ± 0.8 Bq m
−3, while in the rest of the areas, the activity concentration exhibits similar values with an average value of 3.2 ± 0.3 Bq m
−3 [
26].
5. Conclusions and Perspectives
In this work, elevated
137Cs activity concentrations were found in two different stations of the Aegean Sea. The first originated from the Black Sea’s outflow where the water of the Dardanelles interacts with the Aegean water masses and the second from the deep-water layer of the central-west Aegean Sea characterized here as Transitional Subsurface Aegean Waters (TSAW). The Black Sea Waters (BSW) are enriched with highest values of
137Cs activity concentrations due to their origination from the Marmara Sea (that is affected highly by the Black Sea and the residues of the Chernobyl accident). The BSW flows due to density gradients and follows seasonal temperature variations with similar characteristics and properties. The water masses from the outflow of the Dardanelles Straits were also observed at the surface water layer at the Lemnos and Skyros basins. Concerning the TSAW mass, recent observations of its properties and characteristics provide an increased pattern of density. The denser layers drive both the spread of TSAW masses along with depth and increase the possibility to have a deep formation event. These observations are validated from previous works [
12,
27] that show an increase in the density trend in these areas. The gradual increase in density of the seawater masses that fill the Myrtoan and North Cretan basins in combination with the dilution of the masses in the Lemnos, Skyros and Chios basins, demonstrates a change in the hydrodynamic balance of the study area. A pattern that produces denser masses in the southwest of the Aegean Sea and creates low dense waters masses in the north-central-east part of the Aegean Sea can be assumed as TSAW.
In general, in all basins the profiles of temperature and density during vertical stratification (with the exception of some notable points) maintain normal and expected variations considering the area where they are located (i.e., for the subtropical zones and the Mediterranean Sea). It is important to point out that the analysis of 137Cs gave an additional tracer for the identification of main seawater masses in the Aegean Sea. Cesium–temperature–salinity parameters could be combined for oceanographic observations and related analysis using data from other areas affected by 137Cs fallout.
The activity concentration of 137Cs in the Aegean Sea in this work is diminished due to the period passed since the Chernobyl accident. However, the Black Sea water masses are enriched with a higher activity concentration of 137Cs compared to the Levantine water masses. It would be very useful in future studies to include other tracers for understanding the mixing and formation processes that take place in the water column and studying the gradients of key parameters caused by climate change or other phenomena.
The principal findings of this work are:
Although the Aegean Sea is monitored at a national level in terms of radioactivity level inputs, it was the first time that data of 137Cs from all over the Aegean Sea were provided using the same research cruise. The 137Cs activity concentrations in the deep basin of the Aegean Sea are diminished since the input from the atmosphere as well from the Dardanelles strait is drastically reduced.
Two intense 137Cs signals were found in different stations of the Aegean Sea, one originating from the Black Sea’s outflow where the water of Dardanelles interacts with the Aegean water masses and the second from the deep-water layer of the central-west Aegean Sea and are related with the so-called Transitional Subsurface Aegean Water (TSAW).
The analysis of 137Cs activity concentration in combination with the T-S data in the water column gave a satisfactory picture of the identification of main seawater masses in the Aegean Sea.
In the future, the identification of water masses could be performed by attaching an underwater in situ gamma-ray spectrometer [
28,
29,
30] in the rosette to acquire vertical profiles of gamma-ray spectra. The analysis of these spectra using automated [
31] and full spectrum analysis methods [
32], in combination with salinity and temperature profiles, could provide rapidly the mixing process of water masses of the Aegean Sea in a cost-effective manner. Furthermore, in order to understand the physical-chemical dynamics in the studied marine environment, a comprehensive correlation of new tracers (e.g., tritium, carbon, stable isotopes, nitrate and phosphate, dissolved silica, CO
2) could provide detailed information on the mobility of the water masses as well as on the mixing processes in various marine ecosystems. The understanding of the TSAW’s formation can be associated with the vertical dense water mass movements. It is suggested to perform other tracer studies in a more complementary manner to study these fundamental interactions of water masses and their mixing processes at a global level and thus to better understand water circulation and climatic changes.


 ,
, 


